WHO WE ARE WHO WE ARE
|
|
|
- Coleen May
- 5 years ago
- Views:
Transcription
1
2 01 WHO WE ARE


3 01 WHO WE ARE WHO WE ARE We are a specialist division of QIC Global Real Estate, representing 14 Australian shopping destinations. We provide brands with a number of ways to reach, engage and converse with people through connected experiences within and beyond our high profile destinations, digital assets, social and print channels. 4
4 01 WHO WE ARE QIC GRE S AUSTRALIAN PORTFOLIO WA 14. CLAREMONT QUARTER QLD 01. ROBINA TOWN CENTRE 02. HYPERDOME 03. NOOSA CIVIC 04. GRAND CENTRAL 05. HINKLER CENTRAL 14 HIGH PROFILE DESTINATIONS NSW 06. CASTLE TOWERS 07. WESTPOINT 08. MLC CENTRE VIC 10. WOODGROVE 11. WATERGARDENS 12. EASTLAND COLLINS ACT 09. CANBERRA CENTRE Claremont Quarter and MLC Centre are co-owned properties. Commercial opportunities are through expressions of interest. 5


5 01 WHO WE ARE QIC GRE S PROJECTED DEVELOPMENT PIPELINE EASTLAND $665m CASTLE TOWERS $900m CANBERRA CENTRE $400m+ $3.19bn BY 2019 GRAND CENTRAL $500m ROBINA TOWN CENTRE $250m 80 COLLINS $470m As of August 2016 Subject to internal and external approval 6
6 01 WHO WE ARE CONNECTED EXPERIENCE 129,878 ONLINE SUBSCRIBED MEMBERS 2 327,343 AVERAGE MONTHLY UNIQUE ONLINE VISITORS 5 244,766 COMBINED FACEBOOK AND INSTAGRAM FOLLOWERS 3 14 LARGE FORMAT 3 DIGITAL SCREENS 136m VISITS PER YEAR¹ 1m + WI-FI LOG-INS ANNUALLY SHOPALITES (THROUGH OUR OOH! PARTNERSHIP) LARGE AND DYNAMIC SPACES 3 FOR EXPERIENTIAL ACTIVATIONS 20 LARGE FORMAT SPECTACULAR BANNERS 3 1. Annual traffic as at August As of June As of August Source: Abuzz July June Source: GA 4 week average, June May
7 02 WHAT WE DO


8 02 WHAT WE DO WHAT WE DO Today s consumer is connected, savvy and hungry for new ways of experiencing the brands they love. Our network of touchpoints and experiences has been designed to answer these needs on a holistic level, allowing brands to redefine their share of place in every dimension: physical, digital, and social. 9

9 02 WHAT WE DO REDEFINE YOUR SHARE OF PLACE


10 02 WHAT WE DO OUR EXPERIENCE NETWORK SPONSORSHIPS DIGITAL MEDIA Food courts Kids play areas Sponsor events Seasonal events Valet parking Parents rooms Exclusive weekly website buyouts E-newsletters Wi-Fi sponsorship In-app executions Integrated content sponsorships Featured offer Featured event listing Competition pages IN-CENTRE MEDIA SITE ACTIVATIONS Billboards Atrium banners Mall banners Digital directory screens Door decals Floor decals Lift wraps Column wraps Table tops SOCIAL Social influencer network Content creation Promoted posts TH understanding of our own mortality are leading people to maximise their current potential. The current zeitgeist is shifting when it comes to age and to perfections of age. While 60-somethings are no longer willing to sit in a rocking chair, 30-somethings are actively looking for ways to delay ageing by taking care of their bodies and minds, and using optimisation as a preventative healthcare tactic. With this self-awareness comes the growing realisation that all of the decisions we make are intrinsically connected to how we feel. It is becoming understood that our emotions and physical state play huge role in all our decision-making. The environ in our body affects how we cope with the wor In our quest to reconnect with our su our senses and our bodies to be ou we are seeking blissful altered s for heightened sensory env a reconnection with t interest in physi peak. The d a sou optimisation, they expect the inspire the journey. Brands n of flexibility to become wo consumers. Learning fr your findings to enga this joint quest fo The Beau unlocks b and co ind PRINT MEDIA Centre Print Publications Experiential sites Centre courts Short term kiosk sites Roaming promotions Display cases Visual merchandising sites Interactive hoardings *Our Experience Network offerings varies by centre. Subject to availability at time of booking. 11


11 02 WHAT WE DO OUR INFLUENCER NETWORK CHARLOTTE BRIDGEMAN THE MERRYMAKER themerrymakersisters.com Canberra 66.1k Instagram followers 35.3k Facebook followers HARNESS THE POWER OF OUR COMMUNITIES WHOLE thewholedaily.com.au Sydney 17.8k Instagram followers 16.4k Facebook followers GREG Melbourne Fashion Blogger 43.3k Instagram Townsville 3,593 Instagram followers THE FIT Sydney 69.3k Instagram followers 10.5k Facebook followers Brand iq can help brands select influencers within our communities who are right for an event or activation within our places. This influencer program at grassroots level adds another layer to a brand campaign creating a consistent organic conversation that draws in new loyal customers. Melbourne Fashion Blogger 53.2k Instagram followers Influencers within our communities have been identified through a 3rd party technology platform and currently do not have an agreement with QIC to provide content. Followers as of August


12


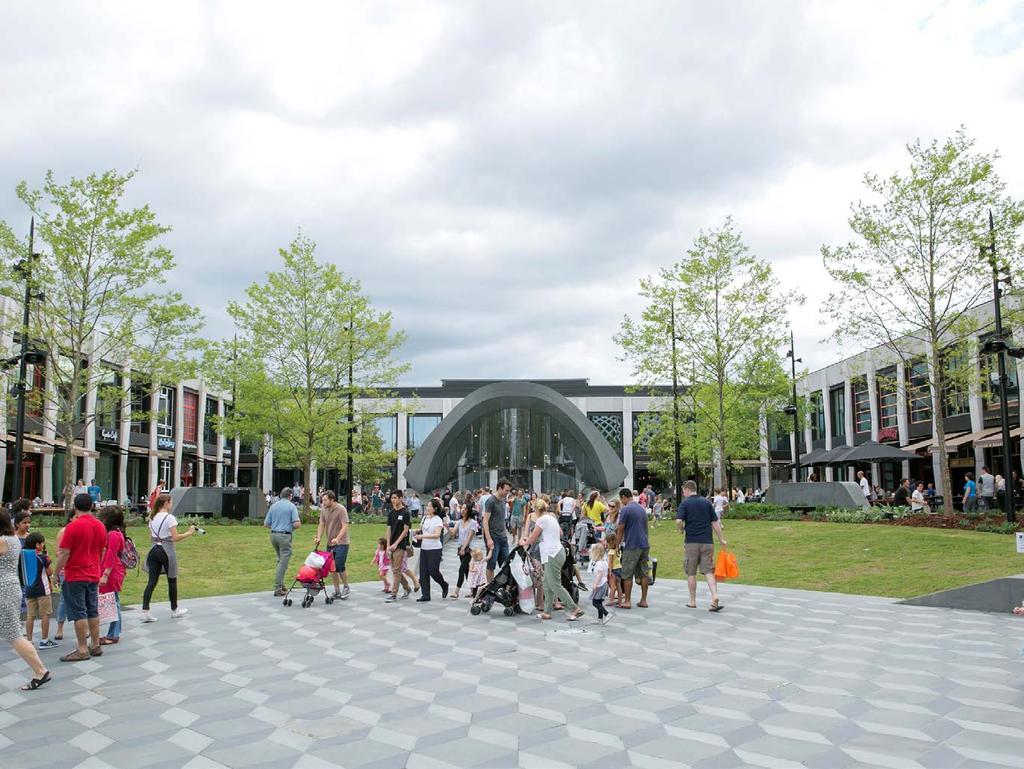
13 Our places reflect the diversity of our audiences, with each one tailored to suit the needs of the people who surround it. These are more than shopping centres; they are active, vibrant public spaces that bring together art, food, retail, leisure and wellbeing, allowing for authentic and holistic unions for brands and communities. 14
14 EASTLAND Sitting at the gateway to the Yarra Valley, Eastland has recently revitalised the region and draws over 13.4m customer visits annually. Source: Annual traffic as at August 2016

15
16


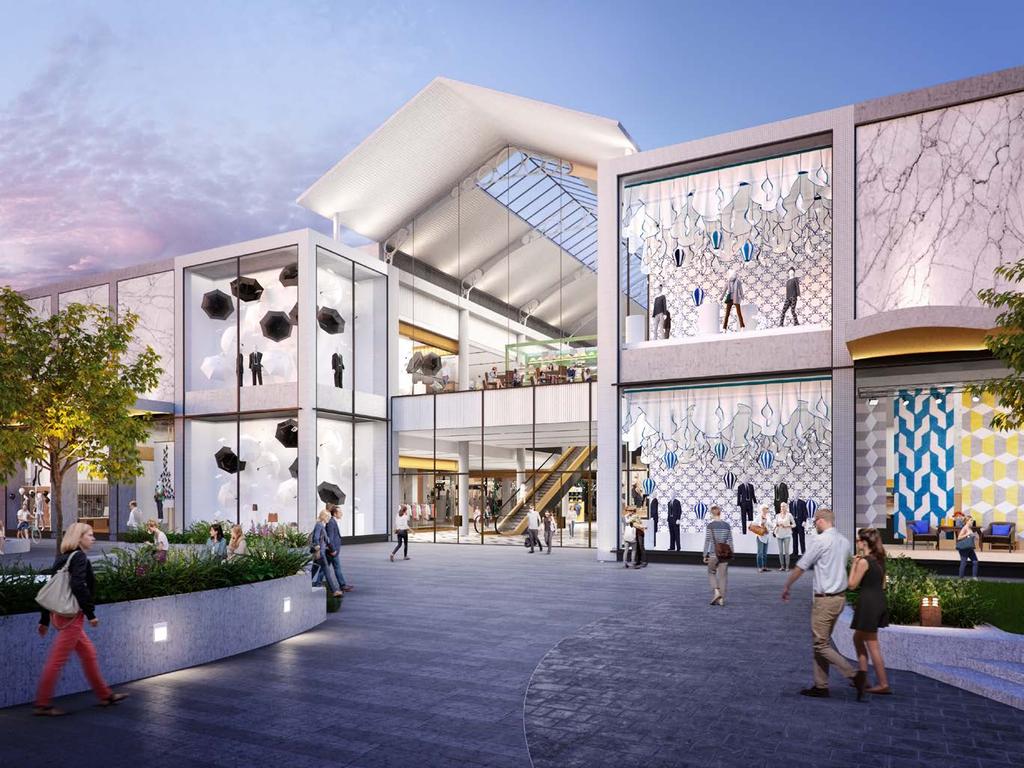
17 EASTLAND CENTRE STATISTICS A NEW MECCA FOR EXPERIENCE Easily accessible from all areas of Melbourne and beyond, Eastland is a new Mecca for food, fashion and family-oriented experiences. New concepts and innovations include the food-focused Town Square, an Arcade showcasing up and coming brands, and the Beauty Garden, a sensorium of beauty and wellbeing. $665m + DEVELOPMENT INVESTMENT 1 MAJOR RETAILERS David Jones, Myer, Target, Kmart, Big W & Hoyts Cinemas MINI MAJORS H&M, Uniqlo, MRP, JB Hi-Fi Home, Harris Scarfe, Priceline SUPERMARKETS AND LIQUORSTORES Woolworths, Coles, BWS & Liquorland Source: Retailer list as at August Subject to internal and external approval 20


18 EASTLAND AUDIENCE PROFILE LOVERS OF FOOD, FASHION & FAMILY Eastland is the go-to hub for a diverse audience who love spending time with friends and family, whether it s eating out, shopping for local produce, or exploring the latest fashions. A mix of affluence and Middle Australia makes for a wide range of tastes and habits. 808,800 POTENTIAL TOTAL TRADE AREA POPULATION 1 659,310 POTENTIAL MAIN TRADE AREA POPULATION 1 $10.7bn POTENTIAL TOTAL TRADE AREA RETAIL EXPENDITURE 2 56% FAMILIES WITH DEPENDENT CHILDREN 3 $9.1bn POTENTIAL MAIN TRADE AREA RETAIL EXPENDITURE 2 1. Potential post-development trade area estimated resident population. Source: MacroPlan Dimasi, September Potential post-development trade area estimated total retail expenditure. Source: MacroPlan Dimasi, September As at 2011 Census. Source: MacroPlan Dimasi, September
19 EASTLAND POTENTIAL SURROUNDING TRADE AREA Eltham Warrandyte SECONDARY NORTH Lilydale Westfield Doncaster Eastland SECONDARY EAST SECONDARY WEST Ringwood 10 KM 20 KM 30 KM Mount Dandenong Burwood The Glen Westfield Knox Ferntree Gully Rowville SECONDARY SOUTH Emerald Westfield Southland Dandenong Plaza TERTIARY Westfield Fountain Gate The main trade area (MTA) is the total of the primary and secondary trade areas combined. The total trade area (TTA) is the total of the primary, secondary, and tertiary trade areas combined. Trade area represents the potential post-development trade area, i.e. one which is considered available to be served in the future. 22
20 EASTLAND POTENTIAL MTA AUDIENCE PROFILE 2016 RETAIL EXPENDITURE BY CATEGORY1 AGE Eastland $1,162m 13% $258m 3% 0% 18.5% 19% 13% 19.7% 20% 13% 13% 14.8% 14.8% 33% 13.5% 13.5% 20.5% 14% 50% 100% Melbourne 18.5% 18% 14% 21.7% 23% 15% 14.5% 32% 12.1% 18.2% 13% $1,610m 18% $3,946m 42% 0% 50% 100% INCOME2 $936m 10% $1,163m 13% Annual Average Income Per Household ($) $92,186 Food Retail Food Catering Apparel Household Goods Leisure/ General Retail Services Annual Average Income Per Person ($) $34, estimated total retail expenditure. Source: Macroplan Dimasi, September As at 2011 Census. Source: Macroplan Dimasi, September
21 EASTLAND POTENTIAL MTA AUDIENCE PROFILE MOSAIC PROFILE Eastland 6.6% 32.2% 2.2% 7.7% 4.4% 3.5% 21% 6.9% 1.2% 2.3% 4.8% 7.1% 0.2% 0% 50% 100% Melbourne 9% 17% 15% 4% 3% 10% 10% 15% 5% 1% 6% 4% 0% 50% 100% Exclusive Environs Knowledgeable Success Independence and Careers Affluent Acreage Distanced Existence New Homes and Hopes Middle Australia International Infusion Books and Boots Provincial Living Traditionally Grey Regional Endeavours Remotely Blue Source: MacroPlan Dimasi, September 2013 using Experian Mosaic 2013 including 2011 ABS Census 24
22 EASTLAND TOUCHPOINTS & REACH 98,000 DIGITAL SCREENS WEBSITE WEEKLY PI S 4 WEEK AVERAGE NOV & DEC ,950 WAYFINDERS DIGITAL SCREENS NEWSLETTER SUBSCRIBERS DECALS 48,209 SOCIAL FOLLOWERS FACEBOOK & INSTAGRAM DOOR LIFT 91,784 MONTHY WI-FI LOG-INS FLOOR TABLE TOP DECALS 257,000 AVERAGE WEEKLY TRAFFIC DIGITAL TOUCHPOINTS Exclusive Website Buyout, Featured Offer, Featured Event Listing, E-News Leaderboard, Dedicated E-Newsletter, Promoted Social Posts, Wi-Fi Sponsorship ESCALATOR SIDE DECALS HOARDINGS Sources: Weekly Traffic: using MAT traffic at August 2016 divided by 52. Online database: June Social Followers: As of August Wi-Fi Logins: Abuzz June Website: GA 4 week average Nov & Dec EXPERIENCE SITES Pop ups & Experiential Roaming 25
23 CANBERRA CENTRE Source: Annual traffic as at August 2016 Drawing over 17.1m customer visits annually, Canberra Centre is the Capital s nexus for fashion, dining and experience, showcasing the world s finest brands alongside Australia s emerging talents.
24

25


26 CANBERRA CENTRE STATISTICS THE CAPITAL S HEART OF CULTURE Located in the heart of Canberra s Civic Centre, this is the Capital s nexus for fashion, food and culture. It s a meeting place, a gathering place, both a magnetic destination and the starting point for a new journey. $400m + PROJECTED DEVELOPMENT INVESTMENT 1 MAJOR RETAILERS David Jones, Myer, Big W, Target & Dendy Cinemas SUPERMARKETS Coles & ALDI MINI MAJORS Apple, Zara, JB Hi-Fi, Rebel Sport, Priceline, Fitness First, Kathmandu, Country Road Source: Retailer list as at August Subject to internal and external approval 29


27 CANBERRA CENTRE AUDIENCE PROFILE YOUNG, AFFLUENT & EDUCATED Canberra residents are more affluent and younger than the Sydney average, with variations in life stage and household structure across the ACT. The presence of two major universities bolsters a large and active student presence. 431,055 TOTAL TRADE AREA POPULATION 1 217,786 MAIN TRADE AREA POPULATION 1 2.1% FORECAST ANNUAL POPULATION GROWTH 4 $6.9bn TOTAL TRADE AREA RETAIL EXPENDITURE 2 $3.7 bn MAIN TRADE AREA RETAIL EXPENDITURE 2 $16,823 MAIN TRADE AREA RETAIL SPEND PER CAPITA estimated resident population. Source: Urbis, February estimated total retail expenditure. Source: Urbis, February estimated total retail expenditure per capita. Source: Urbis, February Main trade area forecast annual population growth 2015 to Source: Urbis, February
28 CANBERRA CENTRE TRADE AREA SECONDARY NORTH Gungahlin TERTIARY NORTH WEST SECONDARY NORTH WEST Belconnen PRIMARY Canberra Centre 5 KM 10 KM Majura Park SECONDARY SOUTH Woden TERTIARY SOUTH WEST SECONDARY FAR SOUTH TERTIARY SOUTH EAST Tuggeranong TERTIARY SOUTH The main trade area (MTA) is the total of the primary and secondary trade areas combined. The total trade area (TTA) is the total of the primary, secondary, and tertiary trade areas combined. 31
29 CANBERRA CENTRE MTA AUDIENCE PROFILE OCCUPATION¹ Managers & Professionals Other White Collar AGE Blue Collar Canberra Centre Canberra Centre 53% 33% 14% 17% 16% 25% 30% 11% 0% 50% 100% 0% 50% 100% Sydney Sydney 40% 35% 26% 19% 13% 23% 32% 13% 0% 50% 100% 0% 50% 100% 2015 EXPENDITURE BY CATEGORY 2015 Retail Expenditure3 Per Person TOTAL TRADE AREA RETAIL EXPENDITURE3 INCOME2 $379m 10% $268m 7% $484m 13% $1,672m 46% Food Retail Food Catering Apparel Homewares $7,679 $2,258 $1,695 $1,230 $6.9bn 2015 EXPENDITURE Annual Average Income Per Household ($) Households with Annual Income Over $130,000 $119,292 39% $369m 10% Leisure / General $1,738 $492m 14% Other $2, Main occupation of employed persons as at 2011 ABS Census. Source: Urbis, February As at 2011 ABS Census. Source: Urbis, February estimated total trade retail expenditure. Source: Urbis, February estimated total retail expenditure per capita. Source: Urbis, February
30 CANBERRA CENTRE MTA AUDIENCE PROFILE MOSAIC PROFILE ¹ Canberra Centre 15% 22% 31% 5% 15% 2% 3% 2% 4% 0% 50% 100% Sydney 14% 14% 20% 3% 2% 4% 9% 12% 11% 1% 6% 3% 1% 0% 50% 100% Exclusive Environs Knowledgeable Success Independence and Careers Affluent Acreage Distanced Existence New Homes and Hopes Middle Australia International Infusion Books and Boots Provincial Living Traditionally Grey Regional Endeavours Remotely Blue 1. Source: Urbis, February 2016 using Experien Mosaic 2013 including 2011 ABS Census 33
31 CANBERRA CENTRE TOUCHPOINTS & REACH 32,000 DIGITAL SCREENS WEBSITE WEEKLY PI S 4 WEEK AVERAGE NOV & DEC ,000 WAYFINDERS DIGITAL SCREENS NEWSLETTER SUBSCRIBERS DECALS 11,525 SOCIAL FOLLOWERS FACEBOOK & INSTAGRAM DOOR LIFT 12,053 FLOOR TABLE TOP MONTHY WI-FI LOG-INS 330,000 AVERAGE WEEKLY TRAFFIC DIGITAL TOUCHPOINTS Exclusive Website Buyout, Featured Offer, Featured Event Listing, E-News Leaderboard, Dedicated E-Newsletter, Promoted Social Posts, Wi-Fi Sponsorship ESCALATOR SIDE HOARDINGS EXPERIENCE SITES BANNERS BOOM GATES Sources: Annual Traffic as at August 2016 (divided by 52 weeks) Online database: June Social Followers: As of August 2016 Wi-Fi Log-ins: Abuzz June 2016 Website Page Impressions: Google Analytics 4 week average November & December 2015 Pop ups & Experiential Roaming 34
32 CASTLE TOWERS Source: Annual traffic as at August 2016 A powerhouse destination for Sydney s aflluent northern suburbs, Castle Towers pulls in 19m leisure seeking visits each year.

33 36


34 CASTLE TOWERS CENTRE STATISTICS A GROWING FUTURE CITY Castle Towers is the central hub for the affluent Hills district, and is in the early stages of a proposed $900m+ redevelopment that will see it transformed into a world-class urban centre. Offering more than just shopping, it will become the third space in the hills; a place to see and be seen, to be enriched and rewarded. $900m + PROJECTED DEVELOPMENT INVESTMENT 1 MAJOR RETAILERS David Jones, Myer, Target, Kmart & Event Cinemas SUPERMARKETS AND LIQUORSTORES Coles, ALDI & Vintage Cellars MINI MAJORS Apple, Best & Less, Lincraft, Fitness First, Rebel Sport, Priceline, The Reject Shop, Country Road, JB Hi-Fi Retailer list as at August Subject to internal and external approval 37


35 CASTLE TOWERS AUDIENCE PROFILE AFFLUENT MIX OF YOUNG AND OLD Hills residents are affluent, with both established and young families making up a large proportion of the population. There is also an increasingly multicultural influence. 396,027 TOTAL TRADE AREA POPULATION 1 205,862 MAIN TRADE AREA POPULATION AVERAGE HOUSEHOLD SIZE 4 $5.8bn TOTAL TRADE AREA RETAIL EXPENDITURE 2 $3.2bn MAIN TRADE AREA RETAIL EXPENDITURE 2 $15,323 MAIN TRADE AREA RETAIL SPEND PER CAPITA estimated resident population. Source: Urbis, February estimated total retail expenditure. Source: Urbis, February estimated total retail expenditure per capita. Source: Urbis, February As at 2011 ABS Census. Source: Urbis, February
36 CASTLE TOWERS TRADE AREA SECONDARY NORTH Rouse Hill TERTIARY WEST SECONDARY NORTH WEST Hornsby Stanhope PRIMARY Castle Towers 5 KM 10 KM SECONDARY EAST Blacktown SECONDARY SOUTH WEST TERTIARY SOUTH EAST North Rocks TERTIARY SOUTH WEST The main trade area (MTA) is the total of the primary and secondary trade areas combined. The total trade area (TTA) is the total of the primary, secondary, and tertiary trade areas combined. 39
37 CASTLE TOWERS MTA AUDIENCE PROFILE OCCUPATION¹ Managers & Professionals Other White Collar AGE Blue Collar Castle Towers Castle Towers 46% 35% 19% 21% 14% 17% 35% 12% 0% 50% 100% 0% 50% 100% Sydney Sydney 40% 35% 26% 19% 13% 23% 32% 13% 0% 50% 100% 0% 50% 100% 2015 EXPENDITURE BY CATEGORY 2015 TOTAL TRADE INCOME2 AREA RETAIL EXPENDITURE Retail Expenditure3 Per Person4 $368m 12% $231m 7% $515m 16% $373m 12% $481m 15% $1,187m 38% Food Retail Food Catering Apparel Homewares Leisure / General Other $5,767 $2,338 $1,810 $1,123 $1,786 $2,500 $5.8bn 2015 EXPENDITURE Annual Average Income Per Household ($) Households with Annual Income Over $130,000 $121,467 42% 1. Main occupation of employed persons as at 2011 ABS Census. Source: Urbis, February As at 2011 ABS Census. Source: Urbis, February estimated total trade retail expenditure. Source: Urbis, February estimated total retail expenditure per capita. Source: Urbis, February
38 CASTLE TOWERS MTA AUDIENCE PROFILE MOSAIC PROFILE ¹ Castle Towers 42% 25% 6% 6% 8% 7% 1% 4% 0% 50% 100% Sydney 14% 14% 20% 3% 2% 4% 9% 12% 11% 1% 6% 3% 1% 0% 50% 100% Exclusive Environs Knowledgeable Success Independence and Careers Affluent Acreage Distanced Existence New Homes and Hopes Middle Australia International Infusion Books and Boots Provincial Living Traditionally Grey Regional Endeavours Remotely Blue 1. Source: Urbis, February 2016 using Experien Mosaic 2013 including 2011 ABS Census 41
39 CASTLE TOWERS TOUCHPOINTS & REACH 32,000 DIGITAL SCREENS WEBSITE WEEKLY PI S 4 WEEK AVERAGE NOV & DEC ,930 WAYFINDERS DIGITAL SCREENS NEWSLETTER SUBSCRIBERS DECALS 24,542 SOCIAL FOLLOWERS FACEBOOK & INSTAGRAM DOOR LIFT 21,124 FLOOR TABLE TOP 366,000 MONTHY WI-FI LOG-INS AVERAGE WEEKLY TRAFFIC DIGITAL TOUCHPOINTS Exclusive Website Buyout, Featured Offer, Featured Event Listing, E-News Leaderboard, Dedicated E-Newsletter, Promoted Social Posts, Wi-Fi Sponsorship ESCALATOR SIDE HOARDINGS Sources: Annual Traffic as at August 2016 (divided by 52 weeks) Online database: June Social Followers: As of August 2016 Wi-Fi Log-ins: Abuzz June 2016 Website Page Impressions: Google Analytics 4 week average November & December 2015 EXPERIENCE SITES Pop ups & Experiential Roaming 42

40 GRAND CENTRAL Source: Annual traffic as at August 2016 The must visit destination in the Darling Downs region, with over 7.9m customer visits annually.


41 GRAND CENTRAL CENTRE STATISTICS THE HEART OF TOOWOOMBA Grand Central combines cutting-edge food, fashion, entertainment and lifestyle in the heart of Toowoomba. A market leader for fashion in the region, it boasts a stable of leading global, high street and Australian brands. $500m PROJECTED DEVELOPMENT INVESTMENT 1 MAJOR RETAILERS Myer, Target, Birch Carroll & Coyle Cinemas MINI MAJORS H&M, Rebel Sport & Priceline Pharmacy SUPERMARKETS AND LIQUORSTORES Coles & Liquorland Source: Retailer list as at August Subject to internal and external approval 44


42 GRAND CENTRAL AUDIENCE PROFILE HARDWORKING & DIVERSE Spread over a geographically vast and expansive trade area, resident profiles are quite diverse. A predominantly blue-collar background defines this mix of families and older residents. 284,377 TOTAL TRADE AREA POPULATION1 185,513 MAIN TRADE AREA POPULATION AVERAGE HOUSEHOLD SIZE 4 $3.5bn TOTAL TRADE AREA RETAIL EXPENDITURE 2 $2.3bn MAIN TRADE AREA RETAIL EXPENDITURE 2 $12,393 MAIN TRADE AREA RETAIL SPEND PER CAPITA estimated resident population. Source: Urbis, February estimated total retail expenditure. Source: Urbis, February estimated total retail expenditure per capita. Source: Urbis, February As at 2011 ABS Census. Source: Urbis, February
43 GRAND CENTRAL TRADE AREA Kingaroy Dalby TERTIARY WEST SECONDARY NORTH TERTIARY NORTH EAST TERTIARY FAR WEST 100 KM 50 KM 25 KM SECONDARY EAST TERTIARY EAST SECONDARY WEST Grand Central SECONDARY SOUTH TERTIARY SOUTH Rose City TERTIARY FAR SOUTH The main trade area (MTA) is the total of the primary and secondary trade areas combined. The total trade area (TTA) is the total of the primary, secondary, and tertiary trade areas combined. 46
44 GRAND CENTRAL MTA AUDIENCE PROFILE OCCUPATION¹ Managers & Professionals Other White Collar AGE Blue Collar Grand Central Grand Central 30% 33% 37% 21% 14% 18% 32% 15% 0% 50% 100% 0% 50% 100% Brisbane Brisbane 34% 36% 30% 20% 15% 22% 31% 12% 0% 50% 100% 0% 50% 100% 2015 EXPENDITURE BY CATEGORY 2015 TOTAL TRADE INCOME2 AREA RETAIL EXPENDITURE Retail Expenditure3 Per Person4 $256m 11% $169m 7% $358m 16% $1,056m 46% Food Retail Food Catering Apparel Homewares $5,695 $1,514 $964 $911 $3.4bn 2015 EXPENDITURE Annual Average Income Per Household ($) Households with Annual Income Over $130,000 $69,964 12% $179m 7% $281m 12% Leisure / General Other $1,380 $1, Main occupation of employed persons as at 2011 ABS Census. Source: Urbis, February As at 2011 ABS Census. Source: Urbis, February estimated total trade retail expenditure. Source: Urbis, February estimated total retail expenditure per capita. Source: Urbis, February
45 GRAND CENTRAL MTA AUDIENCE PROFILE MOSAIC PROFILE¹ Grand Central 1% 5% 1% 6% 20% 13% 4% 9% 15% 13% 13% 0% 50% 100% Brisbane 7% 16% 15% 4% 5% 14% 14% 4% 3% 3% 8% 6% 2% 0% 50% 100% Exclusive Environs Knowledgeable Success Independence and Careers Affluent Acreage Distanced Existence New Homes and Hopes Middle Australia International Infusion Books and Boots Provincial Living Traditionally Grey Regional Endeavours Remotely Blue 1. Source: Urbis, February 2016 using Experien Mosaic 2013 including 2011 ABS Census 48
46 GRAND CENTRAL TOUCHPOINTS & REACH 47,000 DIGITAL SCREENS WEBSITE WEEKLY PI S 4 WEEK AVERAGE NOV & DEC ,089 WAYFINDERS DIGITAL SCREENS NEWSLETTER SUBSCRIBERS DECALS 13,819 SOCIAL FOLLOWERS FACEBOOK & INSTAGRAM DOOR LIFT 5,672 FLOOR TABLE TOP 152,000 MONTHY WI-FI LOG-INS AVERAGE WEEKLY TRAFFIC DIGITAL TOUCHPOINTS Exclusive Website Buyout, Featured Offer, Featured Event Listing, E-News Leaderboard, Dedicated E-Newsletter, Promoted Social Posts, Wi-Fi Sponsorship ESCALATOR SIDE HOARDINGS Sources: Annual Traffic as at August 2016 (divided by 52 weeks) Online database: June Social Followers: As of August 2016 Wi-Fi Log-ins: Abuzz June 2016 Website Page Impressions: Google Analytics 4 week average November & December 2015 EXPERIENCE SITES Pop ups & Experiential Roaming 49

47 ROBINA TOWN CENTRE Source: Annual traffic as at August 2016 Robina Town Centre is the Gold Coast s most vibrant place to shop, eat and play with over 13.5m annual customer visits.


48 ROBINA TOWN CENTRE STATISTICS ENDLESS POSSIBILITIES Conveniently located adjacent to the M1 motorway, Robina Town Centre draws the community together and is a magnetic destination for fashion, food, dining, leisure, culture and design. The centre showcases an iconic selection of Australian brands alongside international favourites. $250m + PROJECTED DEVELOPMENT INVESTMENT 1 MAJOR RETAILERS David Jones, Myer, Big W, Target, Kmart & Event Cinemas SUPERMARKETS AND LIQUORSTORES Woolworths, Coles, BWS & Liquorland MINI MAJORS Apple, JB Hi-Fi, Kathmandu, Best & Less, Country Road, Rebel Sport, Zara, Pillow Talk, Stack s Variety Store, Terry White Chemists, AMF Bowling, City Beach, Priceline, Fernwood Fitness & Goodlife Health Club Source: Retailer list as at August Subject to internal and external approval 51


49 ROBINA TOWN CENTRE AUDIENCE PROFILE SUN, SURF AND RETAIL SPEND The resident profile of Robina s main trade area generally mirrors that of Brisbane albeit with an older average age. Young families and a focus on fitness and the outdoors are also key drivers in this beachside location. 589,087 TOTAL TRADE AREA POPULATION 1 297,599 MAIN TRADE AREA POPULATION AVERAGE HOUSEHOLD SIZE 3 $7.6bn TOTAL TRADE AREA RETAIL EXPENDITURE 2 $3.9bn MAIN TRADE AREA RETAIL EXPENDITURE 2 25% FAMILIES WITH KIDS AGED UNDER 15YRS estimated resident population. Source: Urbis, February estimated total retail expenditure. Source: Urbis, February As at 2011 ABS Census. Source: Urbis, February
50 ROBINA TOWN CENTRE TRADE AREA TERTIARY NORTH WEST Helensvale TERTIARY NORTH EAST SECONDARY NORTH WEST Australia Fair SECONDARY NORTH EAST Pacific Fair PRIMARY EAST 10 KM Robina Town Centre Burleigh Heads PRIMARY WEST SECONDARY SOUTH EAST TERTIARY SOUTH EAST The main trade area (MTA) is the total of the primary and secondary trade areas combined. The total trade area (TTA) is the total of the primary, secondary, and tertiary trade areas combined. 53
51 ROBINA TOWN CENTRE MTA AUDIENCE PROFILE OCCUPATION¹ Managers & Professionals Other White Collar AGE Blue Collar Robina Town Centre Robina Town Centre 31% 39% 30% 17% 13% 21% 33% 15% 0% 50% 100% 0% 50% 100% Brisbane Brisbane 34% 36% 30% 20% 15% 22% 31% 12% 0% 50% 100% 0% 50% 100% 2015 EXPENDITURE BY CATEGORY 2015 TOTAL TRADE INCOME2 AREA RETAIL EXPENDITURE Retail Expenditure3 Per Person4 $431m 11% $304m 8% $610m 16% $1,732m 44% Food Retail Food Catering Apparel Homewares $5,820 $1,777 $1,089 $1,023 $7.6bn 2015 EXPENDITURE Annual Average Income Per Household ($) Households with Annual Income Over $130,000 $75,071 15% $324m 8% $529m 13% Leisure / General Other $1,448 $2, Main occupation of employed persons as at 2011 ABS Census. Source: Urbis, February As at 2011 ABS Census. Source: Urbis, February estimated total trade retail expenditure. Source: Urbis, February estimated total retail expenditure per capita. Source: Urbis, February
52 ROBINA TOWN CENTRE MTA AUDIENCE PROFILE MOSAIC PROFILE1 Robina Town Centre 7% 10% 18% 10% 6% 7% 5% 2% 2% 10% 20% 4% 0% 50% 100% Brisbane 7% 16% 15% 4% 5% 14% 14% 4% 3% 3% 8% 6% 2% 0% 50% 100% Exclusive Environs Knowledgeable Success Independence and Careers Affluent Acreage Distanced Existence New Homes and Hopes Middle Australia International Infusion Books and Boots Provincial Living Traditionally Grey Regional Endeavours Remotely Blue 1. Source: Urbis, February 2016 using Experien Mosaic 2013 including 2011 ABS Census 55
53 ROBINA TOWN CENTRE TOUCHPOINTS & REACH 65,000 WEBSITE WEEKLY PI S 4 WEEK AVERAGE NOV & DEC 11,210 NEWSLETTER SUBSCRIBERS 44,877 SOCIAL FOLLOWERS FACEBOOK & INSTAGRAM DIGITAL SCREENS 13 DECALS DIGITAL SCREENS (30 X 40) DOOR 01 DIGITAL LANDSCAPE LIFT 25,690 FLOOR TABLE TOP 261,000 MONTHY WI-FI LOG-INS AVERAGE WEEKLY TRAFFIC Sources: Annual Traffic as at August 2016 (divided by 52 weeks) Online database: June Social Followers: As of August 2016 Wi-Fi Log-ins: Abuzz June 2016 Website Page Impressions: Google Analytics 4 week average November & December 2015 DIGITAL TOUCHPOINTS Exclusive Website Buyout, Featured Offer, Featured Event Listing, E-News Leaderboard, Dedicated E-Newsletter, Promoted Social Posts, Wi-Fi Sponsorship EXPERIENCE SITES Pop ups & Experiential Roaming ESCALATOR SIDE SPECTACULAR BANNER HOARDINGS ATRIUM BANNER 56

54 WESTPOINT Source: Annual traffic as at August 2016 Located in the heart of the Greater Western Sydney Region, Westpoint attracts over 18.1m customer visits annually.


55 WESTPOINT CENTRE STATISTICS WESTERN SYDNEY S DESTINATION Westpoint is the social hub in the Centre of a busy commercial district providing a destination for fresh food, entertainment and leisure. With easy access from the motorway network and Blacktown s public transport and rail/bus interchange, Westpoint features Myer, Target, Big W, Supermarkets, outdoor dining precinct, On Four and over 220 specialty stores. MAJOR RETAILERS Myer, Big W, Target, Hoyts Cinemas SUPERMARKETS AND LIQUORSTORES Coles, Woolworths, ALDI & BWS MINI MAJORS JB Hi-Fi Home, HS Home, Priceline, The Reject Shop, Lincraft, Daiso, Rebel Sport, Best & Less, City Beach & VIBE Health Club Retailer list as of August


56 WESTPOINT AUDIENCE PROFILE MIDDLE AUSTRALIA, INTERNATIONAL INFUSION Multicultural primary trade area residents dominate the audience profile; a mixture of Middle Australia and International Infusion. 318,117 TOTAL TRADE AREA POPULATION 1 257,662 MAIN TRADE AREA POPULATION 1 $3.8bn TOTAL TRADE AREA RETAIL EXPENDITURE 2 $3.1bn MAIN TRADE AREA RETAIL EXPENDITURE 2 $12,074 MAIN TRADE AREA RETAIL SPEND PER CAPITRA 3 39% FAMILIES WITH KIDS AGED UNDER 15YRS estimated resident population. Source: Urbis, February estimated total retail expenditure. Source: Urbis, February estimated total retail expenditure per capita. Source: Urbis, February As at 2011 ABS Census. Source: Urbis, February
57 WESTPOINT TRADE AREA Stanhope SECONDARY NORTH SECONDARY WEST PRIMARY SECONDARY EAST Mt Druitt 5 KM 10 KM Westpoint Winston HIlls TERTIARY SOUTH EAST The main trade area (MTA) is the total of the primary and secondary trade areas combined. The total trade area (TTA) is the total of the primary, secondary, and tertiary trade areas combined. 60
58 WESTPOINT MTA AUDIENCE PROFILE OCCUPATION¹ Managers & Professionals Other White Collar AGE Blue Collar Westpoint Westpoint 27% 38% 35% 23% 14% 23% 31% 9% 0% 50% 100% 0% 50% 100% Sydney Sydney 40% 35% 26% 19% 13% 23% 32% 13% 0% 50% 100% 0% 50% 100% 2015 EXPENDITURE BY CATEGORY 2015 TOTAL TRADE INCOME2 AREA RETAIL EXPENDITURE Retail Expenditure3 Per Person4 $345m 11% $224m 7% $432m 14% $1,328m 43% Food Retail Food Catering Apparel Homewares $5,154 $1,791 $1,244 $870 $3.8bn 2015 EXPENDITURE Annual Average Income Per Household ($) Households with Annual Income Over $130,000 $87,534 20% $320m 10% $461m 15% Leisure / General Other $1,341 $1, Main occupation of employed persons as at 2011 ABS Census. Source: Urbis, February As at 2011 ABS Census. Source: Urbis, February estimated total trade retail expenditure. Source: Urbis, February estimated total retail expenditure per capita. Source: Urbis, February
59 WESTPOINT MTA AUDIENCE PROFILE MOSAIC PROFILE1 Westpoint 12% 1% 14% 35% 23% 6% 2% 2% 3% 0% 50% 100% Sydney 14% 14% 20% 3% 2% 4% 9% 12% 11% 1% 6% 3% 1% 0% 50% 100% Exclusive Environs Knowledgeable Success Independence and Careers Affluent Acreage Distanced Existence New Homes and Hopes Middle Australia International Infusion Books and Boots Provincial Living Traditionally Grey Regional Endeavours Remotely Blue 1. Source: Urbis, February 2016 using Experian Mosaic 2013 including 2011 ABS Census 62
60 WESTPOINT TOUCHPOINTS & REACH 32,000 DIGITAL SCREENS WEBSITE WEEKLY PI S 4 WEEK AVERAGE NOV & DEC ,706 WAYFINDERS DIGITAL SCREENS NEWSLETTER SUBSCRIBERS DECALS 13,643 SOCIAL FOLLOWERS FACEBOOK & INSTAGRAM DOOR LIFT 10,225 FLOOR TABLE TOP 349,000 MONTHY WI-FI LOG-INS AVERAGE WEEKLY TRAFFIC DIGITAL TOUCHPOINTS Exclusive Website Buyout, Featured Offer, Featured Event Listing, E-News Leaderboard, Dedicated E-Newsletter, Promoted Social Posts, Wi-Fi Sponsorship ESCALATOR SIDE HOARDINGS EXPERIENCE SITES BANNERS BOOM GATES Sources: Annual Traffic as at August 2016 (divided by 52 weeks) Online database: June Social Followers: As of August 2016 Wi-Fi Log-ins: Abuzz June 2016 Website Page Impressions: Google Analytics 4 week average November & December 2015 Pop ups & Experiential Roaming 63

61 WATERGARDENS TOWN CENTRE Positioned in one of the strongest growth corridors in Melbourne, Watergardens Town Centre is the focal point of the booming Western suburbs, attracting over 10.9m customer visits annually. Source: Annual traffic as at August 2016


62 WATERGARDENS TOWN CENTRE STATISTICS A COMMUNITY MEETING PLACE Watergardens Town Centre is the focal point of the community in the growing township of Taylors Lakes in Melbourne s Western suburbs. Constructed on a 56 hectare Greenfield site in 1997, the Town Centre is located amidst an abundance of housing estates and has become recognised as the first choice retail destination for locals who enjoy the relaxed and friendly shopping environment. MAJOR RETAILERS Target, Big W, Hoyts Cinemas, Harvey Norman & Bunnings SUPERMARKETS AND LIQUORSTORES Coles, two Woolworths, BWS & Dan Murphy s MINI MAJORS JB Hi-Fi, Rebel Sport, AMF Bowling, Priceline Pharmacy, Goodlife Health Club, The Reject Shop, Terry White Chemist, San Andres of Watergardens, Hogs Breath, La Porchetta, Switch Lifestyle & The Sporting Globe Source: Retailer list as at August


63 WATERGARDENS TOWN CENTRE AUDIENCE PROFILE YOUNG, FAMILY- ORIENTED HOUSEHOLDS The Watergardens Town Centre audience profile is characterised by younger, family-oriented households with high proportions of Blue Collar and other White Collar workers. Half of all residents are in the process of paying off their homes. 333,369 TOTAL TRADE AREA POPULATION 1 150,945 MAIN TRADE AREA POPULATION 1 1.7% FORECAST ANNUAL POPULATION GROWTH 4 $4bn TOTAL TRADE AREA RETAIL EXPENDITURE 2 $1.8bn MAIN TRADE AREA RETAIL EXPENDITURE 2 $11,881 MAIN TRADE AREA RETAIL SPEND PER CAPITA estimated resident population. Source: Urbis, February estimated total retail expenditure. Source: Urbis, February estimated total retail expenditure per capita. Source: Urbis, February Main trade area forecast annual population growth 2015 to Source: Urbis, February
64 WATERGARDENS TRADE AREA TERTIARY NORTH WEST TERTIARY NORTH Sunbury Central 25 KM TERTIARY WEST Woodgrove Watergardens 5 KM 10 KM PRIMARY WEST Caroline Springs Square PRIMARY EAST SECONDARY SOUTH WEST SECONDARY SOUTH EAST Brimbank TERTIARY SOUTH The main trade area (MTA) is the total of the primary and secondary trade areas combined. The total trade area (TTA) is the total of the primary, secondary, and tertiary trade areas combined. 67
65 WATERGARDENS TOWN CENTRE MTA AUDIENCE PROFILE OCCUPATION1 Managers & Professionals Other White Collar AGE Blue Collar Other Watergardens Town Centre Watergardens Town Centre 26% 37% 37% 23% 14% 24% 31% 8% 0% 50% 100% 0% 50% 100% Melbourne Melbourne 37% 35% 28% 18% 14% 23% 32% 13% 0% 50% 100% 0% 50% 100% 2015 EXPENDITURE BY CATEGORY 2015 TOTAL TRADE INCOME2 AREA RETAIL EXPENDITURE Retail Expenditure3 Per Person4 $173m 10% $134m 7% $258m 14% $825m 46% Food Retail Food Catering Apparel Homewares $5,467 $1,494 $1,176 $888 $4bn 2015 EXPENDITURE Annual Average Income Per Household ($) Households with Annual Income Over $130,000 $83,558 18% $178m 10% Leisure / General $1,149 $225m 13% Other $1, Main occupation of employed persons as at 2011 ABS Census. Source: Urbis, February As at 2011 ABS Census. Source: Urbis, February estimated total trade retail expenditure. Source: Urbis, February estimated total retail expenditure per capita. Source: Urbis, February
66 WATERGARDENS TOWN CENTRE MTA AUDIENCE PROFILE MOSAIC PROFILE1 Watergardens Town Centre 1% 11% 1% 4% 49% 11% 17% 1% 3% 1% 0% 50% 100% Melbourne 9% 17% 15% 4% 3% 10% 10% 15% 5% 1% 6% 4% 0% 50% 100% Exclusive Environs Knowledgeable Success Independence and Careers Affluent Acreage Distanced Existence New Homes and Hopes Middle Australia International Infusion Books and Boots Provincial Living Traditionally Grey Regional Endeavours Remotely Blue 1. Source: Urbis, February 2016 using Experian Mosaic 2013 including 2011 ABS Census 69
67 WATERGARDENS TOWN CENTRE TOUCHPOINTS & REACH 28,000 DIGITAL SCREENS WEBSITE WEEKLY PI S 4 WEEK AVERAGE NOV & DEC ,732 WAYFINDERS DIGITAL SCREENS NEWSLETTER SUBSCRIBERS DECALS 17,149 SOCIAL FOLLOWERS FACEBOOK & INSTAGRAM DOOR TABLE TOP 8,901 FLOOR BANNERS 211,000 MONTHY WI-FI LOG-INS AVERAGE WEEKLY TRAFFIC DIGITAL TOUCHPOINTS Exclusive Website Buyout, Featured Offer, Featured Event Listing, E-News Leaderboard, Dedicated E-Newsletter, Promoted Social Posts, Wi-Fi Sponsorship ESCALATOR SIDE LIFT Sources: Annual Traffic as at August 2016 (divided by 52 weeks) Online database: June Social Followers: As of August 2016 Wi-Fi Log-ins: Abuzz June 2016 Website Page Impressions: Google Analytics 4 week average November & December 2015 EXPERIENCE SITES Pop ups & Experiential Roaming 70

68 WOODGROVE Source: Annual traffic as at August 2016 In the heart of one of Melbourne s fastest growing municipalities, attracting 8.9m customer visits annually.


69 WOODGROVE CENTRE STATISTICS THE OUTER WEST S NEWEST HUB Anchored by Kmart, Big W, three supermarkets and the region s first alfresco dining precinct, Woodgrove is the newest retail, dining and social hub in Melbourne s outer west. With over 120 specialty stores including fashion, homewares, fresh produce, food court dining and Reading Cinemas, the Centre is etched deep in the hearts of the Melton Community. MAJOR RETAILERS Kmart, Bunnings, Big W & Reading Cinemas SUPERMARKETS AND LIQUORSTORES Coles, Woolworths, ALDI & Liquorland MINI MAJORS The Reject Shop, Best & Less, Harris Scarfe, JB Hi-Fi, Amart & Jetts Source: Retailer list as at August


70 WOODGROVE AUDIENCE PROFILE NEW FAMILIES, HOMES AND HOPES Living in one of Melbourne s identified population growth corridors, residents are somewhat younger, and typically less affluent than the capital city average. Almost half are in the process of buying their own home. 100,860 TOTAL TRADE AREA POPULATION 1 88,969 MAIN TRADE AREA POPULATION 1 3.7% FORECAST ANNUAL POPULATION GROWTH4 $1.3bn TOTAL TRADE AREA RETAIL EXPENDITURE 2 $1.1bn MAIN TRADE AREA RETAIL EXPENDITURE 2 $12,563 MAIN TRADE AREA RETAIL SPEND PER CAPITA estimated resident population. Source: Urbis, February estimated total retail expenditure. Source: Urbis, February estimated total retail expenditure per capita. Source: Urbis, February Main trade area forecast annual population growth 2015 to Source: Urbis, February
71 WOODGROVE TRADE AREA SECONDARY FAR WEST TERTIARY NORTH Sunbury Central PRIMARY NORTH Bacchus Marsh Watergardens 50 KM Woodgrove 5 KM 10 KM 25 KM SECONDARY WEST PRIMARY SOUTH SECONDARY EAST The main trade area (MTA) is the total of the primary and secondary trade areas combined. The total trade area (TTA) is the total of the primary, secondary, and tertiary trade areas combined. 74
72 WOODGROVE MTA AUDIENCE PROFILE OCCUPATION1 Managers & Professionals Other White Collar AGE Blue Collar Woodgrove Woodgrove 22% 37% 40% 22% 14% 22% 33% 10% 0% 50% 100% 0% 50% 100% Melbourne Melbourne 37% 35% 28% 18% 14% 23% 32% 13% 0% 50% 100% 0% 50% 100% 2015 EXPENDITURE BY CATEGORY 2015 TOTAL TRADE INCOME2 AREA RETAIL EXPENDITURE Retail Expenditure3 Per Person4 $115m 10% $79m 7% $158m 14% $538m 48% Food Retail Food Catering Apparel Homewares $6,047 $1,445 $1,116 $884 $1.2bn 2015 EXPENDITURE Annual Average Income Per Household ($) Households with Annual Income Over $130,000 $73,356 13% $99m 9% $129m 12% Leisure / General Other $1,294 $1, Main occupation of employed persons as at 2011 ABS Census. Source: Urbis, February As at 2011 ABS Census. Source: Urbis, February estimated total trade retail expenditure. Source: Urbis, February estimated total retail expenditure per capita. Source: Urbis, February
73 WOODGROVE MTA AUDIENCE PROFILE MOSAIC PROFILE1 Woodgrove 9% 15% 3% 6% 8% 19% 20% 3% 2% 4% 11% 2% 0% 50% 100% Melbourne 9% 17% 15% 4% 3% 10% 10% 15% 5% 1% 6% 4% 0% 50% 100% Exclusive Environs Knowledgeable Success Independence and Careers Affluent Acreage Distanced Existence New Homes and Hopes Middle Australia International Infusion Books and Boots Provincial Living Traditionally Grey Regional Endeavours Remotely Blue 1. Source: Urbis, February 2016 using Experian Mosaic 2013 including 2011 ABS Census 76
74 WOODGROVE TOUCHPOINTS & REACH 20,000 DIGITAL SCREENS WEBSITE WEEKLY PI S 4 WEEK AVERAGE NOV & DEC ,511 WAYFINDERS DIGITAL SCREENS NEWSLETTER SUBSCRIBERS DECALS 13,660 SOCIAL FOLLOWERS FACEBOOK & INSTAGRAM DOOR RESTROOM DOORS 4,289 FLOOR TABLE TOP 172,000 MONTHY WI-FI LOG-INS AVERAGE WEEKLY TRAFFIC DIGITAL TOUCHPOINTS Exclusive Website Buyout, Featured Offer, Featured Event Listing, E-News Leaderboard, Dedicated E-Newsletter, Promoted Social Posts, Wi-Fi Sponsorship COLUMN WRAPS LARGE FORMAT BANNERS Sources: Annual Traffic as at August 2016 (divided by 52 weeks) Online database: June Social Followers: As of August 2016 Wi-Fi Log-ins: Abuzz June 2016 Website Page Impressions: Google Analytics 4 week average November & December 2015 EXPERIENCE SITES Pop ups & Experiential Roaming 77

75 HYPERDOME Source: Annual traffic as at August 2016 Located 20 minutes south of Brisbane, Hyperdome offers a complete shopping experience with over 10.8m customer visits annually.


76 HYPERDOME CENTRE STATISTICS RELAXED AND FAMILY-FRIENDLY Hyperdome is located in the Brisbane /Gold Coast growth corridor, just 20 minutes south of Brisbane. With direct access from the M1 Motorway, Hyperdome and the neighbouring Hyperdome Home Centre, it appeals to the whole family by offering a comprehensive shopping, restaurant, dining and family fun experience in a relaxed environment. MAJOR RETAILERS Myer, Big W, Kmart, AMF & Event Cinema SUPERMARKETS AND LIQUORSTORES Coles, Woolworths, ALDI & Bi-Lo MINI MAJORS Best & Less, JB Hi-Fi, The Reject Shop, City Beach, Priceline & Goodlife Health Club Source: Retailer list as at August


77 HYPERDOME AUDIENCE PROFILE CHILDREN, GRANDPARENTS, AND ALL IN BETWEEN Hyperdome s diverse trade area encompasses families both young and old, across a broad and dynamic mix of affluence and life stages. 247,078 TOTAL TRADE AREA POPULATION 1 210,663 MAIN TRADE AREA POPULATION 1 1.8% FORECAST ANNUAL POPULATION GROWTH4 $2.9bn TOTAL TRADE AREA RETAIL EXPENDITURE2 $2.5bn MAIN TRADE AREA RETAIL EXPENDITURE2 $11,971 MAIN TRADE AREA RETAIL SPEND PER CAPITA estimated resident population. Source: Urbis, February estimated total retail expenditure. Source: Urbis, February estimated total retail expenditure per capita. Source: Urbis, February Main trade area forecast annual population growth 2015 to Source: Urbis, February
78 HYPERDOME TRADE AREA Calamvale Central Underwood SECONDARY NORTH WEST Springwood SECONDARY WEST Logan Central SECONDARY EAST PRIMARY Grand Plaza 10 KM 5 KM Hyperdome SECONDARY SOUTH WEST TERTIARY SOUTH WEST SECONDARY SOUTH Beenleigh SECONDARY FAR SOUTH SECONDARY SOUTH EAST The main trade area (MTA) is the total of the primary and secondary trade areas combined. The total trade area (TTA) is the total of the primary, secondary, and tertiary trade areas combined. 81
79 HYPERDOME MTA AUDIENCE PROFILE OCCUPATION1 Managers & Professionals Other White Collar AGE Blue Collar Hyperdome Hyperdome 24% 37% 39% 23% 14% 21% 31% 10% 0% 50% 100% 0% 50% 100% Brisbane Brisbane 34% 36% 30% 20% 15% 22% 31% 12% 0% 50% 100% 0% 50% 100% 2015 EXPENDITURE BY CATEGORY 2015 Retail Expenditure3 Per Person TOTAL TRADE AREA RETAIL EXPENDITURE3 INCOME2 $275m 11% $184m 7% $381m 15% $1,166m 46% Food Retail Food Catering Apparel Homewares $5,535 $1,499 $953 $872 $2.9bn 2015 EXPENDITURE Annual Average Income Per Household ($) Households with Annual Income Over $130,000 $78,441 15% $201m 8% $316m 13% Leisure / General Other $1,303 $1, Main occupation of employed persons as at 2011 ABS Census. Source: Urbis, February As at 2011 ABS Census. Source: Urbis, February estimated total trade retail expenditure. Source: Urbis, February estimated total retail expenditure per capita. Source: Urbis, February
80 HYPERDOME MTA AUDIENCE PROFILE MOSAIC PROFILE1 Hyperdome 1% 12% 1% 3% 6% 20% 26% 1% 1% 9% 8% 4% 7% 0% 50% 100% Brisbane 7% 16% 15% 4% 5% 14% 14% 4% 3% 3% 8% 6% 2% 0% 50% 100% Exclusive Environs Knowledgeable Success Independence and Careers Affluent Acreage Distanced Existence New Homes and Hopes Middle Australia International Infusion Books and Boots Provincial Living Traditionally Grey Regional Endeavours Remotely Blue 1. Source: Urbis, February 2016 using Experien Mosaic 2013 including 2011 ABS Census 83
81 HYPERDOME TOUCHPOINTS & REACH 26,000 DIGITAL SCREENS WEBSITE WEEKLY PI S 4 WEEK AVERAGE NOV & DEC ,294 WAYFINDERS DIGITAL SCREENS NEWSLETTER SUBSCRIBERS DECALS 41,294 SOCIAL FOLLOWERS FACEBOOK & INSTAGRAM DOOR LIFT 11,380 FLOOR TABLE TOP 208,000 MONTHY WI-FI LOG-INS AVERAGE WEEKLY TRAFFIC Sources: Annual Traffic as at August 2016 (divided by 52 weeks) Online database: June Social Followers: As of August 2016 Wi-Fi Log-ins: Abuzz June 2016 Website Page Impressions: Google Analytics 4 week average November & December 2015 DIGITAL TOUCHPOINTS Exclusive Website Buyout, Featured Offer, Featured Event Listing, E-News Leaderboard, Dedicated E-Newsletter, Promoted Social Posts, Wi-Fi Sponsorship EXPERIENCE SITES Pop ups & Experiential Roaming ATRIUM BANNER ESCALATOR SIDE HOARDINGS 84

82 NOOSA CIVIC Source: Annual traffic as at August 2016 Noosa Civic is the number one choice for local shoppers, providing a true community based experience with over 3.1m customer visits annually.


83 NOOSA CIVIC CENTRE STATISTICS THE FIRST CHOICE FOR LOCALS Noosa Civic is the premium shopping destination on the northern end of the Sunshine Coast. The Centre serves Noosa and surrounding areas and is ideally positioned in the regions central business district, less than 10 minutes from Noosa s famous Hastings Street, and just 16 minutes East of the M1. With Big W, Woolworths and 60 specialty stores including a homemaker offer and business/commercial precinct, the Centre is the first choice for locals who enjoy the relaxed, single level shopping experience. MAJOR RETAILERS Big W SUPERMARKETS Woolworths MINI MAJORS Supercheap Auto, BCF, Australia Post & City Beach Source: Retailer list as at August


84 NOOSA CIVIC AUDIENCE PROFILE THE GOOD LIFE FOR YOUNG AND OLD While Noosa s high population of older couples living without children indicates popularity with empty nesters, an influx of holidaymakers and temporary residents contributes to a high retail spend. 82,336 TOTAL TRADE AREA POPULATION 1 82,336 MAIN TRADE AREA POPULATION 1 $13,967 MAIN TRADE AREA RETAIL SPEND PER CAPITA 3 $1.1bn TOTAL TRADE AREA RETAIL EXPENDITURE 2 $1.1bn MAIN TRADE AREA RETAIL EXPENDITURE 1 27% FAMILIES WITH KIDS AGED UNDER 15YRS estimated resident population. Source: Urbis, February estimated total retail expenditure. Source: Urbis, February estimated total retail expenditure per capita. Source: Urbis, February As at 2011 ABS Census. Source: Urbis, February
85 NOOSA CIVIC TRADE AREA SECONDARY NORTH WEST 25 KM 10 KM 5 KM PRIMARY SECONDARY NORTH EAST Noosa Civic SECONDARY SOUTH SECONDARY SOUTH EAST The main trade area (MTA) is the total of the primary and secondary trade areas combined. The total trade area (TTA) is the total of the primary, secondary, and tertiary trade areas combined. 88
86 NOOSA CIVIC MTA AUDIENCE PROFILE OCCUPATION1 Managers & Professionals Other White Collar AGE Blue Collar Noosa Civic Noosa Civic 33% 36% 31% 19% 10% 15% 38% 18% 0% 50% 100% 0% 50% 100% Brisbane Brisbane 34% 36% 30% 20% 15% 22% 31% 12% 0% 50% 100% 0% 50% 100% 2015 EXPENDITURE BY CATEGORY 2015 Retail Expenditure3 Per Person TOTAL TRADE AREA RETAIL EXPENDITURE3 INCOME2 $150m 13% $85m 7% $186m 16% $98m 9% $116m 10% $515m 45% Food Retail Food Catering Apparel Homewares Leisure / General Other $6,256 $1,407 $1,196 $1,029 $1,821 $2,258 $1.1bn 2015 EXPENDITURE Annual Average Income Per Household ($) Households with Annual Income Over $130,000 $67,924 12% 1. Main occupation of employed persons as at 2011 ABS Census. Source: Urbis, February As at 2011 ABS Census. Source: Urbis, February estimated total trade retail expenditure. Source: Urbis, February estimated total retail expenditure per capita. Source: Urbis, February
87 NOOSA CIVIC MTA AUDIENCE PROFILE MOSAIC PROFILE1 Noosa Civic 8% 14% 31% 11% 7% 7% 2% 1% 3% 12% 5% 0% 50% 100% Brisbane 7% 16% 15% 4% 5% 14% 14% 4% 3% 3% 8% 6% 2% 0% 50% 100% Exclusive Environs Knowledgeable Success Independence and Careers Affluent Acreage Distanced Existence New Homes and Hopes Middle Australia International Infusion Books and Boots Provincial Living Traditionally Grey Regional Endeavours Remotely Blue 1. Source: Urbis, February 2016 using Experian Mosaic 2013 including 2011 ABS Census 90
88 NOOSA CIVIC TOUCHPOINTS & REACH 5,500 WEBSITE WEEKLY PI S 2,307 NEWSLETTER SUBSCRIBERS 4,506 SOCIAL FOLLOWERS FACEBOOK & INSTAGRAM DIGITAL SCREENS DECALS 02 WAYFINDERS DOOR 01 DIGITAL SCREENS ATRIUM BANNER 60,000 AVERAGE WEEKLY TRAFFIC 3,205 MONTHY WI-FI LOG-INS DIGITAL TOUCHPOINTS Exclusive Website Buyout, Featured Offer, Featured Event Listing, E-News Leaderboard, Dedicated E-Newsletter, Promoted Social Posts, Wi-Fi Sponsorship FLOOR HOARDINGS TABLE TOP DECALS Sources: Annual Traffic as at August 2016 (divided by 52 weeks) Online database: June Social Followers: As of August 2016 Wi-Fi Log-ins: Abuzz June 2016 Website Page Impressions: Google Analytics 4 week average November & December 2015 EXPERIENCE SITES Pop ups & Experiential Roaming 91

89 HINKLER CENTRAL Source: Annual traffic as at August 2016 Hinkler Central is the premium shopping destination in the strong regional centre of Bundaberg, with over 5m customer visits annually.


90 HINKLER CENTRAL CENTRE STATISTICS CENTRALLY LOCATED CONVENIENCE Hinkler Central is ideally located on the southern edge of Bundaberg s Central Business District, just 360 kilometres north of Brisbane. Hinkler offers over 50 specialty stores and has a relaxed, air conditioned, single level shopping experience and features a superior combination of fashion, homewares, food and leisure retailers. MAJOR RETAILERS Kmart MINI MAJORS The Reject Shop & Terry White Chemist SUPERMARKETS AND LIQUORSTORES Coles, Woolworths, BWS & Liquorland Source: Retailer list as at August


91 HINKLER CENTRAL AUDIENCE PROFILE RELAXED LIFESTYLE AND LOCAL CHARMS Residents of Bundy are seduced by the relaxed lifestyle, affordable living and equable climate. The agricultural sector is the major employer within the region, which has an older demographic and a high level of home ownership. 93,708 TOTAL TRADE AREA POPULATION1 75,933 MAIN TRADE AREA POPULATION1 $1.1bn TOTAL TRADE AREA RETAIL EXPENDITURE2 $919m MAIN TRADE AREA RETAIL EXPENDITURE2 $12,106 MAIN TRADE AREA RETAIL SPEND PER CAPITA estimated resident population. Source: Urbis, May estimated total retail expenditure. Source: Urbis, May estimated total retail expenditure per capita. Source: Urbis, May
92 HINKLER CENTRAL TRADE AREA TERTIARY NORTH SECONDARY NORTH Hinkler Central SECONDARY EAST 20 KM 10 KM 5 KM PRIMARY SECONDARY WEST TERTIARY SOUTH The main trade area (MTA) is the total of the primary and secondary trade areas combined. The total trade area (TTA) is the total of the primary, secondary, and tertiary trade areas combined. 95
93 HINKLER CENTRAL MTA AUDIENCE PROFILE OCCUPATION1 Managers & Professionals Other White Collar AGE Blue Collar Hinkler Central Hinkler Central 27% 35% 38% 20% 7% 15% 19% 20% 20% 0% 50% 100% 0% 50% 100% Queensland Queensland 32% 35% 33% 20% 7% 20% 21% 18% 13% 0% 50% 100% 0% 50% 100% 2014 EXPENDITURE BY CATEGORY TOTAL RETAIL EXPENDITURE3 INCOME Retail Expenditure Per Product Group ($M) $118.7 $104m $63.7m $33.7 $438.7m Food Retail Food Catering Apparel Homewares Bulky Goods $1.1bn 2014 EXPENDITURE Annual Average Income Per Household ($) Households with Annual Income Over $130,000 $59,423 8% $73m $87.5m Lesiure / General Retail Services Main occupation of employed persons as at 2011 ABS Census. Source: Urbis, May As at 2011 ABS Census. Source: Urbis, May estimated total retail expenditure. Source: Urbis, May
94 HINKLER CENTRAL TOUCHPOINTS & REACH 4,000 WEBSITE WEEKLY PI S 4 WEEK AVERAGE NOV & DEC 339 NEWSLETTER SUBSCRIBERS 11,562 SOCIAL FOLLOWERS FACEBOOK & INSTAGRAM DIGITAL SCREENS DECALS 02 WAYFINDERS DOOR LIFT 102,000 AVERAGE WEEKLY TRAFFIC TBC MONTHY WI-FI LOG-INS DIGITAL TOUCHPOINTS Exclusive Website Buyout, Featured Offer, Featured Event Listing, E-News Leaderboard, Dedicated E-Newsletter, Promoted Social Posts, Wi-Fi Sponsorship FLOOR HOARDINGS TABLE TOP DECALS Sources: Annual Traffic as at August 2016 (divided by 52 weeks) Online database: June Social Followers: As of August 2016 Wi-Fi Log-ins: Abuzz June 2016 Website Page Impressions: Google Analytics 4 week average November & December 2015 EXPERIENCE SITES Pop ups & Experiential Roaming 97
95 04 CASE STUDY OPPORTUNITIES


96 04 OPPORTUNITIES OPPORTUNITIES We offer a range of opportunities that go beyond traditional advertising, allowing your brand to take ownership of a range of new and engaging experiences. Spanning the worlds of fresh food, wellbeing, fashion and more, our signature programs can be tailored to suit the needs of your brand and speak to audiences in new and innovative ways. 99

97 04 OPPORTUNITIES THE KITCHENS AT ROBINA The Kitchens reinvents the culinary experience by placing immersion at its core. It connects people through a live, intimate, visceral and exclusive experience with food & dining as the binding ingredients.

98 EDEN AT CANBERRA CENTRE Eden is the ultimate destination to discover and inspire contemporary wellness within the community of Canberra. It s a unique experience, delivering a holistic initiative for self-optimisation.

99 VALET AT EASTLAND Eastland Valet offers a suite of services designed to make our customer s experience a memorable one.

100 04 OPPORTUNITIES CHRISTMAS Take advantage of the busiest time of year in our centres with a variety of highly experiential and interactive opportunities.
101 05 CASE STUDY OUR TEAM

102 05 CASE STUDY OLYMPUS SANTA S GROTTO PARTNERSHIP A seamless partnership for the festive season.


 2.")
103 05 CASE STUDY OLYMPUS AND BRAND IQ CREATING MEMORIES THAT LAST The high-traffic Christmas season was the perfect setting for this partnership between Olympus and Brand iq, allowing Olympus to reach a large volume of excited families in a relevant and meaningful environment both in-centre and online. 10 CENTRES FROM NOV-DEC ,476,714 TRAFFIC IN-CENTRE DURING CAMPAIGN PERIOD 1 17,251 FACEBOOK VIEWS OF BRANDED CONTENT 2 277,000 PAGE IMPRESSIONS 3 1. Using MAT traffic across 10 centres as at March 16 divided by 52 x 6 (# of weeks the campaign was active) 2. Scene To Believe microsite for QIC 06/11/ /01/ GA Nov-Dec 15 total 10 website page impressions during the campaign live period 117

 2 Customised branded microsite Newsletter mail out to over 127,000 subscribers Content amplified on")


104 05 CASE STUDY SPONSORSHIP INCLUSIONS EXPERIENTIAL Sponsorship of the Santa photography experience with Olympus branding Branding on over 71,000 photo wallets, SMS queuing systems, & staff uniforms 1 Creating the perfect synergy and association right at the point of purchase DIGITAL Homepage sponsorship across 10 websites (approx. 277,000 page impressions) 2 Customised branded microsite Newsletter mail out to over 127,000 subscribers Content amplified on 40 Digital Wayfinders and Eastland Digital Town Square screen SOCIAL Branded social sharing via the centre s microsite 17,251 Facebook views of the branded Olympus shared images 3 MARKET VALUE $442,330 CONTENT Usage rights for exclusive video and photo content amplified on Olympus owned assets across digital and social 1. provided by Scene To Believe 2. GA Nov-Dec 15 total 10 website page impressions during the campaign live period 3. Combined 10 centre newsletter number in November Scene To Believe microsite for QIC 06/11/ /01/
105 07 OPPORTUNITIES MEDIA DETAILS

 x")
 @ 25% of actual size Grand Central QLD Robina Town Centre QLD Watergardens VIC Westpoint NSW Finished size: 3000mm(w) x 5000mm(h) 20 mm bleed to")
106 06 MEDIA DETAILS CENTRE SPECTACULAR BANNERS SUPERSITE BANNERS Located in triple height voids, centre spectacular banners are the largest format available in centre and have huge impact with visibility from a vast area of the centre. Larger than the standard atrium banner, supersites are located in large spaces and are double sided. LOCATIONS ARTWORK SPECIFICATIONS LOCATIONS ARTWORK SPECIFICATIONS Canberra Centre ACT Castle Towers NSW Westpoint NSW Canberra Centre 7500mm(h) x 4700mm(w), Castle Towers 5600mm(h) x 3500mm(w), Westpoint 5600mm(h) x 3500mm(w) 20mm bleed to all sides File format to be provided in high res (200 25% of actual size Grand Central QLD Robina Town Centre QLD Watergardens VIC Westpoint NSW Finished size: 3000mm(w) x 5000mm(h) 20 mm bleed to all sides File format to be provided in high res (200 25% of actual size. Robina only specs: 4000mm(h) x 2500mm(w) 120

 20mm bleed to all sides File format to be provided in high res (200 dpi) @ 25% of actual size On request Finished size: 2400mm(w) x 600mm(h) 5 mm bleed to all sides")
107 06 MEDIA DETAILS ATRIUM BANNERS HORIZONTAL BANNERS With a choice of locations, double sided atrium banners allow demographic targeting via precinct placement. Repetitive, directional or alternating messages throughout the centre, perfect for inspiring call to action. LOCATIONS ARTWORK SPECIFICATIONS LOCATIONS ARTWORK SPECIFICATIONS Canberra Centre ACT Castle Towers NSW Hyperdome QLD Noosa Civic QLD Robina QLD Finished size: 2500mm(w) x 4000mm(h) 20mm bleed to all sides File format to be provided in high res (200 25% of actual size On request Finished size: 2400mm(w) x 600mm(h) 5 mm bleed to all sides File format to be provided in high res (200 50% of actual size Watergardens VIC 121

 @ 50% of actual size Standard: 1000mm x 1000mm Super: 1800mm x 1800mm Spectacular: 2400mm x 2400mm 10mm bleed to all sides File format to be provided")
108 06 MEDIA DETAILS DOOR DECALS FLOOR DECALS Available at the busiest car park and centre entrances, engage with customers the minute they walk through the door. From the bottom of escalators to main centre thoroughfares, floor decals let you slip your message right under the feet of your customers. LOCATIONS ARTWORK SPECIFICATIONS ARTWORK SPECIFICATIONS All Centres Various sizes, confirmed at time of booking 10 mm bleed to all sides File format to be provided in high res (200 50% of actual size Standard: 1000mm x 1000mm Super: 1800mm x 1800mm Spectacular: 2400mm x 2400mm 10mm bleed to all sides File format to be provided in high res (200 50% of actual size 122

 @ 50% of")

109 06 MEDIA DETAILS AUTUMN FASHION ESCALATOR DECALS LIFT DECALS Visible from inside and out with their very own captive audience, escalator wraps take your message to a whole new level. Lifts in high visibility locations let you take your message to another level. LOCATIONS ARTWORK SPECIFICATIONS LOCATIONS ARTWORK SPECIFICATIONS Canberra Centre ACT Castle Towers NSW Grand Central QLD Robina QLD Westpoint NSW Various, confirmed at time of booking 10mm bleed to all sides File format to be provided in high res (200 50% of actual size Canberra Centre ACT Castle Towers NSW Hyperdome QLD Robina QLD Westpoint NSW Various, confirmed at time of booking 10mm bleed to all sides File format to be provided in high res (200 50% of actual size Watergardens VIC Grand Central QLD Eastland VIC Watergardens VIC 123

 x 1500mm(h) All centres Finished size: 210mm(w) x 297mm(h) 10mm")
110 06 MEDIA DETAILS COLUMN WRAP DECALS With locations at busy entrances throughout the centre, column wraps are ideal for repetitive or directional messaging over an extended period of time. FOODCOURT TABLETOP DECALS With 100 locations throughout the centre s food precincts, tabletop decals capture the imagination during high dwell time. LOCATIONS ARTWORK SPECIFICATIONS LOCATIONS ARTWORK SPECIFICATIONS Woodgrove only Finished size: 500mm(w) x 1500mm(h) All centres Finished size: 210mm(w) x 297mm(h) 10mm bleed to all sides 5mm bleed to all sides File format to be provided in high res (200 50% of actual size File format to be provided in high res (200 actual size 124

 x 1510px(h) Eastland:")
111 06 MEDIA DETAILS DIGITAL WAYFINDERS Interactive touch screens at highly visible locations, used by thousands of shoppers every month. ARTWORK SPECIFICATIONS STATIC ADVERTISING Visual size: 1080px(w) x 1510px(h) Up to 4 JPG or PNG files in RGB colour space Slideshow format fade in/out ARTWORK SPECIFICATIONS STATIC ADVERTISING Visual size: 1080px(w) x 1510px(h) Eastland: 1080px(w) x 1920px (h) with 200px bleed all sides File Types: Up to 10 sec Images - file format JPEG, PNG 72dpi resolution 125
 of all ad units (Leaderboard pos1, MREC and Leaderboard pos 2).")
.")

 x 90px(h) Standard banner only JPG or SWF + backup image (JPG or GIF)")
112 06 MEDIA DETAILS EXCLUSIVE SITE BUYOUTS BRANDED CONTENT PIECE For a minimum of one week, an advertiser can exclusively sponsor the website with 100% Share of Voice (SOV) of all ad units (Leaderboard pos1, MREC and Leaderboard pos 2). Sponsorship will run across desktop, tablet and mobile Branded Content (Our content writers can create articles around the client s brand and campaign themes). Includes surrounding ads for a month, links to e-commerce sites and promoted on the websites homepage carousel and social. Content lives on the site permanently. MREC Dimensions: 300px(w) x 250px(h) Standard banner only JPG or SWF + backup image (JPG or GIF) Supply URL, do not embed link LEADERBOARD Dimensions: 728px(w) x 90px(h) Standard banner only JPG or SWF + backup image (JPG or GIF) Supply URL, do not embed link MOBILE BANNER Dimensions: 640(w) x100(h) Standard banner only JPG or SWF + backup image (JPG or GIF) Supply URL, do not embed link 126

.")
113 06 MEDIA DETAILS FEATURED EVENT FEATURED OFFER News and Events are profiled on Home pages, Events Pages and also as Side Panel Teasers across desktop and mobile sites and in-app. Users can RSVP to events, add them to their favourites and share them with friends, in order to secure their place and receive automatic reminders. Offers are featured on the Homepages, Directory Searches, Retailer Pages and Offers Page. Visitors can favourite offers to their profiles, and share them with friends. Over 30,312 Impressions per month CONTENT REQUIREMENTS CONTENT REQUIREMENTS Event title, date, address and time Event image (JPG or GIF). Any size, image will resize automatically Event description Google map link for event location Parking information or other details RSVP call to action if required Online RSVP (free events only); requires event registration limit, automated reminder alert will be sent to registered attendees approximately 72 hours prior to the event start date Logo (JPG or GIF). Any size, image will resize automatically Copy 30 words Offer redemption voucher (PDF) Supply URL, do not embed link 127

 x 90px(h) Standard banner only JPG or SWF + backup image (JPG or GIF) Supply URL, do not embed link CONTENT REQUIREMENTS Logo (JPG")
114 06 MEDIA DETAILS EDM LEADERBOARD EXTENSION EDM FEATURED STORY One leaderboard is included in each monthly E-newsletter to centre VIP members, with click through to the advertiser s website. Offers are featured on the Homepages, Directory Searches, Retailer Pages and Offers Page. Visitors can favourite offers to their profiles, and share them with friends. LEADERBOARD Dimensions 728px(w) x 90px(h) Standard banner only JPG or SWF + backup image (JPG or GIF) Supply URL, do not embed link CONTENT REQUIREMENTS Logo (JPG or GIF). Any size, image will resize automatically Copy 30 words Offer redemption voucher (PDF) Supply URL, do not embed link 128

115 06 MEDIA DETAILS EDM DEDICATED E-NEWSLETTER 100% SOV allows advertisers to send communication direct to our VIP members, with the ability to target content based on each user s unique profile and preferences. CONTENT REQUIREMENTS JPG 600px(w) x 800px(h) 129
.")
116 DISCLAIMER The retail and commercial properties identified in this presentation are owned by QIC Limited ACN , its related bodies corporate and joint venture partners and are managed by QIC Properties Pty Ltd (collectively QIC ). To the extent permitted by law, QIC, its subsidiaries, associated entities, their directors, employees and representatives (the QIC Parties ), disclaim all responsibility and liability for any loss or damage of any nature whatsoever which may be suffered by any person directly or indirectly through relying upon the information contained in this presentation (the Information ), whether that loss or damage is caused by any fault or negligence of QIC or otherwise. This Information does not constitute advice (including financial advice) and you should seek advice before relying on it. In preparing this Information the QIC Parties have not taken into account any objectives, financial situations or needs. This Information may be based on information and research published by others. No QIC Party has confirmed, and QIC does not warrant, the accuracy or completeness of such Information. Plans, drawings, images, photographs and illustrations are indicative only. QIC reserves the right to change any part of the design and the tenancy mix of any property from that shown or described in this presentation, and QIC gives no representation or warranty that any works, developments or redevelopments in respect of the properties identified in this presentation will proceed in the manner identified in this presentation or at all. This document is being given solely for general information purposes. This presentation does not constitute an offer document in respect of any premises or space. Neither this presentation nor anything contained in it will form the basis of any contract or any obligation of any kind whatsoever. Copyright QIC Limited, Australia All rights are reserved. Do not copy, disseminate or use, except in accordance with the prior written consent of QIC. *For more information about QIC Limited, its approach, clients and regulatory framework, please refer to our website or contact us directly.
Be in the heart of it all. Coffs Central - fashion, food and fun in the heart of the CBD
 Be in the heart of it all Coffs Central - fashion, food and fun in the heart of the CBD Coffs Harbour Jetty The mere presence of Coffs Central in our beautiful city has given a pulse to the heart of our
POP UP RETAIL LAUNCH A CONCEPT, TEST AN IDEA, GROW YOUR BRAND. Prime sites in high traffic locations now available
 POP UP RETAIL LAUNCH A CONCEPT, TEST AN IDEA, GROW YOUR BRAND Prime sites in high traffic locations now available POP! Pop Up Retail offers prime sites in high traffic locations across 14 shopping centres
SCENTRE GROUP PROPERTY COMPENDIUM
 SCENTRE GROUP PROPERTY COMPENDIUM 31 December 2015 CONTENTS Portfolio Overview 01 Operating Performance 03 Retailers and Lease Expiry Profile 05 Portfolio Details 07 Property Profiles 08 Westfield Airport
O P P O R T U N I T I E S C U R R E N T L Y A V A I L A B L E
 2 4 O P P O R T U N I T I E S C U R R E N T L Y A V A I L A B L E F R A N C H I S E O P P O R T U N I T I E S T A K E T H E F I R S T S T E P T O B E C O M I N G A S A N D W I C H C H E F S F R A N C H
Stockland Investor Tour
 Stockland Investor Tour December 6, 2017 Stockland Green Hills, NSW Contents SECTION PAGE STOCKLAND RETAIL TOWN CENTRES 3 CASE STUDY: WETHERILL PARK 7 STOCKLAND GLENDALE 10 STOCKLAND GREEN HILLS 17 STRONG
FRANCHISE OPPORTUNITIES
 1 FRANCHISE OPPORTUNITIES Take the first step in becoming a Sandwich Chefs franchise owner. Click for NSW, ACT, Qld, SA, Vic Gary Powell ENQUIRE NOW National Network Development Manager Ph: 0431 591 029
IMPACT HOMES Introducing The Meadows Estate 3
 IMPACT HOMES Introducing The Meadows Estate 3 4 IMPACT HOMES Introducing The Meadows Estate INTRODUCTION The purpose of this guide is to introduce The Meadows, a residential community developed by Leda.
STEP INTO THE NEXT LEVEL OF RETAIL RETAIL HAS REACHED NEW HEIGHTS AT THE OASIS ON BROADBEACH
 STEP INTO THE NEXT LEVEL OF RETAIL L1 RETAIL HAS REACHED NEW HEIGHTS AT THE OASIS ON BROADBEACH INTRODUCING THE NEW LEVEL 1 ANCHORED BY A NEW COTTON ON MEGA The pinnacle of the rejuvenation of The Oasis
MARKET OUTLOOK. 01 Walkability & Accessibility 02 Infrastructure & Employment 03 Population & Demographics 04 Residential Market 05 Rental Market
 MARKET OUTLOOK BRAYBROOK Close to the city in Melbourne s growing west, access to jobs, services and relative affordability are attracting new residents to Braybrook and driving price growth. 01 Walkability
WRIGHT DENMAN PROSPECT AREA PROFILE MACRO PLAN DIMASO
 WRIGHT DENMAN PROSPECT AREA PROFILE CONTENTS WHY CANBERRA? PG 04 INVEST IN THE MOLONGLO VALLEY PG 06 3 PROPERTY GROUP PG 08 DETAILED INVESTMENT ANALYSIS PG 11 Population Growth Demographics Tenure & Typology
The GPT Group today announced its operational update for the March 2017 quarter.
 THE GPT GROUP ANNOUNCES 27 April 2017 March Quarter Operational Update The GPT Group today announced its operational update for the March 2017 quarter. Key Highlights Retail specialty sales growth of 2.4
GARDEN GROVE. 15 Bahrs Scrub Road, Bahrs Scrub
 GARDEN GROVE E X C E E D E X P E C T A T I O N S 15 Bahrs Scrub Road, Bahrs Scrub EXCEED EXPECTATIONS Inspired by the captivating suburb of Bahrs Scrub, a location that is abundant in nature s beauty
Axiom Properties Limited
 Axiom Properties Limited AGM UPDATE 23 November 2016 Axiom Overview 2 Axiom Properties Limited ( Axiom ) is an ASX listed property development and investment company (ASX code: AXI), which has developed
Mango Hill/North Lakes
 Investment Pack QSA WEALTH & WELLBEING MANAGEMENT 2015 Mango Hill/North Lakes Investment Pack Location This location is 25 kilometres north of Brisbane and is dominated by a series of tranquil lakes. But
A subsidiary of Metro Property Development SUBURB PROFILE LARA 7TH JUNE 2017
 A subsidiary of Metro Property Development SUBURB PROFILE LARA 7TH JUNE 2017 OVERVIEW Lara is a suburb located in the Greater Geelong Area just 17kms from Geelong and 60kms to the Melbourne CBD. Lara is
Toombul Shopping Centre By Mirvac Retail REINVENTING AN ICON
 Toombul Shopping Centre By Mirvac Retail REINVENTING AN ICON With its acquisition of Toombul in June 2016, Mirvac Retail is now repositioning the centre in line with its highly successful urban retail
NEW RETAIL OPPORTUNITIES
 NEW RETAIL OPPORTUNITIES STAGE 1 LEASING NOW Join Coles, Kmart and ALDI plus 50+ Specialty Stores and Dining Precinct THE PORT S NEWEST RETAIL DEVELOPMENT The redevelopment of the Port Canal Shopping Centre
Holmview, BRISBANE QLD
 Holmview, BRISBANE QLD HAVEN HILL - LOCATION Holmview PRIME LOCATION LOCATION Holmview is part of the Logan City Council region and is located nearly half way between the Gold Coast and Brisbane on the
RESIDENTIAL COMMUNITY PARK RIDGE T R A N Q U I L I T Y D R I V E AT PARK RIDGE
 RESIDENTIAL COMMUNITY PARK RIDGE T R A N Q U I L I T Y D R I V E AT PARK RIDGE TRANQUILITY DRIVE ESTATE is a residential community at Park Ridge, south of Brisbane, in sunny Queensland, Australia. Surrounded
BRISBANE'S DINING PLAYGROUND
 BRISBANE'S DINING PLAYGROUND Vision BRISBANE S DINING PLAYGROUND With its urban warehouse design and unique/outdoor spaces, Toombul s new dining precinct will fuse food with entertainment like nothing
LEASING OPPORTUNITIES AUSTRALIAFAIR.COM.AU
 YOUR OPPORTUNITY IS NOW LEASING OPPORTUNITIES AUSTRALIAFAIR.COM.AU AUSTRALIA FAIR EVOLUTION With the evolution of the official Southport CBD and an associated boost in local economic indicators, Australia
15m. 65mins. The Oracle, Reading. Catchment area. Where Reading happens
 Annual Footfall 15m The Oracle is an award-winning shopping destination in the Thames Valley region, just 25 minutes from London. Uniquely designed with the River Kennet running through the heart of the
LEASING GUIDE. Where Brisbane Meets the Bay
 LEASING GUIDE Where Brisbane Meets the Bay Location MANLY, BRISBANE A unique, harbour-front, mixed use village & leisure destination THE IDEAL LOCATION FOR YOUR BUSINESS WHICH WILL BENEFIT FROM; Loyal
MARKET OUTLOOK. 02 Walkability & Accessibility 04 Infrastructure & Employment 05 Population & Demographics 06 Residential Analysis 07 Rental Analysis
 MARKET OUTLOOK ROCHEDALE With easy access to the major arterial roads and public transport links, Rochedale s connectivity has positioned it as a major growth precinct for the future. 02 Walkability &
MEDIA KIT 2018 MEDIA KIT 2018 DELIVERING AN AUDIENCE OF ENGAGED AND INFLUENTIAL FASHION BUSINESS PROFESSIONALS.
 MEDIA KIT 2018 DELIVERING AN AUDIENCE OF ENGAGED AND INFLUENTIAL FASHION BUSINESS PROFESSIONALS. Ragtrader Ragtrader is Australia s oldest and most reputable fashion business media brand. Ragtrader s worth
INSPIRING LIFE -
 INSPIRING LIFE Jackson Green will embody all the ideals associated with life in the leafy south eastern suburbs. From stunning landscaping to beautifully designed homes, every detail has been considered
ROYAL MELBOURNE SHOW SPONSORSHIP OPPORTUNITIES
 2018 ROYAL MELBOURNE SHOW SPONSORSHIP OPPORTUNITIES BE PART OF VICTORIA S MOST ICONIC COMMUNITY EVENT GROW YOUR BRAND WITH OUR AUDIENCE THE 2018 ROYAL MELBOURNE SHOW Victoria s largest and most iconic
For personal use only
 THE GPT GROUP ANNOUNCES 29 October 2014 September Quarter Operational Update Key Highlights 2014 earnings guidance upgraded to at least 4 per cent earnings per security (EPS) growth Strong leasing momentum
KINGSTON THE BENTALL CENTRE
 KINGSTON THE BENTALL CENTRE INTRODUCTION The Bentall Centre has a best-in-class line up of retailers and is the dominant retail destination in this bustling commuter town, 28 minutes from London Waterloo.
NOW LEASING GLENROSE VILLAGE SHOPPING CENTRE BELROSE OPENING LATE 2015 EXPRESSIONS OF INTEREST 2 PARK ST SYDNEY
 NOW LEASING OPENING LATE 2015 GLENROSE VILLAGE SHOPPING CENTRE BELROSE EXPRESSIONS OF INTEREST 2 PARK ST SYDNEY ABOUT THIS PROJECT Glenrose Shopping Centre, Belrose has been an integral part of the Belrose,
Stage 2 Parklands at Windaroo Territory & Wilkie Streets off Beaudesert-Beenleigh Road, Bannockburn, Queensland
 Stage 2 Sales Plan Development Plan Location Maps Stage 2 of Parklands at Windaroo is located at Territory & Wilkie Streets off Beaudesert-Beenleigh Rd, Bannockburn. Yatala Enterprise Area Newly approved
SPONSORSHIP OPPORTUNITIES
 SPONSORSHIP OPPORTUNITIES THE 2019 ROYAL MELBOURNE SHOW Conducted by The Royal Agricultural Society of Victoria (RASV) since 1848, the Royal Melbourne Show is an important and effective platform to promote
OUTLOOK EAST LEPPINGTON
 OUTLOOK EAST LEPPINGTON A CONTEXT ON BUSINESS, CULTURE, LIFESTYLE AND RESIDENTIAL Located within the rapidly expanding South West Growth Centre of Sydney, the East Leppington Precinct is well positioned
For personal use only
 3Q15 Stockland Update Implementing our Strategy Isles of Newport, Brisbane Agenda Topic Page Group Update 03 Commercial Property 05 Residential 09 Retirement Living 10 Summary and Outlook 11 2 Group Update
HALF YEARLY RESULTS TO 30 JUNE Scentre Group Limited ABN All amounts in Australian dollars unless otherwise specified
 HALF YEARLY RESULTS TO 30 JUNE 2015 Scentre Group Limited ABN 66 001 671 496 All amounts in Australian dollars unless otherwise specified The financial information included in this release is based on
ASCOT SUBURB PROFILE
 ASCOT SUBURB PROFILE CONTENTS SUBURB HIGHLIGHTS 2 3 4 4 5 5 ASCOT & SURROUNDS LOCATION & LIFESTYLE DEMOGRAPHICS EMPLOYMENT FUTURE INFRASTRUCTURE WA MARKET TRENDS ACCESSIBILITY ENTERTAINMENT & RECREATION
GOLD COAST HOUSING REPORT SNAPSHOT
 GOLD COAST HOUSING REPORT SNAPSHOT Few cities have expanded like the Gold Coast. The once iconic surfing Mecca and holiday destination has grown to become the 6th largest city in Australia with a population
INTRODUCING BRAND NEW APARTMENTS SITUATED IN ONE OF SOUTH EAST QUEENSLAND S FASTEST GROWING AREAS.
 L O G A N H O L M E INTRODUCING BRAND NEW APARTMENTS SITUATED IN ONE OF SOUTH EAST QUEENSLAND S FASTEST GROWING AREAS. Maddison features a mixture of one and two bedroom affordable apartments conveniently
O P P O R T U N I T I E S C U R R E N T L Y A V A I L A B L E
 2 2 O P P O R T U N I T I E S C U R R E N T L Y A V A I L A B L E F R A N C H I S E O P P O R T U N I T I E S T A K E T H E F I R S T S T E P T O B E C O M I N G A S A N D W I C H C H E F S F R A N C H
it s your meeting place
 MEET ME it s your meeting place MEET ME AT HALLS HEAD CENTRAL The $54 million redevelopment of Halls Head Central will transform the existing centre into a vibrant shopping destination, taking advantage
moonee ponds A RICH RETAIL
 moonee ponds A RICH RETAIL HISTORY situated 7 km north-west from Melbourne s Central Business District, Moonee Ponds is very much an urbane, cosmopolitan pocket of the city s retail landscape. This elegant
Lend Lease Investment Management Australia
 Lend Lease Investment Management Australia Tarun Gupta CEO Australia Lend Lease Investment Management Appropriate photo Market Update May 2007 Australian Business Overview: Funds Under Management (FUM)
Investor Report. Connecting the best of both worlds
 Investor Report Connecting the best of both worlds Executive summary Project & display address 1015 Pacific Highway, Roseville, NSW 2069 Project description Rose is a mixed-use development located within
JB Hi-Fi Limited. Macquarie Equities 2004 Emerging Leaders Conference May 2004 Richard Uechtritz - CEO
 JB Hi-Fi Limited Macquarie Equities 2004 Emerging Leaders Conference May 2004 Richard Uechtritz - CEO Contents 1 2 3 4 5 6 7 JB Hi-Fi Background Industry Overview Business Model & Customer Proposition
your nearest location
 south east qld your nearest location BRIBIE ISLAND Bribie Island Shopping Centre, outside Target 07 3408 0644 CHERMSIDE Westfield Chermside, next to Big W 07 3350 1140 DALBY Dalby Shoppingworld, located
SUBURBPROFILE POPULATION TO DOUBLE OV E RVIE W CITY OF WY ND H AM FORECAST POPULATION WYNDHAM CITY COUNCIL
 TA R NI E T 1 SUBURBPROFILE The suburb is located within the boundaries of the City of Wyndham which is one of the fastest growing municipalities in Victoria and the third fastest in Australia. OV E RVIE
QUARTERLY UPDATE 31 MARCH 2017
 AUSTRALIAN PROPERTY OPPORTUNITIES FUND QUARTERLY UPDATE 31 MARCH 2017 The Australian Property Opportunities Fund (APOF I or the Fund) is pleased to provide this update for the March quarter 2017 (Q1 2017)
Suburb Profile 200,000 53,000 MARSDEN POPULATION GROWTH LOCATION POPULATION AND DEMOGRAPHICS TRANSPORT AND ACCESSIBILITY MARSDEN
 A DIVISION OF Suburb Profile LOCATION The suburb of Marsden is located approximately 30 minutes from the CBD within the boundaries of the Logan City Council which is one of the largest and fastest growing
OUTLOOK REDBANK PLAINS A CONTEXT ON BUSINESS, CULTURE, LIFESTYLE AND RESIDENTIAL
 OUTLOOK REDBANK PLAINS A CONTEXT ON BUSINESS, CULTURE, LIFESTYLE AND RESIDENTIAL Located within seven minutes of the Springfield CBD and 30 minutes of the Brisbane CBD, Redbank Plains proximity to major
Celebrating local resilience and sustainability in the ACT and surrounds. EVENT SNAPSHOT AIMS OF THE ACT PERMACULTURE FESTIVAL
 Celebrating local resilience and sustainability in the ACT and surrounds. EVENT SNAPSHOT The ACT Permaculture Festival will be a celebration of local resilience and sustainability in the ACT and Capital
INFORMATION MEMORANDUM Fairfield Central Townsville NOW LEASING STAGE 2
 INFORMATION MEMORANDUM Fairfield Central Townsville NOW LEASING STAGE 2 Fairfield Central is a bustling suburban shopping centre located in Idalia, just 7km from Townsville CBD. Introduction Currently
NORTH WEST GROWTH CENTRE
 OUTLOOK NORTH WEST GROWTH CENTRE A CONTEXT ON BUSINESS, CULTURE, LIFESTYLE AND RESIDENTIAL The North West Growth Centre is an emerging residential market that is expected to benefit from strong infrastructure
ANNUAL RESULT PROPERTY COMPENDIUM
 217 ANNUAL RESULT PROPERTY COMPENDIUM CONTENTS Retail Portfolio 3 GWSCF Portfolio 18 Office Portfolio 35 GWOF Portfolio 5 Logistics Portfolio 83 217 ANNUAL RESULT RETAIL PORTFOLIO Casuarina Square Northern
The World Loves Melbourne. Digital Media Kit September 2016
 The World Loves Melbourne Digital Media Kit September 2016 Site Overview The World Loves Melbourne is a popular PR Company and awarded premium Melbourne food, travel and lifestyle website. Part of exclusive
The World Loves Melbourne. Digital Media Kit July 2017
 The World Loves Melbourne Digital Media Kit July 2017 Site Overview The World Loves Melbourne is a popular PR Company and awarded premium Melbourne food, travel and lifestyle website. Top Australian Travel
Connected to memories. And the future.
 Connected to memories. And the future. Remember what it was like when you were a kid? How you used to play outdoors with the other kids from your street without a care in the world. It seems like a simpler
11 JORL COURT, BUDERIM
 11 JORL COURT, BUDERIM 2 & 3 BEDROOM TOWNHOUSES Located in the centre of the education precinct, 11 Jorl Court presents a great buying opportunity for anyone wishing to get into the housing market or
where memories grow Its a place to be part of a new neighbourhood, enjoy the family, explore the central parklands and create new friendships.
 where memories grow From the very outset, Frasers Property Australia s planning for The Rise focused on creating a family friendly neighbourhood where everyone can enjoy an active, outdoor lifestyle. With
June TEQ Marketing Strategy 2025 Executive Summary
 June 2017 TEQ Marketing Strategy 2025 Executive Summary Vision and The Opportunity Tourism and Events Queensland s (TEQ) Marketing Strategy 2025 provides a platform to realise the TEQ vision of inspiring
Marketing Partnership Proposal
 22 nd july 2017 Marketing Partnership Proposal 2017 Luna Park Hot Dog Day The annual Luna Park Hot Dog Day featuring Australia s Biggest Hot Dog Eating Competition is just one of our marquee events, which
AWARDS SPONSORSHIP PROPOSAL
 AWARDS SPONSORSHIP PROPOSAL SYDNEY FISH MARKET PTY LTD SFM auctions more than 100 species daily which it sources both nationally and internationally. In the 2015/2016 financial year, SFM traded more than
Sponsorship & Exhibition Opportunities
 ACC National Conference 2018 14-16 November Brisbane Convention & Exhibition Centre Sponsorship & Exhibition Opportunities X Partner Invitation to Partner The ACC Australia National Conference is a unique
South East Queensland
 South East Queensland Introducing Mango Hill 1 www.capitalwealth.net.au Table of Contents Welcome to Mango Hill..........3 Map..4 Demographics... 5 Growth........11 Infrastructure.........13 In the News...16
30 April The Manager Company Announcements Office ASX Limited Level 4, Exchange Centre 20 Bridge Street SYDNEY NSW 2000.
 30 April 2009 The Manager Company Announcements Office ASX Limited Level 4, Exchange Centre 20 Bridge Street SYDNEY NSW 2000 Westfield Group Level 24, Westfield Towers 100 William Street Sydney NSW 2011
DIGITAL SCREEN EVENT ADVERTISING NETWORK. 273 Wellington St, Collingwood VIC
 DIGITAL SCREEN EVENT ADVERTISING NETWORK 273 Wellington St, Collingwood VIC 3066 +61 3 9417 7008 www.mrmoto.com.au (Location: Melbourne Visitor Centre) Mr Moto have been promoting arts, events, attractions
THE CHEF S TABLE EVENT
 THE CHEF S TABLE EVENT Held in one of London s most popular event venues, the Business Design Centre, Islington, The Chef s Table Event will offer a range of unique learning and dining experiences. With
SOVEREIGN PARK. An Exclusive Investment Opportunity. Brassall, QLD Located in Australia's Fastest Growing City. Creating Cashflow Through Property
 An Exclusive Investment Opportunity Located in Australia's Fastest Growing City Sovereign Park Estate Sovereign Park Estate is an exclusive opportunity for investors to secure pre-construction pricing
SPONSORSHIP OPPORTUNITIES. February 2016
 SPONSORSHIP OPPORTUNITIES February 2016 LET YOUR BRAND CELEBRATE WITH THE COMMUNITY OF WA THE IGA PERTH ROYAL SHOW The IGA Perth Royal Show is a not-for-profit event that preserves and promotes our heritage,
SPACE+ MACQUARIE CORPORATE PARK 8 KHARTOUM ROAD, MACQUARIE PARK
 SPACE+ MACQUARIE CORPORATE PARK 8 KHARTOUM ROAD, MACQUARIE PARK OVERVIEW 2 Opportunity Macquarie Corporate Park is an ideal option for businesses looking for a convenient location with excellent transport
AQUATIC AND COASTAL CAMPAIGN. Overview page 1. Research page 2. Objectives page 3. Audience page 3. Creative idea page 3. Campaign pillars page 4
 AQUATIC AND COASTAL CAMPAIGN Overview page 1 Research page 2 Objectives page 3 Audience page 3 Creative idea page 3 Campaign pillars page 4 Creative delivery page 4 Campaign overview 'There s nothing like
DOREEN SUBURBPROFILE. Source: Resolution Research - The State of Victoria January 2015
 1 The City of Whittlesea is one of the fastest growing local government areas in Australia, with Doreen identified as one of the principal suburbs to cater for this growth. OVERVIEW Doreen is located approximately
Introduction. It provides travellers a unique high value
 Press Kit Introduction Discover Australia s newest and coolest accommodation in Western Sydney. Innovative technology and edgy design, Atura Blacktown is set to be the talk of Sydney s West. Located in
ARCHITECTURE. BUILDING. CONSTRUCTION. DESIGN.
 2-4 MAY 2018 MELBOURNE CONVENTION & EXHIBITION CENTRE ARCHITECTURE. BUILDING. CONSTRUCTION. DESIGN. Be part of the ultimate industry event connecting Australia's architecture, building, construction and
Gateway Plaza Leopold, VIC
 Economic Impact Assessment for Future Expansion Updated with discussion of Stages 1 & 2 May 2012 MacroPlan Dimasi MELBOURNE Level 4 356 Collins Street Melbourne VIC 3000 (03) 9600 0500 BRISBANE Level 15
About Ario. The vision for Market Square Wilsonton is to redefine shopping centre traditions and create an exciting new consumer experience.
 MEET. EAT. SHOP The vision for Market Square Wilsonton is to redefine shopping centre traditions and create an exciting new consumer experience. Creating a new sub-regional shopping centre concept, Market
MOUNT GRAVATT KEY DRIVER OVERVIEW
 MOUNT GRAVATT KEY DRIVER OVERVIEW PREPARED FOR OPALYN SEPTEMBER 2017 WALKABILITY & ACCESSIBILITY 12 19 11 08 20 07 Macgregor 16 PACIFIC MOTORWAY SOUTH EAST BUSWAY 23 01 21 LOGAN ROAD 22 Brisbane contains
THE GATEWAY TO THE SOUTH WEST.
 LIFE S A BREEZE. Live in the heart of a living, breathing community where everything you need is already in abundance. Experience a master planned neighbourhood with a real sense of place a stone s throw
STONES CORNER SUBURBPROFILE. Situated three kilometres from the Brisbane CBD, Stones Corner is located within one of Brisbane s key growth areas.
 1 SUBURBPROFILE Situated three kilometres from the Brisbane CBD, Stones Corner is located within one of Brisbane s key growth areas. OVERVIEW Situated three kilometres from the Brisbane CBD, Stones Corner
LIVE YOUR LIFE AT THE TOP
 Holmview EXECUTIVE SUMMARY The new masterplanned community of Haven Hill is where you can find space to expand your horizons and look to a rewarding future through investing in a growing, family - friendly
THE HEART OF A VIBRANT COMMUNITY
 THE HEART OF A VIBRANT COMMUNITY Newton Apartments redefine contemporary living in Melbourne s west, where everything you need is right at your doorstep. Generous 1 and 2 bedroom apartments will occupy
MIRVAC GROUP HOSTS INVESTOR TOUR
 29 November 2016 MIRVAC GROUP HOSTS INVESTOR TOUR Mirvac Group is hosting investors on a tour of four of its retail centres in Sydney. Attached is a copy of the accompanying tour book. For more information,
Woking. Shopping. media sheet. access.
 Woking Shopping media sheet Woking is approximately 24 minutes from Waterloo station at the southwestern edge of the Greater London Urban Area. The town has one of the most affluent catchment areas in
A NEW PARADIGM IN RETAIL
 MALL OF QATAR W.L.L. Al Jassim Building, 9th Floor Al Meena Street, Old Salata PO Box 201184 Doha, Qatar Tel: +974 4429 7979 Fax: +974 4429 2244 info@mallofqatar.com.qa www.mallofqatar.com.qa A NEW PARADIGM
REGATTA MEWS DUE DILIGENCE PROJECT REPORT REGATTA MEWS
 REGATTA MEWS DUE DILIGENCE PROJECT REPORT R M REGATTA MEWS REGATTA MEWS PROJECT DETAILS PROJECT: Regatta Mews, Wurtulla LOCATION: Lot 1888, Nicklin Way (corner of Regatta Boulevard) Wurtulla, QLD 4575
Suburb Profile 5,795 PER REDBANK PLAINS POPULATION FORECAST TO TRIPLE 461,990 BY 2031 DEMAND FOR NEW DWELLINGS LOCATION POPULATION & DEMOGRAPHICS
 Suburb Profile LOCATION Redbank Plains is located 30 kilometres west of the heart of Brisbane s CBD, in the Local Government Area (LGA) Ipswich City. Ipswich City is one of Queensland s fastest growing
4countries. We understand the fundamentals. A trusted partner. We have delivered million sqm. 1.8 million car spaces.
 A trusted partner Multiplex is a trusted partner for all types of retail projects from Greenfield developments to refurbishments and vibrant mixed-use precincts, in both cities and regional locations.
BUSINESS PARK. 8 Parkview Drive, Sydney Olympic Park FOR LEASE
 1 2 4 3 BUSINESS PARK 8 Parkview Drive, Sydney Olympic Park OFFICE SPACE available FOR LEASE Imagine a workplace within a world class business park providing an ambiance which promotes greater productivity
Perth Convention and Exhibition Centre Perth, Western Australia EXHIBITORS & SPONSORS
 4-5 August 2018 9.30am to 4.30pm Perth Convention and Exhibition Centre Perth, Western Australia EXHIBITORS & SPONSORS ABOUT the expo The Western Australian Care and Ageing Expo is a showcase of the products,
BEACHSIDE ON THE PARK
 Built better. BEACHSIDE ON THE PARK Due Diligence Project Report (07) 5370 1800 info@builtbetter.com.au builtbetter.com.au 1 builtbetter.com.au WELCOME TO BEACHSIDE Beachside on the park has been Constructed
INFLUENTIAL BUYERS AT AUSTRALIA S LEADING INDUSTRY EVENT
 14 16 MAY 2019 ACCESS INTERNATIONAL CONVENTION CENTRE SYDNEY INFLUENTIAL BUYERS AT AUSTRALIA S LEADING INDUSTRY EVENT ARCHITECTURE BUILDING CONSTRUCTION DESIGN designbuildexpo.com.au 7,000+ VISITING PROFESSIONALS
POSITIVE + OUTLOOK PRECINCT CORPORATE CENTRE 1 RICHARDSON PLACE, NORTH RYDE, NSW
 POSITIVE + OUTLOOK PRECINCT CORPORATE CENTRE 1 RICHARDSON PLACE, NORTH RYDE, NSW OVERVIEW 2 Opportunity The Precinct Corporate Centre provides a positive and flexible space to work, offering great accessibility
NOW LEASING FOOD AND BEVERAGE OPPORTUNITIES
 NOW LEASING FOOD AND BEVERAGE OPPORTUNITIES Right in the heart of Perth s CBD, Yagan Square will be one of the city s most popular meeting and celebration places and a major tourist destination. At just
PIMPAMA JUNCTION SHOPPING VILLAGE QUEENSLAND NOW LEASING INFORMATION MEMORANDUM. Your New Local
 QUEENSLAND NOW LEASING Your New Local WELCOME TO PIMPAMA JUNCTION SHOPPING VILLAGE OVERVIEW Situated only 35 minutes south of Brisbane CBD and 25 minutes north of Surfers Paradise, Pimpama Junction Shopping
Visit West Lothian Strategic Action Plan
 Visit West Lothian Strategic Action Plan Visit West Lothian in association with West Lothian Council Visit West Lothian s Mission, Vision & Values Our Vision is: To position West Lothian as a desirable
10,100 People reside in North Perth
 ACTION PLAN THE HISTORY TODAY North Perth was subdivided as early as 1898. In March 1899, the area was declared North Perth Road District and was gazetted as a municipality in 1901. Housing in the area
Domestic High Value Traveller Profiles May 2018
 Domestic High Value Traveller Profiles May 2018 TEQ Domestic Target Market High Value Travellers (HVTs) In order to achieve our goals of gaining market share and increasing overnight visitor expenditure
WHY INVEST IN QUEENSLAND URBIS MARKET OUTLOOK
 WHY INVEST IN QUEENSLAND URBIS MARKET OUTLOOK WHO IS URBIS? PERTH AUSTRALIA ADELAIDE BRISBANE GOLD COAST SYDNEY MELBOURNE Urbis is an integrated multi-disciplinary consulting firm with a unique and comprehensive
A connected community.
 AVJennings communities work really well because they care about people. Not only are there great houses and you get a great variety of choices, but the facilities around those houses are incredible. Great
IN FOCUS NSW. Developing Western Sydney
 IN FOCUS NSW Developing Western Sydney DEVELOPING WESTERN SYDNEY Introduction Western Sydney is one of the fastest growing regions in Australia. Traditionally infrastructure expenditure and development
Located on the banks of the Pine River, Griffin Pocket is part of a region that has been rated as one of Brisbane s greenest suburbs.
 Location Griffin Pocket is perfectly positioned for a family-friendly lifestyle at the doorstep of Moreton Bay. Located on the banks of the Pine River, Griffin Pocket is part of a region that has been