IATA Airline Operational Cost Task Force (AOCTF) Klemen Ferjan, MBA Consultant, IATA Operations
|
|
|
- Geoffrey Riley
- 5 years ago
- Views:
Transcription
 1 Airline Cost Conference Montreal - March 6, 2013 Geneva August")
1 IATA Airline Operational Cost Task Force (AOCTF) Klemen Ferjan, MBA Consultant, IATA Operations Maintenance Cost Task Force (MCTF) 1 Airline Cost Conference Montreal - March 6, 2013 Geneva August 30, 2013

2 Facts & Figures to make us proud Air Transport is one of those industries that has transformed the world 19 a major contributor to global economic prosperity th in the World a major global employer provides significant social benefits 57 million 3.5x From 130 weeks to 1.7 weeks And will continue to provide jobs remain a vital component of modern life, a force for good 82 million 6 billion 6.9 trillion Source: Air Transport Action Group 2
3 And yet The worldwide airline industry has generated an average annual post-tax profit of just 0.1% of revenues between 1970 and 2010! (source ICAO, IATA) Although post-tax profit is slowly improving it still doesn t cover cost of capital Airline Cost Task Force (AOCTF) 3 AOCTF strives to improve the bottom line through effective cost management
4 AOCTF Mission & Objectives Mission: To share operational cost management best practices while providing an industry platform for effective cost benchmarking. Objectives: Support the industry efforts to better understand cost drivers & trends, manage operational costs Refine and standardize definitions and methods from a management accounting perspective Provide AOCTF members with an annual report, analyzing major cost drivers, identifying industry trends Increase the number of participating airlines, ensure greater data diversity Airline Operational Cost Task Force (AOCTF) 4

")
5 AOCTF Team IATA Operations, Montreal Chris Markou, Assistant Director Geraldine Cros, Operational Cost Manager Klemen Ferjan, Consultant Paris Dastjerdi, Intern Airline Operational Cost Task Force (AOCTF) 5
6 Steering Committee Formed in 2013, consists of 6 airline members: Chairman, Richard W. Creagh, UIA Vice-Chairman, Josua du Plessis, SAA Valdimar Bjornsson, Primera Air Hassan Ali, Egyptair Carlos Ramirez, Air Canada Nihat Cevik, Turkish Airlines Airline Operational Cost Task Force (AOCTF) 6

7 AOCTF FY2012 Process Data Collection Data Validation & Consolidation Analysis Report Airline Operational Cost Task Force (AOCTF) 7

8 Data Collection Various channels Current AOCTF members Personal contacts Steering Committee s network Promoting at Conferences, Symposiums, Seminars, etc. Back and forth communication Resulted in submissions from 30 Airlines Airline Operational Cost Task Force (AOCTF) 8

9 Data Validation & Consolidation The fun part! Data Check within the Excel file Back and forth communication Consolidation in one large Excel file More data checking with Qlikview More back and forth communication Airline Operational Cost Task Force (AOCTF) 9
10 Analysis Identified Cost Drivers Grouped data into several metrics to measure the effect of cost drivers Provided benchmarking on KPIs with disclaimer: Study is to inspire discussions around the cost drivers and cost elements NOT meant to derive direct comparisons as every airline operates in unique environment Airline Operational Cost Task Force (AOCTF) 10
")
11 Report Introduction Airline Industry Landscape 2012 Overview of the AOCTF Airlines Yearly Trends Analysis Operational Cost Analysis Focus on Fuel Cost Aircraft Type Analysis Detailed Analysis of B737NG and A320 family Airline Operational Cost Task Force (AOCTF) 11
 12")
12 Key highlights from the Report Airline Operational Cost Task Force (AOCTF) 12

13 Productivity Airline Operational Cost Task Force (AOCTF) 13

14 Revenue size indicated against RASK and CASK AOCTF 14
 64.6% 66.8% +2.2 pt 65.0% -1.8 pt 65.9% +0.9 pts Revenue Passenger Km (RPK) 312.4 Bil 327.1 Bil 4.7% 349.7 Bil 6.9% 380.6 Bil 8.")
15 Yearly Trends Analysis Change (%) 2011 Change (%) 2012 Change (%) Revenue Tonne Km (RTK) 39.6 Bil 42.7 Bil 7.6% 45.3 Bil 6.1% 49.6 Bil 9.5% Available Tonne Km (ATK) 61.4 Bil 63.9 Bil 4.1% 69.7 Bil 9.0% 75.3 Bil 8.1% Weight Load Factor (WLF) 64.6% 66.8% +2.2 pt 65.0% -1.8 pt 65.9% +0.9 pts Revenue Passenger Km (RPK) Bil Bil 4.7% Bil 6.9% Bil 8.8% Available Seat Km (ASK) Bil Bil 1.3% Bil 8.6% Bil 6.1% Passenger Load Factor (PLF) 72.9% 75.3% +2.4 pts 74.1% -0.8 pts 76.1% +2.0 pts Average Fleet Age (Years) % % % Total Flight Hour Mil Mil 4.3% Mil 8.0% 3.0 Mil 7.8% Total Flight Cycle K K 3.5% Mil 6.5% 1.1 Mil 9.9% Total Operating Expenses (USD) $29.6 Bil $32.2 Bil 8.6% $38.7 Bil 20.4% 40.9 Bil 5.7% Total Operating Expenses/FH (USD) $12.1 K $12.6 K 4.1% $14.1 K 11.5% 13.8 K -2.0% Total Operating Expenses/ASK (US Cents) % % % Total Operating Expenses/ATK (US Cents) % % % Fuel Share of Total Ops. Expenses 32.7% 32.4% -0.3 pts 36.9% +4.5 pts 39.0% +2.1 pts Total Ops Expenses without Fuel/ASK (US Cents) % % % *Based on 15 recurrent airlines CASK cents CATK cents Airline Operational Cost Task Force (AOCTF) 15

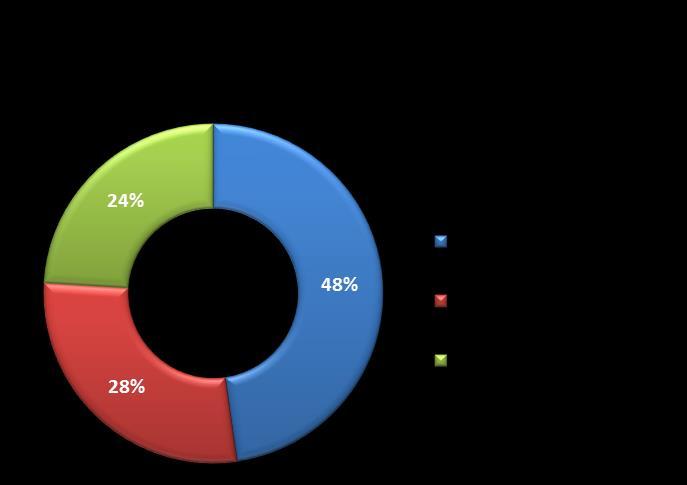
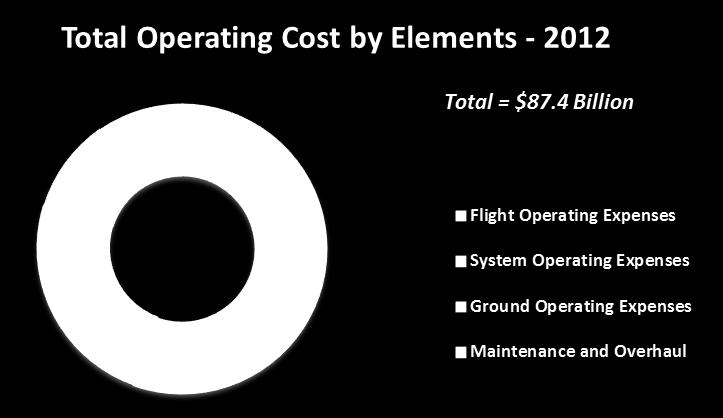
16 2012 Operational Cost Structure Airline Operational Cost Task Force (AOCTF) 16
17 Comparison with 6 Major US Airlines (DOT Form 41) 6 US Airlines (DOT Form 41) 2012 US Cents/ATK Comparison with AOCTF US Cents/ASK Comparison with AOCTF Fuel and Oil $35.6 Bil % % Maintenance and Overhaul $9.5 Bil % % General and Administrative $7.6 Bil % % Flight Deck Crew $5.4 Bil % % Reservation, Ticketing, Sales and Promotion $8.0 Bil % % Station and Ground $9.7 Bil % % Flight Equipment Depreciation $5.0 Bil % % Aircraft Rentals $5.5 Bil % % Airport Charges + Air Navigation Charges $8.8 Bil % % Passenger Service* + Cabin Attendants $8.4 Bil % % Other $2.0 Bil % % Total $105.5 Bil % % Airline Operational Cost Task Force (AOCTF) 17

18 Cost Grouping Airline Operational Cost Task Force (AOCTF) 18

19 Focus on Fuel Cost Airline Operational Cost Task Force (AOCTF) 19
20 Aircraft Type Analysis Fleet Type # Active Aircraft # of Airlines reporting B737 NG A320 Family B737 Classic B A B A B < 5 A < 5 Regional Jet* 90 5 * Combined fleet of EMB-170, EMB-190, and CRJ Flight Operations Flight Ops. $/AC Flight Ops. $/FH Flight Ops. $/FC Flight Ops. $/ASK (US Cents) Flight Ops. $/ATK (US Cents) B737 NG $13.3 Mil $4,152 $7, A320 Family $14.5 Mil $4,633 $9, B737 Classic $13.3 Mil $4,624 $6, B777 $48.6 Mil $11,220 $64, A330 $33.8 Mil $8,800 $38, B747 $43.1 Mil $13,975 $86, A340 $48.5 Mil $11,824 $88, B767 $33.8 Mil $8,002 $51, A380 $61.7 Mil $18,837 $181, Regional Jet* $8.8 Mil $3,437 $5, * Combined fleet of EMB-170, EMB-190, and CRJ Airline Operational Cost Task Force (AOCTF) 20


21 Detailed Analysis of A320 Family Airline Operational Cost Task Force (AOCTF) 21
22 Way Forward Does AOCTF provide a real value to YOU? Input: We need your comments and suggestions to improve Participation: AOCTF evolution indicates between 35 and 40 airlines will provide data FY2013, will you be among them? Involvement: AOCTF Steering Committee will increase after the Airline Cost Conference, will YOU be our new SC member? Airline Operational Cost Task Force (AOCTF) 22

23 More info on Thank you! Q/A Klemen FERJAN, MBA Consultant, IATA Operations
Airline Operational Cost Task Force (AOCTF) Airline Cost Management Group (ACMG) Klemen Ferjan, MBA Cost Management Consultant, IATA Operations
 Airline Cost Management Group (ACMG) Klemen Ferjan, MBA Cost Management Consultant, IATA Operations") Airline Operational Cost Task Force (AOCTF) Airline Cost Management Group (ACMG) Klemen Ferjan, MBA Cost Management Consultant, IATA Operations Maintenance Cost Task Force (MCTF) 1 Airline Cost Conference
Airline Operational Cost Task Force (AOCTF) Airline Cost Management Group (ACMG) Klemen Ferjan, MBA Cost Management Consultant, IATA Operations Maintenance Cost Task Force (MCTF) 1 Airline Cost Conference
Another Successful Year
 Another Successful Year Klemen Ferjan Manager, Airline Performance Metrics IATA ferjank@iata.org 1 Airline Cost Conference Geneva August 30-31, 2016 ACMG s Consistent Growth Value of ACMG ACMG Benchmark
Key Performance Indicators
 Key Performance Indicators The first section of this document looks at key performance indicators (KPIs) that are relevant in SkyChess. KPIs are useful as a measure of productivity, which can be sub-divided
FIRST QUARTER 2017 RESULTS. 4 May 2017
 FIRST QUARTER 2017 RESULTS 4 May 2017 A resilient start of the year, traffic up 4.2% 20.9 million passengers carried, up 5.2%, traffic (RPK) up 4.2%, capacity (ASK) up 3.3% and load factor up 0.7pts Confirmation
World Air Transport Statistics. Special AGM Edition WORLD AIR TRANSPORT SUMMIT
 World Air Transport Statistics Special AGM Edition WORLD AIR TRANSPORT SUMMIT 61 st IATA ANNUAL GENERAL MEETING TOKYO, 29-31 MAY 2005 World Air Transport Statistics Ref. No: 9011-AGM 2005 International
AIRLINE MAINTENANCE COST EXECUTIVE COMMENTARY
 AIRLINE MAINTENANCE COST EXECUTIVE COMMENTARY An Exclusive Benchmark Analysis (FY2016 data) by IATA s Maintenance Cost Task Force PUBLIC VERSION MCTF December 2017 Table of Contents Preliminary Remarks
1 st Airline Cost Conference. A Strategy for Survival and Success. Richard W. Creagh, AOCTF Chairman Executive Advisor Ukraine International Airlines
 1 st Airline Cost Conference A Strategy for Survival and Success Richard W. Creagh, AOCTF Chairman 1 Executive Advisor Ukraine International Airlines Montreal - March 6, 2013 Content Problems within the
Day 0 15:00. ACMG Steering Committee Meeting By invitation only IATA/ACMG Steering Committee Members
 Day 0 15:00 ACMG Steering Committee Meeting By invitation only IATA/ACMG Steering Committee Members Day one 8:30 9:00 9:15 9:30 10:00 10:30 11:00 11:45 12:00 Registration & Welcome Coffee Non-Competition
Standard aircraft cost comparisons Airline operating cost inputs Marketing investment data
 Standard aircraft cost comparisons Airline operating cost inputs Marketing investment data Seats Fly Away Price (USD m) MTOW (tonnes) Kg/BH Speed Kmph DMC Per cycle (USD) DMC Per FH (USD) Cabin crew (Base
SKYWEST, INC. ANNOUNCES THIRD QUARTER 2012 RESULTS
 NEWS RELEASE For Further Information Contact: Michael J. Kraupp Chief Financial Officer and Treasurer Telephone: (435) 634-3212 Fax: (435) 634-3205 FOR IMMEDIATE RELEASE: November 7, 2012 SKYWEST, INC.
Third Quarter 2014 Results. 29 October 2014
 Third Quarter 2014 Results 29 October 2014 Highlights of the Third Quarter Operating environment Air France-KLM Economic environment remains weak Further currency volatility affecting revenues and results
Investor Relations Update October 25, 2018
 General Overview Investor Relations Update Revenue The company expects its fourth quarter total revenue per available seat mile (TRASM) to be up approximately 1.5 to 3.5 percent year-over-year. Fuel Based
Air Transport Industry
 Air Transport Industry Structure, Economics, Operations Northwestern University Transportation Center April 28, 2016 Peter L. Smith Context The Presenter BA Harvard, MST Northwestern, MBA Foster School
First Half 2013 Results. 16 mai 2013
 First Half 2013 Results 16 mai 2013 26 July 2013 Results Increasing effects of Transform 2015 Highlights of the First Half A difficult global economic environment Transform 2015 plan roll-out on track
2012 Result. Mika Vehviläinen CEO
 2012 Result Mika Vehviläinen CEO 1 Agenda Market environment in Q4 Business performance and strategy execution Outlook Financials 2 Market Environment According to IATA, Global air travel continues to
Investor Relations Update January 25, 2018
 General Overview Investor Relations Update Accounting Changes On January 1, 2018, the company adopted two new Accounting Standard Updates: (ASUs): ASU 2014-9: Revenue from Contracts with Customers (the
Finnair 2015 kolmannen vuosineljänneksen tulos
 Finnair 215 kolmannen vuosineljänneksen tulos Q3 Result 215 3 October 215 3.1.215 Toimitusjohtaja Pekka Vauramo Talousjohtaja Pekka Vähähyyppä 1 Highlights of the quarter Excellent Q3 result: Record result
Key Highlights Q2/2018 Business result. July 2018
 Key Highlights Q2/2018 Business result July 2018 Disclaimer INFORMATION CONTAINED IN OUR PRESENTATION IS INTENDED SOLELY FOR YOUR REFERENCE. SUCH INFORMATION IS SUBJECT TO CHANGE WITHOUT NOTICE, ITS ACCURACY
Introduction: Airline Industry Overview Dr. Peter Belobaba Presented by: Alex Heiter & Ali Hajiyev
 Introduction: Airline Industry Overview Dr. Peter Belobaba Presented by: Alex Heiter & Ali Hajiyev Istanbul Technical University Air Transportation Management M.Sc. Program Network, Fleet and Schedule
Korean Air Lines Q Results & 2011 Business Plan. 27 Feb 2011
 Korean Air Lines 2010 4Q Results & 2011 Business Plan 27 Feb 2011 Disclaimer This presentation is for informational purposes only, contains preliminary financial and other information about Korean Air
Air China Limited 2015 First Quarter Results
 Air China Limited 2015 First Quarter Results April 2015 Under PRC GAAP, unaudited Agenda Part 1 Part 2 Part 3 Results Highlights Business Performance Financial Review Part 1 Results Highlights Results
Maintenance Cost Task Force (MCTF) FY2014 Data Preliminary Analysis GERALDINE CROS
 FY2014 Data Preliminary Analysis GERALDINE CROS") Maintenance Cost Task Force (MCTF) FY2014 Data Preliminary Analysis GERALDINE CROS Manager, Operational Cost Management IATA FY2014 Data Preliminary Analysis MCTF Data Collection & Analysis World Fleet
Maintenance Cost Task Force (MCTF) FY2014 Data Preliminary Analysis GERALDINE CROS Manager, Operational Cost Management IATA FY2014 Data Preliminary Analysis MCTF Data Collection & Analysis World Fleet
Korean Air Q Financial Results. Jul 28, 2011
 Korean Air 2011 2Q Financial Results Jul 28, 2011 Disclaimer This presentation is for informational purposes only, contains preliminary financial and other information about Korean Air Lines Co., Ltd.
PRESS RELEASE. First Half 2017 Financial Results Higher Load Factors and traffic lead to a significant rebound in second quarter profitability
 PRESS RELEASE First Half 2017 Financial Results Higher Load Factors and traffic lead to a significant rebound in second quarter profitability Kifissia, 12 September 2017 AEGEAN announces first half 2017
Finnair Q Result
 Finnair Q1 2015 Result 7 May 2015 CEO Pekka Vauramo, Interim CFO Mika Stirkkinen 1 Turbulent market environment The weakness of the Finnish economy continued to be reflected in the demand in the first
Q Fast growth continued, Comparable operating result at record high levels Pekka Vauramo
 2018 Fast growth continued, Comparable operating result at record high levels 17.7.2018 Pekka Vauramo 2 A good - Comparable operating result increased to new seasonal high Revenue Comparable operating
Gregg Gildemann Market Analysis
 Gregg Gildemann Market Analysis Boeing Commercial Airplanes 20 February 2018 The statements contained herein are based on good faith assumptions are to be used for general information purposes only. These
Industry perspective Current Market Outlook
 Industry perspective Current Market Outlook Sam Bolooki Director International Business Development & Programs Boeing Global Air Traffic Management Oct. 2013 Agenda Aviation industry 20-year commercial
ICAO Forecasts for Effective Planning and Implementation. Sijia Chen Economic Development Air Transport Bureau, ICAO
 ICAO Forecasts for Effective Planning and Implementation Sijia Chen Economic Development Air Transport Bureau, ICAO Appendix C : Forecasting, planning and economic analyses The Assembly: Requests the Council
MEDIA/ANALYST PRESENTATION FY RESULTS 11 MAY 2007
 MEDIA/ANALYST PRESENTATION FY2006-07 RESULTS 11 MAY 2007 SIA GROUP FY2006-07 07 RESULTS GROUP REVENUE FY2006/07 ($ million) ($ million) 15,000 14,494 14,000 13,000 12,000 11,000 10,515 12,013 13,341 Record
Finnair Q Result
 Finnair Q2 2015 Result 14 August 2015 CEO Pekka Vauramo, Interim CFO Mika Stirkkinen 1 Market environment shows signs of improvement There were signs of a recovery in the demand for consumer and business
JET AIRWAYS (I) LTD. Presentation on Financial Results Q4 FY08
 LTD. Presentation on Financial Results Q4 FY08") JET AIRWAYS (I) LTD Presentation on Financial Results Q4 FY08 June 24, 2008 1 1 1 Agenda Domestic operating environment Jet Airways performance highlights JetLite performance highlights Consolidated Jet
JET AIRWAYS (I) LTD Presentation on Financial Results Q4 FY08 June 24, 2008 1 1 1 Agenda Domestic operating environment Jet Airways performance highlights JetLite performance highlights Consolidated Jet
THIRD QUARTER 2016 RESULTS. 3 November 2016
 THIRD QUARTER 2016 RESULTS 3 November 2016 Highlights of the Third Quarter 2016 Environment Operations Financial highlights Strong increase in airline industry capacity Terrorist attacks in Europe resulting
Cost Cutting for Success: Factors Influencing Costs
 Cost Cutting for Success: Factors Influencing Costs Dr George Williams Reader in Airline Economics Unit Cost (pence per ASK) in 2005/6 12 10 8 6 4 2 0 BA Connect Flybe easyjet Virgin Atlantic Monarch Astraeus
JUNE 2016 GLOBAL SUMMARY
 JUNE 2016 GLOBAL SUMMARY FAST FACTS The world of air transport, 2014 All figures are for 2014, unless otherwise stated, to give a single set of data for one year. Where available, the latest figures are
Airlines across the world connected a record number of cities this year, with more than 20,000 city pair connections*
 1 Airlines across the world connected a record number of cities this year, with more than 20,000 city pair connections*. This is a 1,351 increase over 2016 and a doubling of service since 1996, when there
SIA GROUP FINANCIAL RESULTS
 FINANCIAL RESULTS For Ended 30 June 2018 197200078R Operating Result Q1 Q1 Better/ FY18/19 FY17/18 R1 (Worse) ($M) ($M) (%) Total Revenue 3,844 3,864 (0.5) Q1 Better/ FY17/18 R2 (Worse) ($M) (%) 3,689
IATA FUEL EFFICIENCY CAMPAIGN
 IATA FUEL EFFICIENCY CAMPAIGN Juergen Haacker Director, Operations Montreal, IATA Fuel Efficiency Campaign Jet fuel price driving airline fuel efficiency Increased 5% from 2003-2005 Industry is on track
First Quarter Results August 31 st, 2006
 First Quarter Results 2006-07 August 31 st, 2006 Key features of the First Quarter Market context Sustained global economic growth, and a recovery in Europe Average jet fuel price of 691 $/t, up 25% year-on-year
Fourth Quarter and Full Year 2011 Results Presentation. February 1, 2012
 Fourth Quarter and Full Year 2011 Results Presentation February 1, 2012 This presentation may include forward-looking comments regarding the Company s business outlook and anticipated financial and operating
Air China Limited Interim Results. August Under IFRS
 Air China Limited 21 Interim Results Under IFRS August 21 1 Agenda 21 Interim Results Overview Business Overview Financial Overview Outlook 2 2 2 21 Interim Results 3 21 Interim Results Overview 4 4 4
KOREAN AIR 4Q17 FINANCIAL RESULTS
 KOREAN AIR 4Q17 FINANCIAL RESULTS 1 Disclaimer This presentation is for informational purposes only, contains preliminary financial and other information about Korean Air Lines Co., Ltd. and is subject
Paperless Aircraft Operations - IATA s Vision and Actions - Chris MARKOU IATA Operational Costs Management
 Paperless Aircraft Operations - IATA s Vision and Actions - Chris MARKOU IATA Operational Costs Management IATA s Paperless Initiatives Passenger Reservations, Ticketing and Airport Processes e-ticketing
FIRST QUARTER RESULTS 2016
 FIRST QUARTER RESULTS 2016 KEY RESULTS In 1Q16 Interjet total revenues added $3,850.8 million pesos that represented an increase of 21.9% over the income generated in the 1Q15. In 1Q16 total passengers
AACO Members Quick Facts 2013
 2014 AACO Members Quick Facts 2013 Member Airlines 32 Billion $ Revenue (+10.0% over 2012) 49.5 Million Passengers Carried (+7.5% over 2012) 153 Million Tonnes of Cargo (+11.6% over 2012) 4.8 Destinations
THE FUNDAMENTALS OF ROUTE DEVELOPMENT UNDERSTANDING AIRLINES MODULE 3
 THE FUNDAMENTALS OF ROUTE DEVELOPMENT UNDERSTANDING AIRLINES AIRLINE ISSUES Low margins Fuel price uncertainty Vulnerability to economic downturn Unpredictable one-time events High profits of airports
Steve Hahn. Current Market Outlook. Director, Japan Enterprise Technology Programs. Boeing Commercial Airplanes July 2014.
 Current Market Outlook 2015 Boeing Commercial Airplanes July 2014 The statements contained herein are based on good faith assumptions and are to be used for general information purposes only. These statements
Introduction to IATA
 Introduction to IATA Founded in 1945 Travel Agency Community of 90,000 offices Plays a vital and central in airline product distribution IATA Mission: to represent, lead and serve the airline industry
Economic Performance of the Airline Industry
 Economic Performance of the Airline Industry Airline Cost Conference 25 th August 2015 Brian Pearce, Chief Economist www.iata.org/economics To represent, lead and serve the airline industry number of airlines
Air China Limited 2014 Annual Results Under IFRS
 Air China Limited 2014 Annual Results Under IFRS March 2015 Agenda Part 1 Results Highlights Part 2 Business Overview Part 3 Financial Overview Part 4 Outlook Part 1 Results Highlights Gradual Global Economic
Part 1 Performance Highlights. Part 2 Business Overview. Part 3 Financial Review
 August 216 1 Part 1 Performance Highlights Part 2 Business Overview Part 3 Financial Review Part 4 Outlook 2 Under IFRS 3 Part 1 Performance Highlights Performance Highlights - Key Operational Metrics
Introduction. Airline Economics. Copyright 2017 Boeing. All rights reserved.
 Introduction Airline Economics The statements contained herein are based on good faith assumptions and provided for general information purposes only. These statements do not constitute an offer, promise,
Airline Operating Costs Dr. Peter Belobaba
 Airline Operating Costs Dr. Peter Belobaba Istanbul Technical University Air Transportation Management M.Sc. Program Network, Fleet and Schedule Strategic Planning Module 12: 30 March 2016 Lecture Outline
Finnair Q Result
 17 August 2016 CEO Pekka Vauramo CFO Pekka Vähähyyppä Finnair Q2 2016 Result 1 Highlights of the second quarter The seventh consecutive quarter of profit improvement Fukuoka & Guangzhou route openings
CONTACT: Investor Relations Corporate Communications
 NEWS RELEASE CONTACT: Investor Relations Corporate Communications 435.634.3200 435.634.3553 Investor.relations@skywest.com corporate.communications@skywest.com SkyWest, Inc. Announces Fourth Quarter 2017
Statement of continued support by the Chief Executive Officer (CEO)
") General Period covered by your Communication on Progress (COP) for Qatar Airways: From: Sept. 2009 To: Sept. 2011 Statement of continued support by the Chief Executive Officer (CEO) I am pleased to confirm
General Period covered by your Communication on Progress (COP) for Qatar Airways: From: Sept. 2009 To: Sept. 2011 Statement of continued support by the Chief Executive Officer (CEO) I am pleased to confirm
Tiger Airways Holdings Limited FY11 Results
 Tiger Airways Holdings Limited FY11 Results May 2011 Financial Year Ended 31 March 2011 Disclaimer The information contained in this presentation (the "Information") is provided by Tiger Airways Holdings
Air China Limited Annual Results. March Under IFRS
 Air China Limited 21 Annual Results Under IFRS March 211 Agenda Part 1 Highlights Part 2 Business Overview Part 3 Financial Overview Part 4 Outlook 2 Part 1 Highlights Steady Economic Growth; Asia Pacific
37 Operating Profit (or Loss) ( 32) ( 124)
 ( 32) ( 124)") MAJOR UNITED KINGDOM AIRLINES INDIVIDUAL AIRLINE PROFIT AND LOSS ACCOUNT 1999 ($000) British Air Foyle Airways Air Air Passenger Consolidated 2000 Foyle Airlines Ltd Financial Year Ended 31.03.00 31.10.99
MAJOR UNITED KINGDOM AIRLINES INDIVIDUAL AIRLINE PROFIT AND LOSS ACCOUNT 1999 ($000) British Air Foyle Airways Air Air Passenger Consolidated 2000 Foyle Airlines Ltd Financial Year Ended 31.03.00 31.10.99
Adjusted net income of $115 million versus an adjusted net loss of $7 million in the second quarter of 2012, an improvement of $122 million
 Air Canada Reports Record Second Quarter 2013 Results Highest Adjusted Net Income, Operating Income and EBITDAR Results for Second Quarter in Air Canada s History Adjusted net income of $115 million versus
Compustat. Data Navigator. White Paper: Airline Industry-Specifi c
 Compustat Data Navigator White Paper: Airline Industry-Specifi c April 2008 Data Navigator: Airline Industry-Specific Data There are several metrics essential to airline analysis that are unavailable on
Air Canada reported an operating income of $63 million in the second quarter of 2012, a decline of $10 million from the second quarter of 2011.
 Air Canada Reports Second Quarter 2012 Results Second Quarter 2012 EBITDAR of $314 million Cash and short-term investments of $2.383 billion at June 30, 2012 MONTRÉAL, August 8, 2012 Air Canada recorded
Market Outlook. Michael Warner, Director Market Analysis. Boeing Commercial Airplanes October October 7 10, 2012 Atlanta, Georgia, USA
 Market Outlook Michael Warner Director, Market Analysis Boeing Commercial Airplanes October 2012 Agenda Aviation environment Current products Product strategy & development 2012 719 net orders through
Air Berlin PLC 15 th June, 2016 Annual General Meeting 2016 London
 Air Berlin PLC 15 th June, 2016 Annual General Meeting 2016 London Despite headwind, airberlin made good progress in 2015 RASK +3.7% Yield +2.0% Load Factor +0.7%pt Ancillary Revenues* +9.2% ASKs -5.4%
MAJOR UNITED KINGDOM AIRLINES INDIVIDUAL AIRLINE PROFIT AND LOSS ACCOUNT 1998 ($000) British Airways Air Air Consolidated 2000 Foyle
 British Airways Air Air Consolidated 2000 Foyle") MAJOR UNITED KINGDOM AIRLINES INDIVIDUAL AIRLINE PROFIT AND LOSS ACCOUNT 1998 ($000) British Airways Air Air Consolidated 2000 Foyle REVENUES Financial Year Ended 31.03.99 31.10.98 30.06.98 1 Scheduled
MAJOR UNITED KINGDOM AIRLINES INDIVIDUAL AIRLINE PROFIT AND LOSS ACCOUNT 1998 ($000) British Airways Air Air Consolidated 2000 Foyle REVENUES Financial Year Ended 31.03.99 31.10.98 30.06.98 1 Scheduled
Worldwide Market Forecast ( ) Prompt Report
 Prompt Report") Worldwide Market Forecast (2018 ) Prompt Report June 2018 Marketing Group Japan Aircraft Development Corporation Outline of the Worldwide Market Forecast Jets and turboprop Passenger jet 20 seats and above
Worldwide Market Forecast (2018 ) Prompt Report June 2018 Marketing Group Japan Aircraft Development Corporation Outline of the Worldwide Market Forecast Jets and turboprop Passenger jet 20 seats and above
SAS Group Q Teleconference
 SAS Group Q4 2012 Teleconference December 12, 2012 1 Break-even result in 2012 despite 1.6 bn SEK higher fuel cost 23 MSEK EBT (before non-recurring items) despite 1.6 bn SEK higher fuel cost Positive
Vietjet Aviation Joint Stock Company Key Highlights Q1/2018 Business result. April 2018
 Vietjet Aviation Joint Stock Company Key Highlights Q1/2018 Business result April 2018 Disclaimer INFORMATION CONTAINED IN OUR PRESENTATION IS INTENDED SOLELY FOR YOUR REFERENCE. SUCH INFORMATION IS SUBJECT
Growing Horizons Global Market Forecast
 Growing Horizons Global Market Forecast 2017-2036 John Leahy Chief Operating Officer, Customers Global Market Forecast 2017: Highlights World Fleet Forecast 2016 2036 RPK (trillions) 7.0 16.5 vs. GMF16
INVESTOR NEWSLETTER. Full Year 2013 Editions. PT Garuda Indonesia (Persero) Tbk. FY 2012 FY 2013 Change. Summary.
 Tbk. FY 2012 FY 2013 Change. Summary.") INVESTOR NEWSLETTER PT Garuda Indonesia (Persero) Tbk. Full Year 2013 Editions FY 2012 FY 2013 Change Financial Summary (USD Mio) OPERATING REVENUES 3,472 3,716 7.02% OPERATING EXPENSES 3,304 3,660 10.75%
INVESTOR NEWSLETTER PT Garuda Indonesia (Persero) Tbk. Full Year 2013 Editions FY 2012 FY 2013 Change Financial Summary (USD Mio) OPERATING REVENUES 3,472 3,716 7.02% OPERATING EXPENSES 3,304 3,660 10.75%
current market outlook
 current market outlook Randy Tinseth Vice President, Marketing Boeing Commercial Airplanes June 2011 The statements contained herein are based on good faith assumptions and provided for general information
VietJet Aviation Joint Stock Company Key Highlights Q1/2017 Business result. Apr 2017
 VietJet Aviation Joint Stock Company Key Highlights Q1/2017 Business result Apr 2017 Disclaimer INFORMATION CONTAINED IN OUR PRESENTATION IS INTENDED SOLELY FOR YOUR REFERENCE. SUCH INFORMATION IS SUBJECT
--- Disclosure A uirements) A~ulatlons October 24, 2018 IGAUSECT / /1 0
 A~ulatlons October 24, 2018 IGAUSECT / /1 0") October 24, 2018 IGAUSECT /1 0-1 8/1 0 To National Stock Exchange of India limited Exchange Plaza, C - 1, Block G Sandra Kurla Complex Sandra - (E) Mumbai - 400 051 Symbol: INDIGO To Department of Corporate
October 24, 2018 IGAUSECT /1 0-1 8/1 0 To National Stock Exchange of India limited Exchange Plaza, C - 1, Block G Sandra Kurla Complex Sandra - (E) Mumbai - 400 051 Symbol: INDIGO To Department of Corporate
C O L L A T E R A L V E R I F I C A T I O N S, L L C SPECIAL AIRCRAFT REPORT -BOMBARDIER CRJ-200LR- APRIL 2013
 SPECIAL AIRCRAFT REPORT -BOMBARDIER CRJ-200LR- APRIL 2013 AIRCRAFT DATA AIRCRAFT MARKET SUMMARY The Current Market The current market demand for the Bombardier CRJ-200 has continued to remain somewhat
Global commercial airline industry outlook March 2013 update
 Global commercial airline industry outlook March 213 update Brian Pearce Chief Economist www.iata.org/economics To represent, lead and serve the airline industry Monthly RPK (Billions) Monthly FTK (Billions)
STATISTICS IS THE EYES OF GOVERNMENT ADMINISTRATION
 STATISTICS IS THE EYES OF GOVERNMENT ADMINISTRATION Chicago Convention 1944 establishes th obligation of ICAO(International Civil Aviatio Organization) contracting States to submit A Transport Statistics.
Financial Results Q1 FY September 2017
 Financial Results Q1 FY18 12 September 2017 2 Key Highlights Q1FY18 Net profit after tax of INR 58cr Ninth successive profitable quarter for the Group Gross debt reduced by INR 398cr and net debt almost
Financial Position (consolidated)
") May 14 th, 2015 Disclaimer This presentation is for informational purposes only, contains preliminary financial and other information about Korean Air Lines Co., Ltd. and is subject to updating, revision,
May 14 th, 2015 Disclaimer This presentation is for informational purposes only, contains preliminary financial and other information about Korean Air Lines Co., Ltd. and is subject to updating, revision,
SIA ANALYST/MEDIA BRIEFING Q2 and 1H FY17/18 Results 8 November 2017
 SIA ANALYST/MEDIA BRIEFING Q2 and 1H FY17/18 Results 8 November 2017 THE PARENT AIRLINE Q2 AND 1H FY17/18 RESULTS THE PARENT AIRLINE COMPANY OPERATING PERFORMANCE Q2 % 1H % FY17/18 Change FY17/18 Change
PRESS RELEASE Financial Results. Rising passenger traffic at 12.5m Exceeding 1bn in consolidated revenue
 PRESS RELEASE 2016 Financial Results Rising passenger traffic at 12.5m Exceeding 1bn in consolidated revenue Kifissia, 23 March 2017 AEGEAN reports full year 2016 results with consolidated revenue at 1,020m,
Vueling improves its result in 4 points for the first quarter 2009
 Vueling improves its result in 4 points for the first quarter 2009 Improvement in costs was the most important factor for the improvement in EBIT margin Synergies in revenue due to the merger offset the
Air Transport MRO & PMA Market Forecast and Key Trends
 Air Transport MRO & PMA Market Forecast and Key Trends Presented by: Michael Howard, Principal ICF SH&E michael.howard@icfi.com Gorham PMA Parts & DER Repairs San Diego, March 2013 0 Today s Agenda MRO
Second quarter 2013 Results Presentation. August, 2013
 Second quarter 2013 Results Presentation August, 2013 This presentation may include forward-looking comments regarding the Company s business outlook and anticipated financial and operating results. These
Global Commercial Aircraft MRO Market (Maintenance, Repair & Overhaul ):
:") Industry Research by Koncept Analytics Global Commercial Aircraft MRO Market (Maintenance, Repair & Overhaul ): Industry Analysis & Outlook ----------------------------------------- (2018-2022) January
Industry Research by Koncept Analytics Global Commercial Aircraft MRO Market (Maintenance, Repair & Overhaul ): Industry Analysis & Outlook ----------------------------------------- (2018-2022) January
Finnair Group Annual Report 1 January 31 December 2006
 Finnair Group Annual Report 1 January 31 December 2006 2006: A year for restructuring Scheduled Passenger Traffic transforming to meet Asian traffic demands Labour negotiations to cut 670 jobs 80 million
AACO Fuel Forum. Luis Felipe de Oliveira (IATA) Dubai, August 20 th, Presented by. Regional Head Airport Infrastructure and Fuel
 Dubai, August 20 th, Presented by. Regional Head Airport Infrastructure and Fuel") AACO Fuel Forum Dubai, August 20 th, 2013 Presented by Luis Felipe de Oliveira (IATA) Regional Head Airport Infrastructure and Fuel Air transport is critical to the global economy We are a US$ 594 billion
AACO Fuel Forum Dubai, August 20 th, 2013 Presented by Luis Felipe de Oliveira (IATA) Regional Head Airport Infrastructure and Fuel Air transport is critical to the global economy We are a US$ 594 billion
SkyWest, Inc. Announces First Quarter 2018 Profit
 NEWS RELEASE CONTACT: Investor Relations Corporate Communications 435.634.3200 435.634.3553 Investor.relations@skywest.com corporate.communications@skywest.com SkyWest, Inc. Announces First Quarter 2018
IATA Fuel Efficiency Program
 IATA Fuel Efficiency Program IATA Fuel Efficiency Program The program was launched by IATA in 2004 in response to the rising price of fuel. It is focused on supporting the airlines to increase fuel efficiency
Results for the Year Ended 30 th June Brett Godfrey Chief Executive Officer 21 August 2007
 Results for the Year Ended 30 th June 2007 Brett Godfrey Chief Eecutive Officer 21 August 2007 New World Strategy Delivering RASK up 13.0% 10.02 CASK (underlying) up 2.6% 8.24 Net Profit up 92.9% $216M
Fourth Quarter 2006 Results Presentation February 15, 2007
 Fourth Quarter 2006 Results Presentation February 15, 2007 This presentation may include forward-looking comments regarding the Company s business outlook and anticipated financial and operating results.
SECOND QUARTER RESULTS 2018
 SECOND QUARTER RESULTS 2018 KEY RESULTS In the 2Q18 Interjet total revenues added $ 5,781.9 million pesos that represented an increase of 9.6% over the revenue generated in the 2Q17. In the 2Q18, operating
FY 2013 and Q results. Increasing effects of Transform 2015
 FY 2013 and Q1 2014 results Increasing effects of Transform 2015 Key data FY 13 Change (1) Q1-14 Change (2) Revenue ( bn) 25.52 +2,3% (3) 5.55 +0.0% (4) EBITDA (5) ( m) 1,855 +461m -50 +66m Operating result
Thank you, Director Heijl and Bon Jour. It s good to be back in Montreal for this important symposium.
 Keynote Speech by Ms. Victoria Cox, Vice President, Operations Planning United States Federal Aviation Administration Air Traffic Organization Worldwide Symposium on Performance of the Air Navigation System
1 st Quarter Results FY
 1 st Quarter Results FY 2004-05 05 Q1 Highlights p Context 8Improving economic context 8Strong economic growth in Americas and Asia 8Modest economic recovery in Europe 8Soaring fuel prices 8IPE Brent up
1.3% millionn euros. Net debt of 5.4 improvement. euros to. Financial Year. the Air. operating. equipped. ness and. also focus on.
 25 th July 2014 Financial Year 2014: First Half results SECOND QUARTER Revenues of 6.45 billion euros, upp 1.7% like-for-like; passenger unit revenue up 1.3% at constant currency thanks to strict capacity
The BCA Business Environment and Future Market Strategy
 The BCA Business Environment and Future Market Strategy Nicole Piasecki Vice President Marketing & Business Strategy September 2004 2 Near Term Recovery Airplane Deliveries (2006) Airline Orders (2005)
FIRST QUARTER 2014 RESULTS
 FIRST QUARTER 2014 RESULTS Mexico City, April 29, 2014 - Grupo Aeromexico S.A.B de C.V. ( Aeromexico ) (BMV: AEROMEX), the largest airline in Mexico, today reported its unaudited consolidated results for
Maximizing Economic Benefits of Aviation in the Region
 Maximizing Economic Benefits of Aviation in the Region Boubacar Djibo Director, Air Transport Bureau, ICAO Georgetown, Guyana 21 November 2018 Preamble. THEREFORE, the undersigned governments having agreed
Meeting the Demand The Battle for Asia Pacific s Airspace
 Meeting the Demand The Battle for Asia Pacific s Airspace The statements contained herein are based on good faith assumptions and are to be used for general information purposes only. These statements
Airline Economics Airline Planning Workshop
 Airline Economics 2016 Airline Planning Workshop The statements contained herein are based on good faith assumptions and provided for general information purposes only. These statements do not constitute