Gregg Gildemann Market Analysis
|
|
|
- Everett Davidson
- 6 years ago
- Views:
Transcription


1 Gregg Gildemann Market Analysis Boeing Commercial Airplanes 20 February 2018 The statements contained herein are based on good faith assumptions are to be used for general information purposes only. These statements do not constitute an offer, promise, warranty or guarantee of performance.
2 It's tough to make predictions, especially about the future. - Yogi Berra
3 NG 737 MAX NG 737 MAX Current monthly production rates

4 Agenda Air cargo - strong recovery in 2017 Market outlook- continued growth at or above trend Freighter market and forecast


5 2017 air cargo up 9% Air cargo growth Growth rate in % 14% 12% 10% 8% 6% 4% Asian industry recovery Long term projected growth rate 4.2% Stronger global Ind. Prod. Europe outperforming Great peak season E-commerce Economic and trade growth 2% 0% All regions participating -2% Source: BCA Market Analysis and IATA full year 2017 data
6 Key economies growing, industrial production gaining strength Synchronized upswing in global growth Industrial production recovering China, Emerging Markets adding most to GDP 8% 7% forecast Growth rate in % 6% 5% 4% 3% Growth rate in % % 1.0 1% 0.5 0% EU USA China World contribution to global real GDP growth 2018 growth 5 year forward CAGR Retail sales Industrial production China: 28% Other Emerging, Devel. Markets: 37% Advanced Economies: 34% Source: BCA Market Analysis with data from IHS Markit January 2018
7 Air cargo volumes rebounding, driven by increase in industrial production and world trade Industrial recovery crucial for air cargo growth Weak IP & trade à air cargo weak Stronger IP & trade à strong air cargo quarters IP & trade slowdown à air cargo weak Forecast for stronger IP & trade à Recovery for air cargo growth rate y-o-y 8.0% 7.0% 6.0% 5.0% 4.0% 3.0% 2.0% 1.0% 0.0% Industrial production (IP) Global trade World GDP growth rate y-o-y 12% 10% 8% 6% 4% 2% 0% -2% -4% RTKs 2013 RTKs 1.3% 2012-Q Q Q Q Q Q Q Q Q Q Q Q Q Q Q Q Q Q Q Q Q Q Q Q Q Q RTKs 4.8% 2015 RTKs 1.9% 2016 RTKs 3.6% Sources: Oxford Economics, IATA, A4A, Boeing
8 Demand lifting prices amid supply restraint; longer term supply to limit price rise 160 Crude Oil Forecast Comparison Constant 2016 US Dollars IHS, historical IHS PIRA OXE BCA Market Analysis with data from IHS Markit, PIRA, Oxford Economics

9 Air cargo demand exceeding capacity growth Year-over-year RTK (traffic) and AFTK (capacity) growth 12% 11.0%11.1% Traffic growth 10% 9.3% 8.1% 8% 6.7% 6.1% 6% 4.1% 4.4% 4% 2% 5.1% 4.9% 4.9% 3.7% 3.3% 2.7% 1.3% 0.9% 1.2% 0.9% 0% -2% -1.1%-1.4% -1.6% -2.3% -3.1% -4% 1Q12 3Q12 Source: IATA Carrier Tracker 1Q13-2.3% 3Q13 1Q14 3Q14 1Q15 3Q15 1Q16 3Q16 1Q17 3Q17

10 Air cargo traffic resurgent, forecast for solid growth Large freighter utilization high and stable Parked freighter fleet shrinking Air cargo traffic growth in % Forecast 20 year growth 4.2% Forecast F 2019F 2020F F/ERF 747-8F 777F 767F/BCF/SF In service: Available: Source: BCA Market Analysis with data from IATA, A4A, Ascend
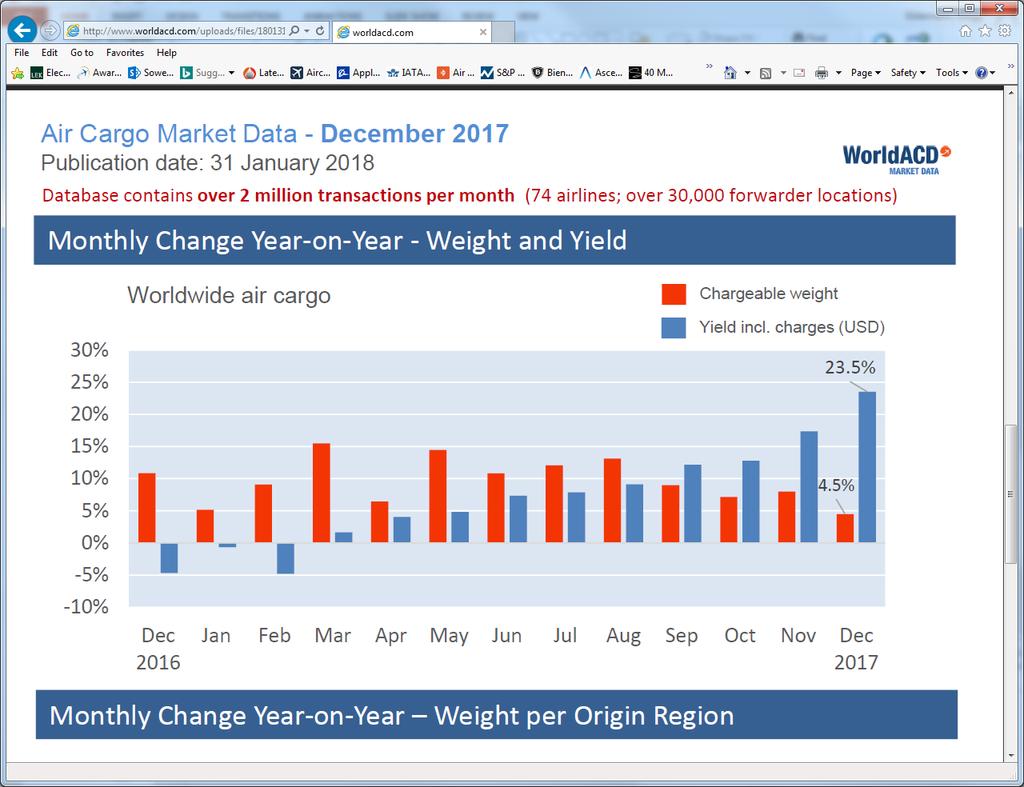
11 Source: WorldACD Source:
12 Traffic changes (FTKs) from 2016 to % % 9.0% FTKs (billions) % 5% 12% 18% Total Latin America Africa Middle East North America Europe Asia Pacific 2017 Total SOURCE:BCA Market Analysis with data from IATA December 2017
13 Forecasted to grow 15% per year through $30 $25 $20 $15 $10 $5 $0 USD (billions) Retail E-Commerce Sales Worldwide, USD (trillions) Singles Day Black Friday Cyber Monday 25.3 $3.0 $2.5 $3.6 30% 25% 20% 2.0 $1.7 $2.0 15% $ % 7.4% 8.6% 9.9% 11.4% 12.8% 10% 5% E 2017F 2018F 2019F 0% Retail e-commerce sales % of total retail sales China online retail sales is the world s largest e-commerce market (2X US growth rate) Source: EMarketer

")
14 Freighters are critical to compete in air cargo markets Airlines operating freighters generate 90% of industry revenues 2016 All Cargo 10% Passenger Belly Only 10% Express Carriers Combination Carriers $33.7B $30.6B Express Carrier 42% All Cargo $8.5B Combination Carrier 38% Passenger Belly Only TOTAL $8.0B $80.8B Airlines operating freighters Sources: FlightGlobal, U.S. DOT F41, airline reports, and Boeing estimates (2016 data)

15 1% of world trade TONNAGE is carried by Air Cargo 35% of world trade VALUE is carried by Air Cargo 0% 50% 100% Note: Does not include trans-border tonnage that was transported by truck, rail or fixed installations such as pipelines or conveyors Source: IATA COPYRIGHT 2016 THE BOEING COMPANY
16 2016 Rank Airline 2016 Millions of RTKs YoY % Change Business model 1 Federal Express 15, % Express carrier 2 Emirates 12, % Pax belly with freighters 3 UPS Airlines 11, % Express carrier 4 Cathay Pacific Airways 9, % Pax belly with freighters 5 Qatar Airways 9, % Pax belly with freighters 6 Korean Air 7, % Pax belly with freighters 7 Lufthansa 7, % Pax belly with freighters 8 Cargolux 6, % Freighter only operator 9 Singapore Airlines 6, % Pax belly with freighters 10 Air China 6, % Pax belly with freighters 11 China Southern Airlines 5, % Pax belly with freighters 12 China Airlines 5, % Pax belly with freighters 13 AirBridgeCargo 4, % Freighter only operator 14 China Eastern Airlines 4, % Pax belly with freighters 15 Etihad Airways 4, % Pax belly with freighters 16 All Nippon Airways 4, % Pax belly with freighters 17 Polar Air Cargo 4, % Freighter only operator 18 British Airways 4, % Pax belly with freighters 19 Asiana Airlines 3, % Pax belly with freighters 20 Turkish Airlines 3, % Pax belly with freighters 21 KLM 3, % Pax belly with freighters 22 United Airlines 3, % Belly only 23 EVA Air 3, % Pax belly with freighters 24 Air France 3, % Pax belly with freighters 25 American Airlines 3, % Belly only 26 Nippon Cargo Airlines 2, % Freighter only operator 27 Delta Air Lines 2, % Belly only 28 Japan Airlines 2, % Belly only 29 Thai Airways 2, % Belly only 30 Qantas Airways 1, % Pax belly with freighters Source: IATA World Air Transport Statistics (WATS), Boeing Top 30 scheduled airlines 166,428 72% share of total traffic Total world air cargo traffic 231,466
 4.")
17 2016 to 2036 World economy (GDP) 2.8% Airline traffic (RPK) 4.7% Cargo traffic (RTK) 4.2%


18 RTKs in billions Asia North America Europe-Asia Intra-Asia North America Europe North America Domestic China Europe-Latin America Latin America North America Africa-Europe South Asia Europe Middle East Europe CIS Intra-Europe 2015 RTKs RTKs 5.5% 2.2% 2.4% 6.2% 3.8% 4.3% 3.8% 5.0% 3.9% 3.0% 2.2% Annual growth % 4.6% 4.6%

19 Passenger airplane fleet only 24,000 Passenger fleet units 20,000 16,000 1,553 1,673 1,583 2,056 1,810 1,863 2,241 2,478 12,000 8,000 1,428 1,568 1,483 9,570 11,415 14,98215,706 14,136 8,714 4, ,929 2,923 2,820 2,609 2,597 2, Regional jet Single aisle Small twin aisle Medium/large twin aisle Source: Ascend, Boeing CMO


20 Freighter airplane fleet only 2,000 Freighter fleet units 1,600 1, Source: Ascend, Boeing CMO Large Medium widebody Standard body

21 70 Percentage of world RTKs carried on freighters * Sources: IATA, ICAO, company reports, Boeing research * Forecast

22 Total air cargo traffic carried by freighters by percentage ~80% ~75% ~40%

23 100% Share of fleet Delivery units 80% 60% 40% 20% 0% 2016 Freighters 1, Freighters 3,030 Large production >80 tonnes Wide-body conversions tonnes Medium wide-body production tonnes Standard-body conversions <45 tonnes , to 2036 Freighters 1,100
24 Revenue payload tonnes (1,000-lb) 747-8F 150 (331) Large Freighters More than 80 tonnes of payload 777F ER BCF* F BCF SF BCF SF SF C 100 (220) 50 (110) 0 Medium Wide-body Freighters tonnes of payload Standard-body Freighters Less than 45 tonnes of payload * Product Development Study

25 Boeing Market Analysis products Available online for all Yearly publication 20 year passenger market forecast Biennial publication 20 year cargo market forecast


26 World air cargo traffic rebounding strongly with trade and industrial production World air cargo traffic forecast to grow 4.2% per year through 2036 Pax capacity vital, but the majority of air cargo traffic will remain on freighters The world freighter fleet will expand to 3030 airplanes over the next 20 years

27


28 Thank you!
Steve Hahn. Current Market Outlook. Director, Japan Enterprise Technology Programs. Boeing Commercial Airplanes July 2014.
 Current Market Outlook 2015 Boeing Commercial Airplanes July 2014 The statements contained herein are based on good faith assumptions and are to be used for general information purposes only. These statements
John Schubert Managing Director Asia Pacific & India Marketing
 John Schubert Managing Director Asia Pacific & India Marketing September 2017. The statements contained herein are based on good faith assumptions are to be used for general information purposes only.
Meeting the Demand The Battle for Asia Pacific s Airspace
 Meeting the Demand The Battle for Asia Pacific s Airspace The statements contained herein are based on good faith assumptions and are to be used for general information purposes only. These statements
Aviation Updates. Mr. John Schubert. Managing Director, Marketing-Asia Pacific & India
 Aviation Updates Mr. John Schubert Managing Director, Marketing-Asia Pacific & India Market Update The statements contained herein are based on good faith assumptions are to be used for general information
current market outlook
 current market outlook Randy Tinseth Vice President, Marketing Boeing Commercial Airplanes June 2011 The statements contained herein are based on good faith assumptions and provided for general information
Randy Tinseth Vice President, Marketing Boeing Commercial Airplanes
 Randy Tinseth Vice President, Marketing Boeing Commercial Airplanes June 2017. The statements contained herein are based on good faith assumptions are to be used for general information purposes only.
Randy Tinseth Vice President, Marketing Boeing Commercial Airplanes July 2010
 CURRENT MARKET OUTLOOK Randy Tinseth Vice President, Marketing Boeing Commercial Airplanes July 2010 BOEING is a trademark of Boeing Management Company. Copyright 2010 Boeing. All rights reserved. The
Airline Current Business Environment Alex Heiter
 Airline Current Business Environment Alex Heiter Istanbul Technical University Air Transportation Management M.Sc. Program Network, Fleet and Schedule Strategic Planning Module 2: 28 March 2016 The underlying
Debra Santos Managing Director Marketing - Europe Region
 Debra Santos Managing Director Marketing - Europe Region November 11, 2016. The statements contained herein are based on good faith assumptions are to be used for general information purposes only. These
Worldwide Market Forecast ( ) Prompt Report
 Prompt Report") Worldwide Market Forecast (2018 ) Prompt Report June 2018 Marketing Group Japan Aircraft Development Corporation Outline of the Worldwide Market Forecast Jets and turboprop Passenger jet 20 seats and above
Worldwide Market Forecast (2018 ) Prompt Report June 2018 Marketing Group Japan Aircraft Development Corporation Outline of the Worldwide Market Forecast Jets and turboprop Passenger jet 20 seats and above
Market Outlook. Michael Warner, Director Market Analysis. Boeing Commercial Airplanes October October 7 10, 2012 Atlanta, Georgia, USA
 Market Outlook Michael Warner Director, Market Analysis Boeing Commercial Airplanes October 2012 Agenda Aviation environment Current products Product strategy & development 2012 719 net orders through
Global Market Forecast
 Presentation by: Bob Lange SVP, Market & Product Strategy Global Market Forecast 2013-2032 Drivers for Growth Topics The Market Today & forecast (GMF) Airbus product response Air travel has proved to be
Industry perspective Current Market Outlook
 Industry perspective Current Market Outlook Sam Bolooki Director International Business Development & Programs Boeing Global Air Traffic Management Oct. 2013 Agenda Aviation industry 20-year commercial
Growing Horizons Global Market Forecast
 Growing Horizons Global Market Forecast 2017-2036 John Leahy Chief Operating Officer, Customers Global Market Forecast 2017: Highlights World Fleet Forecast 2016 2036 RPK (trillions) 7.0 16.5 vs. GMF16
AIR PASSENGER MARKET ANALYSIS
 AIR PASSENGER MARKET ANALYSIS OCTOBER 2014 KEY POINTS Air travel volumes were up 5.7% in October year-on-year, slightly stronger than the September rise of 5.2%, and a continuation of the positive growth
Global Market Forecast Presented by: JOHN LEAHY COO, Customers
 Global Market Forecast 2012-2031 Presented by: JOHN LEAHY COO, Customers Global Market Forecast 2012: Highlights GMF 2012 key numbers and 20-year change World Fleet Forecast 2011 2031 % Change RPK (trillions)
Maximizing Economic Benefits of Aviation in the Region
 Maximizing Economic Benefits of Aviation in the Region Boubacar Djibo Director, Air Transport Bureau, ICAO Georgetown, Guyana 21 November 2018 Preamble. THEREFORE, the undersigned governments having agreed
Index of business confidence. Monthly FTK (Billions) June 2012 vs. June 2011 YTD 2012 vs. YTD 2011 RPK ASK PLF FTK AFTK FLF RPK ASK PLF FTK AFTK FLF
 June 2012 vs. June 2011 YTD 2012 vs. YTD 2011 RPK ASK PLF FTK AFTK FLF RPK ASK PLF FTK AFTK FLF") Monthly RPK (Billions) Monthly FTK (Billions) Index of business confidence % change over year AIR TRANSPORT MARKET ANALYSIS JUNE 2012 KEY POINTS Air travel markets expanded in June, but the trend in passenger
Monthly RPK (Billions) Monthly FTK (Billions) Index of business confidence % change over year AIR TRANSPORT MARKET ANALYSIS JUNE 2012 KEY POINTS Air travel markets expanded in June, but the trend in passenger
AIR TRANSPORT MARKET ANALYSIS JULY 2011
 AIR TRANSPORT MARKET ANALYSIS JULY 2011 KEY POINTS Despite an increasingly gloomy economic outlook, air travel continued to expand at a pace close to trend in July, to a level 5.9% higher than a year earlier.
MONTHLY AIRPORT TRAFFIC REPORT July 2016
 MONTHLY AIRPORT TRAFFIC REPORT AIRCRAFT OPERATIONS 2016 2015 Change Domestic Air Carrier 63,680 62,789 1.42% Air Taxi 7,548 8,007-5.73% General Aviation 717 558 28.49% Military 11 146-92.47% Subtotal 71,956
MONTHLY AIRPORT TRAFFIC REPORT March 2017
 MONTHLY AIRPORT TRAFFIC REPORT AIRCRAFT OPERATIONS 2017 2016 Change Domestic Air Carrier 60,360 61,951-2.57% Air Taxi 8,591 8,270 3.88% General Aviation 717 615 16.59% Military 14 27-48.15% Subtotal 69,682
MONTHLY AIRPORT TRAFFIC REPORT September 2016
 MONTHLY AIRPORT TRAFFIC REPORT AIRCRAFT OPERATIONS 2016 2015 Change Domestic Air Carrier 59,030 59,038-0.01% Air Taxi 7,779 7,201 8.03% General Aviation 704 571 23.29% Military 21 12 75.00% Subtotal 67,534
Index of business confidence. Monthly FTK (Billions) Aug 2013 vs. Aug 2012 YTD 2013 vs. YTD 2012 Aug 2013 vs. Jul 2013
 Aug 2013 vs. Aug 2012 YTD 2013 vs. YTD 2012 Aug 2013 vs. Jul 2013") AIR PASSENGER MARKET ANALYSIS AUGUST 2013 KEY POINTS Air travel markets expanded strongly in August. Global revenue passenger kilometers were up 6.8% compared to a year ago, an improvement on July growth
AIR PASSENGER MARKET ANALYSIS AUGUST 2013 KEY POINTS Air travel markets expanded strongly in August. Global revenue passenger kilometers were up 6.8% compared to a year ago, an improvement on July growth
The outlook for commercial air transport
 The outlook for commercial air transport Brian Pearce Chief Economist www.iata.org/economics To represent, lead and serve the airline industry RPKs per month, billion Demand for air travel and cargo diverge
MONTHLY AIRPORT TRAFFIC REPORT April 2017
 MONTHLY AIRPORT TRAFFIC REPORT AIRCRAFT OPERATIONS 2017 2016 Change Domestic Air Carrier 56,570 60,697-6.80% Air Taxi 7,771 7,806-0.45% General Aviation 833 699 19.17% Military 23 14 64.29% Subtotal 65,197
Africa, Airbus; A vision of the future
 Africa, Airbus; A vision of the future Addis Ababa March 13 th, 2013 Image: DSK Source: Global Insight, United Nations, Airbus GMF Africa Real GDP Urban population Intra-regional & domestic Inter-regional
AIR PASSENGER MARKET ANALYSIS
 Monthly RPK (Billions) Monthly FTK (Billions) Index of business confidence % change over year AIR PASSENGER MARKET ANALYSIS NOVEMBER 2013 KEY POINTS Air travel markets increased at a solid rate in November,
World & Regional Capacity Analysis Ali Hajiyev
 World & Regional Capacity Analysis Ali Hajiyev Istanbul Technical University Air Transportation Management M.Sc. Program Network, Fleet and Schedule Strategic Planning Module 3: 28 March 2016 Global Copyright
Worldwide Fleet Forecast
 Worldwide Fleet Forecast Presented to: Montreal June 6, 26 DAVID BECKERMAN Director, Consulting Services Agenda State of the Industry Worldwide Fleet Regional Jets Narrowbody Jets Large Widebody Jets Freighter
AIR TRANSPORT MARKET ANALYSIS MAY 2011
 AIR TRANSPORT MARKET ANALYSIS MAY 2011 KEY POINTS May saw a renewed expansion in both air travel and freight, after a soft patch during the previous three months. Air travel volumes were 6.8% higher than
MONTHLY AIRPORT TRAFFIC REPORT June 2017
 MONTHLY AIRPORT TRAFFIC REPORT AIRCRAFT OPERATIONS 2017 2016 Change Domestic Air Carrier 61,445 62,662-1.94% Air Taxi 8,267 7,656 7.98% General Aviation 644 685-5.99% Military 8 18-55.56% Subtotal 70,364
MONTHLY AIRPORT TRAFFIC REPORT July 2017
 MONTHLY AIRPORT TRAFFIC REPORT AIRCRAFT OPERATIONS 2017 2016 Change Domestic Air Carrier 63,535 63,680-0.23% Air Taxi 7,291 7,548-3.40% General Aviation 630 717-12.13% Military 15 11 36.36% Subtotal 71,471
MONTHLY AIRPORT TRAFFIC REPORT August 2018
 MONTHLY AIRPORT TRAFFIC REPORT AIRCRAFT OPERATIONS 2018 2017 Change Domestic Air Carrier 65,465 63,201 3.58% Air Taxi 7,607 7,533 0.98% General Aviation 594 609-2.46% Military 15 3 400.00% Subtotal 73,681
MONTHLY AIRPORT TRAFFIC REPORT July 2018-(Revised)
") MONTHLY AIRPORT TRAFFIC REPORT AIRCRAFT OPERATIONS 2018 2017 Change Domestic Air Carrier 64,066 63,535 0.84% Air Taxi 7,468 7,291 2.43% General Aviation 550 630-12.70% Military 5 15-66.67% Subtotal 72,089
MONTHLY AIRPORT TRAFFIC REPORT AIRCRAFT OPERATIONS 2018 2017 Change Domestic Air Carrier 64,066 63,535 0.84% Air Taxi 7,468 7,291 2.43% General Aviation 550 630-12.70% Military 5 15-66.67% Subtotal 72,089
MONTHLY AIRPORT TRAFFIC REPORT February 2018
 MONTHLY AIRPORT TRAFFIC REPORT AIRCRAFT OPERATIONS 2018 2017 Change Domestic Air Carrier 51,809 51,854-0.09% Air Taxi 6,659 6,988-4.71% General Aviation 651 540 20.56% Military 6 9-33.33% Subtotal 59,125
MONTHLY AIRPORT TRAFFIC REPORT December 2018
 MONTHLY AIRPORT TRAFFIC REPORT AIRCRAFT OPERATIONS 2018 2017 Change Domestic Air Carrier 58,905 55,828 5.51% Air Taxi 6,948 6,810 2.03% General Aviation 499 565-11.68% Military 24 25-4.00% Subtotal 66,376
MONTHLY AIRPORT TRAFFIC REPORT September 2018
 MONTHLY AIRPORT TRAFFIC REPORT AIRCRAFT OPERATIONS 2018 2017 Change Domestic Air Carrier 58,763 55,902 5.12% Air Taxi 6,537 6,689-2.27% General Aviation 605 658-8.05% Military 14 17-17.65% Subtotal 65,919
Commercial aviation. Market outlook, key trends driving growth and implications for airports. Dave Gamrath BCA Marketing.
 Commercial aviation Market outlook, key trends driving growth and implications for airports Dave Gamrath BCA Marketing June 2014 BOEING is a trademark of Boeing Management Company. Copyright 2014 Boeing.
AIR PASSENGER MARKET ANALYSIS
 Monthly RPK (Billions) Monthly FTK (Billions) Index of business confidence % change over year AIR PASSENGER MARKET ANALYSIS JANUARY 2014 KEY POINTS Air travel markets commenced 2014 with a strong increase
Index of business confidence. Monthly FTK (Billions) May 2014 vs. May 2013 YTD 2014 vs. YTD 2013 May 2014 vs. Apr 2014
 May 2014 vs. May 2013 YTD 2014 vs. YTD 2013 May 2014 vs. Apr 2014") AIR PASSENGER MARKET ANALYSIS MAY 2014 KEY POINTS Air travel markets rose by a strong 6.2% in May compared to a year ago. Although this is slightly down on April growth of 7.6%, April was positively biased
AIR PASSENGER MARKET ANALYSIS MAY 2014 KEY POINTS Air travel markets rose by a strong 6.2% in May compared to a year ago. Although this is slightly down on April growth of 7.6%, April was positively biased
AIR PASSENGER MARKET ANALYSIS SEPTEMBER 2015 KEY POINTS
 AIR PASSENGER MARKET ANALYSIS SEPTEMBER 2015 KEY POINTS Global air travel rose 7.3% in September compared to a year ago. The mid-year data showed some distortion from holiday impacts, but the last couple
MONTHLY AIRPORT TRAFFIC REPORT April 2018
 MONTHLY AIRPORT TRAFFIC REPORT AIRCRAFT OPERATIONS 2018 2017 Change Domestic Air Carrier 60,928 56,570 7.70% Air Taxi 6,995 7,771-9.99% General Aviation 654 833-21.49% Military 9 23-60.87% Subtotal 68,586
Happy Jetting. A Conversation With Dave Barger, President And Chief Executive Officer, JetBlue Airways, Page 14.
 A MAGAZINE FOR AIRLINE EXECUTIVES 2009 Issue No. 2 Taking your airline to new heights Happy Jetting A Conversation With Dave Barger, President And Chief Executive Officer, JetBlue Airways, Page 14. 11
Aircraft industry takes off while air transport remains grounded
 Aircraft industry takes off while air transport remains grounded Ludovic Subran, Chief Economist Aéronautique: l industrie en mode supersonique, le transport en mode planeur Yann Ludovic Subran, Lacroix,
Atlas Air Worldwide. Celebrating 25 Years in Anchorage. August 2017
 Worldwide Celebrating 25 Years in Anchorage August 2017 Worldwide Ownership 100% Ownership 51% (49% DHL) Ownership 100% Ownership 100% We manage diverse, complex and time-definite global networks We deliver
AIR PASSENGER MARKET ANALYSIS JULY 2015 KEY POINTS
 AIR PASSENGER MARKET ANALYSIS JULY 2015 KEY POINTS Global air travel rose 8.2% in July compared to a year ago, partly reflecting an upward bias due to the timing of Ramadan. But even after controlling
MONTHLY AIRPORT TRAFFIC REPORT December 2017
 MONTHLY AIRPORT TRAFFIC REPORT AIRCRAFT OPERATIONS 2017 2016 Change Domestic Air Carrier 55,828 57,943-3.65% Air Taxi 6,810 7,642-10.89% General Aviation 565 569-0.70% Military 25 32-21.88% Subtotal 63,228
I AO Chi h e i f E c E on o o n m o i m c i A na n ly l s y is i & P o P l o ilc i y y Se S ctio i n
 Narjess Teyssier ICAO Chief Economic Analysis & Policy Section Montréal 29 September 2010 Content Data Trends Forecasts Impact on stakeholders Monitoring air transport development: Statistics, analysis
Index of business confidence. Monthly FTK (Billions) Sep 2013 vs. Sep 2012 YTD 2013 vs. YTD 2012 Sep 2013 vs. Aug 2013
 Sep 2013 vs. Sep 2012 YTD 2013 vs. YTD 2012 Sep 2013 vs. Aug 2013") AIR PASSENGER MARKET ANALYSIS SEPTEMBER 2013 KEY POINTS Air travel markets expanded at a solid rate in September. Global revenue passenger kilometers were up 5.5% compared to a year ago. This is a slight
AIR PASSENGER MARKET ANALYSIS SEPTEMBER 2013 KEY POINTS Air travel markets expanded at a solid rate in September. Global revenue passenger kilometers were up 5.5% compared to a year ago. This is a slight
AIR PASSENGER MARKET ANALYSIS
 Monthly RPK (Billions) Monthly FTK (Billions) Index of business confidence % change over year AIR PASSENGER MARKET ANALYSIS APRIL 2013 KEY POINTS Global revenue passenger kilometers were up 3.2% in April
Index of business confidence. Monthly FTK (Billions) Apr 2014 vs. Apr 2013 YTD 2014 vs. YTD 2013 Apr 2014 vs. Mar 2014
 Apr 2014 vs. Apr 2013 YTD 2014 vs. YTD 2013 Apr 2014 vs. Mar 2014") AIR PASSENGER MARKET ANALYSIS APRIL 2014 KEY POINTS Growth in air travel picked-up in April, rising 7.5% compared to a year ago. This is an acceleration on March, when revenue passenger kilometers increased
AIR PASSENGER MARKET ANALYSIS APRIL 2014 KEY POINTS Growth in air travel picked-up in April, rising 7.5% compared to a year ago. This is an acceleration on March, when revenue passenger kilometers increased
Introduction: Airline Industry Overview Dr. Peter Belobaba Presented by: Alex Heiter & Ali Hajiyev
 Introduction: Airline Industry Overview Dr. Peter Belobaba Presented by: Alex Heiter & Ali Hajiyev Istanbul Technical University Air Transportation Management M.Sc. Program Network, Fleet and Schedule
Air China Limited Interim Results. August Under IFRS
 Air China Limited 21 Interim Results Under IFRS August 21 1 Agenda 21 Interim Results Overview Business Overview Financial Overview Outlook 2 2 2 21 Interim Results 3 21 Interim Results Overview 4 4 4
Market Overview. John Griffiths Chief Economist Boeing Commercial Airplanes June Presented to: Port of Seattle
 Market Overview John Griffiths Chief Economist Boeing Commercial Airplanes June 2008 Presented to: Port of Seattle Discussion items Business environment Global Economy Airline Environment Cycle dynamics
Global commercial airline industry outlook March 2013 update
 Global commercial airline industry outlook March 213 update Brian Pearce Chief Economist www.iata.org/economics To represent, lead and serve the airline industry Monthly RPK (Billions) Monthly FTK (Billions)
Airbus market forecast for India. Presented by Joost van der Heijden Head of Airline Marketing India, South-East Asia, Japan & Africa
 Airbus market forecast for India Presented by Joost van der Heijden Head of Airline Marketing India, South-East Asia, Japan & Africa The Airbus product line A380 Family A350 Family A330 Family A320 Family
2019 Airline Economics Growth Frontiers Dublin. Steven F. Udvar-Házy Executive Chairman
 2019 Airline Economics Growth Frontiers Dublin Steven F. Udvar-Házy Executive Chairman January 21, 2019 Forward Looking Statements Statements in this presentation that are not historical facts are hereby
September 2010 Brian Pearce To represent, lead and serve the airline industry
 Cycle turns up but risks and structural challenges remain September 2010 Brian Pearce www.iata.org/economics To represent, lead and serve the airline industry Confidence was still high in July survey Airline
MONTHLY AIRPORT TRAFFIC REPORT February 2014
 MONTHLY AIRPORT TRAFFIC REPORT AIRCRAFT OPERATIONS 2014 2013 Change Domestic Air Carrier 44,741 48,627-7.99% Air Taxi 11,144 13,003-14.30% General Aviation 569 543 4.79% Military 17 15 13.33% Subtotal
Airline financial performance
 Airline financial performance 30 March 2017 Brian Pearce Chief Economist, IATA www.iata.org/economics Airline Industry Economics Advisory Workshop 2016 1 The air transport paradox Source: McKinsey presentation
Asia Pacific Aviation
 Asia Pacific Aviation EMBRACING FUTURE CHALLENGES Andrew Herdman Director General Association of Asia Pacific Airlines Overview Asia Pacific aviation Industry trends & outlook Evolving business strategies
AIR PASSENGER MARKET ANALYSIS MAY 2015 KEY POINTS
 AIR PASSENGER MARKET ANALYSIS MAY 2015 KEY POINTS Global air travel rose by a strong 6.9% in May compared to a year ago. This was an acceleration on April year-overyear growth of 5.7%. Air travel was strong
John Leahy Chief Operating Officer, Customers Airbus Annual Press Conference
 John Leahy Chief Operating Officer, Customers Airbus Annual Press Conference 13 January 2014 A year of new industry records 2013 result Previous records Airbus records Airbus orders 1,619 gross 1,608 (Airbus
Malaysia s s 2020 Vision
 Kuala Lumpur International Airport: The New Southeast Asia Airline Hub? Lev Pinelis, M.S. Transportation December 7 th, 2004 1.231 Airport Systems Planning, Design, and Management Malaysia s s 2020 Vision
KOREAN AIR 4Q17 FINANCIAL RESULTS
 KOREAN AIR 4Q17 FINANCIAL RESULTS 1 Disclaimer This presentation is for informational purposes only, contains preliminary financial and other information about Korean Air Lines Co., Ltd. and is subject
MONTHLY AIRPORT TRAFFIC REPORT January 2018
 MONTHLY AIRPORT TRAFFIC REPORT AIRCRAFT OPERATIONS 2018 2017 Change Domestic Air Carrier 55,461 55,980-0.93% Air Taxi 7,166 7,330-2.24% General Aviation 690 625 10.40% Military 6 11-45.45% Subtotal 63,323
Global Airline Capacity Winter 2013/14 Boeing Commercial Airplanes
 Global Airline Capacity Winter 2013/14 Boeing Commercial Airplanes Istanbul Technical University Air Transportation Management M.Sc. Program BOEING is a trademark of Boeing Management Company. Network,
MONTHLY AIRPORT TRAFFIC REPORT May 2015
 MONTHLY AIRPORT TRAFFIC REPORT AIRCRAFT OPERATIONS 2015 2014 Change Domestic Air Carrier 60,427 57,339 5.39% Air Taxi 7,825 10,967-28.65% General Aviation 547 635-13.86% Military 135 27 400.00% Subtotal
AIR PASSENGER MARKET ANALYSIS MARCH 2015 KEY POINTS
 AIR PASSENGER MARKET ANALYSIS MARCH 2015 KEY POINTS Global air travel rose by a strong 7.4% in March compared to a year ago, an improvement on the February result of 6.4%. The acceleration in the year-on-year
Global Airline Trends and Impacts International Aviation Issues Seminar
 Global Airline Trends and Impacts International Aviation Issues Seminar December 2017, Washington D.C. Oliver Lamb Managing Director 1 Around the world in 45 minutes Financial Performance Canada Mexico
Boeing Commercial Airplanes
 May 2014 Investor Conference Boeing Commercial Airplanes Ray Conner President and Chief Executive Officer Boeing Vice Chairman May 21, 2014 Boeing Commercial Airplanes Strong operating performance Record
AIR TRANSPORT MARKET ANALYSIS APRIL 2011
 AIR TRANSPORT MARKET ANALYSIS APRIL 2011 KEY POINTS From this month we provide an assessment of global scheduled air transport markets, adding domestic to international, and including both IATA and non-iata
AIR PASSENGER MARKET ANALYSIS JUNE 2015 KEY POINTS
 AIR PASSENGER MARKET ANALYSIS JUNE 2015 KEY POINTS Global air travel rose 5.7% in June compared to a year ago, a slowdown on the strong May increase of 6.9%. The deceleration is due to slower growth in
MONTHLY AIRPORT TRAFFIC REPORT. April 2014
 MONTHLY AIRPORT TRAFFIC REPORT AIRCRAFT OPERATIONS 2014 2013 Change Domestic Air Carrier 55,529 55,119 0.74% Air Taxi 11,149 15,077-26.05% General Aviation 639 723-11.62% Military 13 14-7.14% Subtotal
AIR PASSENGER MARKET ANALYSIS DECEMBER 2015 KEY POINTS
 AIR PASSENGER MARKET ANALYSIS DECEMBER 2015 KEY POINTS Global air passenger traffic grew by 6.5% in 2015 as a whole the fastest pace since the post-gfc rebound in 2010 and well above the 10-year average
MONTHLY AIRPORT TRAFFIC REPORT November 2013
 MONTHLY AIRPORT TRAFFIC REPORT AIRCRAFT OPERATIONS 2013 2012 Change Domestic Air Carrier 52,937 54,739-3.29% Air Taxi 13,964 13,566 2.93% General Aviation 504 515-2.14% Military 25 28-10.71% Subtotal 67,430
CURRENT MARKET OUTLOOK
 CURRENT MARKET OUTLOOK 2015 2034 Copyright 2015 Boeing. All rights reserved. 1 CURRENT MARKET OUTLOOK 2015 2034 OUTLOOK ON A PAGE 4 Outlook on a page DELIVERIES BY AIRPLANE SIZE AND REGION Region Asia
Economic performance of the airline industry Mid-year 2017 update. Brian Pearce, Chief Economist, IATA
 Economic performance of the airline industry Mid-year 2017 update Brian Pearce, Chief Economist, IATA www.iata.org/economics % change over previous year Index, 50 = no change in output Performance drivers
ROUTE TRAFFIC FORECASTING DATA, TOOLS AND TECHNIQUES
 ROUTE TRAFFIC FORECASTING DATA, TOOLS AND TECHNIQUES Introduction and Background COURSE OBJECTIVES Understanding how economic factors impact demand for air travel. Understanding of how changes in airline
Airlines across the world connected a record number of cities this year, with more than 20,000 city pair connections*
 1 Airlines across the world connected a record number of cities this year, with more than 20,000 city pair connections*. This is a 1,351 increase over 2016 and a doubling of service since 1996, when there
PRESENTED BY: AL WANG SENIOR MANAGER, FORECASTING & MARKET PLANNING
 EXPERT INSIGHTS AND RELIABLE INFORMATION FOR THE AVIATION INDUSTRY 28th Annual Commercial Aviation Industry Suppliers Conference March 3-5, 2014 AIRCRAFT DELIVERY AND RETIREMENT FORECASTS PRESENTED BY:
Market Realities and Partnership with Morocco
 Market Realities and Partnership with Morocco Dr. Fariba Alamdari Vice President, Marketing Boeing Commercial Airplanes May 2014 The statements contained herein are based on good faith assumptions and
PT GARUDA INDONESIA (PERSERO) Tbk.
 Tbk.") PT GARUDA INDONESIA (PERSERO) Tbk. Analyst Meeting & Presentation 9Months 2013 Result Announcement Jakarta, 6 November 2013 Delivering Indonesia s Best to the World 0 Shareholders & Performance List of
PT GARUDA INDONESIA (PERSERO) Tbk. Analyst Meeting & Presentation 9Months 2013 Result Announcement Jakarta, 6 November 2013 Delivering Indonesia s Best to the World 0 Shareholders & Performance List of
AIR PASSENGER MARKET ANALYSIS JANUARY 2015 KEY POINTS
 AIR PASSENGER MARKET ANALYSIS JANUARY 2015 KEY POINTS Global air travel was up 4.6% in January compared to a year ago, a slower start to the year when compared to the strong 5.8% expansion in 2014 overall.
Airline Performance and Capacity Strategies Dr. Peter Belobaba
 Airline Performance and Capacity Strategies Dr. Peter Belobaba Istanbul Technical University Air Transportation Management M.Sc. Program Network, Fleet and Schedule Strategic Planning Module 18 : 13 March
2012 Result. Mika Vehviläinen CEO
 2012 Result Mika Vehviläinen CEO 1 Agenda Market environment in Q4 Business performance and strategy execution Outlook Financials 2 Market Environment According to IATA, Global air travel continues to
Introduction to Fleet Planning Dr. Peter Belobaba and Ali Hajiyev
 Introduction to Fleet Planning Dr. Peter Belobaba and Ali Hajiyev Istanbul Technical University Air Transportation Management M.Sc. Program Network, Fleet and Schedule Strategic Planning Module 7: 29 March
CHAPTER 2 Aviation Activity Forecasts
 CHAPTER 2 Aviation Activity Forecasts 2.1 Introduction 14 CFR Part 150 requires that noise exposure maps (NEMs) be prepared for two scenarios existing conditions and conditions 5 years into the future.
Corporate Presentation. Miami, FL February 25th, 2015
 Corporate Presentation Miami, FL February 25th, 2015 AGENDA LATAM Airlines in figures Cargo Unit Business Update The Company We are one of the ten largest passenger and cargo airlines in the world. PAX:
General Trend of the Global Airline Industry Dr Frankie O Connell
 General Trend of the Global Airline Industry Dr Frankie O Connell Istanbul Technical University Air Transportation Management, MSc. Program Airline Business Models and Strategic Management Module #1 8
AerCap Holdings N.V. Aengus Kelly, CEO. January 2017
 AerCap Holdings N.V. Aengus Kelly, CEO January 2017 Industry Update Looking Back PASSENGER TRAFFIC GROWTH Air traffic growth in 2016 remained robust, short-haul at 5.6% and long-haul at 6.4% 1 CHINA SLOWING
Financial Symposium September 2018 Madrid Marriott Auditorium Hotel & Conference Center
 5 World th Financial Symposium 17 20 September 2018 Madrid Marriott Auditorium Hotel & Conference Center 7 th SIS General Meeting 18 th September 2018 Madrid Marriott Auditorium Hotel & Conference Center
Aviation Market and Aircraft Finance
 Boeing Capital Corporation Aviation Market and Aircraft Finance Forward-looking statements This presentation contains forward-looking statements, which are not guaranteed, and are subject to risks, uncertainties,
PREMIUM TRAFFIC MONITOR AUGUST 2015 KEY POINTS
 PREMIUM TRAFFIC MONITOR AUGUST 2015 KEY POINTS Passenger travel on international markets was up 5.4% in August year-on-year, reflecting strong growth on the Within Europe travel market. Both travel classes
C A R G O L U X の 戦 略 ネ ッ ト ワ ー ク プ ロ ダ ク ツ 1 1 J u n
 C A R G O L U X の戦略 ネットワークプロダクツ 11Jun2018 C a r g o l u x Founded in March 1970: over 45 years of experience in allcargo services Operating a modern and energy-efficient fleet of 28 aircraft (Boeing 747F)
20-Year Forecast: Strong Long-Term Growth
 20-Year Forecast: Strong Long-Term Growth 10 RPKs (trillions) 8 Historical Future 6 4 2 Forecast growth annual rate 4.8% (2005-2024) Long-Term Growth 2005-2024 GDP = 2.9% Passenger = 4.8% Cargo = 6.2%
CARGO E-CHARTBOOK Q4 2010
 CARGO E-CHARTBOOK Q4 1 KEY POINTS Whilst concerns over a possible double dip continue to recede, there are marked differences in the rates of economic growth both between as well as within regions, which
NBAA 2015 MARKET UPDATE
 NBAA 2015 MARKET UPDATE November 2015 Forward-Looking Statements 2 This report contains forward-looking statements within the meaning of Section 21E of the Securities Exchange Act of 1934. All statements,
3.3% 3.6% 4.2% 5.1% 5.6% Latin America. Middle East. North America. Europe ,450 1, ,110 1,160 1,110 5, ,530
 Outlook on a Page World regions Market growth rates World regions Market value: $4,060 billion to Share of fleet Delivery units World economy (GDP) 3.3% 2% 6% Airplane fleet 3.6% 75% 22% Number of passengers
J.P. Morgan 2019 Global Emerging Markets Corporate Conference. Miami, February 2019
 J.P. Morgan 2019 Global Emerging Markets Corporate Conference Miami, February 2019 This presentation may include forward-looking comments regarding the Company s business outlook and anticipated financial