Planning Area Background Study
|
|
|
- Sydney Oliver
- 5 years ago
- Views:
Transcription


1 Yuma Valley Planning Area Background Study Prepared By: Andrew Fangman Long Range Planning Section Yuma County Department of Development Services October 2008
2 Yuma County Board of Supervisors Lenore Loroña Stuart District 1 Russell McCloud, Vice-Chairman District 2 Casey Prochaska District 3 Marco (Tony) A. Reyes District 4 Greg Ferguson, Chairman District 5 Yuma County Planning & Zoning Commission Kenneth Beecher District 1 Fred Covarrubias District 1 Paul White District 2 Max Bardo District 2 Joe Melchionne, Chairman District 3 Wayne Briggs District 3 Victor Lozano District 4 Gary Black, Vice-Chairman District 4 Marie Barnett District 5 John McKinley District 5 Yuma County Department of Development Services Long Range Planning Section Monty Stansbury, AICP, Director, Department of Development Services Paul Melcher, Planning Director Anne Eichberger, AICP, Manager, Long Range Planning Section Andrew Fangman, Planner III Juan Leal-Rubio, Planner II Russell Lambert, AICP, Planner II Fernando Villegas, Planner II Angelica Gomez, Office Specialist II Yuma County Department of Development Services Planning & Zoning Division Long Range Planning Section 2351 W. 26th Street Yuma, AZ Prepared by: Andrew Fangman, Planner III 2
3 Executive Summary In December of 2001, the Board of Supervisors adopted the Yuma County 2010 Comprehensive Plan (Plan). The Plan is intended to coordinated and harmonize development in the unincorporated areas of Yuma County. In order to easily administer the Plan, the County was divided into a number of planning areas. The Yuma Valley Planning Area encompasses the furthest southwestern portion of Yuma County, see Figure 1 on page 5 for the exact boundaries. The Yuma Valley Planning Area covers a total area of 72 square miles (46,006 acres), with 57 square miles (36,508 acres) under the land use planning jurisdiction of Yuma County. The Yuma Valley Planning Area is a rural area that is surrounded to the west, northwest and north by the incorporated communities of San Luis, Somerton, Yuma, and includes the various units of the Cocopah Reservation. Since the Plan was adopted in 2001, it is necessary to identify needed updates the Plan to better reflect the goals and needs of the area. In order to accomplish this the Plan elements will be updated. The first step in this process is the preparation of the Yuma Valley Planning Area Background Study which details the current conditions of the planning area and how the area has changed in the past seven years. The total population of the Yuma Valley Planning Area is 3,517, of which 75.7% classify themselves as Hispanic. This is 25.2% more than the percentage of Yuma County as whole, where 50.5% of people classify themselves as Hispanic. Proportionally, a higher percentage of people identifying themselves as Hispanic live in the Yuma Valley Planning Area than do in Yuma County and Arizona as a whole. Compared to Yuma County and the State of Arizona, the Yuma Valley Planning Area has a younger population proportionally of people aged 5 to 24. Nearly 92% of the 37,693 acres that comprise the Yuma Valley Planning Area are designated as Agriculture/Rural Preservation. Land with this designation in the Planning Area is nearly always being actively farmed. Since 2001, eleven amendments to Comprehensive Plan to change land use designations on specific parcels have been approved in the Yuma Valley Planning Area. All these have been very small in size: together the eleven approved amendments changed land use designation on a total of 25 acres. Only 8.84 acres of land that had been previously designated as Agriculture/Rural Perseveration had its land use designation changed to a residential designation, changes to Commercial or the Transportation Communications and Utilities make up the remaining acres that was subject to a change in land use designation. This is an indication of success on a major goal of the Comprehensive Plan. The conversion of prime, irrigated farmland to residential uses has not occurred at a significant rate. Between 2000 and 2008, the Board of Supervisors approved eleven rezoning requests in the Yuma Valley Planning Area. The area covered by these rezonings is small and covers in total acres. Five of the eleven rezoning requests covered less than an acre. The small number of number of rezonings and the small size of them is a strong indicator that land use in the Planning Area has remained very stable with no major changes occurring over the past seven years. 3
 accounted for 17% of the added")
4 Executive Summary Between 2000 and 2007 a total of 74 housing units were added to the Yuma Valley Planning Area. Site built single family homes account for 42% of the total housing units added, manufactured homes account for 41%, and mobile homes (units manufactured prior to 1976) accounted for 17% of the added housing units. On average five to ten housing units per year are added to the Planning Area, with the number of site built single family houses and manufactured homes being about equal. Since 2002 only one placement permit for a mobile home has been issued in the Yuma Valley Planning Area. Nearly all the housing units added in the Yuma Valley Planning Area are located in areas already developed for residential use, such as the Gadsden vicinity and in the vicinity of Somerton Avenue and County 12 th Street. In comparison to Yuma County and Arizona as whole, a significantly higher percentage of Planning Area residents are employed in the agriculture sector. Of the employed population in the Planning area, 17.5% identify themselves as being directly employed in the agricultural sector. The Planning Area has a notably smaller percentage, 16.6%, of its workforce employed by governmental entities than in comparison to Yuma County as a whole, 23.7%. The Hunter s Hole Restoration project on the Colorado River is dedicated to revitalizing the native habitat while reducing the illegal crossings and crime occurring in a stretch of the River between the Mexico-Baja California Norte/California and Arizona International Boundaries. This multi-agency cooperative venture is focused on enhancing a 1,000 acre area located on the Colorado River between San Luis and Gadsden under the auspices of the Yuma Crossing National Heritage Area (YCNHA) and the Mexican government. The YCNHA is requesting authorization and/or funding to secure this demonstration project. The main elements of the complete project will include clearing all non-native vegetation while retaining native trees such as cottonwood, willows and mesquite and excavating a 5-mile historic channel, currently overrun with non-native vegetation, and to create pond areas. The spoils from the channel and pond excavation will be used to build a levee on the perimeter of the valuable habitat that can be patrolled by law enforcement agencies. The Yuma Valley Planning Area is dominated by intense agricultural activity which may be seen in both the land use of the area and the nature of the employment of the Planning Area residents. None of land use changes or developments that occurred between 2000 and 2008 caused the overwhelmingly agricultural nature of the Planning Area to change, which is consistent with the vision for the Planning Area in the Plan. Colorado River 4

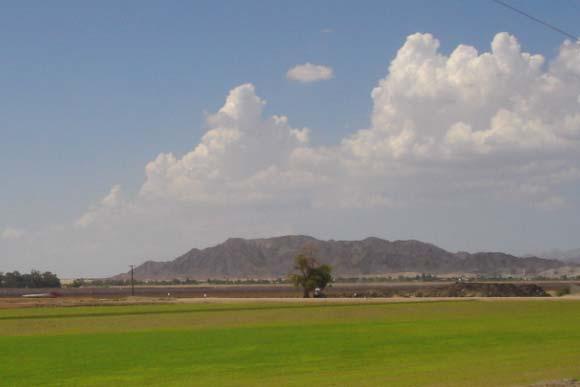
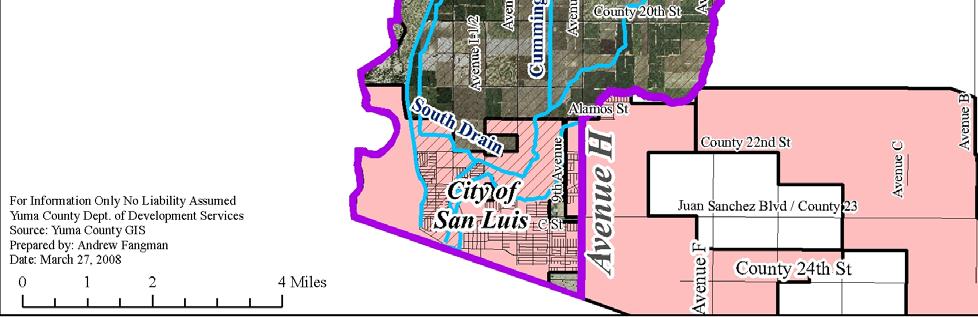
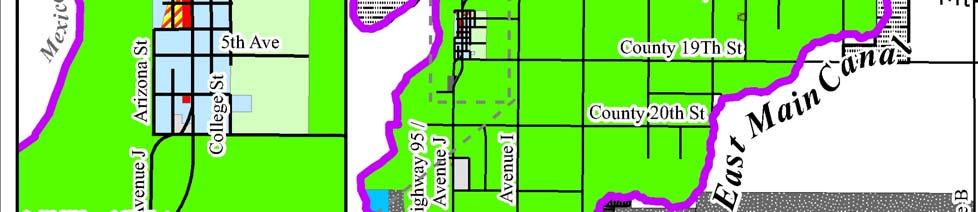
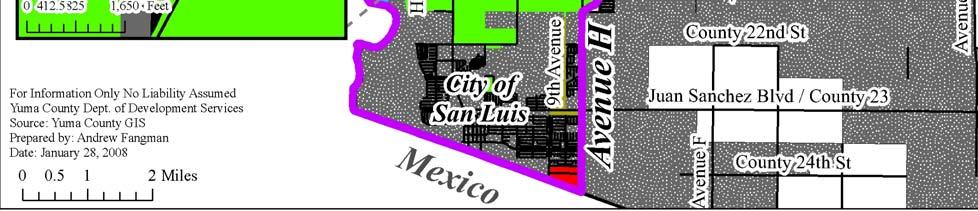
5 Location The Yuma Valley Planning Area contains of the most western portion of Yuma County. The bulk of the City of Somerton and the City of San Luis are located within the boundaries of the Planning Area. The City of Yuma is located adjacent to the east side of the Planning Area along Avenue D. The majority of the Cocopah Reservation is located within the Planning Area. Although the Cocopah Nation is not within the County s land use planning jurisdiction, they do have a tremendous influence on the unincorporated areas nearby. This report will focus exclusively on the unincorporated areas that are under the County s land use planning jurisdiction. Figure 1: Yuma Valley Planning Area 5
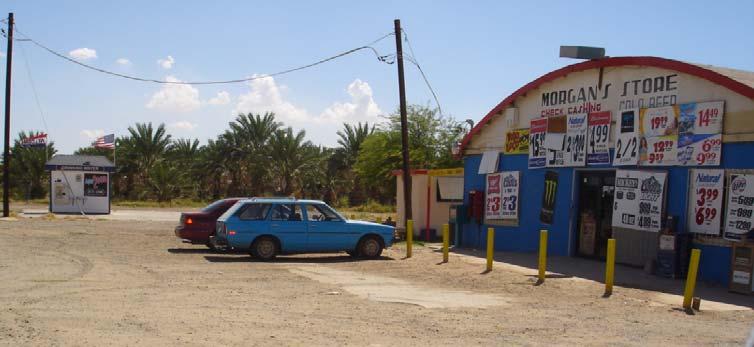
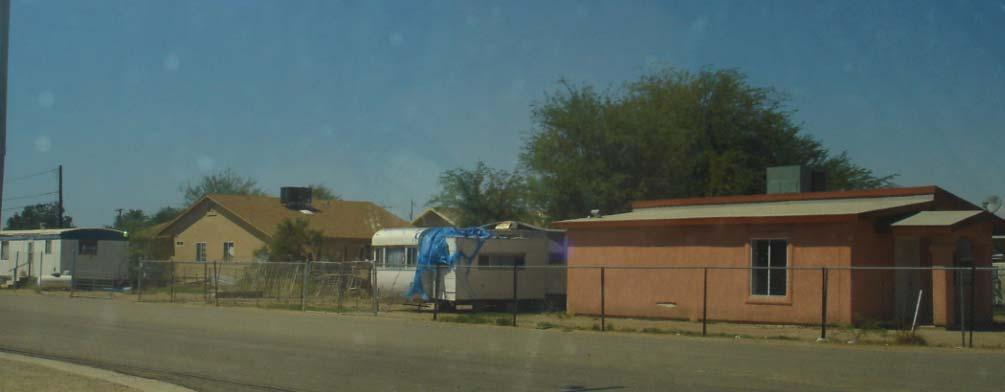
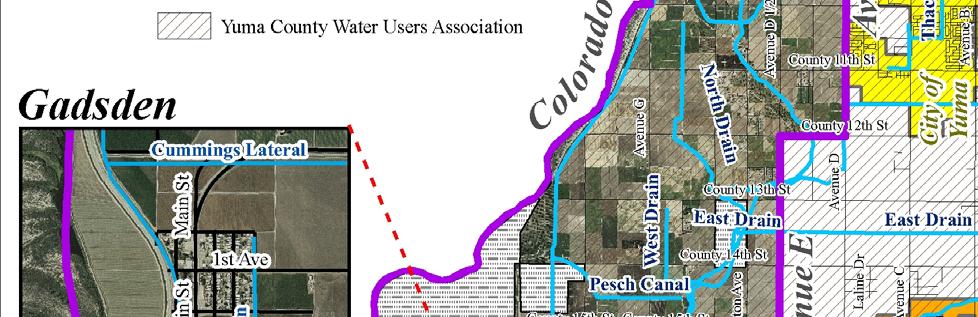
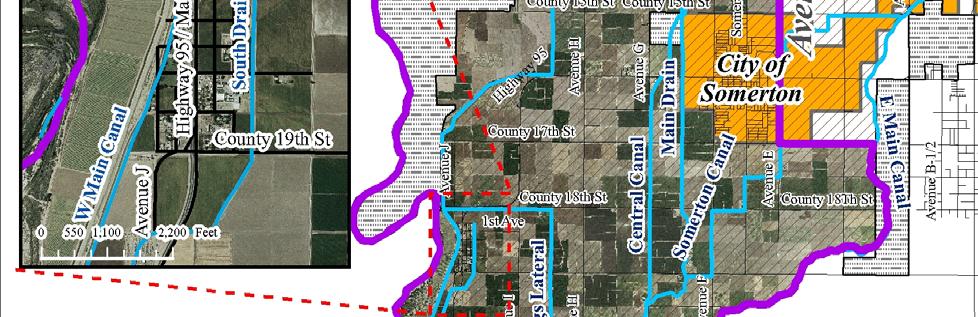
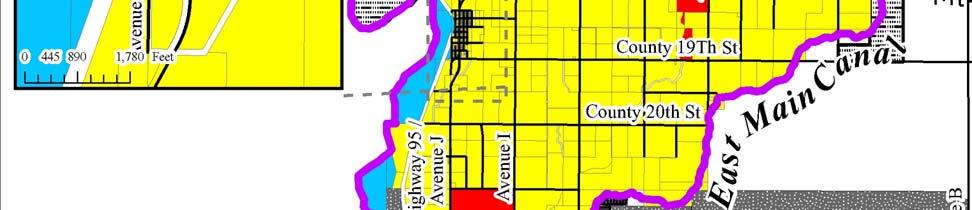
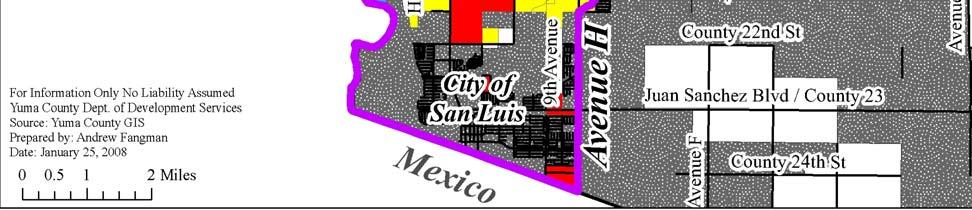
6 Gadsden Gadsden is small unincorporated community in the Planning Area that is located between San Luis and Somerton (Figure 2). In the 2000 Census the population of Gadsden was 953 with 97.2% of people classifying themselves as Hispanic. A total of 290 housing units were reported in Gadsden in the 2000 Census; since then a total of 17 housing units have been added through the end of Prior to 2005 there was no centralized wastewater or sanitary sewer system within Gadsden. The area was dependent on septic tanks for wastewater treatment, many of which were failing due to age and inadequate maintenance. A project to connect the Gadsden area to the City of San Luis sanitary sewer system was conceived in 1997 through a Governor's Action Zone planning designation. With the seed money (approximately $800,000) from this designation, the County leveraged $3.5 million from the USDA Rural Development and $1.2 million from the EPA. Construction on the project was completed in Approximately 200 household connections or 1,000 people were hooked to up the sanitary sewer system. The average cost to each property owner was $1,200 payablethrough a 20 year repayment loan from USDA, Rural Development at an interest rate around 4%. Figure 2: The Gadsden Area 6

7 Community Facilities Figure 3: Community Facilities 7

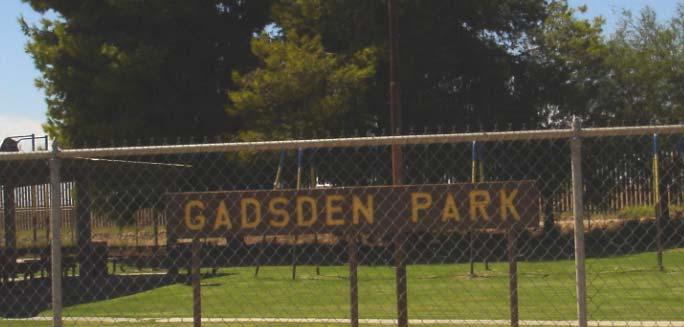
8 Community Facilities This section the background study documents the existing community facilities as detailed in Figure 3 on page 7, which include school, Rural/Metro stations, and Sheriff s substation sites. The Yuma Valley Planning Area is served by three elementary school districts, Crane School District #13, Gadsden School District #32, and Somerton School District #11. Aside from Gadsden Elementary School, all the schools serving the Yuma Valley Planning Area are located within the Cities of Yuma, Somerton, and San Luis. Yuma Union High School District #70 serves the entire planning area. High school age residents of the planning district attend either San Luis High School or Cibola High School. Fire and emergency medical services in the Planning Area are provided by the Rural/Metro Corporation. Fire service is funded on a subscription basis. Rural/Metro serves the Planning Area from two stations: one located in Gadsden, and one located on 8 th Street in Yuma. The Yuma County Sheriff s Office provides law enforcements services for the Planning Area, with substations located in Gadsden and on 8 th Street in Yuma. In November of 2005, the voters approved a $53.7 million bond issue to expand and improve library services in Yuma County. Several projects in and around the Yuma Valley Planning Area will be funded by this bond. The Somerton branch library, 240 Canal Street, will be expanded from 6,710 square feet to 12,690 square feet. A new 30,733 square foot facility for the San Luis branch library will be constructed near the intersection of Juan Sanchez Boulevard and 6 th Avenue. Gadsden School 8

9 Hunter s Hole The Hunter s Hole Restoration project along the Colorado River is dedicated to the revitalization of the native habitat and the reduce the number of illegal crossings and associated crime occurring across the International Boundary with Mexico. This international and multi-agency cooperative venture is focused on enhancing a 1,000 acre area under the auspices of the Yuma Crossing National Heritage Area and the Mexican government. The Yuma Crossing National Heritage Area (YCNHA) is spearheading the effort, and through funding from a private foundation, is proceeding with consensus-building, design, and preliminary cost estimate. The YCNHA is requesting authorization and/or funding at this time for a demonstration project at this site for either FY2008 or FY2009. This is significant because adequate funding from the private foundation is not secured to fully complete the design and permitting necessary to complete the project. The project activities will focus on the following: Protect the valuable habitat inside of the proposed security levee. Clear all non-native vegetation while retaining native trees such as cottonwood, willows and mesquite. Figure 4: Hunter s Hole Excavate the 5-mile historic channel, which is currently overrun with non-native vegetation, and create pond areas. The spoils from the channel and pond excavation will be used to build a levee on the perimeter of the valuable habitat that can be patrolled by law enforcement agencies. Fill the channel and pond areas with water from nearby wells. The channel and ponds, 60 ft. to 300 feet wide and 8 to 10 feet deep, would be connected by a series of water control structures to allow variations in depth. Plant wetland hedges and rushes adjacent to the excavated channels to develop marshland and wetland habits. Plant low-lying native grasses and mesquite trees in higher areas adjacent to the wetland which would leave the area easy to monitor. Plant a low density of native trees spaced to maximize line of site and a visual corridor while also providing wildlife habitat. Low growing native under story grasses will be planted underneath this canopy to out-compete non-native species and to maintain the visual corridor. 9

10 Soil Types Figure 5: Soil Types Soil Survey of the Yuma-Wellton Area. United States Department of Agriculture

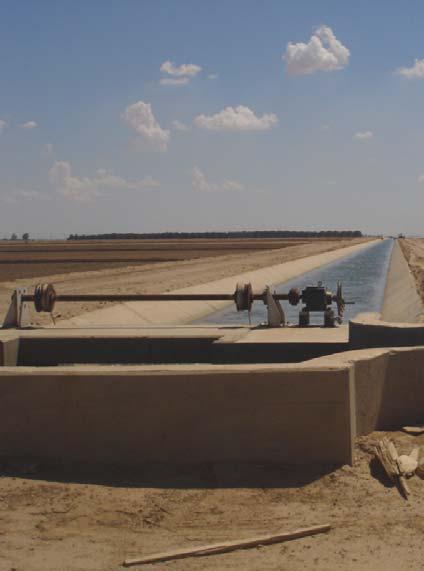
11 Farmland, Irrigation, & Soils The Yuma County Water Users Association serves the irrigation needs of the Yuma Valley Planning Area which, contains approximately 53,000 acres of irrigated land. This represents 33% of the total irrigated land in Yuma County. Farmland within the planning area tends to be of the highest quality found in the Yuma County, all of it located off the mesa in the fertile river bottoms. Some of the more common crops that are grown in the planning area include lettuce, cotton, melons, wheat, and safflower. The Yuma Valley is often referred to the best lettuce growing farmland in the United States. Irrigation water originates from the Colorado River and is diverted at Imperial Dam into the All American Canal, from it is diverted into the Yuma Canal, sent into a siphon and under the Colorado River into Arizona. The Yuma Canal is then spilt into the West Main, Central, and East Main Canals, which serve the Yuma Valley Planning Area. In the Planning Area the Main Drain canal carries spent water from farmlands east of the Colorado River and runs through the central part of the area terminating at the Boundary Pumping Plant adjacent to the Mexican border. The Main Drain and its several branches total approximately 56 miles in length. There are sixteen drainage wells along the east side of the Yuma Valley that intercept underground flows from Yuma Mesa and divert seepage from cultivated lands. Eleven of these wells are operated and maintained by the Yuma County Water Users' Association; the remaining five wells are operated by the Bureau of Reclamation. Most of the water pumped from the drainage wells is discharged into the open drain system. 3 Extensive drainage systems and pumping are necessitated due to the high ground water found in much of the Planning Area. In April of 2008,the Bureau of Reclamation reported 8,200 acres in the Planning Area where the depth to ground water was six feet or less. In much of the rest of the Planning Area, the depth of groundwater was reported at twelve feet or less. Depth to groundwater fluctuates throughout the year as the amount of irrigation water being applied changes with the different growing seasons. The Bureau of Reclamation releases monthly updates on groundwater depth. The most current report can be obtained at the following website: High ground water can complicate the installation of traditional septic systems and often necessitates the installation of alternative sewage disposal systems. The three most common soil types in the Planning Area are Holtville, Gadsden, and Kofa Clay all very similar soil types. They are best characterized as deep, nearly level, well drained soils on flood plains and low terraces. These soil types are well suited for irrigated crops. Because of slow permeability and high shrink-swell potential of these soils there, are challenges in developing sanitary and community facilities. 4 Farmland in the Yuma Valley 3 Yuma Area Office, United States Bureau of Reclamation. Yuma Project Soil Survey of the Yuma-Wellton Area. United States Department of Agriculture

12 Farmland & Irrigation Facilities Figure 6: Farmland & Irrigation Districts 12
13 Depth to Groundwater Figure 7: Depth to Groundwater Yuma Area Office, United States Bureau of Reclamation. Yuma Area Water Management System YAWMS/GROUNDWATER_maps.cfm

14 Demographics Figure 8: Population by Census Block 14
15 Demographics A total of 24,500 people live within the boundaries of the Planning Area. As illustrated in Figure 9 3,517, 14%, people, live in the unincorporated portion of the Planning Area. The remaining 86% live within either the City of Somerton, the City of San Luis, or on the Cocopah Reservation. All demographics in this report refer only to the unincorporated population. Of the 3,517 people who live within the Yuma Valley Planning Area, 75.7% classify themselves as Hispanic. This is 25.2% more than of Yuma County as whole, where 50.5% classify themselves as Hispanic. Proportionally more people in the Planning Area identify themselves as Hispanic than do in Yuma County and Arizona as a whole. Unincorporated Yuma County 3,517 City of San Luis 12,818 City of Somerton 7,280 Cocopah 924 Total 24,500 Table 1: Population by Jurisdiction 5 Yuma Yuma Valley County Arizona Total Population 3, ,026 5,130,632 White, Non- Hispanic ,956 3,274,258 Hispanic 2,662 80,772 1,295,617 African-American 26 3, ,941 American Indian 43 1, ,270 Other 35 3, ,546 Table 2: Race & Ethnicity 5 City of Somerton % Population by Jurisdiction Cocopah 924 4% Figure 9: Population by Jurisdiction 5 Unincorpor ated Yuma County % City of San Luis % Race & Ethnicity 80.0% 70.0% 60.0% 50.0% 40.0% 30.0% 20.0% 10.0% 0.0% 75.7% 63.8% 50.5% 44.3% 21.4% 25.3% 0.7% 2.0% 2.9% 1.2% 1.1% 4.5% 1.0% 2.1% 3.5% White, Non-Hispanic Hispanic African-American American Indian Other Yuma Valley Yuma County Arizona Figure 10: Race & Ethnicity U.S. Census 15
16 Demographics Figure 11 depicts the percentage of a population contained in five-year age cohorts. Compared to Yuma County and the State of Arizona as a whole, the Yuma Valley Planning Area has a younger, population. In the age cohorts for people 5 to 24 years and younger this Planning Area has proportionally much more of its population in these age cohorts. The age cohort with greatest percentage of people in it for the Yuma Valley Planning Area is the one the that covers people from 10 to 14 years old. The most likely explanation for this phenomena is that the residents of the Planning Area on average have larger families than do residents of the State or County as a whole. The fact that average family size in the Yuma Valley Planning Area is higher than those of the County or State as whole supports this conclusion, as shown in Table 4. Arizona Yuma County Yuma Valley Table 3: Average Family Size 6 Ages # Under 5 years to 9 years to 14 years to 19 years to 24 years to 29 years to 34 years to 39 years to 44 years to 49 years to 54 years to 59 years to 64 years to 69 years to 74 years to 79 years to 84 years years and over 19 Table 4: Population by Age Groups Yuma Valley 6 Age Cohorts by Percentage of Populations 12% 11% 10% 9% 8% 7% 6% 5% 4% 3% 2% 1% 0% Under 5 years 5 to 9 years 10 to 14 years 15 to 19 years 20 to 24 years 25 to 29 years 30 to 34 years 35 to 39 years 40 to 44 years 45 to 49 years 50 to 54 years 55 to 59 years 60 to 64 years 65 to 69 years 70 to 74 years 75 to 79 years 80 to 84 years 85 years and over Arizona Yuma County Yuma Valley Figure 11: Percent of Total Population by Age Cohort U.S. Census 16

17 Demographics The Census Bureau reports more detailed demographic data at the Census Tract level. All information on pages is comprised of data only reported at the Census Tract level, the Planning Area contains parts of five Census Tracts. All statistics found on pages is comprised of the of these five Census Tracts minus the statistics for incorporated areas and the Cocopah Reservation. The area covered be these statistics is shown in yellow in Figure 12. Figure 12: Ares Covered by Census Tract Data 17
18 Income A greater proportion of households in the Yuma Valley Planning Area, 39.3% have a household income of less than $25,000 per year than does Yuma County, 35.9% or the State of Arizona, 27.3% as whole. Approximately 50% of households in the Planning Area have a household income of less than $25,000 per year. Also in the 2000 census, 11% of households reported having no income. These statistics are clear indication that the Yuma Valley Planning Area has lower income level than the County or the State as a whole. In Yuma County 35.8% of households are receiving Social Security, in the Yuma Valley Planning Area only 20.8% of households are receiving Social Security income. This is an indication that retirement housing common in much of the County is not as common in the Planning Area. Household Income 16% 14% 12% 10% 8% 6% 4% 2% 0% Less than $10,000 $10,000 to $14,999 $15,000 to $19,999 $20,000 to $24,999 $25,000 to $29,999 $30,000 to $34,999 $35,000 to $39,999 $40,000 to $44,999 $45,000 to $49,999 $50,000 to $59,999 $60,000 to $74,999 $75,000 to $99,999 $100,000 to $125,000 to $150,000 to $200,000 or $124,999 $149,999 $199,999 more Arizona Yuma County Yuma Valley Figure 13: Household Income 7 Household With Earnings Household With Social Security Income No earnings 11% 90% 80% 70% 72.90% 64.20% 79.20% 60% 50% 40% 30% 20% 27.10% 35.80% 20.80% With earnings 89% 10% 0% Arizona Yuma Count y Yuma Va lley With Social Security income No Social Security income Figure 14: Households With Income U.S. Census Figure 15: Households With Social Security Income 7 18
19 Demographics Approximately 61% of planning area residents report a commute time between 15 and 44 minutes. This is consistent with most residents having jobs in nearby urbanized areas rather in than the Planning Area itself and with agricultural workers traveling between various fields. Number of Minutes Commuters Less than 5 minutes 34 5 to 9 minutes to 14 minutes to 19 minutes to 24 minutes to 29 minutes to 34 minutes to 39 minutes to 44 minutes to 59 minutes to 89 minutes or more minutes 36 Worked at home to 59 8% More than 60 9% 30 to 44 23% Commute Time in Minutes Table 5: Yuma Valley Commute Times 8 Figure 15: Yuma Valley Length of Commutes 8 Less than 15 22% 15 to 29 38% Approximately 44% of Planning Area residents moved between 1995 and 1999, 61% moved from somewhere within Yuma County. Twenty-two percent of new residents moved from a foreign county, another 10% moved from a Western state other than Arizona. The remaining 7% came from Arizona and all non Western states. Residents Who Moved Between 1995 and 1999 Moved 46% Previous Place of Residence of Those Who Moved Between 1995 and 1999 West 10% Foreign country 22% Figure 16: Movers 8 Same House 54% Sout h 1% Midwest 3% Northeast 2% Arizona 1% Yuma County 61% Figure 17: Yuma Valley Previous Place of Residence U.S. Census
20 Employment In comparison to Yuma County and Arizona as whole a significantly higher percentage of Planning Area residents are employed in the agricultural sector of the economy. Approximately 17.5% of employed Planning Area residents report being directly employed in the agricultural sector; however this does not include people who are employed in businesses that provide support to the agricultural sector. Both the County and the Planning Area have a similar percentage of employed residents working in the private, non-agriculture sector of the economy, a percentage that is much smaller than is found in the State as whole (Figure 170. The Planning Area has a smaller percentage of its workforce is employed by governmental entities. This is likely explained by the fact that there are very few governmental installations located within the Planning Area, the Yuma Desalting Plant and the attached Bureau of Reclamation offices being notable exceptions. Employment Percentages by Sector 60% 40% 20% 0% Agriculture Private, Non- Agriculture Not For Profit Governmnet Self Employed Arizona 1.5% 71.5% 5.3% 15.1% 6.3% Yuma County 8.7% 57.3% 4.8% 23.7% 5.6% Yuma Valley 17.5% 57.2% 3.8% 16.4% 7.3% Figure 17: Employment by Sector 8 Not For Profit 4% Government 16% Employment by Sector Self Employed 5% Agriculture 18 % Private, Non- Agric ult ure 57% Type of Employer # of Employees Agriculture 223 Private, Non-Agriculture 728 Not For Profit 48 Government 208 Self Employed 65 Table 6: Employment by Sector 8 Figure 18: Employment by Sector U.S. Census

21 Occupations Of the occupational categories used by the Census Bureau, there was a greater percentage of employed Planning Area residents, in six categories, than in the State or County as whole and these occupations represent some of the economic strengths of the Planning Area. Two of these occupation are directly related to the agriculture sector; farmer and farm managers; and farming occupations. Two other occupations in which the Planning Area is strong, motor vehicle operation and material moving workers, are occupations that often play a role directly supporting agricultural activity. Table 8: Employment by Sector U.S. Census 21
22 Housing When Housing Units Were Constructed 40% 35% 34% 30% 29% 29% 25% 22% 25% 22% 24% 22% 20% 18% 15% 14% 10% 5% 11% 10% 7% 7% 8% 5% 3% 2% 3% 2% 2% 0% Built 1990 to 2000 Built 1980 to 1989 Built 1970 to 1979 Built 1960 to 1969 Built 1950 to 1959 Built 1940 to 1949 Built 1939 or earlier Figure 19: When Housing Units Were Constructed 10 Arizona Yuma County Yuma Valley As illustrated in Figure 19, the housing stock in the Yuma Valley Planning Area is older than that found in Yuma County and Arizona as whole. The Yuma Valley Planning Area saw a greater percentage of its housing stock constructed in the 1970 s than in any other decade. Both Yuma County and Arizona as a whole saw the greatest part of their housing stock constructed in the 1990 s. For every decade prior to the 1970 s, a greater percentage of the Yuma Valley Planning Area housing stock was constructed than was constructed in Yuma County and Arizona as a whole. This is a clear indication that the Planning Area is characterized by an aging housing stock. Since 2000 a total of 74 housing units have been added in the Yuma Valley Planning Area accounting for approximately 6% of the 1,303 housing units that exist in the planning area. Approximately 62% of all housing units were constructed prior to U.S. Census 22
23 Housing Units The Yuma Valley Planning Area has lower vacancy rate than that found in Yuma County as whole, this likely is an indication that housing for seasonal residents which is common in other parts of the county is not common in the Yuma Valley Planning Area. The rate of homeownership in the Yuma Valley Planning Area is similar, but slightly lower to that found in Yuma County and the State of Arizona as whole. Occupancy Status of Housing Units 100.0% 90.0% 80.0% 70.0% 60.0% 50.0% 40.0% 30.0% 20.0% 10.0% 0.0% 86.9% 85.3% 72.6% 22.4% 13.1% 14.7% Arizona Yuma County Yuma Valley Planning Area Occupied Vacant Figure 20: Occupancy Status of Housing Units 11 Owner or Renter Occupied Housing Units 80.0% 70.0% 68.0% 72.2% 66.9% 60.0% 50.0% 40.0% 30.0% 32.0% 27.8% 33.1% 20.0% 10.0% 0.0% Arizona Yuma County Yuma Valley Planning Area Owner Occupied Renter Occupied Figure 21: Owner of Renter Occupied Housing Units U.S. Census 23


24 Land Ownership Figure 22: Land Ownership 24

25 Land Ownership Over 90% of land in Yuma County is owned by either the federal or state government. A much different situation exists in the Yuma Valley Planning Area. In the Planning Area 92% of land is owned by private parties. The Federal government owns 5% of land in the Planning Area, and the State owns the remaining 3%. This land ownership pattern reflects the intense agricultural use of the Planning Area. Almost all of the federally owned land is controlled by the Bureau of Reclamation and is located along the Colorado River. Land owned by the State Land Department is scattered Federal Government 5% Land Ownership State of Arizona 3% Privatley Owned 92% Figure 23: Land Ownership Ownership Acres Federal Government 1,756 State of Arizona 1,214 Privately Owned 33,538 Table 9: Land Ownership West Main Canal & Border Fence 25

26 Land Use Designations Figure 24: Land Use Designations 26
 1 0.00% Commercial/Trade (C-CT) 7 0.02% Heavy Industrial (I-HI) 97 0.26% Low Density Residential (R-LD) 29 0.08% Medium Density Residential (R-MD) 612 1.")
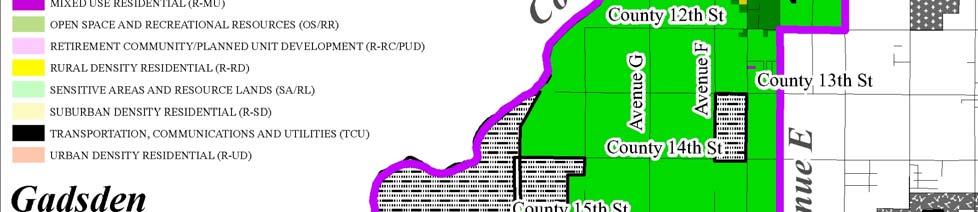
27 Land Use Designations Land Use Designation Acres Acres Agriculture/Rural Preservation (A-RP) 34, % Agriculture/Rural Residential (A-RR) % Commercial (C) % Commercial Residential (C-RC) % Commercial/Trade (C-CT) % Heavy Industrial (I-HI) % Low Density Residential (R-LD) % Medium Density Residential (R-MD) % Mixed Use Industrial (I-MU) % Mixed Use Residential (R-MU) % Retirement Community/Planned Unit Development (R-RC/PUD) % Rural Density Residential (R-RD) 1, % Suburban Density Residential (R-SD) % Transportation, Communications And Utilities (TCU) % Urban Density Residential (R-UD) % Table 10: Land Use Designation 27

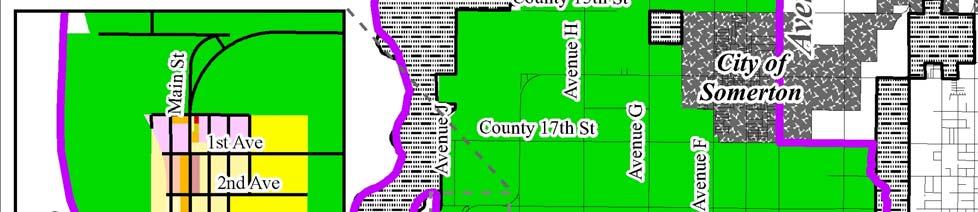
28 Land Use Designations Figure 26: Changes to Land Use Designations 28
29 Land Use Designations Amendment # New Land Use Designation Previous Land Use Designation Acreage Date of Change 2003-MA-10 Medium Density Residential Commercial 0.2 2/3/ MA-15 Retirement Community/ Planned Unit Development Commercial/Trade /3/ MA-03 Agriculture/Rural Preservation Suburban Density Residential /4/ MA-14 Commercial Residential/ Medium Density Residential Commercial /13/ MA-15 Agriculture/Rural Residential Low Density Residential /22/ MA-01 Commercial/Trade Urban Density Residential /9/ MA-32 Agriculture/Rural Preservation Rural Density Residential 2 8/16/06 Transportation, Communications 2006-MA-20 Urban Density Residential And Utilities 7 10/16/ MA-23 Agriculture/Rural Preservation Mixed Use Residential /4/ MA-06 Agriculture/Rural Preservation Transportation, Communications And Utilities 6 7/18/ MA-08 Retirement Community/ Planned Unit Development Mixed Use Industrial /27/07 Table 11: Changes to Land Use Designations Almost 92% of the 37,693 acres that comprise the Yuma Valley Planning Area are designated as Agriculture/Rural Preservation, which requires a minimum parcel size of 40 acres. Land with this designation in the Planning Area is nearly always being actively farmed and is irrigated. Land with a residential, commercial, or industrial land use designation is generally located in and around Gadsden. Since 2001 eleven amendments to Comprehensive Plan to change the land use designations have been, approved in the Yuma Valley Planning Area. All these changes have been very small in scale; together the eleven approved amendments changed land use designation on a total of 25 acres. Only 8.84 acres of land that was previously designated as Agriculture/Rural Perseveration had its land use designation changed to a to a residential designation. This is an indication that success on a major goal of the Comprehensive Plan, the conversion of prime, irrigated farmland is being achieved. 29


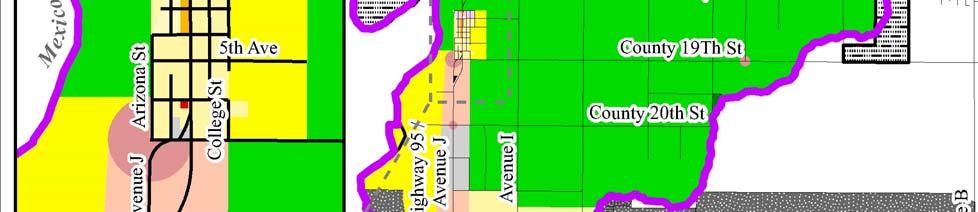
30 Zoning District Figure 27: Zoning Districts 30

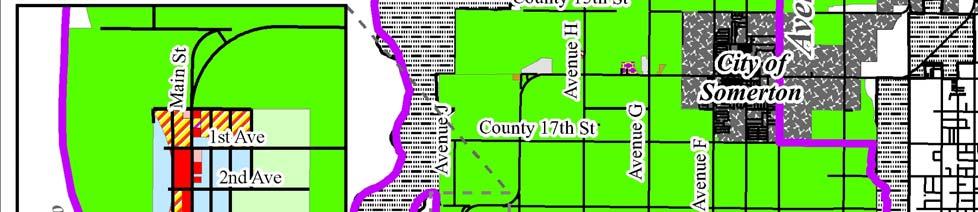
31 Rezoning 2000 to 2007 Figure 28: Rezonings 2000 to
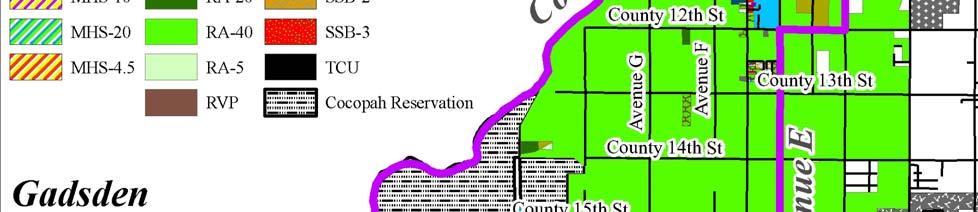
32 Zoning District Zoning District Abbreviation # of Parcels % of Parcels Total Acreage Rural Area - 40 acre minimum parcels RA % 27,551 Rural Area - 20 acre minimum parcels RA % 163 Rural Area - 10 acre minimum parcels RA % 884 Rural Area - 5 acre minimum parcels RA % 557 Suburban Ranch - 4 acre minimum parcels SR % 20 Suburban Ranch - 3 acre minimum parcels SR % 283 Suburban Ranch - 2 acre minimum parcels SR % 950 Suburban Ranch - 1 acre minimum parcels SR % 239 Suburban Site Built - 3 acre minimum Parcels SSB % 10 Suburban Site Built - 2 acre minimum Parcels SSB % 422 Suburban Site Built - 1 acre minimum Parcels SSB % 4 Low Density Residential- 40,000 square feet minimum R % 292 Low Density Residential- 20,000 square feet minimum R % 239 Low Density Residential - 6,000 square feet minimum R % 50 Manufactured Home Subdivision - 20,000 square feet minimum MHS % 46 Manufactured Home Subdivision - 10,000 square feet minimum MHS % 5 Manufactured Home Subdivision - 4,500 square feet minimum MHS % 97 Manufactured Home Park MHP 3 0.2% 19 Recreational Vehicle Park RVP 6 0.4% 47 Planned Development PD 4 0.3% 2 Local Commercial C % 8 General Commercial C % 225 Light Industrial LI % 475 Heavy Industrial HI % 586 Transportation, Communications & Utilities TCU 1 0.1% 6 Total - 1,404-33,180 Table 12: Zoning Districts % of Acreage 85.1% 0.4% 2.3% 1.5% 0.1% 0.8% 2.5% 0.6% 0.0% 1.1% 0.0% 0.8% 0.6% 0.1% 0.1% 0.0% 0.3% 0.1% 0.1% 0.0% 0.0% 0.6% 1.3% 1.6% 0.0% Parcels zoned Rural Area account for 94.8% of the acreage of the Planning Area. Parcels zoned for residential, commercial, or industrial use, accounts for 9.7% of the Planning Area acreage. The zoning found in the Planning Area is consistent with its use as area with intense agricultural production. Residential, Commercial, and Industrial zoning are concentrated in several locations across the Planning Area, most notably in the Gadsden vicinity and in the vicinity of County 12th Street and Avenue E. 32
33 Rezonings CASE LOCATION ACREAGE PREVIOUS ZONING CURRENT ZONING DATE RZ00-63 RZ03-12 RZ03-19 RZ W. Co. 10th St. 2nd St. & Highway 95 (Gadsden) Southwest corner of Lorena Drive & Main St. First Avenue & Main St., Gadsden Avenue G & RZ05-88 County 17 1/4 Street Highway 95 & RZ First Avenue, Gadsden U.S. Highway 95 RZ06-48 & County 19th Street RZ06-51 RZ06-52 RZ07-13 RZ07-20 Main Street & 2nd Street (Gadsden) South Somerton Avenue Avenue E & the alignment of County 11 1/2 Street South Highway Rural Area - 40 acre minimum parcels Low Density Residential - 6,000 square feet minimum parcels (R-1-6) Manufactured Home Subdivision - 4,500 square feet minimum parcels (MHS-4.5) Low Density Residential - 6,000 square feet minimum parcels (R-1-6 Rural Area - 40 acre minimum parcels 1.79 General Commercial (C-2) Rural Area - 40 acre minimum parcels Low Density Residential - 6,000 square feet minimum parcels (R-1-6 Suburban Ranch - 2 acre minimum parcels (SR-2) Rural Area - 40 acre minimum parcels Manufactured Home Subdivision - 4,500 square feet minimum parcels (MHS-4.5) Rural Area - 5 acre minimum parcels (RA-5) & Suburban Site Built - 2 acre minimum 3/5/2001 General Commercial (C-2) 8/18/2003 Local Commercial (C-1) 10/6/2003 Local Commercial (C-1) 9/8/2004 Suburban Site Built - 2 acre minimum parcels (SSB-2) High Density Residential (R- 3) 5/15/2006 5/15/2006 Heavy Industrial (HI0 11/6/2006 General Commercial (C-2) 12/4/2006 Local Commercial (C-1) & Manufactured Home Park (MHP) Transportation, Communications, and Utilities (TCU) Light Industrial - 8,000 square feet minimum parcels (LI- 8000) 5/7/2007 6/18/2007 Table 13: Rezoning 2000 to 2008 Between 2000 and 2008 the Board of Supervisors approved eleven rezoning cases in the Yuma Valley Planning Area. The area covered by these rezonings is small, covering a total of acres. Five of the eleven rezoning covered less than an acre. The small number of rezonings and their even smaller size is a strong indicator that land use in the Planning Area has remained very stable with no major changes occurring over the past eight years. Of the eleven rezonings in the Planning Area, six occurred in the Gadsden vicinity; the remaining five were scattered throughout the Planning Area. The approved rezonings were a mix of residential, commercial, and industrial zoning changes. There was no discernible pattern in type of districts requested. 8/6/

34 Building/Placement Permits Figure 29: Housing Units Added
35 Building/Placement Permits Between 2000 and 2007, a total of 74 housing units were added to the Yuma Valley Planning Area. Site built single family homes account for 42% of the total housing units added, manufactured homes 41%, and mobile homes (units manufactured prior to 1976) 17% of the added housing units. Typically between five to ten housing units per year were added to the Planning Area, with the number of site built single family houses and manufactured homes being about equal. Since 2002, only one placement permit for a manufactured home has been issued in the Yuma Valley Planning Area. Nearly all the housing units added in the Yuma Valley Planning Area are located in areas already developed for residential use, such as the Gadsden vicinity and in the vicinity of Somerton Avenue and County 12 th Street. Significantly very few housing units were constructed or placed on land that was previously being farmed. This is very strong indicator the agricultural lands within the planning area not being converted into residential uses. Type of Housing Units Constructed/Placed Mobile Home 17% Single Family Site Built 42% Manufactured Home 41% Figure 30: Type of Housing Unites Constructed/Placed Housing Units Added Single Family Site Built Manufactured Home Mobile Home Total Figure 31: Housing Units Added by Year 35
36 Summary The Yuma County 2010 Comprehensive Plan sustaining the agriculture and rural character of the Yuma Valley Planning Area is major goal. With this in mind land use designations in the Planning Area were designed to preserve agricultural lands in the Yuma Valley where liquefaction, soil failure, and a high water tables necessitate high engineering costs to allow for development. A quick examination of changes to land use designations, zoning districts, and housing units added since the adoption of the Comprehensive Plan shows that this goal has been met. Only 8.84 acres of land that had been designated as Agriculture/Rural Perseveration had its land use designation changed to a residential designation. This is an indication that success on a major goal of the Comprehensive Plan, the prevention of conversion of prime, irrigated farmland to residential uses. Between 2000 and 2007 a total of 74 housing units were added to the Yuma Valley Planning Area. Nearly all the housing units added in the Yuma Valley Planning Area are located in areas already developed for residential uses, such as the Gadsden vicinity and in the vicinity of Somerton Avenue and County 12 th Street. Significantly very few housing units were constructed or placed on land that was previously being farmed. This is very strong indicator the agricultural lands within the planning area not being converted into residential uses Parcels zoned RA-40 account for 85.1% of the acreage of the Planning Area. Parcels zoned for residential, commercial, or industrial use, accounts for 9.7% of the Planning Area acreage. Between 2000 and 2008 the Board of Supervisors approved eleven rezoning in the Yuma Valley Planning Area. The area covered by these rezonings is small, land rezoned between 2000 and 2008 covers in total, acres. Five of the eleven rezoning requests covered less than an acre. Between 2000 and 2007 a total of 74 housing units were added to the Yuma Valley Planning Area. Site built single family homes account for 42% of the total housing units added, manufactured homes account for 41%, and mobile homes (units manufactured prior to 1976) accounted for 17% of the added housing units. Typically between five to ten housing units per year are added to the Planning Area, with the number of site built single family houses and manufactured homes being about equal. Since 2002 only one placement permit for a mobile home has been issued in the Yuma Valley Planning Area. Nearly all the housing units added in the Yuma Valley Planning Area are located in areas already residentially developed, such as the Gadsden vicinity and in the vicinity of Somerton Avenue and County 12 th Street. 36
Part Three : COMMUNITY PLAN AREAS AND SPECIAL STUDY AREAS SACRAMENTO 2030 GENERAL PLAN. Introduction
 Special study Areas Part Three : COMMUNITY PLAN AREAS AND SPECIAL STUDY AREAS SACRAMENTO 2030 GENERAL PLAN Introduction Beyond the boundaries of the 2030 General Plan, the City has defined Special Study
SUTTER COUNTY. General Plan Update Technical Background Report
 SUTTER COUNTY General Plan Update Technical Background Report February 2008 SUTTER COUNTY GENERAL PLAN UPDATE TECHNICAL BACKGROUND REPORT PREPARED FOR: SUTTER COUNTY PREPARED BY: PBS&J IN PARTNERSHIP
Airport Planning Area
 PLANNING AREA POLICIES l AIRPORT Airport Planning Area LOCATION AND CONTEXT The Airport Planning Area ( Airport area ) is a key part of Boise s economy and transportation network; it features a multi-purpose
This section of the Plan provides a general overview of the Smoky Mountain Region. It consists of the following four subsections:
 SECTION 3 COMMUNITY PROFILE This section of the Plan provides a general overview of the Smoky Mountain Region. It consists of the following four subsections: 3.1 Geography and the Environment 3.2 Population
Town of Oakfield Agricultural and Farmland Protection Plan
 SECTION III COMMUNITY OVERVIEW A. Regional Setting / Location The Town of Oakfield is located in the northwestern portion of Genesee County. Located west of New York's Finger Lakes, the Town is uniquely
Hazlet. 1. Overview of Hazlet and Its Waterfront. Hazlet Township. 1.1 Geographic Overview
 Hazlet 1. Overview of Hazlet and Its Waterfront 1.1 Geographic Overview Hazlet Township is located in Monmouth County. The Township has a land area of 5.6 square miles. Situated in the Bayshore region
Northeast Quadrant Distinctive Features
 NORTHEAST QUADRANT Northeast Quadrant Distinctive Features LAND USE The Northeast Quadrant includes all the area within the planning area that is east of Interstate 5 and to the north of State Route 44.
Puerto Ricans in Ohio, the United States, and Puerto Rico, 2014
 Issued April 2016 Centro DS2015US-12 Puerto Ricans in Ohio, the United States, and Puerto Rico, 2014 In 2014, Ohio had the tenth largest number of Puerto Ricans in the United States with 108,174 residents,
THE ALBERTA GAZETTE, SEPTEMBER
 VILLAGE OF CEREAL Order No. 16915 IN THE MATTER OF THE "Municipal Government Act": File No. 241(A)3 AND IN THE MATTER OF an application by the Council of the Village of Cereal, in the Province of Alberta,
SECTION 3 GENERAL DESCRIPTION OF THE RIVER BASIN
 SECTION 3 GENERAL DESCRIPTION OF THE RIVER BASIN SECTION 3 GENERAL DESCRIPTION OF THE RIVER BASIN River basin description. A general description of the river basin or subbasin, as appropriate, in which
Map 1.1 Wenatchee Watershed Land Ownership
 Map 1.1 Wenatchee Watershed Land Ownership Map 1.1 Wenatchee Watershed Land Ownership The Wenatchee watershed lies in the heart of Washington state in Chelan County. Just larger than the state of Rhode
OFFERING MEMORANDUM. Applebee s - Ground Lease Walmart Supercenter Outparcel Warren, MI
 Applebee s - Ground Lease Walmart Supercenter Outparcel Warren, MI Florida Investment Sales Exclusively Retail. Extensive Solutions. JOHN ARTOPE Executive Vice President, Market Leader D 407.902.2621 john.artope@srsre.com
City of Durango 5.8 FUNDING TRAILS DEVELOPMENT
 5.8 FUNDING TRAILS DEVELOPMENT The City has been successful in establishing dedicated local funding sources as well as applying for grants to develop the City s trail system, having received nearly $2.4
PROPOSED ALTERATION AND EXPANSION OF THE MOUNT PEARL MUNICIPAL BOUNDARY TO INCLUDE THE AREA OF THE FORMER PEARL ESTATE LANDS & ENVIRONS
 PROPOSED ALTERATION AND EXPANSION OF THE MOUNT PEARL MUNICIPAL BOUNDARY TO INCLUDE THE AREA OF THE FORMER PEARL ESTATE LANDS & ENVIRONS JANUARY 4, 2007 INTRODUCTION In accordance with Sections 3 to 6 inclusive
LAND FOR SALE SUBDIVISION LAND: SFR DEVELOPMENT LAND OF ±100 HOMES Ave 13 1/2, Madera, CA PROPERTY FEATURES
 SALE PRICE: $1,795,000 PRICE PER LOT: $18,505 PRICE PER SF: $2.35 LOT SIZE: 17.48 Acres APN #: 034-151-018 & -019 ZONING: PUD 6,000 R-1 Residential MARKET: City Of Madera PROPERTY FEATURES Shovel-ready
APPLICATION FOR SITE DEVELOPMENT PLAN LETTER OF INTENT Amended
 Est. 1982 Est. 1982 Urban Planning Community Design Landscape Architecture 731 North Weber Street, Suite 10, Colorado Springs, CO 80903, 719 633-9700 http://www.gumanltd.com/ Members American society of
CHAPTER 3: COMMUNITY PROFILE
 CHAPTER 3: COMMUNITY PROFILE Chapter 3 includes the following information: 1. Community Context 2. The Land 3. The People Who Live Here 4. The Housing Landscape 5. The Economy 6. Past and Future Growth
Clackamas County Development Agency
 Clackamas County Development Agency Development Services Building, 150 Beavercreek Rd., Oregon City, OR 97045 www.clackamas.us/transportation/renewal 503-742-4323 The Clackamas County Board of Commissioners
THREE MILE PLAN TOWN OF SUPERIOR COLORADO
 THREE MILE PLAN TOWN OF SUPERIOR COLORADO February 23, 2015 INTRODUCTION This document has been prepared by the Town of Superior, Colorado, to address the existing and proposed land uses within an approximate
Comparison of Taxes, Rates and Fees in the Oak Grove/ Jennings Lodge/ N. Clackamas Areas and Adjacent Cities
 Comparison of Taxes, Rates and Fees in the Oak Grove/ Jennings Lodge/ N. Clackamas Areas and Adjacent Cities Unincorporated Area Oak Grove / Jennings Lodge N. Clackamas Gladstone Happy Valley Service Provider
Department of Agricultural and Resource Economics, Fort Collins, CO
 June 2007 EDR 07-15 Department of Agricultural and Resource Economics, Fort Collins, CO 80523-1172 http://dare.colostate.edu/pubs OF WINE AND WILDLIFE: ASSESSING MARKET POTENTIAL FOR COLORADO AGRITOURISM
POPULATION INTRODUCTION
 POPULATION INTRODUCTION The socio-economic data available at the time of this writing is a conglomeration of data provided by the Kentucky State Data Center, OKI Regional Council of Governments, 2010 U.S.
Puerto Ricans in Georgia, the United States, and Puerto Rico, 2014
 Issued September 2016 Centro DS2014GA-14 Puerto Ricans in Georgia, the United States, and Puerto Rico, 2014 In 2014, an estimated 89,462 Puerto Ricans lived in Georgia and accounted for 1.7 percent of
CHAPTER 1 INTRODUCTION MORENO VALLEY GENERAL PLAN 1. INTRODUCTION. 1.1 What is a General Plan?
 1. INTRODUCTION 1.1 What is a General Plan? A General Plan is a comprehensive long-term strategy for the physical development of a city. It determines how land may be used and the infrastructure and public
T H E VILLAGE OF P h i l m o n t, N Y
 T H E VILLAGE OF P h i l m o n t, N Y Summit Reservoir Area Plan November 17, 2014 Executive Steering Committee Meeting 2 Agenda 1:00 1. Welcome 2. Housekeeping & updates i. Committee contact list review
UNIVERSITY AVE SAN DIEGO, CA 92104
 3487-95 UNIVERSITY AVE SAN DIEGO, CA 92104 LISTED BY: Patsy Ma, MBA, CCIM, CRX, CLS President DRE# 00980137 patsyma@bpinternational.net Francisco Williams, CCIM Vice President Investment Sales DRE #01979442
Agritourism in Missouri: A Profile of Farms by Visitor Numbers
 Agritourism in Missouri: A Profile of Farms by Visitor Numbers Presented to: Sarah Gehring Missouri Department of Agriculture Prepared by: Carla Barbieri, Ph.D. Christine Tew, MS candidate April 2010 University
Puerto Ricans in Connecticut, the United States, and Puerto Rico, 2014
 Issued April 2016 Centro DS2016US-8 Puerto Ricans in Connecticut, the United States, and Puerto Rico, 2014 In 2014, Connecticut was the 6th state with most Puerto Ricans (301,182) in the United States.
DRAFT GENERAL IMPLEMENTATION PLAN AND SPECIFIC IMPLEMENTATION PLAN MIDDLETON MUNICIPAL AIRPORT MOREY FIELD. Revised 12/12/03
 DRAFT GENERAL IMPLEMENTATION PLAN AND SPECIFIC IMPLEMENTATION PLAN MIDDLETON MUNICIPAL AIRPORT MOREY FIELD Revised 12/12/03 As recommended for approval by the Plan Commission General Project Description
MESA COUNTY DEPARTMENT OF PUBLIC WORKS Administration - Building - Engineering Road and Bridge Traffic - Planning - Solid Waste Management
 MESA COUNTY DEPARTMENT OF PUBLIC WORKS Administration - Building - Engineering Road and Bridge Traffic - Planning - Solid Waste Management 200 S. Spruce St. P.O. Box 20,000 Grand Junction, Colorado 81502-5022
Saginaw Charter Township Master Plan
 Saginaw Charter Township Master Plan Overview of Draft & Public Hearing August 20, 2014 230 South Washington Avenue Saginaw Michigan 48607 (989) 754-4717 www.spicergroup.com Saginaw Charter Township Master
Acres Monterey County, California OPEN GROUND IN SALINAS VALLEY VEGETABLE AND STRAWBERRY PROPERTY
 324 +- Acres Monterey County, California OPEN GROUND IN SALINAS VALLEY VEGETABLE AND STRAWBERRY PROPERTY EXCLUSIVELY PRESENTED BY: Morris Garcia License 00834407 (559) 994-7453 Cell Sarah Donaldson License
Performance Clackamas Clackamas County Strategic Plan
 June 2017 update Performance Clackamas Clackamas County Strategic Plan Strategic Goals and Milestones This is the June 2017 update to Performance Clackamas, the Clackamas County Strategic Plan. The plan
ORDINANCE NO. JACKSON TOWNSHIP, CAMBRIA COUNTY
 ORDINANCE NO. JACKSON TOWNSHIP, CAMBRIA COUNTY AN ORDINANCE OF THE TOWNSHIP OF JACKSON AMENDING SECTIONS OF THE JACKSON TOWNSHIP ZONING ORDINANCE AS FOLLOWS: PROVIDING NEW DEFINITIONS OF CAMPGROUNDS, CAMPSITE,
SOUTH INTERCHANGE AREA
 Santaquin City General Plan 1 Location and Characteristics The South Interchange Area of Santaquin is located west of Interstate 15 and south of 500 South (Figure 1). It includes properties already annexed
Puerto Ricans in Rhode Island, the United States, and Puerto Rico, 2013
 Issued September 2016 Centro DS2015US-07 Puerto Ricans in Rhode Island, the United States, and Puerto Rico, 2013 In 2013 an estimated 36,217 Puerto Ricans lived in Rhode Island and accounted for at least
Spadina Avenue Built Form Study Preliminary Report
 STAFF REPORT ACTION REQUIRED Spadina Avenue Built Form Study Preliminary Report Date: July 9, 2014 To: From: Wards: Reference Number: Toronto and East York Community Council Director, Community Planning,
Follow this and additional works at:
 Florida International University FIU Digital Commons Palm Beach County MPO Community Background Reports 1-1-2011 Town of Lake Park Follow this and additional works at: http://digitalcommons.fiu.edu/mpo_palmbeach
Puerto Ricans in Massachusetts, the United States, and Puerto Rico, 2014
 Issued April 2016 Centro DS2016US-07 Puerto Ricans in Massachusetts, the United States, and Puerto Rico, 2014 In 2014, Massachusetts was the fifth state with most Puerto Ricans in the United States. In
Yuma Vertical File Section V Index INDEX. Bridges: Highway 95/Gila River Bridge. Bridges: Ocean to Ocean/ Highway 80
 A Adobe African-American Airport Animals Annexation Archaeology Art Center Artists Authors Auto Racing WILDLIFE B Baseball: Amateur Baseball: San Diego Padres Bicycles Bond/Tax Botanical Gardens Bridges:
The Economic Impact of Children's Camps in Michigan
 Extension Bulletin E-1559, July 1981, File 36.42 The Economic Impact of Children's in Michigan Department of Park and Recreation Resources Michigan State University East Lansing, Michigan in cooperation
I INTRODUCTION AND BACKGROUND
 I INTRODUCTION AND BACKGROUND INTRODUCTION AND BACKGROUND - I I INTRODUCTION AND BACKGROUND a. project setting Looking south to the project site The Davenport Cement Plant (also referred to as the Cemex
600 Aviation Avenue & 100 Agnew Drive Brandon Manitoba ~ 5 Acres Land For Sale SUBJECT PROPERTIES
 600 Aviation Avenue & 100 Agnew Drive Brandon Manitoba ~ 5 Acres Land For Sale SUBJECT PROPERTIES Dan Fontaine Business Development Specialist 204.729.2133 or 1.866.729.2132 d.fontaine@brandon.ca EconomicDevelopmentBrandon.com
JATA Market Research Study Passenger Survey Results
 JATA Market Research Study Passenger Survey Results Prepared for the Jackson Area Transportation Authority (JATA) April, 2015 3131 South Dixie Hwy. Suite 545 Dayton, OH 45439 937.299.5007 www.rlsandassoc.com
Bear Creek Habitat Improvement Project
 06/10/10 Bear Creek Habitat Improvement Project El Paso County, Colorado Pike National Forest and Colorado Springs Utilities Owned Land Report prepared by: Eric Billmeyer Executive Director Rocky Mountain
2. Introduction to Kurunegala Area : 2.1 Location and History : 2.2 Regional Aspects :
 2. Introduction to Kurunegala Area : 2.1 Location and History : Kurunegala town is the capital of Kurunegala district as well as the capital of North Western Province (Fig 2.1). It has been administered
MLS # $202, Acres residential development site in Bay County, Florida
 MLS # 617466 $202,000 35.31 Acres residential development site in Bay County, Florida Highway 231 Fountain, FL Presented By: Don Nations Nations Real Estate 2325-A Frankford Avenue, Suite A Panama City,
NAPA VALLEY VISITOR INDUSTRY 2016 Economic Impact Report
 NAPA VALLEY VISITOR INDUSTRY 2016 Economic Impact Report Research prepared for Visit Napa Valley by Destination Analysts, Inc. Table of Contents S E C T I O N 1 Introduction 2 S E C T I O N 2 Executive
MAPPING UNSHELTERED HOMELESSNESS IN INDIANAPOLIS ISSUE C17-20 NOVEMBER 2017
 MAPPING UNSHELTERED HOMELESSNESS IN INDIANAPOLIS ISSUE C17-20 NOVEMBER 2017 AUTHOR Chris Holcomb, Graduate Student, School of Public and Environmental Affairs, IUPUI 334 N. Senate Avenue, Suite 300 Indianapolis,
Business Growth (as of mid 2002)
") Page 1 of 6 Planning FHWA > HEP > Planning > Econ Dev < Previous Contents Next > Business Growth (as of mid 2002) Data from two business directories was used to analyze the change in the number of businesses
Page 1 of 6 Planning FHWA > HEP > Planning > Econ Dev < Previous Contents Next > Business Growth (as of mid 2002) Data from two business directories was used to analyze the change in the number of businesses
CHAPTER ONE LITERATURE REVIEW
 CHAPTER ONE LITERATURE REVIEW LITERATURE REVIEW This chapter summarizes the most recently published community impact studies and articles that relate to multiuse trails. The review focuses on publications
NAPA VALLEY VISITOR INDUSTRY 2014 Economic Impact Report
 NAPA VALLEY VISITOR INDUSTRY 2014 Economic Impact Report Research prepared for Visit Napa Valley by Destination Analysts, Inc. Table of Contents SECTION 1 Introduction 2 SECTION 2 Executive Summary 5 SECTION
2.0 Physical Characteristics
 _ 2.0 Physical Characteristics 2.1 Existing Land Use for the Project The site is comprised of approximately 114 acres bounded by Highway 101 to the north, the existing town of Los Alamos to the east, State
THE GALLOWAY OWENS DRIVE & WILLOW ROAD, PLEASANTON, CA
 AT THE CENTER OF IT ALL THE GALLOWAY A luxury mixed-use development featuring prime corner retail spaces located directly across from the Dublin/Pleasanton BART station OWNER: BRE PROPERTIES NORTHERN CALIFORNIA
FINAL TESTIMONY 1 COMMITTEE ON RESOURCES UNITED STATES HOUSE OF REPRESENTATIVES. July 13, 2005 CONCERNING. Motorized Recreational Use of Federal Lands
 FINAL TESTIMONY 1 STATEMENT OF DALE BOSWORTH CHIEF Of the FOREST SERVICE UNITED STATES DEPARTMENT OF AGRICULTURE Before the SUBCOMMITTEE ON FORESTS AND FOREST HEALTH And the SUBCOMMITTEE ON NATIONAL PARKS,
Limestone Road Industrial Area Brandon Manitoba ~141 Acres Rail Accessible, Ready for Development
 Limestone Road Industrial Area Brandon Manitoba ~141 Acres Rail Accessible, Ready for Development Dan Fontaine Business Development Specialist 204.729.2133 or 1.866.729.2132 D.Fontaine@brandon.ca EconomicDevelopmentBrandon.com
REGIONAL BOARD REPORT
 REGIONAL BOARD REPORT Administrator s Office For the Board August 21, 2008 DATE: August 14, 2008 FILE NOS.: A-07-06377/8/9.000 FROM: RE: Chief Administrative Officer OCP and Zoning Amendment Application
EXECUTIVE SUMMARY. hospitality compensation as a share of total compensation at. Page 1
 EXECUTIVE SUMMARY Applied Analysis was retained by the Las Vegas Convention and Visitors Authority (the LVCVA ) to review and analyze the economic impacts associated with its various operations and southern
The Economic Base of Colfax County, NM. PREPARED BY: The Office of Policy Analysis at Arrowhead Center, New Mexico State University.
 The Economic Base of Colfax County, NM PREPARED BY: The Office of Policy Analysis at Arrowhead Center, New Mexico State University DATE: July 2016 The Economic Base of Colfax County, New Mexico Introduction
NAPA VALLEY VISITOR INDUSTRY 2012 Economic Impact Report
 Join Visit Napa Valley NAPA VALLEY VISITOR INDUSTRY 2012 Economic Impact Report Research prepared for Visit Napa Valley by Destination Analysts, Inc. Table of Contents SECTION 1 Introduction 2 SECTION
CHAPTER FIVE PROSPECTS FOR FUTURE ECONOMIC DEVELOPMENT
 CHAPTER FIVE PROSPECTS FOR FUTURE ECONOMIC DEVELOPMENT 5.1 GENERAL The recommended type and location of future land uses in Alpine should, in part, consider potential opportunities for future economic
520± Acre. Las Aldeas Farm. Imperial Valley, CA. agribusiness solutions team. Curtis Buono CA Lic.
 520± Acre Las Aldeas Farm Imperial Valley, CA agribusiness solutions team Curtis Buono 858.558.5629 curtis.buono@cushwake.com CA Lic. #1894905 Matt Davis 858.334.4026 matt.davis@cushwake.com CA Lic. #1758818
SUMMER VILLAGE OF SILVER SANDS. Municipal Development Plan
 SUMMER VILLAGE OF SILVER SANDS Municipal Development Plan Bylaw 253-2014 Adopted August 22, 2014 Summer Village of Silver Sands Municipal Development Plan Bylaw No. 253-2014 Page 2 1 INTRODUCTION 1.1 SETTING
HEADQUARTERS WEST LTD. PHOENIX - TUCSON - SONOITA - COTTONWOOD - ST. JOHNS
 Offered for sale exclusively by: Walter Lane Headquarters West, Ltd. PO BOX 37018 Tucson, AZ 85740 Phone (520) 792-2652 info@headquarterswest.com www.headquarterswest.com General Area Description The Crown
Phoenix Habitat Restoration Projects
 Phoenix Habitat Restoration Projects Spur Cross Ranch Cave Creek (Estergard) Regional Tree and Shade Summit March 9, 2010 Desert Riparian Ecosystems Healthy riparian areas like this once existed along
Vista Field Airport. Master Plan Update. February, Prepared for: Port of Kennewick One Clover Island Kennewick, Washington
 Vista Field Airport February, 2006 Prepared for: Port of Kennewick One Clover Island Kennewick, Washington 99336 Prepared by: J-U-B ENGINEERS, Inc. 2810 W. Clearwater Avenue, Suite 201 Kennewick, Washington
CHAPTER 2 COUNTY PROFILE
 COUNTY PROFILE CHAPTER 2: COUNTY PROFILE This chapter provides a profile of Amador County, California, in the planning context of parks and recreation services. This profile includes a description of the
COASTAL CONSERVANCY. Staff Recommendation December 2, 2004 COYOTE HELLYER COUNTY PARK BAY AREA RIDGE TRAIL
 COASTAL CONSERVANCY Staff Recommendation December 2, 2004 COYOTE HELLYER COUNTY PARK BAY AREA RIDGE TRAIL File No. 04-057 Project Manager: Amy Hutzel RECOMMENDED ACTION: Authorization to disburse up to
AGENDA ITEM 5 D WAKULLA ENVIRONMENTAL INSTITUTE (WEI) TRAIL FEASIBILITY STUDY
 TRAIL FEASIBILITY STUDY") March 19, 2018 AGENDA ITEM 5 D WAKULLA ENVIRONMENTAL INSTITUTE (WEI) TRAIL FEASIBILITY STUDY TYPE OF ITEM: Action STATEMENT OF ISSUE The Wakulla Environmental Institute (WEI) Trail is one of several trails
March 19, 2018 AGENDA ITEM 5 D WAKULLA ENVIRONMENTAL INSTITUTE (WEI) TRAIL FEASIBILITY STUDY TYPE OF ITEM: Action STATEMENT OF ISSUE The Wakulla Environmental Institute (WEI) Trail is one of several trails
ECONOMIC PROFILE PARK CITY & SUMMIT COUNTY, UTAH
 ECONOMIC PROFILE PARK CITY & SUMMIT COUNTY, UTAH Prepared by the Park City Chamber of Commerce & Visitors Bureau PO Box 1630, Park City, UT 84060 1.800.453.1360 Economic Profile Packet Sections 1. Introduction
The Santa Cruz Valley National Heritage Area. National Heritage Area. A heritage-based economic development strategy
 The Santa Cruz Valley National Heritage Area National Heritage Area A heritage-based economic development strategy Santa Cruz Valley Heritage Alliance Our Mission: Connect people to the cultural, historic,
5.4 SECONDARY (INDUCED) IMPACTS
 IMPACTS") 5.4 SECONDARY (INDUCED) IMPACTS Major development proposals often involve the potential for induced or secondary impacts on surrounding communities. Examples of these impacts include: shifts in patterns
5.4 SECONDARY (INDUCED) IMPACTS Major development proposals often involve the potential for induced or secondary impacts on surrounding communities. Examples of these impacts include: shifts in patterns
Classifications, Inventory and Level of Service
 Classifications, Inventory and Level of Service Section 3 Kenmore Park, Recreation and Open Space Plan 1 P a g e Classifications and Inventory Park Classifications Kenmore classifies its parks based upon
Header i
 Header i 048285014.10 Header Sub Title Body Text here. Body text here. Body text here. Section 1... 1 Executive Summary... 1 Opportunities and Constraints... 3 Overall Opportunities and Constraints Map
Preliminary Site Evaluation
 Preliminary Site Evaluation 100 Acre Site, US 72 Piperton, Tennessee Power Distributor: Chickasaw Electric Cooperative August 2010 SITE DATA SHEET PIPERTON US 72 SITE (100 ACRES): LOCATION & GENERAL DESCRIPTION
Section 61 Recreational Vehicle Park / Campground (Bylaw No. 2012/10)
") Part 7 General Regulations Section 61 Recreational Vehicle Park / Campground (Bylaw No. 2012/10) 61.1 A comprehensive site plan shall be provided to the satisfaction of the Development Authority that shows
Part 7 General Regulations Section 61 Recreational Vehicle Park / Campground (Bylaw No. 2012/10) 61.1 A comprehensive site plan shall be provided to the satisfaction of the Development Authority that shows
Blueways: Rivers, lakes, or streams with public access for recreation that includes fishing, nature observation, and opportunities for boating.
 Parks, Open Space and Trails PRINCE WILLIAM COUNTY 2008 COMPREHENSIVE PLAN TRAILS PLAN CONTENTS The components of the trails plan are: Intent Definitions Goals, Policies, and Action Strategies Trails Map
COUNTY SANITATION DISTRICT NO. 8 SERVICE CHARGE REPORT FOR FISCAL YEAR
 COUNTY SANITATION DISTRICT NO. 8 SERVICE CHARGE REPORT FOR FISCAL YEAR 2017-18 INTRODUCTION County Sanitation District No. 8 of Los Angeles County encompasses all or portions of the cities of Carson, Compton,
1803 West Hwy 160 Monte Vista, CO (719) TTY (719)
 TTY (719)") USDA Forest Service Rio Grande National Forest http://www.fs.fed.us/r2/riogrande 1803 West Hwy 160 Monte Vista, CO 81144 (719)852-5941 TTY (719)852-6271 USDI Bureau of Land Management San Luis Valley Center
USDA Forest Service Rio Grande National Forest http://www.fs.fed.us/r2/riogrande 1803 West Hwy 160 Monte Vista, CO 81144 (719)852-5941 TTY (719)852-6271 USDI Bureau of Land Management San Luis Valley Center
STAFF REPORT. Airport Land Use Consistency Determination Betteravia Plaza. MEETING DATE: January 21, 2016 AGENDA ITEM: 8D
 STAFF REPORT SUBJECT: Airport Land Use Consistency Determination Betteravia Plaza MEETING DATE: AGENDA ITEM: 8D STAFF CONTACT: Andrew Orfila RECOMMENDATION: Adopt findings for the Betteravia Plaza project
THE OLSEN RANCH. Paso Robles, California 600+ UNIT PLANNED COMMUNITY DEVELOPMENT OPPORTUNITY. << Click to View Aerial Tour >>
 THE OLSEN RANCH Paso Robles, California 600+ UNIT PLANNED COMMUNITY DEVELOPMENT OPPORTUNITY > OLSEN RANCH TABLE OF CONTENTS OFFERING OVERVIEW... 3 PROPERTY PHOTOS...10 MAPS
Yuma Vertical File Section III Quick List
 AGRICULTURE (AGR) Crops Environmental Irrigation Pesticides Publications Reports Weeds AVIATION (AVI) Endurance Flight Memorials Women s Air Derby BOTANY (BOT) Botanical Gardens Gardening BUILDINGS (BUI)
Boise Municipal Code. Chapter DEFINITIONS
 Chapter 12-03 DEFINITIONS Sections: 12-03-01 ADMINISTRATOR 12-03-02 AIRPORT DESIGNATIONS 12-03-03 AIRPORT HAZARD 12-03-04 AIRPORT HEIGHT LIMITATIONS 12-03-05 AIRPORT REFERENCE POINT 12-03-06 AIRPORT INSTRUMENT
COUNTY SANITATION DISTRICT NO. 19 SERVICE CHARGE REPORT FOR FISCAL YEAR
 COUNTY SANITATION DISTRICT NO. 19 SERVICE CHARGE REPORT FOR FISCAL YEAR 2017-18 INTRODUCTION County Sanitation District No. 19 of Los Angeles County encompasses all or portions of the cities of Artesia,
$866,000. $1,400,000 Health Benefits $13,156,000 TOTAL ANNUAL DIRECT BENEFITS. $10,890,000 Economic Benefits
 SINGING RIVER TRAIL Trails Create Value + Generate Economic Activity Trails generate economic returns through improved health, safety, and environmental conditions, raise property values, and attract visitors.
CHAPTER 6 NOISE EXPOSURE
 CHAPTER 6 NOISE EXPOSURE FAA requires that the NEM submitted for review represent the aircraft noise exposure for the year of submittal (in this case 2008) and for a future year (2013 for OSUA). However,
RAY YENKANA Willowbrook Cr, Dawson Creek BC Canada $2,847,000
 1716 Willowbrook Cr, Dawson Creek BC Canada For SALE $2,847,000 This is a rare find, 32 townhomes in Dawson Creek, BC. Excellent investment in a single title multi family complex. Vendor has upgraded this
D1 January 8, 2014 Public Hearing APPLICANT: HUNT CLUB FARM
 D1 January 8, 2014 Public Hearing APPLICANT: HUNT CLUB FARM PROPERTY OWNER: HUNT CLUB A-1- A, LLC. STAFF PLANNER: Kevin Kemp REQUEST: Modification of a Conditional Use Permit approved by the City Council
COUNTY SANITATION DISTRICT NO. 8 SERVICE CHARGE REPORT FOR FISCAL YEAR
 COUNTY SANITATION DISTRICT NO. 8 SERVICE CHARGE REPORT FOR FISCAL YEAR 2015-16 INTRODUCTION County Sanitation District No. 8 of Los Angeles County encompasses all or portions of the cities of Carson, Compton,
December 11, Planning and Land Development Regulation Commission (PLDRC) 3969 State Road 44, New Smyrna Beach. Glenn Storch, Esquire
 3969 State Road 44, New Smyrna Beach. Glenn Storch, Esquire") 1 of 21 GROWTH AND RESOURCE MANAGEMENT DEPARTMENT PLANNING AND DEVELOPMENT SERVICES DIVISION CURRENT PLANNING ACTIVITY 123 W. Indiana Avenue, DeLand, FL 32720 (386) 943-7059 PUBLIC HEARING: CASE NO: SUBJECT:
1 of 21 GROWTH AND RESOURCE MANAGEMENT DEPARTMENT PLANNING AND DEVELOPMENT SERVICES DIVISION CURRENT PLANNING ACTIVITY 123 W. Indiana Avenue, DeLand, FL 32720 (386) 943-7059 PUBLIC HEARING: CASE NO: SUBJECT:
State of the Shared Vacation Ownership Industry. ARDA International Foundation (AIF)
") State of the Shared Vacation Ownership Industry ARDA International Foundation (AIF) This paper includes a high-level overview of the timeshare industry with a core focus on financial growth, owner demographics
State of the Shared Vacation Ownership Industry ARDA International Foundation (AIF) This paper includes a high-level overview of the timeshare industry with a core focus on financial growth, owner demographics
LAND SUBSIDENCE SOLUTIONS
 Western Madera County and Merced County LAND SUBSIDENCE SOLUTIONS Chris White Central California Irrigation District Chase Hurley San Luis Canal Company In Association with Washington Avenue Growers, Red
Parkland County Municipal Development Plan Amendment Acheson Industrial Area Structure Plan
 Parkland County Municipal Development Plan Amendment Acheson Industrial Area Structure Plan New Plan Acheson Industrial Area Structure Plan Amendment Parkland County Municipal Development Plan Board Reference
Business Plan INTRODUCTION AIRPORT ENTERPRISE FUND OVERVIEW. Master Plan Guiding Principles
 5 Business Plan INTRODUCTION Just as previous chapters have outlined plans for the airport s physical development, this chapter outlines a plan for the airport s financial development. More specifically,
CITY OF PALMDALE. REPORT to the Mayor and Members of the City Council from the City Manager
 CITY OF PALMDALE REPORT to the Mayor and Members of the City Council from the City Manager DATE: June 4, 2014 SUBJECT: Specific Plan Amendment 14-01; Amending the Use Designation of 23.97 Acres within
Director, Community Planning, Toronto and East York District
 STAFF REPORT October 25, 2005 To: From: : Subject: Toronto and East York Community Council Director, Community Planning, Toronto and East York District Status Report OPA & Rezoning Application 05 117524
TIFFANY SQUARE PARCELS LOCATED ALONG I-29, THE KANSAS CITY INTERNATIONAL AIRPORT CORRIDOR
 NW Skyview Ave NW S ky v iew Ave dor D r ssa ba Am N Congress N Future Sam s Club 152 Tiffany Springs MarketCenter N Ambassador Dr N Congress Ave Tiffany Springs Rd Benton House FOR SALE > 298.12± ACRES
STAFF REPORT. Airport Land Use Plan Consistency Review: Santa Barbara Airport Master Plan. MEETING DATE: November 19, 2015 AGENDA ITEM: 7D
 STAFF REPORT SUBJECT: Airport Land Use Plan Consistency Review: Santa Barbara Airport Master Plan MEETING DATE: AGENDA ITEM: 7D STAFF CONTACT: Peter Imhof, Andrew Orfila RECOMMENDATION: Adopt findings
b. Minimum Site Area. Recreational vehicle parks shall be located on a parcel of land not less than 3 acres in area.
 6450 RECREATIONAL VEHICLE PARK REGULATIONS 6450 TITLE AND PURPOSE. The provisions of Section 6450 through 6499, inclusive, shall be known as the Recreational Vehicle Park Regulations. The purpose of these
COUNTY SANITATION DISTRICT NO. 21 SERVICE CHARGE REPORT FOR FISCAL YEAR
 COUNTY SANITATION DISTRICT NO. 21 SERVICE CHARGE REPORT FOR FISCAL YEAR 2017-18 INTRODUCTION County Sanitation District No. 21 of Los Angeles County encompasses all or portions of the cities of Claremont,