Puerto Ricans in Rhode Island, the United States, and Puerto Rico, 2013
|
|
|
- Lenard Gibson
- 6 years ago
- Views:
Transcription

 and of those in Puerto Rico (18%). The labor force participation rate of Puerto Ricans in Rhode Island was 53.")
1 Issued September 2016 Centro DS2015US-07 Puerto Ricans in Rhode Island, the United States, and Puerto Rico, 2013 In 2013 an estimated 36,217 Puerto Ricans lived in Rhode Island and accounted for at least 1 percent of all Puerto Ricans living in the United States. The number of Puerto Ricans in Rhode Island grew from 25,422 in the year 2000 to 36,217 in 2013, a 42 percent rate of growth. Findings from an examination of Census data for 2013, the latest year for which detailed data was available, reveal that: The unemployment rate among Puerto Ricans in Rhode Island s labor force was 24.2 percent, higher than among all stateside Puerto Ricans (14.6%) and of those in Puerto Rico (18%). The labor force participation rate of Puerto Ricans in Rhode Island was 53.9 percent, eight percentage points lower than among stateside Puerto Ricans (61.2%) and ten percentage points higher than those in Puerto Rico (44.7%). The median household income for Puerto Ricans in Rhode Island was $18,682, about half the stateside Puerto Rican median household income ($37,951) and one thousand dollars lower than Puerto Rican median household income in Puerto Rico ($19,942). From an economic perspective, Puerto Ricans in Rhode Island accounted for $371 million in purchasing power, representing less than one percent of the $89.7 billion in purchasing power generated by stateside Puerto Ricans in Nearly, two in five (39.2%) Puerto Ricans in Rhode Island age 25 years and older had less than a high school degree, a rate much higher than that among all Puerto Ricans in the U.S. (23.7%), and higher than that of Puerto Ricans in Puerto Rico (27.6%). At least 16 percent of Puerto Ricans in Rhode Island worked in the higher wage management, business, sciences, and arts occupational sector. This rate was lower than among all Puerto Ricans in the U.S. (27.2%) and in Puerto Rico (31.9%). The median age of Puerto Ricans in Rhode Island was 22.6 years, lower than for all Puerto Ricans in the U.S. (28.7 years) and those in Puerto Rico (37.5 years). Nearly three-fourths (73.1%) of Puerto Ricans in Rhode Island reported speaking a language other than English in their home, higher than the nationally reported rate for Puerto Ricans (62.5%). Only 26.9 percent reported speaking English only in their homes, a rate below that of stateside Puerto Ricans (37.5%). Puerto Rican families in Rhode Island had higher average poverty rates, with more than half (51.3%) reporting living at or below the poverty rate, compared to 23.5 percent among all Puerto Rican families in the U.S. and 41.7 percent among those in Puerto Rico. The rate of Puerto Rican households in Rhode Island receiving public assistance income (13%) was nearly double than that of all Puerto Rican households in the United States (7.2%) and more than double those in Puerto Rico (6.3%). The rate of Puerto Rican households receiving food stamp/snap benefits was 61 percent, higher than 31.6 percent among all Puerto Rican households in the U.S. and 38.6 percent among those in Puerto Rico.

2 Overall, Rhode Island s Puerto Rican population grew from 25,422 in 2000 to 36,217 in The Puerto Rican population was the second largest Hispanic group in Rhode Island, representing 26 percent of the total Hispanic population. In 2013, Hispanic population made up 13.2 percent of Rhode Island s total population compared to 8.7 percent in Puerto Ricans in Rhode Island were relatively younger than Puerto Ricans in the U.S. as a whole, with a median age of 22.6 years, lower than the national median for Puerto Ricans of 28.7 years of age, and more than ten years lower than the median age among Puerto Ricans in Puerto Rico (37.5 years). The proportion of Puerto Ricans aged 62 years and older in Rhode Island was 4.5 percent, also lower than for Puerto Ricans across the United States (9.3%) and less than a third of those in Puerto Rico (19.5%). English proficiency indicators for Puerto Ricans in Rhode Island were lower than for stateside Puerto Ricans overall. More than one in five (22.4%) Puerto Ricans in Rhode Island reported speaking English less than very well compared to 17.6 percent of stateside Puerto Ricans. Nearly three-fourths of Puerto Ricans in Rhode Island (73.1%) reported speaking Graph 1.A: Latino Population 2013, Rhode Island Other 3.1% Mexican South American 11.0% 7.1% Puerto Rican Central American 22.8% 26.0% 28.7% Cuban 1.1% Dominican Republic Table 1. Puerto Rican and Latino Population in Rhode Island Total 1,048, % 1,053, % 1,050, % Not Hispanic or Latino 957, % 925, % 911, % Hispanic or Latino 90, % 127, % 139, % Mexican 5, % 10, % 9, % Puerto Rican 25, % 32, % 36, % Cuban 1, % 2, % 1, % Dominican Republic 17, % 38, % 39, % Central American 11, % 25, % 31, % Guatemalan 8, % 19, % 25, % South American 8, % 13, % 15, % Colombian 5, % 8, % 8, % Other 20, % 5, % 4, % Sources: U.S. Census Bureau, Census 2000 Summary File 1, 2010 Census. Summary File 1, and 2013 American Community Survey 1-Year Estimates. 2
.")
3 a language other than English in the home, a rate more than ten percentage points higher than among all Puerto Ricans in the U.S. (62.5%). Only 26.9 percent of Puerto Ricans in Rhode Island reported speaking only English compared to all Puerto Ricans in the U.S. (37.5%). Puerto Ricans in Rhode Island had less schooling than Puerto Ricans throughout the U.S. or in Puerto Rico. Rhode Island Puerto Ricans (39.2%) had a higher proportion without a high school degree than stateside Puerto Ricans (23.7%) and Puerto Ricans in Puerto Rico (27.6%). In terms of higher education, Puerto Ricans in Rhode Island had lower rates of those who earned a bachelor s degree or higher (10.2%) compared to 16.9 percent of all stateside Puerto Ricans and 23.6 percent of those in Puerto Rico. A breakdown of the education demographics by sex indicates both Puerto Rican Graph 2.A: Puerto Rican Education Attainment, 25 years and over Bachelor s degree or higher Some college or associate s degree High school graduate (includes equivalency) Less than high school diploma 10.2% 22.4% 28.2% 39.2% 16.9% 29.6% 29.8% 23.7% 23.6% 21.7% 27.1% 27.6% RHODE ISLAND UNITED STATES PUERTO RICO Table 2. Age, Education, and Language Puerto Ricans 2013 Rhode Island United States Puerto Rico* TOTAL POPULATION 36,217 5,004,309 3,497,393 Median age (years) years and over 4.5% 9.3% 19.5% EDUCATIONAL ATTAINMENT Population 25 years and over Less than high school diploma 39.2% 23.7% 27.6% High school graduate (includes equivalency) 28.2% 29.8% 27.1% Some college or associate s degree 22.4% 29.6% 21.7% Bachelor s degree or higher 10.2% 16.9% 23.6% Male, bachelor s degree or higher 10.5% 15.0% 19.0% Female, bachelor s degree or higher 10.0% 18.7% 27.5% LANGUAGE SPOKEN AT HOME AND ABILITY TO SPEAK ENGLISH Population 5 years and over English only 26.9% 37.5% 5.2% Language other than English 73.1% 62.5% 94.8% Speak English less than very well 22.4% 17.6% 79.6% Source: U.S. Census Bureau, 2013 American Community Survey 1-Year Estimates. * Puerto Ricans only. 3
4 males (10.5%) and females (10%) had a lower proportion who had earned a bachelor s degree or higher, than stateside Puerto Ricans (15% for males and 18.7% for females, respectively) and Puerto Ricans in Puerto Rico (19% for males and 27.5% for females, respectively). Puerto Rican participation in Rhode Island s civilian labor force (53.9%) was lower than among Puerto Ricans in the entire U.S. (61.2%) but higher than in Puerto Rico (44.7%). The unemployment rate among Puerto Ricans in Rhode Island was 24.2 percent, nearly ten percentage points higher than the stateside Puerto Rican unemployment rate (14.6%) and in Puerto Rico (18%). Only 15.9 percent of Puerto Ricans in Rhode Island worked in the higher wage management, business, science, and arts occupations compared to 27.2 percent of Puerto Ricans in the U.S. and 31.9 percent in Puerto Rico. Puerto Rican women (18.7%) in Rhode Island were more present than men (12.7%) in the higher wage management, business, science, and arts sector. Nationally, Puerto Rican men and women in the U.S. showed even higher rates (31.9% for women and 22.7% for men, respectively) than Rhode Island s Puerto Rican men and women in these occupations. The average earnings of full-time, year-round Puerto Rican men and women in Rhode Island was $43,350 and $37,076, respectively, compared to the national level of $50,813 and $42,823 for Puerto Rican men and women, respectively. Puerto Rican men in Rhode Island earned at least six thousand dollars more than women. However, Puerto Rican men in Rhode Island earned almost seven thousand dollars less than at the nation- Table 3. Employment and Occupations Puerto Ricans Rhode Island United States Puerto Rico* EMPLOYMENT STATUS Population 16 years and over In labor force 54.2% 62.1% 44.8% Civilian labor force 53.9% 61.2% 44.7% Employed 40.8% 52.3% 36.7% Unemployed 24.2% 14.6% 18.0% Not in labor force 45.8% 37.9% 55.2% Armed Forces 0.40% 0.80% 0.0% OCCUPATION Civilian employed population 16 years and over 9,507 1,870,468 1,019,014 Male 4, , ,746 Management, business, science, and arts 12.7% 22.7% 24.6% Service occupations 26.6% 22.6% 22.0% Sales and office occupations 23.4% 20.6% 20.3% Construction and maintenance 10.1% 13.7% 17.6% Production, transportation, and moving 27.3% 20.5% 15.5% Female 5, , ,268 Management, business, science, and arts 18.7% 31.9% 40.0% Service occupations 33.7% 23.8% 17.5% Sales and office occupations 37.5% 37.2% 36.4% Construction and maintenance 0.5% 0.6% 0.7% Production, transportation, and moving 9.5% 6.4% 5.4% CLASS OF WORKER Civilian employed population 16 years and over Private wage and salary workers 90.5% 80.9% 67.2% Government workers 7.5% 15.7% 24.3% Self-employed workers in own not incorporated business 2.0% 3.2% 8.4% VETERAN STATUS Civilian population 18 years and over Civilian veteran 2.2% 6.6% 3.7% Source: U.S. Census Bureau, 2013 American Community Survey 3-Year Estimates. * Puerto Ricans only.
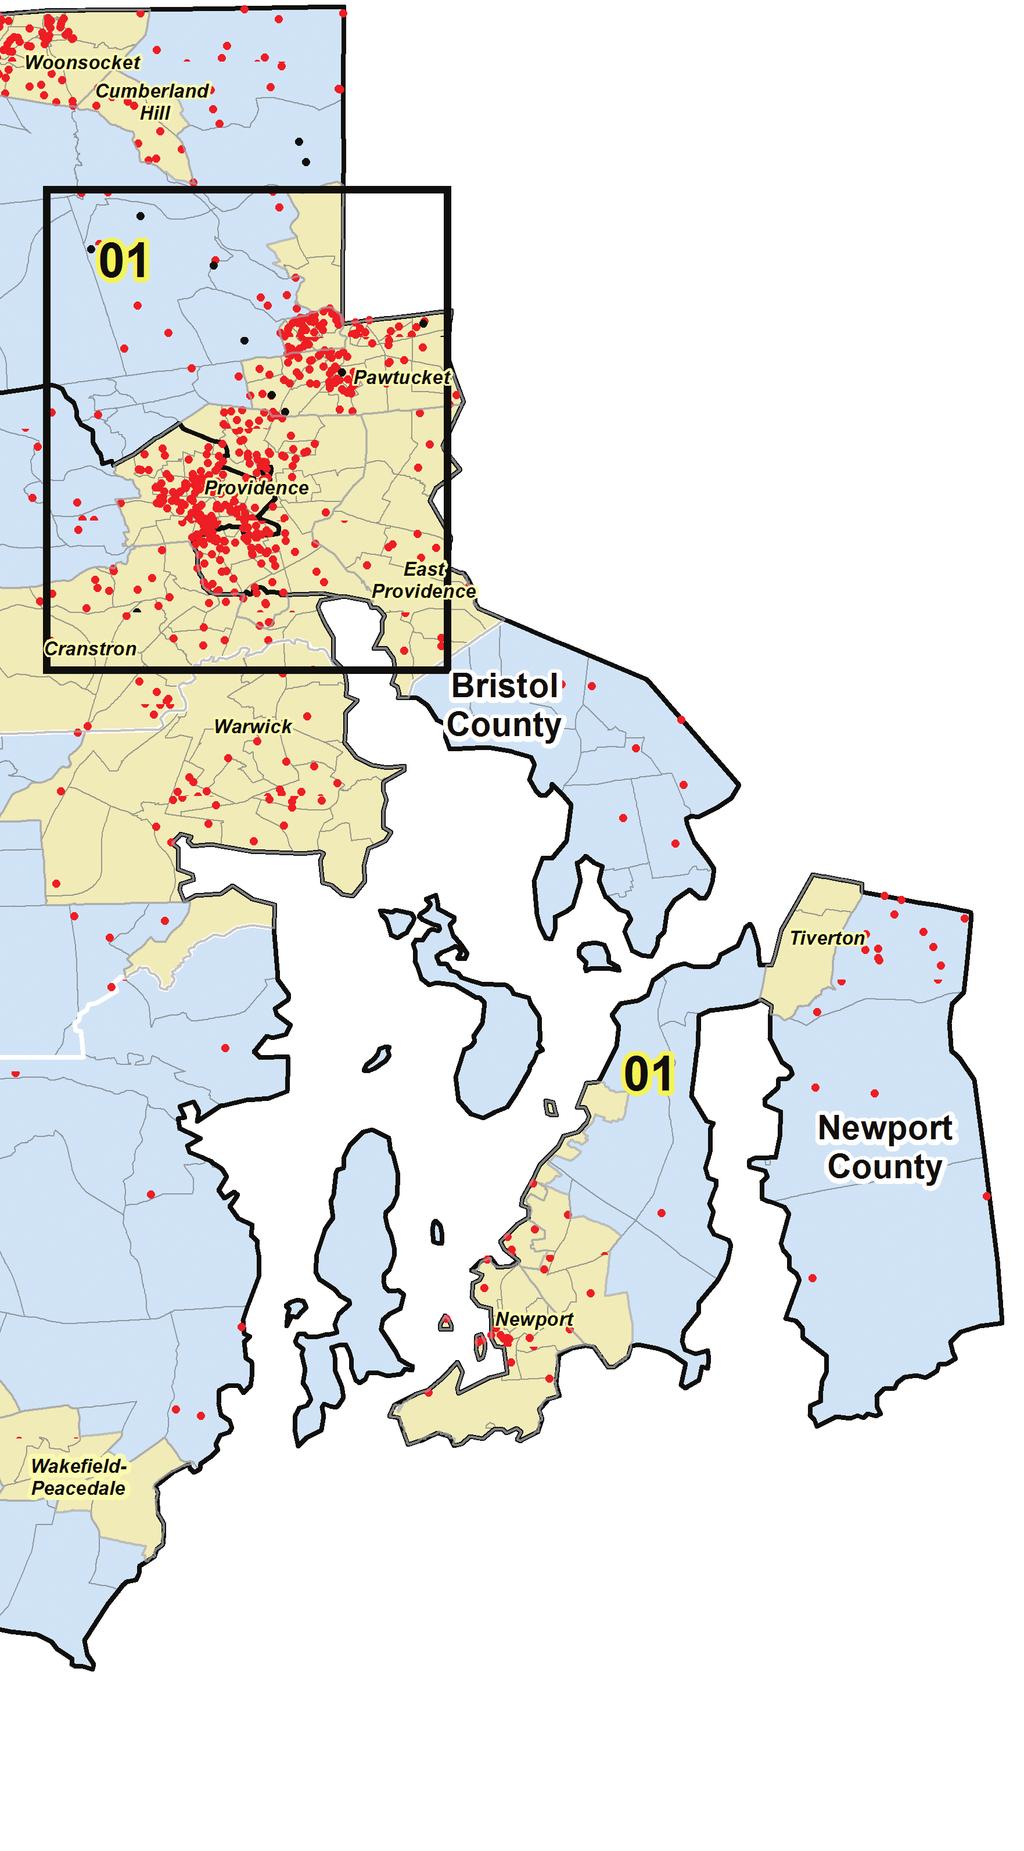
5 Puerto Rican Population by Counties in Rhode Island In comparison to other states in the United States, Rhode Island is the smallest in terms of size. It is also a state with a small number of counties. The state is subdivided into four counties: Bristol, Kent, Newport, Providence, and Washington. Puerto Ricans were not evenly distributed throughout the state. Rather, most of the Puerto Rican population was largely concentrated in Rhode Island s northeast region, particularly in Providence County. At least, 88 percent of the Puerto Rican population resided in Providence County. Kent and Newport Counties each accounted for about 4 percent of Rhode Island s Puerto Rican population, and neighboring Washington (3%) and Bristol (1%) counties accounted for another 4 percent. Latino settlement in Rhode Island closely mirrored that of Puerto Ricans. Latinos were heavily concentrated in the northeast region of the state with lighter settlement in Washington and Bristol counties. COUNTY Puerto Rican Population Percent Latino Population Percent Total Population Percent Providence County 32,310 88% 125,144 89% 629,280 60% Kent County 1,561 4% 6,174 4% 165,253 16% Newport County 1,520 4% 3,984 3% 82,772 8% Washington County 969 3% 3,449 2% 126,609 12% Bristol County 337 1% 1,081 1% 49,338 5% Total 36, % 139,832 99% 1,053, % Sources: U.S. Census Bureau and 2014 American Community Survey 5-Year Estimates Notes: Total counts for populations may differ depending on whether the estimates are derived from the 1-year estimates or the 5-year estimates of the American Community Survey. Total percentages do not add up to 100 due to rounding. 5


6 PUERTO RICAN POPULATION BY COUNTIES IN RHODE ISLAND PUERTO RICAN POPULATION 1 dot = PUERTO RICAN ARRIVALS 1 dot = 50 BOUNDARIES County City/Towns Census Tracts CONGRESSIONAL DISTRICT Republican Democrat 6

7 7

8 PUERTO RICAN POPULATION BY COUNTIES IN RHODE ISLAND PUERTO RICAN POPULATION 1 dot = PUERTO RICAN ARRIVALS 1 dot = 50 BOUNDARIES County City/Towns Census Tracts CONGRESSIONAL DISTRICT Republican Democrat 8
9 al level. Puerto Rican women in Rhode Island earned about five thousand dollars less than at the national level. Compared to Puerto Rico, where average fulltime, year-round Puerto Rican earnings were $32,625 and $29,030 for men and women, respectively, Puerto Ricans in Rhode Island and the U.S. as a whole earned more on average. Household and family incomes are important indicators of economic well-being. These indicators were much lower for Puerto Ricans in Rhode Island than for stateside Puerto Ricans and those in Puerto Rico. The median income was $18,682 for Puerto Rican households in Rhode Island, half that of all stateside Puerto Rican households ($37,951) and actually lower than the median income of Puerto Rican households in Puerto Rico ($19,242). Per capita income among Puerto Ricans in Rhode Island was lower ($10,267) than among all stateside Puerto Ricans ($17,932) and those in Puerto Rico ($10,864). Puerto Ricans in Rhode Island had $371 million purchasing power. From an economic perspective, Rhode Island Puerto Ricans represented less than 1 percent of the $89.7 billion total purchasing power of the entire Puerto Rican community in the year Purchasing power is defined simply as per capita income multiplied by the Puerto Rican population. Stateside Puerto Ricans had more than double the total purchasing power of Puerto Ricans in Puerto Rico of $37.9 billion. More than half of Puerto Rican families in Rhode Island (51.3%) lived in poverty. This is nearly 30 percentage points higher than among all Puerto Ricans families in Table 4. Income and Earnings 2013 Puerto Ricans Rhode Island United States Puerto Rico* INCOME IN THE PAST 12 MONTHS (IN 2013 INFLATION-ADJUSTED DOLLARS) Households 11,007 1,545,037 1,190,241 Median household income (dollars) $18,682 $37,951 $19,242 With earnings 57.9% 76.0% 57.1% Mean earnings (dollars) $37,790 $59,153 $35,643 With Social Security income 18.7% 23.2% 42.4% Mean Social Security income (dollars) $9,382 $13,319 $11,808 With Supplemental Security Income 33.4% 13.1% 0.5% Mean Supplemental Security Income (dollars) $9,422 $8,718 $8,704 With cash public assistance income 13.0% 7.2% 6.3% Mean cash public assistance income (dollars) $3,905 $3,776 $2,193 With retirement income 5.5% 10.2% 15.0% Mean retirement income (dollars) $9,854 $19,833 $15,276 With Food Stamp/SNAP benefits 61.0% 31.6% 38.6% Families 7,371 1,056, ,606 Median family income (dollars) $20,781 $43,182 $22,668 Married-couple family 31.3% 52.7% 57.2% Median income (dollars) $45,966 $65,731 $30,058 Male householder, no spouse present 10.0% 9.5% 8.8% Median income (dollars) $16,062 $35,317 $16,895 Female householder, no husband present 58.6% 37.8% 33.9% Median income (dollars) $14,039 $23,728 $14,022 Individuals 36,217 5,004,309 3,497,393 Per capita income (dollars) $10,267 $17,932 $10,864 Mean earnings (dollars) for full-time, year-round workers: Male $43,350 $50,813 $32,625 Female $37,076 $42,823 $29,030 Source: U.S. Census Bureau, 2013 American Community Survey 3-Year Estimates. * Puerto Ricans only. 9

10 the U.S. (23.5%) and 10 percentage points higher than those in Puerto Rico (41.7%). As seen in other states and in Puerto Rico, Puerto Rican households with a female householder, no husband, and children under 18 years of age had the highest rates of poverty. In Rhode Island, 70.8 percent of these households reported living in poverty, compared to 49.8 percent across the U.S. and 69.2 percent in Puerto Rico. Regardless of context, these poverty rates are alarmingly high. Public assistance participation rates for Puerto Rican families in Rhode Island (13%) was almost two times higher than the national level (7.2%) and in Puerto Rico (6.3%). Three in five (61%) Puerto Rican families reported receiving food stamp/ SNAP (Supplementary Nutrition Assistance Program), almost twice as many as Puerto Rican families in the nation (31.6%) and in Puerto Rico (38.6%). The rate of homeownership among Puerto Ricans in Rhode Island was substantially lower (13.4%) than for Puerto Ricans in the U.S. (37%) or Puerto Rico (70%). Housing is a primary determinant of the cost of living. The median value of owner-occupied housing for Puerto Ricans in Rhode Island was $169,000, lower than the median value of owner-occupied housing for all stateside Puerto Ricans ($173,900), but higher than in Puerto Rico ($121,000). Graph 4.A: Mean Earnings for Full-Time Year-Round Puerto Rican Workers $60,000 $50,000 $40,000 Male $43,350 Female $37,076 $50,813 $42,823 $32,625 $29,030 $30,000 $20,000 $10,000 0 RHODE ISLAND UNITED STATES PUERTO RICO Graph 4.B: Puerto Rican Purchasing Power, in Billions, 2013 PUERTO RICO RHODE ISLAND $371.8 million $37.9 $89.7 UNITED STATES 10
11 Graph 5.A: Poverty Rates Rhode Island United States Puerto Rico 59.9% 65.3% 58.4% 70.8% 69.2% 51.3% 51.8% 49.8% 41.7% 42.4% 31.3% 23.5% All families All families with related childrend under 18 years Female householder no husband present Female householder with related children under 18 years Table 5. Poverty 2013 Puerto Ricans Rhode Island United States Puerto Rico* POVERTY RATES All families 51.3% 23.5% 41.7% With related children under 18 years 59.9% 31.3% 51.8% With related children under 5 years only 44.1% 29.7% 52.6% Married-couple family 20.4% 9.7% 30.0% With related children under 18 years 22.0% 12.4% 33.6% With related children under 5 years only N** 10.7% 32.6% Female householder, no husband present, family 65.3% 42.4% 58.4% With related children under 18 years 70.8% 49.8% 69.2% With related children under 5 years only 58.8% 51.2% 72.2% All people 51.4% 27.0% 45.5% Under 18 years 57.9% 34.7% 57.0% Related children under 18 years 57.7% 34.4% 56.9% Related children under 5 years 59.1% 37.1% 61.8% Related children 5 to 17 years 57.0% 33.3% 55.3% 18 years and over 47.0% 23.2% 42.0% 18 to 64 years 47.4% 23.4% 42.4% 65 years and over 41.8% 22.3% 40.2% People in families 49.4% 24.6% 43.7% Unrelated individuals 15 years and over 60.6% 38.8% 56.6% Source: U.S. Census Bureau, 2013 American Community Survey 3-Year Estimates. * Puerto Ricans only. ** An N entry in the estimate and margin of error columns indicates that data for this geographic area cannot be displayed because the number of sample cases is too small. 11
12 Puerto Ricans in the state are generally making less money and least likely to be employed in higher wage occupations than at the national level. The median monthly owner cost associated with a mortgage was $1,689 for Puerto Ricans in Rhode Island, higher than the $1,609 for those in the U.S., and $884 for those in Puerto Rico. As a result, more than half (53.3%) of Puerto Ricans in Rhode Island who owned a home paid more than 30 percent of their income in monthly owner costs. This rate was higher than for Puerto Ricans at the national (43.9%) level and in Puerto Rico (47.5%). Table 6. Housing and Health Insurance 2013 Puerto Ricans HOUSING Rhode Island United States Puerto Rico* Owner-occupied housing units 13.4% 37% 70.0% Monthly owner costs as a percentage of household income in the past 12 months Less than 30 percent 46.7% 56.1% 52.5% 30 percent or more 53.3% 43.9% 47.5% Owner-occupied housing units Median value (dollars) $169,000 $173,900 $121,000 Median selected monthly owner costs with a mortgage (dollars) HEALTH INSURANCE COVERAGE Civilian noninstitutionalized population $1,689 $1,609 $884 With private health insurance 32.6% 49.9% 40.3% With public coverage 62.7% 42.2% 59.3% No health insurance coverage 10.9% 14.1% 6.5% Source: U.S. Census Bureau, 2013 American Community Survey 3-Year Estimates. * Puerto Ricans only. The Center for Puerto Rican Studies (Centro) is the nation s leading university-based institution devoted to the interdisciplinary study of the Puerto Rican experience in the United States. Centro is dedicated to understanding, preserving and sharing the Puerto Rican experience in the United States. Centro invites Centro Voices contributors to make use of the extensive archival, bibliographic and research material preserved in its Library and Archives. The Centro Library and Archives is devoted to collecting, preserving and providing access to resources documenting the history and culture of Puerto Ricans. The Centro Library and Archives was established in 1973 as a component of the Center for Puerto Rican Studies. The collections include books, current and historic newspapers and periodicals, audio, film & video, manuscripts, photographs, art prints, and recorded music. The Library and Archives provides services and programs to the scholarly community as well as the general public. Constituents are diverse and come from the United States and abroad. The Library and Archives facilitates access to information on its holdings through the City University s online public catalog or CUNY+. It also provides research and information assistance via phone and . Centro Library and Archives Silberman Building, 2180 Third Avenue at 119th Street, Room 121, New York, N.Y Library: Archives: centropr.hunter.cuny Follow Hunter College, The City University of New York 695 Park Avenue, E1429, New York, N.Y Voic Fax: Center for Puerto Rican Studies Hunter College, CUNY 695 Park Avenue New York, NY , centropr.hunter.cuny.edu
Puerto Ricans in Massachusetts, the United States, and Puerto Rico, 2014
 Issued April 2016 Centro DS2016US-07 Puerto Ricans in Massachusetts, the United States, and Puerto Rico, 2014 In 2014, Massachusetts was the fifth state with most Puerto Ricans in the United States. In
Puerto Ricans in Georgia, the United States, and Puerto Rico, 2014
 Issued September 2016 Centro DS2014GA-14 Puerto Ricans in Georgia, the United States, and Puerto Rico, 2014 In 2014, an estimated 89,462 Puerto Ricans lived in Georgia and accounted for 1.7 percent of
Puerto Ricans in Connecticut, the United States, and Puerto Rico, 2014
 Issued April 2016 Centro DS2016US-8 Puerto Ricans in Connecticut, the United States, and Puerto Rico, 2014 In 2014, Connecticut was the 6th state with most Puerto Ricans (301,182) in the United States.
Puerto Ricans in Ohio, the United States, and Puerto Rico, 2014
 Issued April 2016 Centro DS2015US-12 Puerto Ricans in Ohio, the United States, and Puerto Rico, 2014 In 2014, Ohio had the tenth largest number of Puerto Ricans in the United States with 108,174 residents,
Puerto Rican Entrepreneurship in the U.S.
 Puerto Rican Entrepreneurship in the U.S. Research Brief issued April 2017 By: Jennifer Hinojosa Centro RB2016-14 Puerto Rican entrepreneurs were the fastest growing business firms in the U.S. According
PROFILE OF THE PUERTO RICAN POPULATION IN UNITED STATES AND PUERTO RICO: 2008
 PROFILE OF THE PUERTO RICAN POPULATION IN UNITED STATES AND PUERTO RICO: 2008 Sonia G. Collazo, Camille L. Ryan, Kurt J. Bauman U.S. Census Bureau Housing and Household Economic Statistics Division This
part one: comparing puerto ricans
 part one: comparing puerto ricans snapshot: puerto ricans across major us metro areas This section uses data from the 2010 American Community Survey one-year estimates to examine the socioeconomic characteristics
Post-Hurricane Maria Exodus from Puerto Rico and School Enrollment in Florida
 Post-Hurricane Maria Exodus from Puerto Rico and School Enrollment in Florida Research Brief Issued December 2017 By: Edwin Meléndez, Jennifer Hinojosa, and Nashia Roman centro RB2017-02 Hurricane Maria
T H E VILLAGE OF P h i l m o n t, N Y
 T H E VILLAGE OF P h i l m o n t, N Y Summit Reservoir Area Plan November 17, 2014 Executive Steering Committee Meeting 2 Agenda 1:00 1. Welcome 2. Housekeeping & updates i. Committee contact list review
SYNOPSIS OF INFORMATION FROM CENSUS BLOCKS AND COMMUNITY QUESTIONNAIRE FOR TONOPAH, NEVADA
 TECHNICAL REPORT UCED 93-04 SYNOPSIS OF INFORMATION FROM CENSUS BLOCKS AND COMMUNITY QUESTIONNAIRE FOR TONOPAH, NEVADA UNIVERSITY OF NEVADA, RENO i Synopsis of Information from Census Blocks and Community
Demographic Profile 2013 census
 Demographic Profile 2013 census This profile provides basic population and demographic information on the residents of the Hauraki District. Population and demographic information is important for targeting
A COMPARISON OF THE MILWAUKEE METROPOLITAN AREA TO ITS PEERS
 KRY/WJS/EDL #222377 (PDF: #223479) 1/30/15 PRELIMINARY DRAFT Memorandum Report A COMPARISON OF THE MILWAUKEE METROPOLITAN AREA TO ITS PEERS EXECUTIVE SUMMARY This memorandum report provides a statistical
Regional Universities Network. Introduction. Regional Universities Network. Economic Impact of the Universities in the Regional Universities Network
 Regional Universities Network Economic Impact of the Universities in the Regional Universities Network Introduction The Regional Universities Network (RUN) is a network of six universities with headquarters
State of the Shared Vacation Ownership Industry. ARDA International Foundation (AIF)
") State of the Shared Vacation Ownership Industry ARDA International Foundation (AIF) This paper includes a high-level overview of the timeshare industry with a core focus on financial growth, owner demographics
State of the Shared Vacation Ownership Industry ARDA International Foundation (AIF) This paper includes a high-level overview of the timeshare industry with a core focus on financial growth, owner demographics
Philmont, New York Contents
 Philmont, New York Contents Philmont, New York... 1 Overview... 2 Surrounding Area... 3 Development of Philmont... 3 Transportation Access... 5 Topography... 5 Water Resources... 5 Demographics... 7 Population...
AVSP 7 Summer Section 7: Visitor Profile - Demographics and Spending
 AVSP 7 Summer 2016 Section 7: Visitor Profile - Demographics and Spending Demographics Origin Visitors were asked what state, country, or province they were visiting from. The chart below shows results
October Dear Readers,
 aklitho JEDC.org 612 W. Willoughby Ave., Suite A Juneau, AK 99801 Phone 907 523 2300 October 2012 Dear Readers, The Juneau Economic Development Council (JEDC) is pleased to make our 2012 edition of local
Devonport-Takapuna Local Board Profile
 Devonport-Takapuna Local Board Profile - Initial results from the Census February 2014 Social and Economic Research Team Research, Investigations and Monitoring Unit Auckland Council Map of Devonport-Takapuna
Barbadians. imagine all the people. Barbadians in Boston
 Barbadians imagine all the people Barbadians in Boston imagine all the people is a series of publications produced by the Boston Redevelopment Authority for the Mayor s Office of Immigrant Advancement.
Inverness, Culloden and Suburbs Settlement Economic Overview
 Strategic planning and research Economic information December 2007 Inverness, Culloden and Suburbs Settlement Economic Overview Summary Between 2001 and 2006, the population of Inverness, Culloden and
2013 IRVING HOTEL GUEST SURVEY Final Project Report
 2013 IRVING HOTEL GUEST SURVEY Final Project Report Research prepared for the Irving Convention & Visitors Bureau by Destination Analysts, Inc. Table of Contents SECTION 1 Introduction 2 SECTION 2 Executive
A COMPARISON OF THE MILWAUKEE METROPOLITAN AREA TO ITS PEERS
 KRY/WJS/EDL #222377 v4 (PDF: #223479v2) 4/1/15 APPENDIX D REVISED DRAFT Memorandum Report A COMPARISON OF THE MILWAUKEE METROPOLITAN AREA TO ITS PEERS EXECUTIVE SUMMARY This report provides a statistical
The Economic Impact of Tourism on the District of Thanet 2011
 The Economic Impact of Tourism on the District of Thanet 2011 Prepared by: Tourism South East Research Unit 40 Chamberlayne Road Eastleigh Hampshire SO50 5JH CONTENTS 1. Summary of Results 1 2. Table of
Contents Manningham at a Glance... 6 Location and Area... 6 Manningham Activity Centres... 6 Manningham Suburbs... 6 Population... 8 Forecast... 9 For
 Contents Manningham at a Glance... 6 Location and Area... 6 Manningham Activity Centres... 6 Manningham Suburbs... 6 Population... 8 Forecast... 9 Forecast 2011 2036... 9 Population Forecast... 9 Gross
North Carolina (Statewide) 2016 Prosperity Zone Data Books
 2016 Prosperity Zone Data Books") North Carolina (Statewide) 2016 Prosperity Zone Data Books 2 North Carolina Prosperity Zones Western North Carolina Prosperity Zones Northwest Region Piedmont-Triad Region Western Region Southwest Region
North Carolina (Statewide) 2016 Prosperity Zone Data Books 2 North Carolina Prosperity Zones Western North Carolina Prosperity Zones Northwest Region Piedmont-Triad Region Western Region Southwest Region
CHAPTER 3: COMMUNITY PROFILE
 CHAPTER 3: COMMUNITY PROFILE Chapter 3 includes the following information: 1. Community Context 2. The Land 3. The People Who Live Here 4. The Housing Landscape 5. The Economy 6. Past and Future Growth
The Economic Contributions of Agritourism in New Jersey
 The Economic Contributions of Agritourism in New Jersey Bulletin E333 Cooperative Extension Brian J. Schilling, Extension Specialist in Agricultural Policy Kevin P. Sullivan, Institutional Research Analyst
NAPA VALLEY VISITOR INDUSTRY 2016 Economic Impact Report
 NAPA VALLEY VISITOR INDUSTRY 2016 Economic Impact Report Research prepared for Visit Napa Valley by Destination Analysts, Inc. Table of Contents S E C T I O N 1 Introduction 2 S E C T I O N 2 Executive
The Australian Defence Organisation and Tropical Australia: Its Socio-Economic Impact in Cairns, Darwin and Townsville
 The Australian Defence Organisation and Tropical Australia: Its Socio-Economic Impact in Cairns, Darwin and Townsville Dr Riccardo Welters School of Business, James Cook University Published by The Cairns
The Economic Impact of Tourism Brighton & Hove Prepared by: Tourism South East Research Unit 40 Chamberlayne Road Eastleigh Hampshire SO50 5JH
 The Economic Impact of Tourism Brighton & Hove 2013 Prepared by: Tourism South East Research Unit 40 Chamberlayne Road Eastleigh Hampshire SO50 5JH CONTENTS 1. Summary of Results 1 1.1 Introduction 1 1.2
CITY OF COTATI: LOCAL ECONOMIC REPORT
 EDB Sonoma County Economic Development Board Cotati Chamber of Commerce economy 2010-11 CITY OF COTATI: LOCAL ECONOMIC REPORT E c o n o m i c D e v e l o p m e n t B o a r d 4 0 1 C o l l e g e Av e n
NAPA VALLEY VISITOR INDUSTRY 2014 Economic Impact Report
 NAPA VALLEY VISITOR INDUSTRY 2014 Economic Impact Report Research prepared for Visit Napa Valley by Destination Analysts, Inc. Table of Contents SECTION 1 Introduction 2 SECTION 2 Executive Summary 5 SECTION
Community Health Status Assessment
 Community Health Status Assessment Boone County, Missouri Prepared August 2013 by: Sarah Rainey, Epidemiology, Planning and Evaluation Supervisor Columbia/Boone County Department of Public Health and Human
2015 IRVING HOTEL GUEST SURVEY Final Project Report
 2015 IRVING HOTEL GUEST SURVEY Final Project Report Research prepared for the Irving Convention & Visitors Bureau by Destination Analysts, Inc. Table of Contents S E C T I O N 1 Introduction 2 S E C T
The Economic Impact of Tourism on Calderdale Prepared by: Tourism South East Research Unit 40 Chamberlayne Road Eastleigh Hampshire SO50 5JH
 The Economic Impact of Tourism on Calderdale 2015 Prepared by: Tourism South East Research Unit 40 Chamberlayne Road Eastleigh Hampshire SO50 5JH CONTENTS 1. Summary of Results 1 2. Table of Results Table
AVIATION. January Aviation INDUSTRY PROFILE. for Arapahoe & Douglas Counties Colorado WIOA Central Planning Region
 January 2017 Aviation INDUSTRY PROFILE for Arapahoe & Douglas Counties Colorado WIOA Central Planning Region Background The Metro Denver region ranks 14th among the nation s 0 largest metro areas for aviation
NAPA VALLEY VISITOR INDUSTRY 2012 Economic Impact Report
 Join Visit Napa Valley NAPA VALLEY VISITOR INDUSTRY 2012 Economic Impact Report Research prepared for Visit Napa Valley by Destination Analysts, Inc. Table of Contents SECTION 1 Introduction 2 SECTION
The Economic Impact of Tourism on Scarborough District 2014
 The Economic Impact of Tourism on Scarborough District 2014 Prepared by: Tourism South East Research Unit 40 Chamberlayne Road Eastleigh Hampshire SO50 5JH CONTENTS 1. Summary of Results 1 2. Table of
Institute for Public Policy and Economic Analysis
 Institute for Public Policy and Economic Analysis Die Cut Die Cut Die Cut Die Cut The Institute for Public Policy and Economic Analysis at Eastern Washington University will convey university expertise
ECONOMIC PROFILE PARK CITY & SUMMIT COUNTY, UTAH
 ECONOMIC PROFILE PARK CITY & SUMMIT COUNTY, UTAH Prepared by the Park City Chamber of Commerce & Visitors Bureau PO Box 1630, Park City, UT 84060 1.800.453.1360 Economic Profile Packet Sections 1. Introduction
JATA Market Research Study Passenger Survey Results
 JATA Market Research Study Passenger Survey Results Prepared for the Jackson Area Transportation Authority (JATA) April, 2015 3131 South Dixie Hwy. Suite 545 Dayton, OH 45439 937.299.5007 www.rlsandassoc.com
Reference Number. Station
 Table A.7 Population and Number of Households within 800m Radius of Proposed s ALTERNATIVE 1 ALTERNATIVE 2 ALTERNATIVE 3 Reference Number Population Households Reference Number Population Households Population
HEALTH SECTOR ECONOMIC INDICATORS REPORT
 HEALTH SECTOR ECONOMIC INDICATORS REPORT For: Mid North Coast Local Health District Report prepared by: April 2013 Table of Contents Introduction 3 Executive Summary 4 Output 5 Value-Added 7 Workforce
Economic Impact Analysis. Tourism on Tasmania s King Island
 Economic Impact Analysis Tourism on Tasmania s King Island i Economic Impact Analysis Tourism on Tasmania s King Island This project has been conducted by REMPLAN Project Team Matthew Nichol Principal
2nd Quarter. AEDC is pleased to present the Anchorage Quarterly Economic Indicators Report for the second quarter of 2010.
 2010 AEDC is pleased to present the Anchorage Quarterly Economic Indicators Report for the second quarter of 2010. This report summarizes recently updated data from the Anchorage Economic Indicators Database,
The Economic Impact of Tourism Eastbourne Prepared by: Tourism South East Research Unit 40 Chamberlayne Road Eastleigh Hampshire SO50 5JH
 The Economic Impact of Tourism Eastbourne 2016 Prepared by: Tourism South East Research Unit 40 Chamberlayne Road Eastleigh Hampshire SO50 5JH CONTENTS Page 1. Summary of Results 1 1.1 Introduction 1 1.2
North Lanarkshire. Skills Assessment January SDS-1163-Jan16
 North Lanarkshire Skills Assessment January 2016 SDS-1163-Jan16 Acknowledgement The Regional Skills Assessment Steering Group (Skills Development Scotland, Scottish Enterprise, the Scottish Funding Council
Chapter 1: The Population of NHS Greater Glasgow and Clyde
 Population Estimate (thousands) Chapter 1: The Population of NHS Greater Glasgow and Clyde Population Trends and Projections National Records of Scotland estimated (NRS SAPE) 1 the 2013 NHS Greater Glasgow
The Yorke & Mid North (State Govt) Region. Workforce Wizard Region Report
 Region. Workforce Wizard Region Report") The Yorke & Mid North (State Govt) Region Workforce Wizard Region Report Table of Contents Executive Summary 3 Population and Social Characteristics 4 Current Population 4 Age Groups 4 Key Populations
The Yorke & Mid North (State Govt) Region Workforce Wizard Region Report Table of Contents Executive Summary 3 Population and Social Characteristics 4 Current Population 4 Age Groups 4 Key Populations
East Dunbartonshire Area Profile
 East Dunbartonshire Area Profile May 2014 Contents Executive Summary.. page 3 Introduction.. page 6 Population page 7 Age Structure. page 9 Population Projections page 11 Life Expectancy page 12 Ethnicity.
LITERACY IN NOVA SCOTIA Implications of Findings from IALSS 2003
 LITERACY IN NOVA SCOTIA Implications of Findings from IALSS 03 Presented by Satya Brink, Ph.D. Director, National Learning Policy Research Learning Policy Directorate, HRSDC January 06 1 Key Questions
Economic Impacts of Campgrounds in New York State
 Economic Impacts of Campgrounds in New York State June 2017 Report Submitted to: Executive Summary Executive Summary New York State is home to approximately 350 privately owned campgrounds with 30,000
The Economic Impact of Tourism New Forest Prepared by: Tourism South East Research Unit 40 Chamberlayne Road Eastleigh Hampshire SO50 5JH
 The Economic Impact of Tourism New Forest 2008 Prepared by: Tourism South East Research Unit 40 Chamberlayne Road Eastleigh Hampshire SO50 5JH CONTENTS Glossary of terms 1 1. Summary of Results 4 2. Table
Newbury Population ,071 1,941 3,719 4,038 5,337 5,611 5,805
 CHAPTER 3 DEMOGRAPHICS Demographic Profile Population Demographic information can provide essential insights into the composition of a community. As a result, it is a basic element of land use planning
The Economic Impact of Tourism Brighton & Hove Prepared by: Tourism South East Research Unit 40 Chamberlayne Road Eastleigh Hampshire SO50 5JH
 The Economic Impact of Tourism Brighton & Hove 2014 Prepared by: Tourism South East Research Unit 40 Chamberlayne Road Eastleigh Hampshire SO50 5JH CONTENTS 1. Summary of Results 1 1.1 Introduction 1 1.2
MEDIA LIFESTYLE MAGAZINE COMMUNITY ORIENTED
 MEDIA LIFESTYLE MAGAZINE COMMUNITY ORIENTED ABOUT US Live it up Doral is a printed and digital magazine that invites readers to enjoy the city of Doral. Its editorial line combines life style with community
HART RESEARCH ASSOCIATES/PUBLIC OPINION STRATEGIES Study # page 1
 HART RESEARCH ASSOCIATES/PUBLIC OPINION STRATEGIES Study #18164 -- page 1 Interviews: 1100 Adults, including 495 respondents with a cell phone only and Date: March 10-14, 2018 14 respondents reached on
COMPARATIVE INDICATORS TO OTHER HAMPTON ROADS CITIES. David Bradley
 COMPARATIVE INDICATORS TO OTHER HAMPTON ROADS CITIES David Bradley July 14, 2017 EXPENDITURES BY CATEGORY - FY 2015-16 ALL FUNDS 100.0% 8.1% 4.1% 7.2% 9.2% 5.8% 8.6% 6.9% 80.0% 60.0% 45.0% 49.1% 36.1%
Juneau Household Waterfront Opinion Survey
 Juneau Household Waterfront Opinion Survey Prepared for: City and Borough of Juneau Prepared by: April 13, 2004 TABLE OF CONTENTS Executive Summary...1 Introduction and Methodology...6 Survey Results...7
2009 North Carolina Visitor Profile
 2009 Visitor Profile A publication of the Division of Tourism, Film & Sports Development August 2010 Division of Tourism, Film and Sports Development 2009 Visitor Profile 2009 Visitor Profile The Division
Follow this and additional works at:
 Florida International University FIU Digital Commons Palm Beach County MPO Community Background Reports 1-1-2011 Town of Lake Park Follow this and additional works at: http://digitalcommons.fiu.edu/mpo_palmbeach
Swaziland. HDI values and rank changes in the 2013 Human Development Report
 Human Development Report 2013 The Rise of the South: Human Progress in a Diverse World Explanatory note on 2013 HDR composite indices Swaziland HDI values and rank changes in the 2013 Human Development
East Dunbartonshire Area Profile
 East Dunbartonshire Area Profile May 2015 Contents Executive Summary.. page 3 Introduction.. page 6 Population page 7 Age Structure. page 9 Population Estimates..page 11 Population Projections page 13
The 2001 Economic Impact of Connecticut s Travel and Tourism Industry
 The 2001 Economic Impact of Connecticut s Travel and Tourism Industry EXECUTIVE SUMMARY Fred V. Carstensen, Director Stan McMillen, Manager, Research Projects Murat Arik, Research Associate Hulya Varol,
The Economic Impact of Tourism on Oxfordshire Estimates for 2013
 The Economic Impact of Tourism on Oxfordshire Estimates for 2013 County and District Results September 2014 Prepared by: Tourism South East Research Unit 40 Chamberlayne Road Eastleigh Hampshire SO50 5JH
COTATI CITY PROFILE REPORT
 COTATI CITY PROFILE REPORT 2017 Report developed by the Sonoma County Economic Development Board in partnership with the City of Cotati and the Cotati Chamber of Commerce ECONOMIC DEVELOPMENT BOARD BOARD
Youth Retention: July Value of post secondary education in regional settings. Prepared for Luminosity Youth Summit.
 Youth Retention: Value of post secondary education in regional settings Prepared for Luminosity Youth Summit July 2013 Prepared by MID NORTH COAST NSW Table of contents Table of contents... 2 Introduction...
Tourism Satellite Account Calendar Year 2016
 Tourism Satellite Account Calendar Year 2016 Key Definitions 1. Tourism/Tourist: Refers to the leisure travel/traveler segment. 2. Travel/Traveler: Includes both leisure and business travel/travelers.
Cedar Rapids Area Convention and Visitors Bureau Visitor Study
 Cedar Rapids Area Convention and Visitors Bureau Visitor Study 2003-2004 University of Northern Iowa Sustainable Tourism & The Environment Program www.uni.edu/step Project Directors: Sam Lankford, Ph.D.
Produced by: Destination Research Sergi Jarques, Director
 Produced by: Destination Research Sergi Jarques, Director Economic Impact of Tourism Norfolk - 2017 Contents Page Summary Results 2 Contextual analysis 4 Volume of Tourism 7 Staying Visitors - Accommodation
TABLE OF CONTENTS PREFACE & CONTACTS DEMOGRAPHICS TRAVEL BEHAVIOR CHARACTERISTICS MODAL STATISTICS TOURISM TRANSPORTATION FINANCING
 TABLE OF CONTENTS PREFACE & CONTACTS DEMOGRAPHICS TRAVEL BEHAVIOR CHARACTERISTICS MODAL STATISTICS TOURISM TRANSPORTATION FINANCING TRANSPORTATION EDUCATION & RESEARCH DIRECTORY MISCELLANEOUS INDEX on
Accommodation Survey: November 2009
 Embargoed until 10:45am 19 January 2010 Accommodation Survey: November 2009 Highlights Compared with November 2008: International guest nights were up 2 percent, while domestic guest nights were down 1
Produced by: Destination Research Sergi Jarques, Director
 Produced by: Destination Research Sergi Jarques, Director Economic Impact of Tourism Oxfordshire - 2016 Economic Impact of Tourism Headline Figures Oxfordshire - 2016 number of trips (day & staying) 27,592,106
Living on the edge: The impact of travel costs on low paid workers living in outer London executive summary. living on the edge 1
 Living on the edge: The impact travel costs on low paid workers living in outer London executive summary living on the edge 1 introduction key findings London has a world-class public transport system
ISRAEL- COUNTRY FACTS
 ISRAEL- COUNTRY FACTS ISRAEL-NEIGHBOURING COUNTRIES AND POLITICAL MAP Area: 22,072 sq. km Land area: 21,643 sq. km. Fast Facts Area of lakes: 429 sq. km. (Sea of Galilee 164 sq. km., the Dead Sea - 265
Produced by: Destination Research Sergi Jarques, Director
 Produced by: Destination Research Sergi Jarques, Director Economic Impact of Tourism North Norfolk District - 2016 Contents Page Summary Results 2 Contextual analysis 4 Volume of Tourism 7 Staying Visitors
Produced by: Destination Research Sergi Jarques, Director
 Produced by: Destination Research Sergi Jarques, Director Economic Impact of Tourism Norfolk - 2016 Contents Page Summary Results 2 Contextual analysis 4 Volume of Tourism 7 Staying Visitors - Accommodation
Demographic Rankings
 demographics 82 Demographic Rankings Second highest level of educational attainment of major Canadian cities Calgary ranked #3 in Top 10 Places to Raise Kids Calgary ranked #19 in Overall Ranking MoneySense
The Economic and Fiscal Impacts of the Renovation, Expansion, and Annual Operation of the Balsams Grand Resort and Wilderness Ski Area
 The Economic and Fiscal Impacts of the Renovation, Expansion, and Annual Operation of the Balsams Grand Resort and Wilderness Ski Area Prepared by: February 2015 bgottlob@poleconresearch.com Table of Contents
Temecula Valley Travel Impacts
 Temecula Valley Travel Impacts 2000-2013p photo courtesy of Temecula Valley Convention and Visitors Bureau June 2014 Prepared for the Temecula Valley Convention and Visitors Bureau Temecula, California
Australian Casino Association ECONOMIC REPORT. Prepared for. Australian Casino Association. June Finance and Economics
 Australian Casino Association ECONOMIC REPORT Prepared for Australian Casino Association June 2004 Finance and Economics Contents Executive Summary--------------------------------------------------------------------------------------------
Intercity Bus and Passenger Rail Study
 Intercity Bus and Passenger Rail Study Prepared for the Michigan Department of Transportation University of Michigan, College of Architecture and Urban Planning Intercity Bus and Passenger Rail Study Prepared
THE GALLOWAY OWENS DRIVE & WILLOW ROAD, PLEASANTON, CA
 AT THE CENTER OF IT ALL THE GALLOWAY A luxury mixed-use development featuring prime corner retail spaces located directly across from the Dublin/Pleasanton BART station OWNER: BRE PROPERTIES NORTHERN CALIFORNIA
Richard V. Butler, Ph.D. and Mary E. Stefl, Ph.D., Trinity University HIGHLIGHTS
 This study was prepared by Richard V. Butler, Ph.D. and Mary E. Stefl, Ph.D., Trinity University HIGHLIGHTS In 2017, the economic impact of San Antonio s Hospitality Industry was $15.2 billion. The San
Government of Canada Survey of Heritage Institutions: 2015
 Government of Canada Survey of Heritage Institutions: 2015 1 This publication is available online at https://www.canada.ca/en/government/publications/dept.html Également disponible en français. Her Majesty
POPULATION INTRODUCTION
 POPULATION INTRODUCTION The socio-economic data available at the time of this writing is a conglomeration of data provided by the Kentucky State Data Center, OKI Regional Council of Governments, 2010 U.S.
Commissioned by: Economic Impact of Tourism. Stevenage Results. Produced by: Destination Research
 Commissioned by: Produced by: Destination Research www.destinationresearch.co.uk December 2016 Contents Page Introduction and Contextual Analysis 3 Headline Figures 5 Volume of Tourism 7 Staying Visitors
UNIVERSITY AVE SAN DIEGO, CA 92104
 3487-95 UNIVERSITY AVE SAN DIEGO, CA 92104 LISTED BY: Patsy Ma, MBA, CCIM, CRX, CLS President DRE# 00980137 patsyma@bpinternational.net Francisco Williams, CCIM Vice President Investment Sales DRE #01979442
Economic Impact of Tourism. Hertfordshire Results. Commissioned by: Visit Herts. Produced by:
 Commissioned by: Visit Herts Produced by: Destination Research www.destinationresearch.co.uk December 2016 Contents Page Introduction and Contextual Analysis 3 Headline Figures 5 Volume of Tourism 7 Staying
The Economic Impact of Tourism on Galveston Island, Texas
 The Economic Impact of Tourism on Galveston Island, Texas 2017 Analysis Prepared for: Headline Results Headline results Tourism is an integral part of the Galveston Island economy and continues to be a
The Economic Impact of Tourism on Oxfordshire Estimates for 2014
 The Economic Impact of Tourism on Oxfordshire Estimates for 2014 County and District Results August 2015 Prepared by: Tourism South East Research Unit 40 Chamberlayne Road Eastleigh Hampshire SO50 5JH
IT S YOUR AREA. what s important? TYWYN AREA. WELL-BEING ASSESSMENT GWYNEDD AND MÔN Gwynedd and Môn Public Services Board
 IT S YOUR AREA. what s important? TYWYN AREA WELL-BEING ASSESSMENT GWYNEDD AND MÔN Gwynedd and Môn Public Services Board 2016 well-being assessment Gwynedd WANT to HAVE YOUR SAY? and Môn The new act has
Population Composition, Geographic Distribution, and Natural Hazards: Vulnerability in the Coastal Regions of Puerto Rico
 Population Composition, Geographic Distribution, and Natural Hazards: Vulnerability in the Coastal Regions of Puerto Rico Researchers Havidán Rodríguez, Ph.D. (DRC-UDel) Walter Díaz, Ph. D. (CISA-UPRM)
Temecula Valley Travel Impacts p
 Temecula Valley Travel Impacts 2000-2017p photo courtesy of Temecula Valley Convention and Visitors Bureau May 2018 Prepared for the Temecula Valley Convention and Visitors Bureau Temecula, California
The Economic Impact of Tourism in Hillsborough County. July 2017
 The Economic Impact of Tourism in Hillsborough County July 2017 Table of contents 1) Key Findings for 2016 3 2) Local Tourism Trends 7 3) Trends in Visits and Spending 12 4) The Domestic Market 19 5) The
Produced by: Destination Research Sergi Jarques, Director
 Produced by: Destination Research Sergi Jarques, Director Economic Impact of Tourism Oxfordshire - 2015 Economic Impact of Tourism Headline Figures Oxfordshire - 2015 Total number of trips (day & staying)
Commissioned by: Visit Kent. Economic Impact of Tourism. Dover Results. Produced by: Destination Research
 Commissioned by: Visit Kent Produced by: Destination Research www.destinationresearch.co.uk November 2016 Contents Page Introduction and Contextual Analysis 3 Headline Figures 6 Volume of Tourism 8 Staying
The Economic Impact of Tourism West Oxfordshire Prepared by: Tourism South East Research Unit 40 Chamberlayne Road Eastleigh Hampshire SO50 5JH
 The Economic Impact of Tourism West Oxfordshire 2014 Prepared by: Tourism South East Research Unit 40 Chamberlayne Road Eastleigh Hampshire SO50 5JH CONTENTS 1. Summary of Results 1 1.1 Introduction 1
The Quality of Life Report
 The Quality of Life Report A Foundation for Policy Development Tulsa City Council / 2014-16 Term Tulsa Skyline - view from ONEOK field by Vladxp, Creative Commons (NC-ND 2011) I know not anything more
Population, Territory and Sustainable Development The Case of the Caribbean Sub Region
 Population, Territory and Sustainable Development The Case of the Caribbean Sub Region Author: Godfrey St. Bernard Sir Arthur Lewis Institute of Social and Economic Studies The University of the West Indies