Shipping and Shipbuilding MarketS
|
|
|
- Myra King
- 6 years ago
- Views:
Transcription

1 Shipping and Shipbuilding MarketS Annual Review
2 A n n u a l R e v i e w BRS IS ONE OF THE LEADING INTERNATIONAL SHIPBROKING FIRMS, OFFERING EXPERTISE IN ALL MARKET SECTORS 150 YEARS OF EXPERIENCE 100 SHIPBROKERS AN INTERNATIONAL NETWORK: ATHENS, DUBAI, GENEVA, HO CHI MINH CITY, LONDON, MADRID, MUMBAI, NEW DELHI, PARIS, RIJEKA, SHANGAI, SINGAPORE...
3 CONTENTS 02 FOREWORD 04 YOUR GLOBAL SHIPPING PARTNER 06 THE SHIPBUILDING MARKET IN THE DRY BULK MARKET IN THE TANKER MARKET IN THE CHEMICAL CARRIER MARKET IN THE LPG AND CHEMICAL GAS SHIPPING MARKET IN THE LNG SHIPPING MARKET IN THE OFFSHORE AND SPECIALISED SHIPS MARKET IN THE CRUISE MARKET IN THE CONTAINERSHIP MARKET IN THE RO-RO MARKET IN THE MARINE INSURANCE MARKET IN A n n u a l R e v i e w 1


4 f AFTER A LONG PERIOD OF CELEBRATION, THE WAKE-UP CALL WAS PARTICULARLY PAINFUL.
5 I n the course of 09, a year which will be long remembered, hope finally replaced fear - a fear born of the unknown and the uncontrollable. The year started under the worst auspices, with a non-existent freight market (except in the tanker sector), a complete absence of vessel sales, plummeting economic consumption affecting the containership sector and, finally, a paralysed financial market totally dependent on the goodwill of international regulatory bodies and government policies. After a long period of celebration, the wake-up call was particularly painful. But in the course of the second half of the year, the market regained its colour. The banking system avoided collapse, money began circulating - sparingly but at historically low interest rates - and China made the most of the general disorder and the success of its stimulus plan to regain its health. The compass needle stopped twitching, the market found its fundamentals, and the shipping industry began to regulate itself again, as is common in any cyclical market. Thanks to cancellations and delayed deliveries, new vessels were less than expected and the fleet increased by only 7% in 09, against a decline in seaborne trade of 3%. Demolitions reached 36m dwt taking us back to the records seen in the 1980s while oil storage immobilised 6% of the tanker fleet, permitting the market, with the help of a harsh winter, to achieve higher rates by the end of the year. In the containership market, with around 10% of the fleet in lay-up, and with the introduction of slow steaming plus a series of tariff increases, the cost of transporting a box between Asia and Europe reached a level by year-end that no one would have expected at the start of the year. As for the dry bulk market, rates were kept afloat by the immense needs of China which increased its imports by more than 270m tonnes in 09 thanks to an insatiable demand for iron ore (+45%) and coal (+300%). The second hand market was also again busy, with a total number of transactions ultimately similar to 08, although with an average price of 40% to 50% less. Good news then? Yes, but newbuilding deferrals will only postpone the problem of overcapacity, and the market must still absorb close to 40% of the existing fleet over the next three years (65% for the large bulkers). Faced with an economic recovery that most experts qualify as soft, these ships will long weigh on the market and its return to equilibrium. Furthermore, it is estimated there are $150bn of newbuilding contracts not yet financed, out of a total orderbook worth $450bn. The current price of new and second hand ships should allow more healthy economic calculations, and raise hopes of increased activity in the shipbuilding industry. However those vessels ordered or purchased at excessive prices are here to stay, and will penalise heavily the profit and loss accounts of some shipowners. And the winner is China, which is not reducing its newbuilding capacity and which in 09 became the largest buyer of second hand tonnage ahead of Greece. China will be able to build a fleet at moderate prices as Japan did 30 years ago and thus better control the transport of the manufactured goods and raw materials that its industry so needs. Meanwhile the crisis will accelerate the shift of the global centre of gravity towards Asia, an irreversible change that will inevitably reduce the maritime power of the western countries. In conclusion, the recession is perhaps behind us, but we are still recovering and a relapse is yet possible, a situation which is going to create strong volatility in the shipping markets. This in turn offers opportunities to those with the means to seize them. Nevertheless it is certain that, unlike some other industries, shipping s future is not threatened by any technological revolution and the maritime industry remains the backbone of international trade. Certainly it may undergo a change of ownership but isn t that the nature of the capitalist system? Jean-Bernard RAOUST Chairman of BRS 10 A n n u a l R e v i e w 2 3

6 our global shipping partner NEWBUILDING François CADIOU TANKER CHARTERING François WALON DRY BULK CHARTERING Thorsten WESTPFAHL SALE & PURCHASE Bruno JOURDAN-BARRY LINER Jacques GOUDCHAUX Providing expert commercial, technical and legal advice to owners and builders worldwide Arranging the safe and efficient carriage of crude and petroleum products round the globe Helping the world s leading industrial groups move raw materials seamlessly from A to B Guiding buyers and sellers through the complex process of asset sale and purchase Servicing the tonnage and chartering requirements of the world s major liner, ferry and cruise operators
7 CHAIRMAN Jean-Bernard RAOUST CHIEF EXECUTIVE Tim JONES CHEMICAL & SMALL TANKER CHARTERING LNG & LPG CHARTERING OFFSHORE AND SPECIALISED VESSELS RESEARCH & INFORMATION Alain BULTEZ Francis BAUDU Jean-Philippe GUZOWSKI Bruno SALLAVUARD Jean-Frédéric LAURENT Bringing in-depth expertise to the unique challenge of carrying complex liquid bulk cargos Capitalising on 40 years experience in the gas trades to provide the best quality service Providing the full range of chartering, asset and consultancy services to the offshore industry Providing up-to-date statistical data and analysis to the shipping industry AXS MARINE Online Solutions for Shipping Professionals BRS Futures Ltd BRS FUTURES Freight Derivative Broking CAP-MARINE Marine Insurance Broking MLTC Port & Shipping Consultancy YACHTING PARTNERS INTERNATIONAL Yacht Chartering, Management, Sale & Purchase, Construction A n n u a l R e v i e w

8 STENA POLARIS Product tanker, 65,1 dwt, delivered in February 10 by the Croatian shipyard Brodosplit to Concordia Maritime of Sweden Tough times

9 DUE TO THE ONSLAUGHT OF THE FINANCIAL CRISIS, 09 WILL BE REMEMBERED AS A YEAR OF GREAT TURMOIL FOR THE GLOBAL SHIPBUILDING INDUSTRY. It was a period that saw few new orders, difficult contract renegotiations, numerous cancellations, a vertiginous fall in construction prices, shipowner and shipyard bankruptcies (though not as many as feared at the start of the year), and daily challenges for all the key parties involved: shipbuilders, shipowners, banks and suppliers. 10 A n n u a l R e v i e w 6 7

10 market in 09 NORMAN LEADER Ro-Pax, 160 cabins, 1,215 passengers, 1,500 lane meters for trailers, 2,670 lane meters for cars, 22 knots, on order for LD Lines at Singapore Technologies Marine for delivery in 10 Highlights of the year With only 34m dwt of new orders or just over 300 vessels, 09 marks a clear break from the years when orders reached between 100m and 300m dwt a year, or 2,000 to 5,000 vessels. This 34m dwt of orders in 09 also even falls way below the years prior to the boom, when orders fluctuated between 40m and 60m dwt a year. To find a figure lower than that of 09, it is necessary to go back to 1992, which saw just 19m dwt in new contracts materialise. This figure must also be put in the context of the global shipbuilding capacity at the time, estimated at just 50m dwt compared to 0m dwt in 09. Order cancellations, a marginal occurrence before the outbreak of the financial crisis in September 08, multiplied throughout 09 to number more than 400 ships, thereby actually exceeding the 300 ships placed on order, although the amount was slightly less in deadweight terms, at 22m dwt. The cancellation figure remains very uncertain and is likely to be short of the actual figure given the confidentiality that is inherent in this area. If the delivery projections (certainly too ambitious) set by the builders for 09 (170m dwt) were not possible to reach, actual deliveries nevertheless represented 114m dwt in 09 compared to 91m dwt in 08. The global shipbuilding portfolio continued the decline which started in the autumn of 08, falling from 580m dwt (370m gt or 10,500 ships) at end 08 to 516m dwt (322m gt or 7,680 ships) at end 09. The orderbook now represents 42% of the existing fleet, which was estimated at 1.23bn dwt at the close of 09. The outlook for the shipyards remains broadly the same as at the end of 08 and the orderbook is on average spread out until 11 in Europe, South Korea and China, and to 12 in Japan. For the first time, China reached the number one position among shipbuilding nations by gross tonnage, with an orderbook at end 09 of 8m dwt (1m gt) against 230m dwt (126m gt) at the end of 08. South Korea now occupies second place with an orderbook of 170m dwt (113m gt) compared to 0m dwt (134m gt) a year earlier. Japan maintains its third place with an orderbook of 94m dwt (56m gt) against 122m dwt (74m gt). These three countries, China, South Korea and Japan, together account for 90% of the world shipbuilding portfolio, while the remaining 10% is distributed between the European shipbuilders who hold 15m dwt (16m gt), and the shipbuilders in the rest of the world with 32m dwt (19m gt). Contrary to the general trend, one country did not register any decrease in their orderbook: Brazil. The collapse in demand, the general decline in freight rates, the loss of funding capacity, the endemic uncertainties about the economic recovery, and the likelihood that prices will be even lower in future, have all had a considerable impact on asset values and have contributed to a sharp drop in newbuilding prices of about 30% to 45% from the peaks of 08, depending on the size and type of vessel, thus taking newbuilding prices back to levels not seen since 04, and in just one year erasing nearly four years of steady prices increases. 09 nevertheless ended in a better state than was feared earlier in the year. Stimulus plans proliferated in the US ($787bn), China ($580bn), Japan ($5bn) and Europe ( 400bn). Central banks reduced interest rates to almost zero and injected billions of dollars of liquidity into the economy. Banks across all countries were asked to contribute to revitalize local economic activity. Naturally a few discordant voices were heard criticising these support measures, which risked distorting competition and artificially sustaining excess shipbuilding capacity or imprudent market players.
11 the economy, maritime trade and the freight markets For the first time since 1945, the world economy entered into recession during 09. As a sign of the great uncertainty, the quarterly forecasts offered by the different economists were continually revised downwards between the autumn of 08 and the spring of 09 before rebounding in the second half of the year. The contraction in the global economy should be in the order of 1% in 09, compared to growth of 3% in 08. The decline was more marked in the US, Japan and in the Euro zone. By contrast, China, India and Brazil managed to maintain high rates of growth. As a consequence, world trade shrank, dropping from +3% in 08 to -12% in 09, having a dramatic impact on seaborne trade. IMF GDP and World Trade Growth Forecasts (%) Dry bulk freight rates which were at their lowest in 08 recovered during the course of 09 to reach very respectable levels. Conversely in the tanker sector, rates which had shown a degree of resistance at the start of the crisis fell sharply in the months that followed. Meanwhile a containership, regardless of size, could be chartered for just a few thousand dollars, far below shipowners break-even levels. Many of these ships were placed straight into lay-up upon leaving the shipyard. At the end of the year, more than 11% of the containership fleet was inactive. The majority of operators opted to run their ships at reduced speeds in order to economise on bunkers and regulate the supply of capacity World USA Japan Euro area China India World Trade Orders for standard vessels: bulkers, tankers and containerships IMF - Jan. 10 FOR THE FIRST TIME, CHINA REACHED THE NUMBER ONE POSITION AMONG SHIPBUILDING NATIONS. Of the 300 new orders identified in 09, around 175 were placed at just 15 shipyards We estimate the number of shipbuilders in the world at around 5 in 09 (0 in China, 70 in Japan, 40 in South Korea, 140 in Europe and 70 in the rest of the world ). It is interesting to note that of the 300 new orders identified in 09, around 175 were placed at just 15 shipyards, most of them in China. Despite the crisis, some owners have not hesitated to place massive orders, some involving series of 10 to 30 units. We cite for example: Grand China: 18 Capesize + 12 Panamax + 6 VLCC at Jinhaiwan NITC : 6 VLCC at Dalian + 6 VLCC at SWS Oman Shipping : 4 VLOC at Jiangsu Rongsheng STX Pan Ocean : 8 VLOC at STX Vale: 4 VLOC at DSME + 12 VLOC at Jiangsu Rongsheng + 4 Capesize at Sundong Palmali : 10 product chemical tankers of about 7,000 dwt at Besisktas New Orders by Year millions tpl Tankers >25,000 dwt Bulkers >15,000 dwt Containerships >300 teu A n n u a l R e v i e w 8 9
12 market in 09 NEW ORDERS FOR STANDARD VESSELS PER YEAR dwt VLCC Suezmax Aframax Panamax MR Handy Capesize Panamax Supramax Handysize Containership Tankers Products Products (above 300 teu) THERE WERE VIRTUALLY NO ORDERS FOR CONTAINERSHIPS OR SPECIALISED TONNAGE IN 09. Orders of this magnitude were characteristic of the boom years and of the speculation that prevailed at the time. But one also sees new strategies being drawn up by those players with global ambitions who wish to take advantage of the current circumstances to build up their fleets at a low cost, increase their market % tpl 80% shares, or support compatriot shipyards. One should note as well the insertion of new orders into gaps created in the shipyards usual production schedules: one barge at DSME, two 6,000 dwt bitumen tankers and two small feederships of 1,000 teu at HMD, which demonstrates the yards need to occupy their staff. PERCENTAGE OF THE ACTIVE FLEET ON ORDER BY TYPE % dwt of fleet on order 70% China took the greatest number of new orders in 09 60% 50% 40% 30% % Containerships Bulk carriers Oil tanker 61% 35% 33% 10% 0% The 34m dwt of new orders in 09 is broadly divided into: m dwt of bulk carriers, 10m dwt of tankers and just a few containerships. The majority of these orders were placed in the second half of the year. The dry bulk orderbook reached 288m dwt at the end of 09, compared to 295m dwt at the end of 08. Even if the fleet under construction stops growing it still represents, at 61% of the fleet in service compared to 68% a year earlier, a significant percentage. China s shipyards hold almost half of this orderbook, ahead of the Japanese and South Korean shipbuilders (24% and % respectively). The tanker orderbook contracted from 181m dwt at end 08 to 149m dwt at end 09, and the proportion of the fleet under construction fell from 43% to 33% of the fleet in service. South Korea s shipyards have close to half of this orderbook, while China (30%) and Japan (15%) occupy second and third place respectively. The containership orderbook fell from 74m dwt at end 08 to 58m dwt at the end of 09. The fleet under construction represents only 35% of the fleet in service, compared to 45% a year earlier. With a 62% share of the market at the close of 09, South Korea occupies a prominent position in the market ahead of the Chinese (%) and Japanese (5%) yards.
13 Orders for specialised tonnage There were virtually no orders for specialised tonnage in 09. Aside from the economic uncertainty and the difficulty in securing finance, shipowners were also waiting for prices to become more affordable. The majority of specialised shipowners do not have the advantage of being able to buy and sell on the second hand market and thereby capture increases in value. Frequently they buy their tonnage new in order to operate them for their full economic life. They must exercise restraint in their procurement policies and invest when markets are low. It is likely that shipbuilders who have given priority to standard ships in recent years will be more favourable to building specialised ships in 10. No. ships SPECIALISED VESSELS NEW ORDERS PER YEAR Chemical carriers LPG LNG stainless steel carriers carriers Ferries & Ro-pax Ro-ro Car carriers Cruise vessels Time charter: average rates $/day millions Unit Fleet in service On order % of fleet in service Chemical Tankers Dwt % LNG tankers Cbm % LPG tankers Cbm % Roro (pure ro-ro only) Dwt % PCTC CEU % Cruiseships Gt % newbuilding prices Sales prices for newbuildings in US dollars have fallen sharply during the year. It is quite difficult to estimate the decrease between 1 st January and 31 st December 09 as the fall in prices began in the autumn of 08 but, in the absence of any significant orders in the last months of 08, it remained difficult to quantify at 31 December 08. The measurement is easier if one refers to the peak prices recorded in the summer of 08, and we estimate that the fall in newbuilding prices between that time and the end of 09 represents between 30% and 45%. This range, which is quite large, reflects the difficulty in accurately establishing the current market price for many types and size of ship. In the absence of transactions, it is often a matter of estimation. Broadly speaking, sale conditions have improved to the benefit of shipowners. Deferred payment terms have made a reappearance. With the crisis, we have reverted back to a buyer s market. Many shipbuilders have abstained from submitting offers to clients even though they have been pressed to do so, sensing that they did not have real buyers in front of them, and anticipating that putting lower prices into circulation would only fuel the descent in prices. These shipyards also wanted to avoid giving ammunition to owners looking to renegotiate high contract prices. At times they also wanted to protect their clients and avoid damaging their delicately constructed financial arrangements, particularly in the face of banks concerned by the sudden devaluation of their collateral, who were often keen to adjust loan amounts to bring them in line with the new asset values and who sometimes wanted to escape their commitments altogether. These price reductions however were in the context of virtually no demand and very weak competition between shipyards who were often far more preoccupied with managing their existing orderbooks. Shipyards also found that their construction costs were not falling fast enough to satisfy their clients demands. Nevertheless, the price of raw materials finally showed signs of yielding: steel went from $1,150 per tonne (at its peak in 08) to around $650 per tonne, in other words for a VLCC newbuilding a $m saving in the purchase of steel alone. On the other hand, the yards were not yet registering substantial price discounts from equipment suppliers, whose orderbooks were still supported by the wave of orders in previous years. Thus it remains a commercially difficult choice for shipbuilders to agree to significant price decreases to this day. Increased competition between suppliers, who are also facing a decline in demand, should allow shipyards to reduce their construction costs. The structural weakness of the dollar in relation to the currencies of the major shipbuilding nations also remains a handicap. This was particularly true for Japan where the Yen appreciated significantly from 100 to 88 Yen to the dollar in 09, and in Europe where the Euro has gone from 0.75 to 0.68 to the dollar. 10 A n n u a l R e v i e w 10 11
14 market in 09 The Chinese Yuan, which has appreciated since 05, developed only slightly during the year, moving from 6.85 Yuan at end 08 to around 6.82 Yuan to the dollar at end 09. The Korean Won depreciated in the first part of the year from 1,350 to 1,500 Won/US$ before re-appreciating towards 1,150 Won/ US$ by the end of the year. If the decline in newbuilding prices is linked to the collapse in demand, it has also been fuelled by the fall in values on the second hand and re-sale markets, which have played host to several distressed sales as a result of bankruptcies or cancelled orders. When compared to the market peak in 08, the decline in prices on the re-sale market has been between 60% and 70% for bulkers, and between 30% and 40% for tankers. At the end of 09 prices remain far from stabilized, with large differences still showing between shipbuilders and shipbuilding nations for, in principle, the same class of vessel. Newbuilding price variations (in million US$) 4Q 03 4Q 04 4Q 05 4Q 06 4Q 07 Peak 08 4Q 09 Tankers VLCC /125* 115/128* 135/140* 140/155* Suezmax /90* 90/100* Aframax /70* 70/75* MR Product /51* 48/51* Bulkers Capesize /73* 80/90* 90/100* Panamax 24 35, /55* 53/60* 33/37* Handymax /48* 47/50* 27/33* *China/Japan-S.Korea renegotiations Shipbuilders have been assailed during 09 by the repeated demands of clients who wished, or had no choice but to renegotiate the terms of their contracts. No subject was taboo: the cancellation by mutual agreement of part of an ongoing series on order, delivery deferrals, price reductions, the restructuring of payment terms, requests for further financing, the introduction of sellers credit, the conversion of orders into other ship types, etc. Understandably, most of these negotiations remained highly confidential. The shipyards, especially the larger ones, have been extremely reluctant to accede to requests for cancellations, more than anything for fear of a contagion and because they did not wish to abandon firm contracts with far-off delivery dates concluded at a good price. In addition, currency hedging mechanisms made it very difficult to exit some commitments, particularly in South Korea. Shipbuilders have been able to accept the cancellation of some orders when they have a large series of vessels with late deliveries, for example in 11 or 12, and for which construction had not yet begun. In agreeing to sacrifice some units, they undoubtedly saved a large part of their orders and avoided the more delicate situations facing those shipowners unable to secure finance and fund their due payments. Shipbuilders have also agreed to concessions to avoid aggravating the risk of delay in the construction of early orders, or to appease clients who had become more demanding with regards to the execution of their contracts. They could therefore defer the contractual delivery dates of these initial ships and avoid late delivery penalties, in return for cancelling the shipowner s later ships. Shipbuilders have also accepted cancellations when their customers have compensated them for all or part of costs already incurred, but also sometimes when the shipowners decided to, often under duress, abandon their deposits. The shipyards have often preferred to negotiate a postponement of the delivery date by a few months or more, to reorganize payment schedules, or to propose sellers credit (usually around 10% of the contract price) to facilitate deliveries and enable shipowners to complete their financing. Very few shipbuilders have agreed to price reductions. The deferral of deliveries has undoubtedly constituted the best compromise for both parties: for those owners who avoid taking delivery of newbuildings in a market with already depressed freight rates and hope thereby to push back delivery until after
15 the crisis; and also for the shipyards who can spread out their orderbooks until 11 or even 12 in a climate of otherwise tenuous demand. The shipyards can also aspire to reduce their construction costs by buying cheaper steel or equipment tomorrow. Of course banks also impose themselves in these negotiations; arbitrations have proliferated. Cancellations Uncertainty over the exact number of cancellations persists. Deviations ranging from modest differences to a doubling in numbers exist between the different brokers, classification societies, the media, and shipbuilder associations. Renegotiations between shipbuilders and shipowners often remain private. Only the publicly-listed companies, be they shipbuilders or owners, are held to higher standards of transparency. Sometimes, in these cases, these cancelled orders have been transformed into options. A detailed account of these cancellations at yards in bankruptcy or insolvent should have been easier in principle, but the situation is not always clear at these shipyards, which have sometimes persisted in their activities. Whatever the case may be, around 4 newbuilding cancellations were registered in 09, compared to 335 in 08. To this we must add 700 to 750 orders which were uncertain or never confirmed, which have been removed from the orderbook. The preponderance of cancellations in 09 affected the bulk segment with close to 180 units deleted, compared to around 90 tankers and 60 containerships. Out of the total 4, cancellations were more prevalent in China (160 ships) than in South Korea (106) or in Japan (28). We also note the large number of cancelled car carriers (14) in relation to the size of the fleet on order (169). Some cancellations were more abrupt, arising from significant yard delays that allowed the shipowner to contractually cancel the ship, or simply from problems relating to quality and/or compliance with the contractual specifications, or arising from the bankruptcy of the owner or the shipbuilder. ORDERS REPORTED CANCELLED IN 08 ORDERS REPORTED CANCELLED IN 09 Total : 336 Total : 4 47 ships (10%) 46 ships (4%) 63 ships (8 %) 87 ships 4 %) 60 ships (13%) 89 ships (24%) 183 ships (73% by dwt) 181 ships (64% by dwt) Bulkers Tankers Containerships Others Bulkers Tankers Containerships Others Bankruptcies The crisis has depleted many shipyards with exhausted treasuries. Some builders have resorted to placing themselves under court protection or have been placed under the control of their banks, who have been called upon in many countries to support struggling enterprises. Some small shipyards in China, emptied of their workforce, have become ghost yards. These situations are never clear-cut. Nevertheless, we can name ten or so shipbuilders in Europe, as many in Korea, and several in Japan and China which are insolvent or under the control of banks or in bankruptcy. This list is likely to grow in the months to come. 10 A n n u a l R e v i e w 12 13
 at the end of 08 to 170m dwt (113m gt) at the end of 09. Their market share also dropped to 35.")
16 market in 09 South korea ELLENSBORG Multipurpose vessel, 12,840 dwt, delivered in 09 by Chinese shipyard Taizhou Sanfu to Dannebrog, operated by Nordana line A/S The orderbook of the South Korean shipyards retreated for the first time in many years, dropping from 0m dwt (134m gt) at the end of 08 to 170m dwt (113m gt) at the end of 09. Their market share also dropped to 35.5% at end 09 compared to 38% at end 08. During the course of the year, South Korea was forced to cede its position as the world number one shipbuilding nation to China. However if it was overtaken in terms of orderbook, it still retains its advantage in terms of a superior output and indeed it managed an increase on its 08 figure with 43m dwt (507 ships) delivered, against 34m dwt for 08, and 35m dwt for China (albeit with 738 ships). New orders totalled only 87 vessels (12m dwt) in 09 compared to 574 units (62m dwt) in 08, and these were mainly spread between dry bulk carriers (7.5m dwt), tankers (4m dwt) and a few specialised vessels. The sales targets of the South Korean shipyards were not reached however, far from it, and some shipyards like Hyundai H.I., Hanjin H.I. did not receive a single order for the first time in history; others had to wait until the last months of the year to record their first sales. We note some interesting contracts such as the four ro-ro containerships and two ferries placed at DSME, and a massive order for a series of eight 400,000 dwt ore carriers placed by STX Pan Ocean at their shipyard STX Offshore & Shipbuilding backed by long-term contracts with Brazilian miner Vale, which also placed orders for other VLOCs at DSME and Jiangsu Rongsheng. South Korea s shipbuilders suffered their fair share of cancellations and delivery deferrals. In total, there were around 100 ships cancelled at the yards (10m dwt) in 09, the majority of which were bulkers (47) and tankers (45). The number of ships with deliveries postponed from 09 to 10 stood at 140 ships or 8m dwt. These ships consisted primarily of Capesize and containerships. It is likely that the seven major shipyards will get through this difficult period without too much difficulty, even if their individual circumstances are different. However a government report in the spring of 09 forecasting a possible reduction in the number of South Korean shipyards to five, cast a certain chill over the shipbuilding community. The future of some small and medium-sized yards remains more uncertain still. Besides the many difficulties already mentioned, the shipyards were confronted by new problems. Deprived of cash from new orders, some shipbuilders such as HHI, DSME and SHI were forced to raise funds on the bond market. Not all yards have had this ability, however, and some have had to consent to lower prices in order to win the few orders available and secure fresh funds. Overall, South Korean ship construction and maritime transport received tremendous support from the state authorities and banks were invited to provide any assistance possible. To cope with these difficulties, the South Korea yards have decided to streamline their production facilities and diversify. There is growing speculation that Hanjin will relocate part of its production to the Philippines and retain its South Korean sites only for the construction of specialised ships, and that Hyundai H.I. meanwhile will mothball some berths and reorient its production towards other industrial activities.

17 STOLT SISTO Chemical tanker, delivered in 10 by the South Korean shipbuilder SLS, the first in a series of four 44,000 dwt coated chemical carriers ordered by Stolt-Nielsen China China continued its vertiginous ascent, becoming the number one shipbuilding nation during 09 by gross tonnage. As a result of the economic crisis, its orderbook retracted somewhat from 230m dwt (126m gt) at the end of 08 to 8m dwt (1m gt) at the end of 09, although its market share grew from 33% to 37%. Deliveries also accelerated to reach 738 ships (35m dwt) in 09 compared to 664 ships (m dwt) in 08. Dry bulk carriers were the largest component (254 ships) followed by tankers (235) and containerships (87). China also distinguished itself last year by winning the largest number of contracts at close to 0 ships (21m dwt), against 876 contracts (58m dwt) in 08. These orders were principally spread between dry bulk carriers (13m dwt) and tankers (7.5m dwt). The Chinese shipbuilders benefited from Chinese growth, the availability of extremely generous bank loans (Chinese banks lent three times the amount of funds in the first half of 09 as they did in the whole of 08), the structuring of funds in order to place massive bloc orders (Grand China at Jinhaiwan) and also the weakness of the Yuan which has not appreciated at all since the summer of 08. Of course, the Chinese shipbuilding industry has also experienced its share of challenges. In total, cancellations reached close to 160 ships (7m dwt) in 09, the majority of which were dry bulk carriers (4.7m dwt) and tankers (1.6m dwt). No less than 435 ships (16m dwt) were deferred from their 09 deliveries into 10. This represents 14% of the Chinese orderbook and it should be feared there will be a domino effect on 11. Very few bankruptcies or failures were reported among the Chinese shipyards in 09, perhaps a consequence of many yards being state-owned, directly or indirectly. The private Japanese shipyard Tsuji H.I. operating on Chinese soil, having declared bankruptcy in 08, returned and continued to build and deliver ships. Nevertheless many of its contracts were cancelled. Certain shipyards like Zhejiang Jin Mao, a late arrival on the international scene, were caught up in the crisis and did not have the time to realise their ambitions. It is likely that this shipyard will never be built. In the meantime, all of its orders have been cancelled. Japan The orderbook of the Japanese shipbuilders contracted for the second year and passed from 122m dwt (74m gt) to 94m dwt (56m gt) at the end of 09. The market share of the Japanese shipyards stabilised around 17% at end 09, compared to 17.5% at end 08. Only around ten new orders were officially recorded in 09, principally Capesizes, while new orders represented 525 ships (32.7m dwt) in 08. Regardless, Japan s shipbuilders delivered as many ships as in 08 (474 ships of 30m dwt). Some 30 ships (1m dwt) were cancelled, principally Handysize bulk carriers and some LPG carriers. Around 50 ships (3m dwt) were postponed from 09 to 10. Japanese shipbuilders adopted a very prudent approach during the boom years of and they were careful not to embark on a major expansion of their production, in contrast to their Chinese and South Korean counterparts. The Japanese shipyards operating today have also experienced several economic cycles already and have demonstrated their resilience. In 09, unlike their Chinese and South Korean competitors who benefited from the weakness in their currencies against the dollar, the Japanese yards experienced a formidable appreciation in the Yen to around 90 Yen/US$, close to the zenith reached in A couple of Japanese owners even decided to order ships at a South Korean yard. However Japanese shipbuilders are determined to survive by improving and adjusting their production which, they acknowledge, cannot grow indefinitely. Moreover they have strongly criticised their competitors in China and South Korea for pursuing expansionist policies based on subsidised newbuilding orders. 10 A n n u a l R e v i e w 14 15
18 market in 09 europe JAPANESE SHIPBUILDERS ADOPTED A VERY PRUDENT APPROACH DURING THE BOOM YEARS OF European shipbuilders are facing attack from Asian shipbuilders on their last remaining stronghold, specialized vessels, ro-ros and ferries The orderbook for European shipbuilders shrank this year from.3m gt (18.8m dwt) to 16.2m gt (15.1m dwt), broken down into 8.9m gt for the west European shipbuilders (15 countries) against 10.5m gt at the end of 08, and 7.3m gt for the eastern European shipbuilders (11 countries) against 9.8m gt the previous year. New orders fell significantly compared to the previous year and represented only 0.3 m dwt (0.3m gt or 30 ships) against 5.4 million dwt (4.2m gt or 350 ships) in 08. They consisted mainly of orders for the offshore industry where there were around 15 new contracts. Shipyard output also slowed from 6m dwt (6.1m gt) in 08 to 4m dwt (4.4m gt) in 09. European shipyards have also been shaken by a wave of cancellations, particularly during the first six months of the year. No less than 100 cancellations were reported. The areas most affected were the containership segment which accounted for half of the cancellations, and the german shipyard sector which accounted for two-thirds. The german shipbuilding industry, propped up by their national shipowners and financed by KG funds, will have to restructure once again. Some shipyards have gone bankrupt. The TKMS group, which operates the yards Nordseewerke, HDW and Blohm+Voss, has decided to separate its commercial activities from its military production; it has sold its site in Emden to a manufacturer of wind turbines gt EUROPEAN SHIPBUILDERS' ORDERBOOKS (SIAG) and created a joint venture in Abu Dhabi. JJ Sietas has been forced to downsize. It has become extraordinarily difficult to build merchant ships in Europe at competitive prices and it seems that the AP Moller group has come to the same conclusion in announcing the planned closure in 12 of its flagship shipyard in Odense, which once built the largest containerships in the world and even profited from the recent boom by taking in orders for 180,000 dwt bulk carriers. After the intervention of the European Union and the closure of shipyards in Gdynia and Szczecin in 08, the polish shipbuilding industry is now reduced to Gdansk and Remontowa. The latter has succeeded in shifting production towards high added value vessels such as ferries and offshore vessels. The situation in Gdansk is more uncertain given its very short orderbook. The privatisation process of the six Croatian shipyards launched during 09 has been a failure. One cannot imagine worse timing in the context of the financial, economic and shipbuilding crises. Croatia will certainly prolong the process and renegotiate some elements with the European Union. In some ways, the intervention of the European Union in Poland has been disastrous for its builders and the crisis has probably served to save, at least for some time, the Croatian shipyards. (based on firm orders) Order book end 08 Order book end Germany Romania Turkey Italy Croatia Denmark Netherlands Ukraine Norway Poland Spain Finland Russia France

19 ASTRID LPG carrier, 4,230 cbm, ordered from Japanese shipyard Kanrei Naruto by Geogas, to be delivered in 10 Perhaps it is finally time to reflect on the support given to the european shipbuilding industry in the face of competition from the asian bloc which also has received formidable support. Turkish shipbuilding has been a victim of the credit crisis; but also of its all too rapid expansion in the years 03 to 08 and of speculative ordering activity, principally of small product tankers, which are no longer able to find takers in the current saturated market, except at bargain-basement prices. The shipyards in the bay of Tuzla, which buzzed with activity in 03-08, have greatly reduced their workforce, from some tens of thousands of workers to just a few thousand. This significant and rapid adjustment in capacity has certainly helped to avoid complete closures and bankruptcies. But how long can they hold out? Although they are almost entirely oriented towards the offshore industry, norwegian shipbuilders have also suffered from a lack of orders, and some have gone bankrupt. The shipyard STX- Floroe is expected to exit newbuilding activity and turn its activities towards ship repair. The european shipbuilding industry has suffered once again from an excessively strong euro. The industry is confronted by a new crisis and is now facing attack by Asian shipbuilders in its last remaining stronghold, specialized vessels, and in particular ferries and cruise ships. Many yards will deliver their last ships in 10. Their only hope now lies in the need to renew specialised vessels which have become less expensive, in the economic recovery and, perhaps, in a weaker euro. rest of the world One observes equally a contraction in the orderbooks in the shipyards of the rest of the world, where the portfolio dropped from 36.1m dwt (21.9m gt) to 31.8m dwt (19.3m gt) in 09. New orders fell significantly compared to the previous year and represented only 0.8m dwt (0.4m gt or 15 ships) against 10,2m dwt (4.8m gt or 285 ships) in 08 and 17,2m dwt (12.3m gt or 860 ships) in 07. The output of the shipyards remained stable at 2.5m dwt (1.8m gt) in 09, the same volume as the previous year. The individual situations of the yards remain very diverse. Countries where ship construction is a recent industry, like India or Vietnam, could experience many cancellations given the significant delays in the execution of orders, which perhaps were also too numerous. The Philippines maintained its position with an orderbook reaching 12m dwt (6.7m gt) in 09 against 12.9m dwt (7.2m gt) at the end of 08. The Brazilian shipyards, supported by their national shipowners, saw a resurgence in activity. They received for example orders for Aframaxes from Petrobras and Atlantico do Sul. They were able to benefit not only from the proliferation of projects in the offshore industry, but also from the eagerness of the state authorities to exploit their tremendous natural mineral resources. The South Korean shipbuilder STX today owns two shipyards there. gt REST OF THE WORLD SHIPBUILDERS' ORDER BOOKS (based on firm orders) Order book end 08 Order book end 09 Philippines Taiwan Vietnam India Brazil United States 10 A n n u a l R e v i e w 16 17
 from Brodosplit Shipyard for delivery Spring 11 Outlook We note many similarities with the shipping crisis in the 1970s: A tremendous")
20 market in 09 PIANA Ro-Pax, 0 cabins, 750 passengers, 2,500 lane meters for trailers, 1,182 lane meters for cars, 23.9 knots, ordered by Compagnie Meridionale de Navigation (CMN) from Brodosplit Shipyard for delivery Spring 11 Outlook We note many similarities with the shipping crisis in the 1970s: A tremendous expansion in shipbuilding capacity at that time, led by the Japanese yards A raw material price shock at that time, relating to oil The construction of very large ships such as giant containerships and VLOCs - at that time, ULCCs The operation of containerships at slow speed in the 70s, of tankers The lay-up of many containerships and the use of tankers for storage - at that time, tankers were both in lay-up and being used for storage A drop in newbuilding orders for the shipyards An increase in cancellations A proliferation of bankruptcies among shipowners and shipyards The emergence of aid plans and subsidies for owners and shipyards An adjustment between supply and demand will ultimately be achieved through, on the one hand, an inevitable reduction in newbuilding capacity (mothballed building berths, the closure of less competitive sites, the reorientation of production towards other industrial activities such as repair, demolition and land construction), and on the other, an expected increase in demand, driven by lower prices and the search for new products that better meet the needs of the new economic climate. m. gt 1 NEW ORDERS AND CANCELLATIONS: JAPAN VS WORLD The forecasted return of economic growth (around 4%) in 10 is a prerequisite for an end to the shipping crisis, but first any such economic recovery must be confirmed. There remain many uncertainties, linked in particular to the nature of the rescue plans and the increase in government debt. The large surplus of ships ordered in the recent boom years must also be absorbed for the freight market to rebound: newbuilding deferrals, multiple cancellations, a reduced number of orders and continued demolition (1,250 ships, or 36m dwt, in 09) should contribute to this Japan: new orders Japan: cancellations World: new orders World: cancellations * *projected

21 Cancellations in 10 The weakness in freight rates, particularly in the containership and petroleum product sectors, will continue to impact certain shipowners and make it difficult to finance speculative orders placed at high prices out of line with potential revenues. Without funding, some owners will be unable to pay their instalments to the yards and take delivery of their orders. By putting themselves in default, they may be forced into bankruptcy and jeopardise the position of the shipyards where they are customers. As for those shipbuilders who have taken on too many orders and are already experiencing delays or problems of quality, they run the risk that clients will naturally cancel construction contracts (by invoking cancellation clauses). Furthermore, it is possible that many decisions have been postponed from 09 in the hopes of a possible or impossible natural resolution later. Thus we believe that cancellations will continue in 10 at a similarly brisk pace as in 09, and total cancellations during the year could reach between m and 40m dwt. TABOR Supramax bulk carrier, dwt, latest generation vessel in the SETAF-SAGET (BOURBON) fleet Copyright BOURBON 10/Photographer: Wilfried Daffond New orders in 10 Lower newbuilding prices should encourage the resumption of orders, even if funding difficulties persist, and the pace seen in the second half of 09 should at least continue through 10. Those specialised shipowners who have been unable to attract interest for their projects from shipbuilders in recent years, or who opted to defer their orders due to high prices, will now be able to return to the market. Some of the more conservative shipowners, who abstained from investing as shipbuilding prices became crazy, should also be drawn back into the market. Meanwhile the industrial operators who require low and stable prices, and who were forced to pay sky-high freight rates in recent years, will either invest or encourage investment by third parties in order to guard against future increases. Those shipowners who have placed orders at peak price levels will seek to reduce the average cost of their investments by adding some additional orders. Furthermore some segments should generate renewed interest: for example in the Handysize sector where 40% of the fleet is over 25 years compared to 36% on order, or in the Panamax sector with 35% of the fleet on order. This could also apply to the intermediate-size containership segment where only 10% of the fleet is on order. Some speculative orders should also be seen: the years 03 to 08 demonstrated that ship values can rise significantly, and some investors could launch themselves into the new order. Finally, there are several investors who are positioning themselves to take advantage of the current favourable market conditions and increase their market share. The need to invest in new designs that are more efficient, or simply better suited to the new economic realities, should also lead to more contracts being placed and overall we estimate new orders could reach some 50m to 70m dwt in 10. This will not be sufficient to satisfy the appetites of the shipyards, which will in turn exacerbate competition in the shipbuilding industry, at a time when shipbuilders need to replenish their orderbooks. 10 A n n u a l R e v i e w 18 19

22 market in 09 STAVFJORD Product tanker, 16,630 dwt, delivered in 09 by the Chinese shipyard Jiangnan Qiuxin to O.H. Meling Newbuilding prices in 10 WE SHOULD EXPECT A CONTINUED DECLINE IN NEWBUILDING PRICES IN 10. Standard vessels have also become more expensive to build in recent years with the accumulation of technical regulations We should expect a continued decline in newbuilding prices in 10 given the ongoing difficulties in securing financing, the continued weakness in freight rates, the number of scheduled deliveries, the downward price-pressure from prospective buyers, and the increase in competition not only between shipyards, but also from the second hand or re-sale markets, where desperate sales are likely to take place. The shipbuilders marketing campaigns will resume in 10 and competition between the yards will intensify. Let us not forget that the worldwide shipbuilding capacity has risen from 50m dwt in 02 to around 0m dwt in 10, and the expected volume of orders in 10 will be well below this nominal capacity. The question is just how far newbuilding prices are likely to fall. In the last twenty years, the last trough took place in 02. This coincided with the end of a five-year downward cycle occurring in the aftermath of the Asian financial crisis and the rise of Chinese shipbuilding. Back then, for example, a 55,000 dwt Supramax bulker could be negotiated at around US$18m and even then there were very few orders placed at that price, at least compared to the volumes achieved in the boom years of 03 to 08. Faced with such price levels, the South Korean shipyards renounced further construction of this size and type of ship, and were not to return until 06. By the end of 09, a 57,000 dwt Supramax was being negotiated at around US$28m in China. One might think there is further room for more price declines. However, it is important to remember that: The price of raw materials is expected to rise again along with the economic recovery. The cost of a barrel of oil has doubled since February 09 to US$80. Any positive news regarding the end of the crisis has had, and continues to have, a significant impact on commodity prices. Global demand was weaker before 02, and raw materials were probably less prone to speculation at that time. China s arrival as a shipbuilding nation in the late 1990s and early 00s weighed heavily on prices in the past, due to the country s reservoir of cheap labour and a weak currency (1 US$ = 8.28 Yuan between 1994 and 05 against 1US$ = 6.83 Yuan today). This era is now gone. Standard vessels have also become more expensive to build in recent years with the accumulation of technical regulations (CSR, PSPC, treatment of ballast water, treatment of SOx, NOx, CO 2 emissions, microparticles, etc ) which require ever more steel, care, engineering and hours of work, but also with an increase in the average size of vessels within the same class (in 10, for
23 example, a Supramax has a deadweight capacity of 58,000 dwt to 60,000 dwt), and increased performance requirements for onboard equipment (today s Supramaxes come equipped with 30-35t cranes instead of 25-30t). As a result, we believe that if construction prices should fall further, they will only fall by around 10% to 15% in 10, which will bring us to a new low in this cycle, albeit % to 40% higher than the previous minimum seen in 02. Overall, we expect the landscape of the shipbuilding industry to mutate under these pressures. Shipowners will become more selective, placing orders at those shipyards that have proved to be the most enduring. Medium-term outlook In 09 close to 114m dwt of new tonnage, against 91m dwt in 08, entered service, at a time of particularly adverse economic and trading conditions. This represents an increase in output of approximately 25% compared to 08. Deliveries grew by just 5% to 15% in the preceding years. This 114m dwt must be compared with forecasts made at the end of 08 for an anticipated 170m dwt of deliveries in 09. In the event, about 22m dwt was cancelled, 36m dwt deferred from 09 to 10, while the remainder related to newly discovered contracts (assessing the precise number of new orders in Japan and China remains very difficult). In 10, close to 227m dwt of new tonnage is expected to enter service, again excluding cancellations, delays or deferrals which should significantly cut this amount. Therefore the total amount delivered could probably end up at closer to 1m 130m dwt. It is difficult under these conditions to be very optimistic. We have the feeling that many players, either on the shipyards or on the owners side, are in apnea. How long can they hold on? Measures such as putting to anchor or going into lay-up are likely to continue. Already around 3,800 vessels are today classified as inactive. Fortunately in 09 the volume of demolition (36m dwt) increased substantially, equivalent to around 110% of new orders. Let us remember that between 03 and 08, scrapping has been particularly low, at around 10% of new orders, against more than 70% between 1997 and 02. This trend should continue, and we believe that 30m to 50m dwt could be sent to the scrapyards in 10. NEW ORDERS VS DEMOLITION SINCE 00 m. dwt Demolition New orders 3% (orders/demo %) 43% 74% 70% 26% 13% 9% 6% 10% 108% 67%* * * projected 10 A n n u a l R e v i e w 21
24 he Dragon T

25 DESPITE THE WORST FEARS OF THE MARKET, THE BALTIC DRY INDEX REBOUNDED TO AN IMPRESSIVE 4,650 POINTS IN 09, FUELLED BY LOW COMMODITY PRICES, DEFERRED NEWBUILDINGS, A BACK-LOADED ORDERBOOK AND, OF COURSE, CHINESE DEMAND. The year started with few signs of optimism. One-year Capesize time charter rates had fallen to $,000/day, while short-term Panamax and Supramax rates were languishing at $7,500 and $7,000. roars 10 A n n u a l R e v i e w 22 23
26 Le marché De La construction navale en 08 market in 09 By January an estimated 1 Capes were in soft lay-up, as owners refused to take part in a market offering rates below daily operating expenses. Industrial production was at a low. In January, global steel production totalled 86m tonnes, a 25% decline year-on-year. Steel production, upon which half the dry bulk market depends, had returned to pre-05 levels. Producers and users scaled back stocks, fearful of a further deterioration in economic conditions. DRY BULK SHORT T/C RATES SINCE 08 DESPITE THE FEARS OF THE MARKET, THE BDI REBOUNDED TO AN IMPRESSIVE 4,650 POINTS IN 09. US$/day Capesize Cont/Med trip Far East (C9 03) Panamax Transatlantic round-voyage (P1A 03) Supramax Japan-SK trip via Australia-India (S6) On the supply side, the looming wave of newbuildings had yet to materialise 0 01/08 04/08 07/08 10/08 01/09 04/09 07/09 10/09 While China had announced a massive stimulus package in November, pledging to spend Yuan 4trn ($585bn) over the next two years, the impact had yet to be felt in the market. Chinese steel mills were still producing at reduced levels. Meanwhile a small market spike in February and March was quickly wiped out as ships in semi lay-up returned to the market, underlining the fragile balance in the market. With few industrial groups producing at normal levels, commodity prices slumped. By April, a fouryear bull run in the commodity market was at an end and prices had fallen to their lowest levels since 05. This brought Chinese buyers back to the market, in a big way. dwt BULK FLEET AND ORDERBOOK % 1,664 January 10 No. of ships Percent of fleet on order in dwt 49% 1,858 54% existing fleet on order 2,188 38% Capesize Panamax & Overpanamax Supramax Handysize dwt dwt dwt dwt

27 ABIGAIL N VLOC, 297,400 dwt, delivered in 09 by the Japanese yard Universal, operated by Neu Seeschiffahrt A growing commodity purchase programme began, with industrial groups keen to stockpile resources while prices were low and transfer sovereign investments away from threatened dollar-denominated assets. In April, China boosted its iron ore purchases to a record 57m tonnes, while copper and crude oil purchases also soared. Meanwhile, on the supply side, the looming wave of newbuildings had yet to materialise. Although the Capesize orderbook schedule for 09 was heavy (22.9m dwt ultimately delivered), deliveries were skewed towards the second half of the year. Between January and June, just 7.5m deadweight of Capesize tonnage was delivered by the yards. A combination of shipowner cancellations and deferrals, plus voluntary delays by overloaded shipyards, also pushed many ships off the original 09 schedule. Scrapping activity, too, had re-emerged at the end of 08 and in first half of 09 nearly 2.3m deadweight of Cape tonnage was removed, to add to 2.9m deadweight of Panamax tonnage, 1.6m of Supramax and 4.8m Handysize. Meanwhile tanker to bulker conversion projects, which had dominated the headlines in 08 and promised to further boost tonnage supply, found themselves in limbo as owners parked pre-op ships outside the conversion yard. The combination of Chinese commodity buying and restricted supply soon had an effect on shipping rates. Between May and July, the Capesize four time charter average ticked up from $22,100/day to a high of $93,0. In addition, China s stimulus plan began to take effect. The high infrastructure component of the stimulus plan called for steel, and plenty of it. By June, confidence had come back in the market and the steel mills had ramped up production. The so-called cash for clunkers programme in the US, and similar car subsidy programmes in other countries, kickstarted activity in the automobile industry, and by July steel mills had started to re-open furnaces. The surge in trade was felt in the ports, and congestion again played an important role during the year. Capacity limitations in the main commodity terminals led to long queues when volumes were high, immobilising parts of the fleet. The impact of congestion on rates was often rapid, contributing to the high rate volatility during the year. Structural changes were also underway in the market. Brazilian efforts to cultivate new relationships with Chinese importers were bearing fruit, assisted by lower freight rates, which narrowed the competitive difference with Australia. While all ore exporters increased their volumes to China during 09, Vale increased its volumes the most (55% year-on-year, compared to 45% for Australia), generating more tonne-miles for the Cape sector. The slump in vessel values also saw Vale make a push into shipowning in a bid to take greater control of its freight and eliminate Australia s advantage. Vale bought close to second hand bulkers and arranged a series of two-year contracts of affreightment, before placing a huge series of newbuilding contracts; by end 09 the world s largest mining group had 28 VLOCs on order worth $3.3bn. The second hand vessels and coas will bridge the gap until the newbuildings arrive. (million tonnes) CHINA IRON ORE IMPORTS A n n u a l R e v i e w 24 25
, and the majority of newbuilding orders, both by number and deadweight.")
28 market in 09 PIERRE LD Capesize bulk carrier, 171,870 dwt, delivered in 05 by the South Korean yard Daewoo, operated by Louis Dreyfus Armateurs Chinese shipowners also made a drive into ownership, picking up both the majority of second hand purchases during the year (see second hand article), and the majority of newbuilding orders, both by number and deadweight. Overall, close to 50% of the 66 Capes of 17.5m deadweight, 45 Panamaxes 3.5m, 42 Supras of 2.5m and 34 Handies of 1.2m ordered in 09 were contracted by Chinese owners. On the demand side, the growth of the coal trade into south east Asia represented another key development during the year. A spike in Indian imports of steam coal - initially from SE Asia but later on from longhaul origins such as South Africa - provided crucial new cargoes. China also began importing coal from South Africa, and at the end of the year the market witnessed coal exports from Colombia to Asia, a truly long haul route. This was a welcome development for owners who had seen long distance imports into Europe eroded by the increase in cheap Russian coal. Again the emerging markets had stepped in to provide demand. Indeed China s gdp growth of 8.7% for the year accounted for half the world s economic growth during 09. October saw another big run-up in the market as European steel production began to return to normal. In both October and November, European Union steel production topped 14m tonnes per month, returning output to around 80% of 08 production levels. Once again the Capesize time charter average reached $88,000/day. NEW ORDERS FOR BULK CARRIERS SINCE 03 dwt Handysize Supramax Panamax Capesize By year-end, Capesize rates had flattened out to around $40,000/day, and owners headed into the new year with cautious optimism. Over the year as a whole, the 4TC and 6TC averaged out at $42,656/day for the Capesizes, $19,295/ day for Panamax, $17,338/day for Supramax and $11,342/ day for Handysizes, significantly higher than could have been expected at the start of the year. However, with 280m deadweight of bulk tonnage still on order, there is still considerable uncertainty going forward and it is likely to be another volatile year.
29 the Panamax market Along with the other dry bulk sectors, the Panamax market began 09 in the doldrums, suffering a hangover after the severe downturn at the end of 08 and showing returns on voyages way below operating costs. However, the fortunes for Panamax vessels improved dramatically through the year and in the relative post boom times this could be viewed in retrospect as a decent year in terms of rate levels, with a time charter average of around $19,300 per day. A significant increase in Chinese coal imports, coinciding with signs that the western crisis may be bottoming out, added strength to what originally looked like a very distressed market. Along with scrapping and deferred deliveries of newbuildings (plus a number of cancellations), these effects helped the Panamax market regain strength, confidence and liquidity. The very cold weather experienced throughout the northern hemisphere also played its part towards the close of 09, with increased congestion especially in northern Chinese ports adding to the tightening in supply. The spread of market rates through 09 was remarkable considering the stark and desperate situation the market faced in the second half of 08. The BPI ranged from a low of 492 points and a high of 4,453 points, while the average of the four time charters spanned a low of $3,971 per day in January and a high of $35,819 per day in November (900% higher). The grain market, as always, proved to be a swing factor when tonnage supply was tight. This range facilitated a platform for pure freight trading. Traders took time charters for longer durations at relatively low levels versus the spot market, and flipped the tonnage out immediately for short period or one-year time charter, hence significantly writing down the time charter level for the later years of the charter. The fact that the FFA market is a lot more regulated and cleared also helped traders lock in costs securely. Towards the end of the year, even with a regular supply of new vessels from the shipyards in the Pacific, the market remained steady. The Panamax market still faces a considerable forward orderbook but the sector is not as over-ordered as other sectors, suggesting 10 will be another interesting year. the Supramax/Handysize market As with the other bulk segments, the Handysize and Supramax markets finished the year with sustained activity in all basins. Yet the year had begun under dark skies, with rates at $4,000 per day for both the Supramaxes and the Handysizes, and with a near absence of any industrial bulk cargoes. Only the agricultural bulk cargoes/commodities offered any support. Initially, there was a small tremor at the end of February, notably on the Europe to Med trade, due to increased scrap exports driven by the demolition incentives in the automobile industry. However, at the end of the first quarter, the need for restocking coupled with various stimulus plans in Europe, the US and particularly China, created a real momentum for recovery. There also emerged some specific demands for sugar from Brazil to India, and soyabeans from Brazil to Asia. Thereafter, rates from the Atlantic to the Pacific rose to decent levels, culminating at more than $37,000/tonne in the autumn. Another constant during the year was the rate imbalance between the Pacific and the Atlantic zones, with returns on the Atlantic showing a premium of $5,000 - $6,000 a day over the Pacific. The uncertainty which prevailed through the year and the nervousness created by the excessive orderbook contributed to the feeble time charter market. Again, only at the end of the year did we see a resurgence in activity and a strong increase in prices, such that the market went from $9,000 - $10,000/day for a one-year Supramax charter in February, to close to $24,000 - $25,000 per day in December. For the Handysizes, rates went from $7,000-8,000/day to $16,000 - $17,000/ day. We even saw the long-term period market regain some colour, with Supramaxes being taken for three years at $16,000- $17,000/day, and Handysizes at $13,000 - $14,000/day. 09, which for many should have been the year of living dangerously, also saw strong cargo demand (for coal, ore, grain...) driven mainly by China. Combined with newbuilding deliveries that were ultimately lighter than expected (159 Supramax delivered in 09, against 341 expected at the start of the year), this demand created tension zones, particularly in India, Australia, Indonesia, Brazil and the Gulf of Mexico. It also increased the port congestion which was becoming endemic in many of these regions. However some issues are still unresolved: the orderbook remains at record levels, while the budget deficits of some countries could cut into their potential recoveries. Meanwhile China is trying to tame its overheated economy, and there are fears that the global recovery may not be real. 10 A n n u a l R e v i e w 26 27
30 market in 09 And yet the volumes are there, financing is scarce (thus raising doubts about the feasibility of parts of the orderbook), and discussions are underway to delay or cancel orders in the interests of all parties. Thus, it remains very difficult to form an outline for 10 even if some, encouraged by the market at the end of 09, are arguing that this trend is set to continue. the dry FFa market In short, 09 was a year of great uncertainty and changing horizons. From very bleak beginnings after the serious crash of autumn 08, the year progressed through a series of gloomy periods with low volumes of trade, sudden upswings and retrenchments, to a final quarter which indicated new confidence and enthusiasm. Volume in the fourth quarter was a modest 14% higher than it had been in the first quarter, but values recovered amid a brighter atmosphere, reflecting the feeling in other markets that the world was starting to emerge from recession and all was not as bad as it had been. Unsurprisingly, the volume of Dry FFA trades in 09 was rather lower than the record year of 08. In fact the total was around half overall. More extremely, following the onset of the global financial crisis in September of 08, trade plummeted from over 80,000 lots per week to less than 15,000 lots in the space of 6 weeks. The average in 09 was just over 23,000 lots per week (compared with a weekly average of nearly 42,000 in 08). There were three significant spikes in activity during the course of the year: in early February (45,000 lots/week), early June (48,000 lots/week) and the second half of November (46,000 lots/week). Each one corresponded to an upturn in the spot freight market, as the need to hedge and willingness to speculate were stimulated by sharp movements in the underlying market. The spikes show how quickly the FFA market responds to volatility in the underlying physical freight market: derivatives markets everywhere have aroused suspicion and hostility due to the chaos created in global financial markets by the largely unregulated credit swaps market and its connection with subprime lending, but it would be wrong to point the finger too sternly at FFAs when looking for clues as to why the spot freight market shows such sudden swings. While there is some evidence that movements in FFA prices have the ability to influence the physical spot market, equally there is no doubt that volatility in the physical ultimately determines the volume of trade in FFAs. WEEKLY FFA TRADE VOLUMES IN Handysize Supramax Panamax Capesize Baltic Dry Index Lots traded per week Weeks 1-52
31 10 T/C FFA CONTRACT: EVOLUTION DURING 09 $/day Capesize Cal Panamax Cal Supramax Cal Handysize Cal The volume of trade tells only part of the story: the value of the market was also considerably less than it had been. In 08 the value of the dry FFA market was estimated at around $ bn, while for 09 it was nearer $35-40bn only a quarter of last year s worth. That should come as no surprise given the erosion of the underlying freight market value. And with spot freight rates having come off 90% from their 08 peak in the wake of the crash, it is an indication of good resilience in the FFA market that the value recovered to the level it did /09 02/09 03/09 04/09 05/09 06/09 07/09 08/09 09/09 10/09 11/09 12/09 The loss of value is of course partly due to the lower levels of the freight market in general, but the lower volume can be attributed entirely to the loss of the unsecured over-the-counter portion of the market, which was such a large part of the casino-style picture in previous years, and has now dried up completely: the market is now a very sober 95% cleared, or more. Looking forward, 10 is as hard to read as 09 was at the beginning. And 09 ended by providing positive surprises. Capesize At the end of 08, we thought there was still room for prices to fall for Capesizes, and we were right for a month. The cost of a second hand Capesize continued to weaken at the start of 09, and a market low was reached at the end of January. After that, values showed a certain volatility in response to fluctuations in the freight rates, but never fell back to the levels seen at the start of the year. The extremely proactive government policies implemented during the year facilitated the resumption of strong economic growth in certain markets (primarily China), producing a much greater impact than first expected. Furthermore, analysis of the fleet and particularly the orderbook were often inaccurate and even incorrect (we highlight the particular difficulty of measuring order deferrals, cancellations and re-negotiations), and ultimately the available tonnage in 09 was less than initially feared. Together these factors led to a recovery in freight rates, and first a stabilisation in second hand asset prices, and later their increase. Looking at the values of a typical 5 year old 172,000 dwt Capesize assessed weekly by the panel of Baltic Exchange Brokers (BSPA), we can see the price consensus of the market: 22 December 08 $45.55m 26 January 09 $44.23m 9 March $49.66m 14 September $57.19m 19 October $51.66m 21 December 09 $53.01m The difference between the peak and the trough is some 29%. Meanwhile we recall that at the height of the market in the summer of 08, the BSPA panel estimated the price at nearly $154m. Overall in 09, we noted more than 70 second hand sales or newbuilding re-sales. This compares to around 50 transactions in 08. Not surprisingly, Chinese buyers were by far the most active, followed by Brazilian ore producers looking to take greater control of their transportation chain. Publicly-listed companies were also active, as part of their expansion programmes. The key to the market of course resides in the balance between the future available tonnage and the demand for transport. Despite the risk of an overheated economy due to heavy state support, China will remain at the heart of both the world economy and the Capesize market in A n n u a l R e v i e w 28 29
32 market in 09 Panamax, Supramax, Handysize In last year s report we concluded by saying that two ingredients were needed in order to avoid a protracted shipping crisis: decreased tonnage supply and a recovery of the world economies. The major world economies received massive stimuli packages and this kept the world trade clock ticking along (including annual growth in China of 8-9%). At the same time, on the supply front, the lack of financing for shipyards and owners resulted in the cancellation or postponement of a significant number of newbuilding deliveries. Yards with no experience ran into excessive delays, thus enabling owners to cancel contracts without losses. Demolition also picked up significantly. Thus with China importing more raw materials, the year was much better than everyone feared and slowly but surely we recorded an increase in second hand and newbuilding re-sale market activity. Buyers who were cash-rich and willing to invest in modern tonnage in the early days of 09 were well rewarded, both in terms of chartering income and increases in asset values. Many expected distressed or forced sales, and the shipping world was flooded with numerous announcements of special shipping funds seeking to invest in distressed sales very few took place. One Greek-controlled company can truly claim they purchased a whole fleet in a distressed situation, although they made no waves about it until the acquisition was completed: the $325m takeover of Allocean s diverse fleet of 26 vessels by the Libra Group controlled by the Logothetis family. Most banks decided to be patient (what else could they do?) and agreed to restructure loans and other terms in loan agreements by way of various waivers with their clients, giving much needed time to owners who found themselves caught in the storm. But these agreements have an expiry date, usually within 12 months from the original signing i.e. in 10 Will these banks continue to be patient? Can they afford to be? During the year, financing was extremely difficult to come by or non-existent, and many will have a tough 10 with highpriced newbuildings being delivered into a market where the original time charter employment has been renegotiated downwards, cancelled altogether, or where the time charter rate simply cannot support the vessel s contracted price. A point worth noting is that 09 saw the Chinese becoming the number one buyers of second hand dry bulk tonnage, overtaking for the first time the Greeks who have traditionally dominated this game. Of a total 600 or so second hand dry bulk carrier sales, the Chinese picked up almost 30% (180 units), while Greek buyers were behind % of the transactions (1 vessels). 09 will also go down as the year demolition (or ship recycling, to use the more politically correct term), came back to life! This was both in terms of volume and pricing. The number of dry bulk vessels that headed for the beach was approximately 3 units (+230% compared to the whole of 08) or about 13m tonnes dwt (185% compared to 08) with the majority coming from the ranks of the Handy sector. Prices firmed despite such an impressive tonnage supply and substantial increases were recorded in all markets, which at year-end read as follows: India at $330/ldt (+43% from $230/ldt), Bangladesh at $3/ldt (+38% from $240/ldt), Pakistan at $310/ldt (+29% from $240/ldt) and China at $315/ldt (+43% from $2/ldt). Looking at end 09 values and comparing them with end 08 figures we can note: Panamax-Kamsarmax (68,000-82,000 dwt): by the end of the year, a 10 year old Panamax bulk carrier was worth approximately $27m, representing an impressive increase of 50% in value over 12 months. Similarly a 5 year old was worth $34.5m indicating a y-o-y rise of about 19%. On the re-sale front, with a fairly prompt delivery of 3-6 months based on NSF-93 contract and /80% payment terms, prices rose by about 10% to $41m. Supramax-Handymax (42,500-58,500 dwt): at the end of the year, the price of a 10 year old Handymax bulk carrier (47,000 dwt) reached $ m, showing a 22% climb from last year. Following a more moderate trend, a 5 year old Supramax (52,000 dwt) increased by about 8% over the year to reach $27m. Re-sale prices declined by about 4.5% over the year to $32m. Handysize (23,000-30,000 dwt): a 10 year old Handysize bulk carrier was worth about $17.5m at the end of 09, a slight rise of 9.5% over 12 months. During the same period, the value of a 5 year old ship improved by 7% to about $22.5m. Values of re-sale contracts showed little movement and remained fairly stable at $24.5m, a marginal increase of about 2%.

33 The abundance of newbuilding re-sale opportunities that were offered in 09 is expected to continue in 10. Buyers are of course tempted by the low prices but price is not the only factor to be considered. Who ordered, who supervised, who and why are they selling, and of course who is the shipyard are points of paramount importance if one does not wish to be left with a new ship full of surprises The fact that about 35% of the existing Handysize fleet is over 25 years old, plus much of the orderbook is under pressure (dominated by less experienced, or totally new, Greenfield sites, or ordered by smaller owners backed by financing that no longer exists) has not gone unnoticed by prospective buyers in 09 and we noted an increase in Handy sales (especially modern units) during 09. We expect this trend to continue in 10. Whilst one cannot foresee what will take place in the next year, in order to have a dry bulk freight environment which is at least similar to 09, more tonnage will need to be removed or not delivered. This means the true state of the orderbook (which remains unknown since many hidden deals are taking place between owners and yards) probably holds most of the answers. However one looks at the situation, it seems the coming year will be when hard decisions need to be taken. As the saying goes When the going gets tough, the tough get going E R BERGAMO Supramax, 55,780 dwt, delivered in 09 by the Vietnamese yard Hyundai Vinashin, operated by E R Schiffahrt WE NOTED MORE THAN 70 SECOND HAND SALES AND NEWBUILD RE-SALES IN 09, AGAINST APPROXIMATELY 50 THE PREVIOUS YEAR. DRY BULK CARRIER SECOND HAND PRICES millions $ Capesize tpl Paramax tpl Supramax tpl (5 year old ships) 09 saw China become the number one buyer of second hand dry bulk tonnage, overtaking Greece A n n u a l R e v i e w 30 31

34 M acte ani

35 09 WILL BE REMEMBERED AS ONE OF THE WORST EVER YEARS IN THE TANKER FREIGHT MARKET. The combination of the financial and economic slump, together with the global surplus of ships, led to a brutal fall which had a profound and sustained impact on both rates and daily returns. MONTE GRANADA Suezmax, 150,580 dwt, delivered 04 by the Japanese shipyard Universal Tsu, owned by the Ibaizabal Group of Spain, operated by CSSA mo!* *Hold tight! 10 A n n u a l R e v i e w 32 33
36 Le marché de La construction navale en 08 market in COULD THEREFORE SEE SIGNIFICANT RESTRUCTURINGS AND CONSOLIDATION AMONG TANKER OWNERS, AND EVEN SOME BANKRUPTCIES. The BITR (Baltic International Tanker Rate) general index failed to reach even 50% of the averages seen in 08 (38% for crude tankers, and 41% for product tankers). At times, daily returns on some routes fell below zero both for the VLCC and the product tankers. Long-term charters (3-5 years) were rare and often laden with assorted options and/or index linked to the spot market. As in previous crises (in the 1970s, 1980s and to a lesser degree in the 1990s and 00s), shipowners cut the speed of their ships. Only external factors (the oil and gas storage phenomenon), and the high vetting standards of the Oil Majors, enabled the market to avoid mass lay-ups. Financially, shipowners have survived the financial crisis fairly well due to the strong reserves accumulated over the previous five years and, for some, the high freight rates in the dry bulk market. But the outlook for 10 remains quite bleak, since the recovery in global consumption remains weak and the worldwide fleet continues to grow. Other factors are also contributing to an increase in operating costs (piracy, the SECA CRUDE TANKER FLEET AND ORDERBOOK END 09 m. dwt ,9 % in service on order % of fleet in service 39,1 % 26,1 % VLCC Suezmax Aframax low sulphur zone), which will only partly be recovered from charterers. 10 could therefore see significant restructurings and consolidation among tanker owners, and even some bankruptcies if banks decide to reduce their shipping exposure. Certainly, this will have little impact on the existing fleet or the immediate orderbook, but some future deliveries will be delayed while definite economies of scale will be achieved in readiness for a future recovery. VLCC The VLCC market has suffered the most from the financial and economic crisis, and the corresponding fall in energy consumption. The decline in freight rates did not occur immediately: in January and February the market remained strong with average returns in the region of $60,000 per day. Thereafter, except for a brief surge in June/early July ($33,000/day), Worldscale rates steadily declined, while the cost of bunkers simultaneously rose. This led to a collapse in daily returns, reaching a low point in September of $3,000 per day on the Middle East Gulf/Far East trade. For Middle East Gulf/ Gulf of Mexico, some shipowners accepted rates with a negative return (!) in order to re-position their ships and get back on the west/east trades (such as Caribbean/China) where returns were more favourable. In the last quarter, traditionally a period of stockpiling ahead of the winter season, freight rates gradually recovered, and daily returns stabilised at around $33,000/day. However over the year, daily returns reached an average $23,000/day, compared to $93,000/day in 08. Some thirty or so ships were used for floating storage during the year, including around twenty vessels for crude storage and around a dozen newbuildings for refined products. This was a natural consequence of market speculation over current and futures prices in the oil and product markets (the contango effect). This phenomenon enabled VLCC owners to achieve 3-6 month time charters at rates around $33,000 per day, considerably higher than the prevailing returns on the spot market.
. Here, average daily returns on route TD4 (west Africa/Gulf of Mexico) reached around $34,000/day for the year. So what is the outlook for 10?")
37 YASA SOUTHERN CROSS Suezmax, 158,470 dwt, delivered in January 10 by South Korean shipyard Samsung to Yasa Shipping We noted much better returns overall for those VLCCs trading in the west (ex-west Africa/Mediterranean). Here, average daily returns on route TD4 (west Africa/Gulf of Mexico) reached around $34,000/day for the year. So what is the outlook for 10? As of 31 December 09, the fleet in service numbered 530 ships. Some 57 new units were delivered in 09 and around 77 should be added in 10 (including some delayed units from 09). Moreover, the vast majority of the 93 single hull vessels still in service should disappear between now and the end of the 10 (the phase out ). The supply of tonnage should therefore be more stable in 10. On the demand side, statistics indicate that global demand for crude oil should return to 07 levels from the start of 10 (85.8m bbl/day), and progress to the 86.2 bbl/day (+1.3m bbl/day) during 10. Economic growth in China (+8.9%), the US (+3.5%) and even Europe (+0.4%) is now expected to be stronger than was predicted even just a few months ago. In these circumstances, it is reasonable to hope for a decent performance in the VLCC market in 10. Over the longer term, however, the addition of another 213 newbuildings between now and 13 could destabilise the segment unless we see a strong recovery in the global economy. VLCC TANKER FREIGHT RATES US$/day Average earnings MEG/Korea - TCE MEG/Continent - TCE WAF/US - TCE /08 03/08 05/08 07/08 09/08 11/08 01/09 03/09 05/09 07/09 09/09 11/09 10 A n n u a l R e v i e w 34 35

38 market in 09 Suezmax Unsurprisingly daily returns for Suezmax were much lower in 09 than in 08 when they reached around $60,000/day. It could hardly be otherwise since 45 newbuildings joined the fleet in 09, while only 13 ships were demolished or converted. Thus the fleet recorded a net growth of 5% in 09, and the average age of the fleet in service is now just nine years. Overall, Suezmax daily returns maintained an average of about $29,000/day in 09, thanks to strong activity at the start of the year, significant growth in the Worldscale (WS) base rates, and an increase in the average duration of voyages. In the first quarter, returns remained around $35,000 per day, but were gradually eroded during the second quarter, reaching a low point in July: WS42.5 for 130,000 tonnes west Africa/east coast US, equivalent to a meagre return of $5,500/day. The high point of the year was reached in March with a rate of WS96, or a daily return of $49,400/day. The structural weakness of the market has enabled charterers to limit rate increases by deferring lift dates when tonnage has been in short supply, thus controlling the market quite tightly. As in the VLCC market, rates were partly supported by the demand for floating storage, notably of diesel, which provided employment for around a dozen newbuildings after their delivery. Meanwhile around 15 charters of at least one month were concluded during the year for floating storage purposes. The short-term outlook, however, is not bright: the storage phenomenon will fade as soon as the contango in the gasoil market disappears, while there are still 62 new ships scheduled for delivery in 10. OVERALL, SUEZMAX DAILY RETURNS MAINTAINED AN AVERAGE OF ABOUT $29,000/DAY IN 09. SUEZMAX TANKER FREIGHT RATES US$/day Average earnings Forcados/Texas City - TCE Sidi Kerir/Fos - TCE /08 03/08 05/08 07/08 09/08 11/08 01/09 03/09 05/09 07/09 09/09 11/09
39 aframax The Aframax market in 09 was marked by a strong seasonality. The winter months, from January-March and from November-December, were the strongest both in terms of activity and returns. But for the rest of the year, fleet overcapacity had a serious impact on daily returns, which fell to record lows (on average % of levels seen in 08!) East of Suez, the market fell to $7,000/day (against $41,000/day in 08), while the western zone showed more resistance with average daily returns in the order of $11,500 per day. Shipowners thus tended to take several of their ships to the Atlantic. Around Aframax were also used for floating storage in the Far East, principally for petroleum products. The discontinuation of this trend could constitute a threat to the fragile supply and demand balance in the Atlantic/Mediterranean zone. Most of the exporting countries saw a fall in volumes, with the notable exception of Russia which continued to implement logistical improvements such as the BTC pipeline via Ceyhan, and the Kozmino terminal near Nakhodka, designed to supply the Far East in general, and China in particular. The low returns on the spot market did not persuade charterers to consider period charters. Barely 40 charters were concluded for periods of more than 12 months, which is less than half the amount seen in 08. Tonnage overcapacity was a familiar refrain in all the market reports and analyses last year, and the Aframax segment did not escape this trend. The fleet, which totalled 841 units at the end of 09, is now relatively young (average 8 years). This total includes 225 LR2 capable of transporting petroleum products, although around half are engaged in transporting crude oil. The Aframax fleet is unlikely to grow older in the near future as a further 107 ships are due for delivery in 10 and 85 more in 11, while just 55 single hull ships remain in active service. In these circumstances, one fears that freight levels could remain at 09 levels due to the continued imbalance between supply and demand, although a slight improvement can be expected with the forecast increase in global energy consumption. MOST OF THE EXPORTING COUNTRIES SAW A FALL IN VOLUMES, WITH THE NOTABLE EXCEPTION OF RUSSIA. Tonnage overcapacity was a familiar refrain in all the market reports and analyses last year AFRAMAX TANKER FREIGHT RATES US$/day Average earnings MEG/East - TCE East Med/West Med - TCE Caribs/US Gulf - TCE /08 04/08 07/08 10/08 02/09 05/09 08/09 12/ A n n u a l R e v i e w
40 market in 09 time Charter For the VLCC segment, the time charter market was relatively animated due to a combination of charterers seeking ships for floating storage and Chinese and South Korean traders pre-empting the ban on single hull vessels. Activity fell just 10% compared to 08, although average rates declined by some 50% for short-term charters (one year) and 35% for long-term charters (three years or more) For the Suezmax and Aframax markets, activity was severely reduced and Petrobras was one of the few big players during the year, chartering a dozen Suezmax. Average rates $/day mths 36mths 60mths VLCC $ $ $ Suezmax $ $ $ Aframax $ $ $ IT S EASIER TO RESIST AT THE START THAN AT THE END These words come to us from Leonardo da Vinci, the 15 th century genius who was instrumental in advancing, among other things, knowledge in the field of hydrodynamics. In 09 most tanker owners were able to resist the crisis; there were no major bankruptcies among them and, in the vast majority of cases, they managed to avoid parting with their assets at reduced prices. However the crisis will continue in 10 and the challenge will be more difficult tomorrow. The volume of second hand transactions, already in decline in 08 (with 166 sales of tankers between Panamax to VLCC size, including demolition but excluding OBOs, compared to 226 sales in 07) was reduced to 1 sales in 09. For single hull vessels, their values had already fallen on average by 35% between 07 and 08, and the fall in transport demand pushed them to a further collapse of 60% to 70% between 08 and 09. Vessels which did not go for demolition were sold mainly for storage or conversion, and at levels marginally above the scrap price. Double hull vessels also suffered, but to a lesser degree. The fall was in the order of 25% to 35%, depending on size. While $52m could purchase you a 00-built Aframax in late 08, by the end of 09 this same amount would buy you a newbuilding resale. The buyer in 09 thus would benefit from an additional decade of depreciation, while the buyer in 08 benefited only from the market s mediocre performance in 09 and shall remain at a competitive disadvantage. the second hand market for VLCC Thirty-six VLCC changed hands in 09 (29 in 08), of which twelve went for demolition. The 24 ships sold for further trading were divided between single hulls and four double hulls (the latter including two internal sales). We note that there were more single hull transactions in 09 than in 08 ( versus 15) due to the strong dry bulk market and the appetite for VLOC conversions. The price of these ships varied between $12m and $m, according to size and age. The only significant double hull resale in 09 was that of the Crudegulf (317,550 dwt, built 09) for a price of about $97.5m. Fifty-three new VLCCs entered the fleet in 09 and at 31 December 09, the orderbook comprised 214 units, with 77 due for delivery in 10. It is helpful to keep in mind that some 35 VLCCs were used as storage throughout the year, preventing a further deterioration in the market. This dampening effect seems to be disappearing in 10. If one compares these 53 new


 were sold for scrap, compared to two units in 08.")
41 RAS MAERSK Product Tanker, 35,000 dwt, delivered in 03 by the Chinese shipyard Guangzhou to AP Moller entries with the 12 units demolished, the units sent for conversion and the 35 ships set aside for storage, it is clear that it was a drop in demand, and not an increase in tonnage supply, that created the decline in returns during 09. TANKER SECOND-HAND PRICES $m (5 year old ships) VLCC 305,000 dwt 5 yrs Suezmax 150,000 dwt 5 yrs Aframax 105,000 dwt 5 yrs MR Product 45,000 dwt 5 yrs /07 04/07 07/07 10/07 01/08 04/08 07/08 10/08 01/09 04/09 07/09 10/09 WHILE $52M COULD PURCHASE YOU A 00-BUILT AFRAMAX IN LATE 08, BY THE END OF 09 THIS SAME AMOUNT WOULD BUY YOU A NEWBUILDING RE-SALE. the second hand market for Suezmax In contrast to the VLCC sector, the number of Suezmax transactions concluded during 09, at 23 ships, was below that of 08 (28 sales). Nine of these ships (including three FSOs) were sold for scrap, compared to two units in 08. The 14 remaining sales included 13 double hull vessels and just one single hull ship which was sold for conversion. The main player was undoubtedly Nordic American Tankers (NAT), which remained active throughout 09, buying four units in total. To illustrate the decline in values over the year, it is worth mentioning in particular NAT s April purchase of the Seagrace (150,000 dwt, built in 02) for a price of around $57m, which was followed in October by that of the Pentathlon (164,000 dwt, built in 02) for $51.5m. Five resale contracts were also disposed of, four by Metrostar which found a buyer for the first pair of ships in GNMTC at a price of $148m en-bloc, and then in NJ Goulandris for the second pair at $140m. 45 Suezmaxes entered the fleet during 09, while ten departed the scene (conversions and demolitions included). On 31 December 09 the order book consisted of 155 units, including 62 for delivery in A n n u a l R e v i e w 38 39
.")
42 market in 09 BALTIC FRONT Product tanker, 37,340 dwt, delivered in 06 by the South Korean shipyard Hyundai Mipo, operated in the Norient Product Pool the second hand market for aframax and Panamax Here, too, the volume of second hand sales collapsed. While there were 76 Aframax sales listed last year, we recorded only 44 in 09, including 15 for demolition (16 in 08). Of the 29 vessels sold for further trading, we recorded four single hulls for storage or conversion, and 25 double hulls. The value of single hull tonnage deteriorated rapidly, falling eventually to scrap value. The price of the double hulls also fell, as evidenced by the sale of the Pacific Fantasy (built in 08) for $63m in January, compared to the Nisos (built 09) in November, when it obtained just $52.5m. Comparable months in 08 would have secured you a ship built in 1999 and 00 respectively. The Aframax orderbook remains imposing. At end December 09 it constituted 8 ships, of which 107 are expected in 10, while 96 entered the fleet in 09. For the Panamax, it will be the demolition figures that are remembered in 09. Of the 17 sales realised during the year (26 in 08), eleven ships departed for scrap, against five in 08. Just one unit was sold for conversion, the Frontier Express (68,5 dwt, built in 1993) which went for $5m, while five double hull vessels changed hands, including the Four Schooner (73,000 dwt, built in 00) for $36m in July. 39 Panamax tankers entered the fleet in 09, while the orderbook is at 98 vessels, including 39 for delivery in 10.

43 the second hand market for OBO Nineteen OBOs were sold in 09, including four for further trading and fifteen for demolition. Although the dry bulk market held up well during the year, many owners opted for scrapping due to the high maintenance costs, and the age critera now required by charterers for operating bulkers. Of the four ships sold for further trading, all were sold to Chinese buyers. We note the sale of the Princess Susana (152,295 dwt, built in 1986) for $10.3m in November. There were no additions to the fleet in 09, and at the end of the year the orderbook was identical to the previous year. There are now 12 units on order, of which five are due in 10. the future market The market will continue to see single hull vessels disappear and those double hulls without a centreline bulkhead will become much harder to sell. There is still the possibility of a further decline in prices, although the extent will depend on the attitude of the banks as much as on the market. If banks and financial institutions (forced by auditors or not) require divestments from owners, prices will consequently drop. By contrast, if the banks remain behind the shipowners, the market and prices will be principally set by the level of transport demand. Demand will undoubtedly be higher in 10 than last year and could create freight rate volatility which benefits owners, even if tonnage supply is simultaneously growing. We saw many newbuilding orders cancelled in 09, while many others slipped and will become late deliveries. Nobody knows the precise number of cancellations and deferrals. For the cancellations, a range of 5% to 10% seems feasible. As an exercise, even if it is relatively basic, it is possible to compare the slippage between 08 and 09, and transpose it onto 10 to estimate the ships to come. Thus at 31 st December 08, we expected 66 VLCCs to be delivered in 09. In fact, 53 ships were delivered, representing a slippage of 13 units (%). If we transpose this percentage onto 09, we can expect 61 VLCCs in 10 (against 77 scheduled). Applying the same logic to Suezmax, Aframax and Panamax vessels, deliveries should fall to 43, 91 and 23 vessels respectively. This simple calculation, if correct, could help owners maintain better rates in 10 as demolition will surely continue apace. At a macro level, the Chinese were pleased this year to replace Japan as the second largest oil importer after the US. Thus it is certain that, as we have already seen in the dry bulk market, Chinese owners will sooner or later return in force to this segment of the market. As such, non- Chinese tanker owners would be well-advised to consolidate and strengthen their relationships with their existing clients. AT 31 ST DECEMBER 08, WE EXPECTED 66 VLCCS TO BE DELIVERED IN 09. IN FACT, 53 SHIPS WERE DELIVERED. 10 A n n u a l R e v i e w 40 41
44 market in 09 Long range 2 (Lr2) ON THE BITR REFERENCE ROUTE TC1 (75,000 TONNES MIDDLE EAST GULF/JAPAN), AVERAGE RATES FELL BY TWO-THIRDS. With the prospect of 41 deliveries during the year (19% of the existing fleet), LR2 owners were naturally somewhat concerned for 09. Their fears were well-founded since on the BITR reference route TC1 (75,000 tonnes Middle East Gulf/Japan), average rates fell by twothirds to reach a low in March of WS equal to a daily return close to zero! However, higher Worldscale flat rates, lower bunker prices and the floating storage phenomenon helped limit the decline in daily returns to an average of $18,000/day for the year. The trade of diesel from the Far East to Europe and Brazil and the movement of naphtha from the Mediterranean to the Far East also allowed those shipowners organised in pools (LR2, Heidmar, Teekay) to optimise the employment of their ships. However the positive impact felt by the new refining capacity which came onstream during the year, notably in India, may be insufficient to absorb the 51 ships scheduled for delivery in 10 and 11. Long range 1 (Lr1) Some 55 ships joined the LR1 fleet in 09, bringing the average age to just over 7 years. Average daily returns barely reached $16,000 per day in 09, against almost $40,000 per day in 08. In the Atlantic, volumes declined both for gasoline and diesel and the LR1 were subject to intense competition from the MR. Arbitrage opportunities on naphtha exports to the Far East only emerged at the start and the end of the year, and then only for brief periods. Conversely, the market was more balanced east of Suez thanks to firmer activity and the activation of several new refineries in India. As with the LR2, the market was also supported by demand for floating storage. The prospects for improvement in the short-term remain limited given that 62 ships are due for delivery in 10 and 11. However, one should note that around 65 units will be over years old by the end of 11. Therefore the fleet used by the Oil Majors and the large traders should remain static, which could lead to a certain tightness in the rates in 11, provided the global consumption of petroleum products recovers in-between.

45 PRODUCT TANKER FREIGHT RATES US$/day Average earnings 55,000 t Naphtha MEG/Japan 37,000 t UMS Amsterdam/New York 38,000 t UMS Caribs/USAC SEACONGER Product tanker, 32,230 dwt, delivered 05 by Lindenau Shipyard to German Tankers, with FOX SUNRISE, bunker vessel, 3,360 dwt, operated by Stena Oil 0 01/08 03/08 05/08 08/08 10/08 12/08 01/09 03/09 05/09 07/09 10/09 12/09 medium range (mr) For several years now, we have been concerned about the MR segment: at the end of 08, the orderbook was equivalent to around 50% of the existing fleet, while the average age was just over seven years. Only a significant increase in demand (both in volume and tonne-miles) could avert disaster. Unfortunately for shipowners, the economic crisis compounded the problem of tonnage overcapacity in this segment of the product fleet, and the anticipated correction has been as sudden as it has been sharp. In the Atlantic, the decline in US gasoline imports, due to the increased use of ethanol to fuel cars, led to a strong fall in the BITR reference route TC2 (Continent to USAC). Average daily returns for a voyage from Europe to the US reached around $6,000 per day, compared to more than $24,000 per day in 09. Some charterers, particularly in July and August, were treated to 10 A n n u a l R e v i e w 42 43
46 market in 09 negative returns, while diesel voyages US/Europe were rare and generally unprofitable. East of Suez, shipowners obtained more consistent daily returns ($16,000/day on average for Middle East Gulf/east Africa), in part due to the market tensions created by piracy, which is now widespread in the region. However, many shipowners posted operating losses and may experience financial difficulties in future if market conditions do not change. It is difficult to be optimistic for 10 given the delivery of 143 ships in 09 (just 28 cancellations), which will be followed by a total of 190 new ships in 10 (excluding cancellations and deferrals). PRODUCT TANKER FLEET AND ORDERBOOK END 09 m. dwt 0,1 0,1 0,0 In service On order % flotte en service 0,0 0,0 33,0 % 0,0 13,7 % 25,6 % 31,9 % Handy Tanker MR Product LR1 LR2 Handy product PALM OIL VOLUMES TRANSPORTED ON HANDIES AND MR TO EUROPE AND THE US FELL MORE THAN 8% IN 09. For a great part of the year, shipowners struggled to secure positive daily returns. Worldscale rates on the route TC6 clean (cross-med) averaged WS107.5 in 09, against WS250 in 08 (without taking into account the approximate 30% inflation in Worldscale flat rates between 08 and 09). Adjusting for the change in flat rates, this represents a fall of around 50%! The average yield secured by owners did not exceed $10,000/day, compared to nearer $23,000-$24,000/day in 08. However rates were revised upwards at the end of the year thanks to the harsh winter conditions, which benefited the ice-class fleet and prolonged the average duration of voyages. With an average age of 12.4 years and an orderbook of around one hundred units, plus a projected 160 ships over the age of by end 10, the Handy segment seems close to equilibrium despite the intense competition from the larger ships (MR). Time charter rates for product tankers fell slightly in number (-30%) and duration (-60%) during 09. Traders and operators took tonnage for short periods to hedge their spot positions, or to renew their fleets without excessive exposure. Forms of variable rates (profit sharing, or index-linking on the BITR indices) were much in use by the end of the year. Time charter: average rates $/day mths 36 mths 60 mths Number of charters 09 vs 08 LR2 $19,700 $,400 $24,000-35% LR1 $18,800 $19,600 $21,000-26% MR $14,600 $15,900 $17,000-30% Handy $14,000 $14,800 $16,000-30%

47 Vegetable oils (Handysize and mr) PALM OIL (Indonesia and Malaysia to Europe and the US) After an increase of around 7% between 07 and 08, palm oil volumes transported on Handies and MR to Europe and the US fell more than 8% in 09. The decline mainly affected the new vessels delivered from Asia s shipyards during the year, for which only 57 ships transported palm oil in 09, against 89 in 08. Production of palm oil rose in Asia, but this increase was mainly absorbed by India and China. Of the 1 or so MR delivered ex Asian yards in 09, around 80 were IMO III. A good half of these chemical tankers were fixed with palm oil for their maiden voyage, and were mostly bound for Europe (principally Rotterdam and the Black Sea). Rates remained high compared to petroleum products, as the majority of voyages were covered under contracts of affreightment in 08, at rates often exceeding $24,000/day. The spot market fluctuated between $11,000/day and $15,000/day over the final six months of the year. Nearly 40 IMO II/III Handies were delivered in 09 in Asia. Around half were fixed with palm oil, and again mainly to Europe. The rates ranged between $23,000/day at the start of the year to less than $10,000 during the summer, before stabilising at around $12,000/day in the last quarter. Around 45 Handies and 1 IMO II/III MR are scheduled for delivery in Asia in 10. But we note that in 09 around % of deliveries were deferred, and we can expect a similar number in 10. SUSANA S Product/chemical tanker, 19,540 dwt, delivered in 09 by the Chinese shipyard Qingshan to Utkilens AS SOYA AND SUNFLOWER OIL (Argentina and Brazil to China, India, Europe and the Caribbean) Export volumes fell again in 09, mainly due to the poor harvest. However, motivated by more favourable export taxes, the biodiesel refineries worked at full capacity. For the first time, Argentina exported more than 1.1m tonnes of biodiesel, against 685,000 tonnes in 08. Some 95% of exports were destined for Europe (the great majority to the Netherlands and Spain). However the total volume of crude vegetable oil exported from Argentina fell by 10% to around 5.7m tonnes. China and India together imported over 50% of these volumes, a 40% increase on 08 (!), mainly at the expense of Europe, where volumes fell by more than 60%. Freight rates to China began the year at $50/t, fell to around $35-36/t in May when the price of bunkers was at its lowest, and then rose again to $40/t by the end of the year. In terms of daily returns, rates remained fairly stable at around $10,000/day for an MR to China. 10 A n n u a l R e v i e w 44 45
48 market in 09 the second hand market For Product tankers TIME CHARTER RATES FOR PRODUCT TANKERS FELL IN NUMBER (-30%) AND DURATION (-60%) DURING 09. For those observers who wondered how shipowners were going to manage the monster wave of ships on order, 09 finally provided an answer: owners simply could not. 09 was simultaneously a year when financing was extremely hard to come by, and a year when demand finally fell in line with the sluggish global growth in general, and with the slow pace of US imports in particular. At the start of 09 the average price of a 5 year old MR product tanker was approximately $40m, reaching $23.5m at the end of the year - in other words a fall of around 40%. As a consequence, the residual value of many assets fell to extremely low levels. For example, we note the Regent (47,000 dwt double hull without a centreline bulkhead, built at Halla in South Korea in 1992) which was sold for $5.25m in its 17 th year, compared to the sale of its sistership Sovereign which was sold a year earlier for five times the price! The profusion of modern tonnage has only amplified the discounts available in the market for ships of 15 years and over, even if they are double hulled. Any conservative buyer will thus pay special attention to the number of useful years remaining before the vessel s third special survey. The (disturbing) fundamentals are not new and are known to all: overcapacity, a low average age of around 7 years, a bloated order book and an inevitable increase in future overcapacity (barring an explosion in product tanker demand, which is difficult to envisage at the moment). A sign of the times, we saw in 09 a series of sales at a loss before the vessel was even delivered. In the Handy segment, demonstrating the extent of the drop, we noted the sale of the Baltic Solar and Baltic Serenity (37,000 dwt under construction at Hyundai Mipo and scheduled for delivery in November 09 and May 10) for $27.75m apiece, a price equivalent to less than 40% of the cost of construction (delivered basis). For the MR product tankers, resales for prompt delivery have been sold since the third quarter of 09 at around $32m to $33m, about 28% cheaper than the cost to the original owner (who will have had to put up around $45m). Lethargic freight rates, shorter time charters, and a fall in the number of fixtures will not facilitate an increase in second hand prices, which however appear to have reached a first point of resistance. Expectations in the newbuilding market are clearly of a further downward trend. After a small respite in the freight market, at least east of Suez, it seems likely 10 will see a proliferation of resale deals at similar levels (with the possibility of an even greater decline). This year the same causes will produce the same effect, and 10 should be a very good year for buyers. Summer 08 Summer 09 Change Price 5 year old ship BSPA $54m $29.5m - 45% 12 month T/C $25,500/day $14,000/day - 45% NB contract price $53.5m $37m - 31%

49 THE PROFUSION OF MODERN TONNAGE HAS ONLY AMPLIFIED THE DISCOUNTS AVAILABLE IN THE MARKET. 10 A n n u a l R e v i e w 46 47

50 BOW SUMMER Chemical tanker, 40,036 dwt, built in 05 by the Polish shipyard Szczecinska, owned/operated by Odfjell Tankers turbulent A

51 TOGETHER WITH THE GLOBAL FINANCIAL CRISIS, THE TONNAGE OVERCAPACITY AND THE STEADY INCREASE IN BUNKER PRICES SEALED CHEMICAL TANKER OWNERS RESULTS IN 09. La hausse du prix du pétrole a incité ces derniers à prendre The rising price of oil forced them to take several proactive measures. des mesures volontaristes, portant notamment sur la maîtrise de leurs achats de soutes (en plus petites quantités) et More slow steaming was introduced, while owners managed bunker purchases more closely, often taking smaller stems at a time. la réduction de la vitesse d'exploitation de leurs navires. year 10 A n n u a l R e v i e w 48 49
52 Le marché de La construction navale En 08 market in 09 In this atmosphere of endeavour and market support, we saw an upsurge of new pools (including Navig8, Sea Tramp, Hanseatic and Womar) operating standard coated ships of between 13,000 dwt and 17,000 dwt. Despite the cancellation of several orders and higher levels of demolition, particularly of 1980s-built stainless steel chemical tankers over 34,000 dwt, it was not enough to regulate the overcapacity in this very young and expanding fleet. Thus significant declines were noted in many annual contract and time charter renewals, fuelled by the emergence of new players, and charterers happy to benefit from an expanded panel of owners operating a very modern fleet. European cabotage 09 WAS A MISERABLE YEAR FOR SHIPOWNERS ON ALL THE EUROPEAN CABOTAGE ROUTES. If the year proved to be quiet on the demand side, the fleet for its part experienced profound change 09 was a miserable year for shipowners on all the European cabotage routes. After a downturn in the summer of 08, which was then amplified by the financial crisis, volumes loaded under contract fell steadily up to the summer of 09, to the point that they amounted to just 50% of the expected total. Fortunately, during the second half of the year, volumes started to rise again under some contracts. However, demand for spot cargoes remained very limited and vessels often found themselves unemployed for long periods. Indeed spot rates declined by more than 30% over the year compared to the market highs seen on the north Europe traffic in 08. In the Mediterranean, the fall in rates was even greater, reaching a peak of -40% on certain trades such as the Black Sea and east Mediterranean $/t CHEMICAL TANKER SPOT FREIGHT RATES At year-end, contract renewals heralded a decline in rates of between 5% and 10%. The result was even worse on some of the larger contracts, which attracted large numbers of shipowners wishing to secure cargo for the years to come. Besides the reduction in cargo, fleet overcapacity was one of the most important causes of the depressed market. A great quantity of this tonnage came from Turkey, with some 35 ships of 3,000 dwt to 10,000 dwt delivered by the country s shipyards in 09. A good portion of these stayed in Europe either through purchases or time charters by European shipowners, or even remained on the spot market in the absence of any contract business. 2,000 t easy chemical Rotterdam / WC Italy Rotterdam / US Gulf Rotterdam / Taiwan
53 Developments during the year The chemical market had been expecting some signs of recovery in the Middle East during the year, but exports continued to drop due to the mothballing of production units, particularly in Iran, and delays in the activation of new petrochemical plants. For example, for lots of 6,000 tonnes from Saudi Arabia to Southeast Asia, freight rates declined almost 25% compared to 08. This same downward trend was observed on the transatlantic routes from Europe. After a relatively firm market at the start of the year, supported by American demand for BTX, caustic soda and MEG, the strong appreciation in the Euro, plus the depressed market for product tankers, resulted in a steady decline in freight rates from the second quarter onwards. Freight levels fell from $43 a tonne to $30 a tonne for lots of 5,000 tonnes and from $33 to $28 for lots of 10,000 tonnes, an average decline of around $10 per tonne. Conversely, in the US/Europe market, freight rates in the spot market were at a high in the first quarter of the year and, despite a downturn in the proceeding two months, their course remained stable until the end of the year, supported by contractual movements of biofuel, ethanol and styrene. The only bright spot in this picture was the massive importation of chemical products by China and the subsequent spike in freight rates in the first two quarters. This influx of cargo was caused by the arbitrage activity in aromatic and methanol sales. For lots ranging from 1,000 tonnes to 5,000 tonnes there was a strong upturn in freight rates throughout the first half of the year, of around 30% to 40%, with China showing strong demand for xylene, Px, glycols, acetone, Edc and Mtbe. After the summer peak, however, the rate curve fell steadily until the eve of the last quarter. It then stabilised due to the increase in cargoes linked to the closing of the contractual year, and the stockpiling of products in the run-up to Chinese New Year. THERE WERE 46 PART OR FULLY STAINLESS STEEL TANKERS DELIVERED IN 09. the fleet If 09 proved to be quiet on the demand side, the fleet for its part experienced profound change. First, in terms of deliveries, there were 46 part or fully stainless steel tankers delivered during the year, equivalent to 940,000 dwt slightly less than the previous year (53 ships of 1.05m dwt). Only 22 ships of 10,000 dwt to,000 dwt joined the fleet, although they represented the majority of deliveries in 08. By contrast, there were 17 ships over,000 dwt delivered during the year, beating the record set in 04 of 14 ships. This shows a certain confidence among shipowners in the potential for inter-continental chemical traffic. Seven ships of less than 10,000 dwt, mainly dedicated to the cabotage trade, were delivered in 09, which was slightly less than the previous year. It was in the demolition market that the numbers were most impressive, with 28 units or 250,000 dwt leaving the fleet, exceeding the previous record of 22 ships of 250,000 dwt in 04. This increase in scrap activity cushioned the impact of falling demand, and also the addition of significant numbers of newbuildings. Thus the net growth of the chemical tanker fleet (deliveries minus demolitions) remained almost identical in 09 to the previous year, at 690,000 dwt compared to 730,000 dwt in 08. These figures show that, unlike in other sectors of the shipping industry, fleet renewal is being carried out in a fairly co-ordinated manner, due in part to the importance of the leading operators in the chemical tanker market. 10 A n n u a l R e v i e w 50 51

54 market in 09 CRYSTAL AMETHYST Product/chemical tanker, 8,140 dwt, IMO II, delivered in 1994 by the Belgian yard Boelwerf, owned/operated by Crystal Pool Ltd Only a dozen newbuilding cancellations and three new orders were registered in 09, which leaves the orderbook at around 130 ships, of which some 70 are scheduled for delivery in the course of 10. In the field of coated chemical tankers (IMO II, MarineLine or epoxy), although declining, deliveries remained huge in 09 with close to 240 new units of 4.7m dwt handed over, against 280 ships of 5m dwt in 08. Around 50% of these ships were between 10,000 and,000 dwt, slightly less than the previous year. This extra capacity weighed heavily on the product tanker market in 09. Conversely, the influence of this bloated fleet on the chemical tanker market has been less acute than expected. More than 450 coated ships are now on order at the shipyards, of which around one hundred are between 10,000 dwt and,000 dwt. The bulk of the orderbook is now composed of vessels over,000 dwt (210 ships). Unlike the stainless steel tankers, the demolition of coated tankers has been relatively modest since there are few older ships in this category. Indeed there is currently more replacement of old non-imo II ships by modern tonnage which meets the new regulations. However, even if one expands the selection to uncoated ships of a similar size, one reaches only a modest 60 units of 1.2m dwt retired from the fleet in 09. CHEMICAL CARRIERS DELIVERED IN 09 AND ORDERBOOK AT YEAR-END no. ships (IMO II min. for coated ships) -50K dwt s. steel -50K dwt coated 10-K dwt s. steel 10-K dwt coated 3-10K dwt s. steel 3-10K dwt coated
55 Outlook The world economy appears to be regaining its colour, but although volumes are increasing, the surplus tonnage will not be absorbed so quickly. Meanwhile, the cost of raw materials is expected to rise and will weigh heavily on the cost of production as well as the cost of transport. Thus, there are currently too many uncertainties to give a clear view of the recovery in the freight market. However, given shipping s cyclical nature, we hope at least to be on the ascending slope even if the climb is perilous and full of potential pitfalls. For small tankers with coated or stainless steel tanks, 09 has confirmed the fears of the past year: an overcapacity of tonnage, reluctant charterers and sluggish demand. If the starting point of the crisis in late 08 was the failure of the financial markets, the subsequent impact on demand and thus freight rates has proved far more severe and long-lasting. Prices have naturally reflected this series of negative events. In a market so obviously favourable to buyers, the market price is now determined by the rule: Who is the most desperate seller? At the time of going to press, the price drop from its high point at the end of 07 to today is approximately 50%, if one takes as a reference those ships that were lucky enough to find a buyer. No size of vessel has been unaffected by the tonnage overcapacity and a ship (sophisticated or not) offered for sale can only rely on a large price reduction to find a buyer. The number of vessels available for a quick sale at the end of the year was approaching 250 units! As expected, the speculative orders placed at South Korean and Turkish yards have been largely transformed into vessels unable to find stable employment on the spot market. But prices have above all been affected by those newbuilding orders suddenly cancelled by shipowners waking up from their previous euphoria (eg the Mediator types at Hyundai Qingdao, the SRAB vessels at Eregli in Turkey, and countless 13,000 dwt ships in South Korea ). We note however that the market remained active for ships over ten years. This should be seen in the context of the challenge of finding finance, and also in the lack of confidence in the value of younger vessels over the medium/long-term. The decidedly timid application of single hull phase-outs during 09 (in line with the MARPOL rules) on the one hand, and the renewed increase in the bunker price on the other, completes this grim picture. For now, the market watches passively as prices continue to fall, but this trend should soon come to an end for those units with specialised features (twin propulsion, bitumen carriers, genuine bunkering tankers with horizontal pumps etc ), albeit for those ships only. Without a deus ex machina (a geopolitical event, a sharp decline in the Euro, or perhaps a major pollution incident accompanied by more radical legislation), it seems unlikely this market segment will be able to regulate itself within the next three or four years. THE BULK OF THE ORDERBOOK IS NOW COMPOSED OF VESSELS OVER,000 DWT. The number of vessels available for a quick sale at the end of the year was approaching 250 units! 10 A n n u a l R e v i e w 52 53
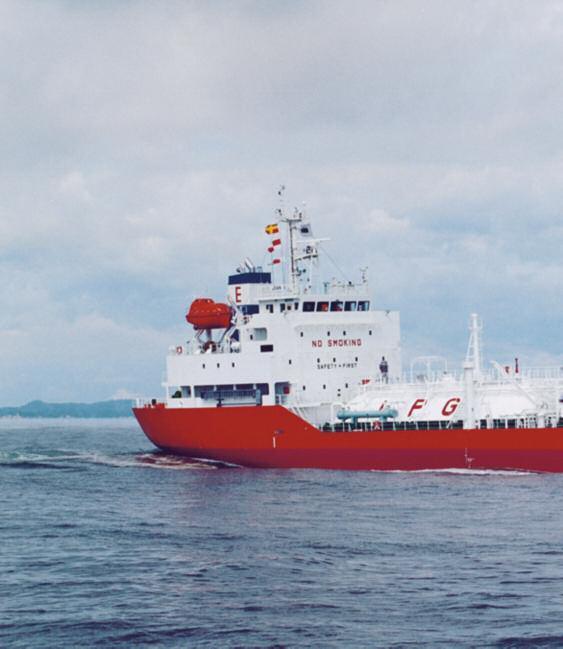
56 Astrong
57 UNCERTAINTY GRIPPED THE LPG MARKET AND EVERYONE S MINDS A YEAR AGO. THE BURSTING OF THE FINANCIAL BUBBLE IN THE LAST QUARTER OF 08 PROMPTED THE IMMEDIATE COLLAPSE OF THE FINANCIAL SYSTEM IN THE MAJOR INDUSTRIALISED COUNTRIES, AND SHORTLY AFTER JAMMED THE WHEELS OF THE GLOBAL ECONOMY. WHAT THEN FOR THE MARKET A YEAR LATER? And what were the main effects of this tsunami on the market for LPG and associated gas transport? ebbing MAGDALENA LPG carrier, 3,500 cbm, pressurised, delivered in 08 by the Japanese shipbuilder Yamanishi, owned under JV by Exmar and Wah Kwong, trading in West Africa for Geogas/Nidas 10 A n n u a l R e v i e w 54 55
58 THE LPG AND CHEMICAL GAS SHIPPING MARKET IN 09 Highlights In contrast to the previous year, market volatility was generally more limited in 09 and rates did not touch the extreme lows seen in the past. Prices for the major oil products and associated gases rose steadily throughout the year by around 100% for crude oil, 160% for naphtha, and between 100% and 110% for butane and propane. By contrast the price of natural gas, ammonia and chemical gas (ethylene, propylene, butadiene etc) fell sharply during the year, despite a brief reprise in the second quarter. Aside from the effects of the economic crisis, we can note several trends during the year, including: A growing imbalance between increasingly limited product supply and tonnage availability, the latter resulting from the massive influx of ships ordered between 06 and 08. The drop in the supply of product was caused not only by further delays in the commissioning of new production units (Qatar, Abu Dhabi, Africa ) but also by the technical problems experienced by some producers (Algeria, North Europe, Ukraine ), and in some of these countries production was lower than in previous years. While this tonnage overcapacity was expected, especially in the VLGC segment, the impact of this surplus varied widely according to the different size segments. Low natural gas prices in the US created a significant disparity with crude oil prices, opening up the possibility of new price arbitrages with Europe and the potential for LPG exports from the US. On the other hand, we witnessed a substantial decline in the transatlantic trade of ammonia from Ukraine s terminals, which were often mothballed due to the high production cost caused by steep natural gas prices. PRODUCT PRICES AND FREIGHT RATES Products Dec. 08 Jul. 09 Dec. 09 Dec % Crude oil, Middle East Gulf ($/bbl) % Brent crude, North Sea ($/bbl) % IFO 380 cst Rotterdam ($/mt) % Naphtha CIF Rotterdam ($/mt) ,5 164% Natural gas ($/mmbtu US Henry Hub) 5,8 3,8 5,28-9% Propane CP (contr. price FOB Saudi Arabia) ($/mt) % Butane CP (contr. price FOB Saudi Arabia) ($/mt) % Anhydrous ammonia (FOB Black Sea) ($/mt) % Ethylene (contr. price Europe) ( /mt) 1, % Propylene poly gr (contr. price Europe) ( /mt) % Butadiene (Europe spot) ( /mt) 1, % Freight rates by size segment Dec. 08 Jul. 09 Dec. 09 Dec % VLGC 75/85,000 cbm spot MEG/Far East ($/mt) % VLGC 75/85,000 cbm 6-18 month t/c ($/mth) % LGC 52/60,000 cbm 6-18 month t/c ($/mth) % 24/38,000 cbm 6-18 month t/c ($/mth) % 16/22,000 cbm 6-18 month t/c ($/mth) % 6/11,000 cbm ethyl month t/c ($/mth) % 6/8,000 cbm semi pres./ref month t/c ($/mth) % 3,5/7,500 cbm pres month t/c ($/mth) %
 and between 10% and % for")
59 BOTAFOGO GAS LPG carrier, 7,500 cbm, pressurised, delivered in 09 by the Japanese shipbuilder Murakami Hide Shipbuilding Co. Ltd, time chartered to Vitol SA, trading for Reliance, India A sharp fall in short and medium-term hire rates, of between % and 40% for the larger ships (22,000-80,000 cbm) and between 10% and % for the smaller sizes. Few long-term contracts were registered, except for a handful of deals either linked to newbuildings or second hand sales. Significant resistance was noted in the chemical gas market (propylene, butadiene, crude C4) which can be explained by fewer newbuilding entries and the development of intercontinental arbitrages which favoured long haul voyages, and thus created more tonne-miles. We note however a general downturn in freight levels from the peaks seen a year earlier, equivalent to a fall in income of about 60% on certain routes Mipo. These contracts were generally placed under particular terms such as the conversion of other ship-type orders, financial aid, etc. In a freight market constrained by age limitations and increasingly stringent vetting standards, some 28 older units were sold for demolition, of which half had a capacity of more than 30,000 cbm. This is a similar total to the previous year. VESSELS DELIVERED IN 09 AND ON ORDER (NUMBER OF UNITS PER VESSEL TYPE) A black year for the VLGC sector (VLGC 75,000-84,000 cbm), where the average spot rate on the MEG/Japan trade reached just $22 per tonne over the year, and bottomed out at around $15-17 per tonne. We have not observed such a prolonged collapse in VLGC rates for many years. Even if this critical situation was expected due to the large numbers of newbuildings, regardless of the economic crisis, its magnitude has been surprising Fully ref Eth/C Semi ref Pressurized After the euphoria of the previous years, which brought a glut of newbuilding orders contracted at high prices, the economic crisis brought a welcome break! Only a few contracts were logged, including a series of 6 x 5,000 cbm pressurised ships ordered by China s Jaccar at Sinopacific, and two 22,000 cbm ships ordered by Latvian Shipping at Hyundai A n n u a l R e v i e w 56 57
60 SHIPPING MARKET The market by ship size VLGC (Very Large Gas Carriers) 70,000-85,000 cbm As already mentioned, 09 was a disastrous year for this size segment and the market indicators remained permanently in the red. Weaker demand in the Far East and the US, limited availability of product and, above all, overcapacity of tonnage due to multiple newbuildings, conspired to put strong pressure on employment for these units. The current VLGC fleet now stands at around 140 ships, of which 43 have been delivered in the last two years close to a third of the total fleet. Demand for LPG has hardly been moving in the same direction, and has even fallen in some of the big import markets. We note here the development of a new western market between north Europe, the Mediterranean, north and west Africa and the US, allowing some VLGCs to remain in this area without having to return to the principal routes out of the Middle East. These conditions encouraged the removal of five old units for demolition. Despite the difficult market environment, Stolt-Nielsen Gas decided to step into the sector with two VLGCs: the Yuhsho (78,000 cbm, built 1999) taken on three-year time charter; and the Althea Gas (82,000 cbm, built 03), purchased for just over $52m and subsequently renamed Stolt Avance. The Baltic Index MEG/Chiba averaged close to $22 per tonne for the year, while monthly time charter equivalents on the spot market ranged between $500,000 and $375,000 per month, equivalent to an average of $0,000/month, a level well below operating costs. The time charter market was more active for shorter periods of three to six months, with transactions concluded at levels varying between $300,000 and $600,000/month during the first two quarters. After this, a consistently weaker market persuaded some operators to commit to longer charters of two or three years at slightly higher levels of $550,000 and $650,000/ month, depending on the period and specifications of the vessels. Despite a forecast increase in new production, the entrance of 13 extra newbuildings between now and 13 means that the outlook for this segment remains uncertain for probably the next 12 to 18 months. Large Gas Carriers cbm With six 60,000 cbm vessels joining the fleet in the last two years, this size segment has been strongly affected by the sharp drop in transatlantic ammonia traffic and by competition from its neighbours in the VLGC and the 35,000-38,000 cbm segments. This is the typical domino effect of a depressed market. Waiting times for vessels on the spot market reached levels of over 25% during the second half of the year. Meanwhile the gap in rate levels achieved by units of the older generation (52,000-54,000 cbm) and more recent ships (59,000-60,000 cbm) further increased. This disparity should gradually disappear however with the demolition of older units, among which seven ships over 30 years of age were scrapped during the year, representing a significant proportion of this size segment. BALTIC INDEX (FREIGHT/PMT) VS TCE (HIRE/MONTH) IN 09 $/t 35,00 30,00 25,00,00 15,00 10,00 5,00 0,00 Baltic index MEG/Chiba freight pmt in US$ TCE Weekly Average Hire pcm in US$ 09: Weeks 1-52 $ pcm , ,00 0
61 The monthly time charter equivalent rate for spot voyages remained very low throughout the year with returns falling from $600,000/ month at the start of the year, to below $450,000/month by the end of the year. Waiting times between spot voyages also reached record levels. In this context, time charter activity was reduced to a trickle and then only for round voyages of a duration of one or two months at rates close to spot market levels. However, with the sale of its last remaining older units for demolition, together with the absence of any pending orders, this segment is likely to find a new lease of life in the near future. Midsize carriers,600 43,000 cbm This segment of the market has benefited from firm global demand for several years, deploying itself on the ammonia, LPG and chemical gas markets where rates of employment and income levels have been relatively steady. LPG/C 35,000 TO 82,000 CBM This situation inevitably changed, however, with the entry of several series of newbuildings in 08 and 09: 11 x 35,000 cbm, 10 x 22,000 cbm, and 3 x,600 cbm, which were delivered into a difficult market environment, particularly in the ammonia trade where market volumes decreased by around 10% during 09! This influx of extra tonnage shook the markets in the early months of 09, although there was a respite in the middle of the year due to a recovery in the ammonia trade from the Middle East, together with some long haul voyages for LPG and chemical gas. Market conditions have curbed the number of time charter deals. Barring a few exceptional long-term deals (Pertamina, PDVSA ) concluded on 22,000 cbm vessels at relatively good rates ranging between $750,000/month and $850,000/ month, most of the transactions were concluded at shorter periods of less than a year at levels of around % of those in 08, that is, between $600,000 and $725,000 per month according to size and specs. Given the number of newbuildings to be delivered during 10 and 11 - eight new vessels of 35,000 cbm and ten of 22,000 cbm - the next two years seem quite open for this size segment, although the flexibility of employment for these ships in the LPG, ammonia and chemical gas markets will facilitate their integration. THE CURRENT VLGC FLEET NOW STANDS AT AROUND 140 SHIPS, OF WHICH 43 HAVE BEEN DELIVERED IN THE LAST TWO YEARS. Waiting times for LGC on the spot market reached levels of over 25% during the second half of the year $/month Short Term T/C or T/C Equivalent to Spot Voyages cbm cbm cbm Jan Feb Ma Apr May Jun Jul Aug Sep Oct Nov Dec 10 A n n u a l R e v i e w 58 59
62 THE LPG AND CHEMICAL GAS SHIPPING MARKET IN 09 IN CONTRAST TO THE OTHER SIZE SEGMENTS, THE SMALL SHIP AND COASTER SEGMENT SURPRISED THE MARKET WITH ITS RELATIVELY STRONG RESISTANCE TO DIFFICULT MARKET CONDITIONS. How long can VLGC operators operate their ships at rates below running costs? Handy semi refrigerated size 6,500,000 cbm The slowdown in the petrochemical industry, which provides the lion s share of the employment for the semi-refrigerated market, also negatively affected the sector but to a lesser degree than other segments. Tonne-miles increased significantly due to the development of long haul voyages between the US, Asia, South America and Europe, where multiple arbitrage opportunities encouraged trading. Asia remains the big driver of butadiene, C4 and propylene imports, but a brief spike in prices for naphtha in the middle of the year also contributed to new movements of cargo from the US and Brazil to Europe. The general decline in consumption however particularly touched the ethylene market, where the vast majority of carriers had to find alternative employment on other trades. The drop in freight rates, both on the spot and period market, was more restrained in this segment than others, and certainly not as severe as was feared earlier in the year. More draconian vetting standards, and strict limits on the acceptable vessel age on certain trades enabled the more modern fleets to maintain levels of employment, and at more favourable rates. At the end of 09, the monthly hire rate for a one-year charter on a 16,000 cbm vessel stood at around $600,000, a level not far from that of a 8,0 cbm ethylene carrier, ie around $550,000 per month. By the end of the year, the market was quite lively, with several voyage contracts booked for butadiene from the US, Brazil and Europe bound for the Far East, and even a 14,000 tonne batch of VCM destined for Asia, a product that was nearly absent from the trade during the year. Regarding fleet renewal, we count 17 newbuildings delivered in 09, of which half were ethylene carriers, while nearly 50 units are still on order for delivery between 10 and 12. Thus the coming years will be challenging. Even taking into account the probable sale for demolition of the oldest units (five 6,000 to 8,000 cbm vessels were already sold in 09), it remains to be seen if the petrochemical market can absorb all these newbuildings. Small LPG and chemical gas carriers less than 6,500 cbm In contrast to the other size segments, and despite multiple newbuilding deliveries in 08, the small ship and coaster segment surprised the market with its relatively strong resistance to difficult market conditions. After a somewhat tight start to the year, the market became increasingly busy over the course of the summer before firming up in the last quarter, thanks to significant intra-refinery trade, increased LPG demand by the petrochemical industry due to the rising price of naphtha, sizeable tonnemiles created by the long distances to the zones of consumption, and the development of a captive trade in the Asia-Far East region. The close of the year recorded a further firming in spot and time charter rates, and finding available tonnage in some areas became quite difficult. Overall, while some periods of unemployment were registered, the market sector was generally less disrupted than the larger sizes. Several time charters were concluded, ranging from three to 24 months, at rates that were slightly lower than last year but showed a firming by the end of the year. A pressurised vessel of 3,500 cbm fetched around $270,000 to $280,000 per month, while a 5,000-6,000 cbm of the same type fetched $270,000-$280,000 per month. Semi-refrigerated vessels of the same size obtained higher levels at around $275,000/ month and $385,000-$450,000/month respectively, depending on the period and ship specifications. Here again, we registered a large number of newbuildings: 25 units delivered in 09 and around 50 to come between 10 and 13! However age restrictions and vetting standards will certainly play their part in the elimination of many vessels, and we should also remember the impact of growing markets in Asia and the Far East.
63 LPG CARRIERS 5,000-22,500 CBM MEDIUM TERM T/C (6-18 MONTHS) 000 $ pcm cbm cbm ethylene cbm /03 01/04 01/05 01/06 01/07 01/08 01/09 Conclusion These last twelve months of economic crisis have been critical. Nevertheless the fall in energy prices at the start of the year, combined with state-sponsored stimulus programs, has kept up consumption in the larger industrialised countries, leading to a better outcome than feared at the beginning of the year. Overall, the shipping market for LPG and associated gases developed in contrasting ways depending on the individual size segment due mainly to the large influx of new tonnage, rather than lower production levels or reduced demand for product. This disparity also reduced the income gap between the different size segments. Twelve-month hire rates for vessels between 8,000 cbm and 80,000 cbm ranged from $450,000 to $650,000 per month respectively, equivalent to a ratio of 1 to 1.4 even though the original investment for these ships is 1 to 3! Have we finally reached low tide? How long can VLGC operators operate their ships at rates below running costs? Can the new production facilities sufficiently absorb the large number of newbuildings? What are the options for those operators who have ordered newbuildings at levels far above the ships delivered several years ago? When will the economic turmoil affecting the west come to an end? And will the rise of China and the emerging countries continue to breathe life into the other world economies? There are many questions to resolve in the coming months. The answers are no doubt diverse, open-ended and not always obvious, but this is the challenge that awaits us and is one of the elements that makes shipping so fascinating! LPG CARRIERS DELIVERED IN 09 AND ON ORDER (NUMBER OF UNITS) 7 VLGC 16 MidSize (from 23,000 to 40,000 cbm) Small pressurized (from 2,500 to 12,000 cbm) A n n u a l R e v i e w 60 61
64 THE LPG AND CHEMICAL GAS SHIPPING MARKET IN 09 THE SECOND HAND MARKET FOR LPG CARRIERS The lion s share of the LPG second hand market in 09 revolved around small gas carriers of up to 6,000 cbm VLGC and LGC Like the previous year, the second hand market for LPG carriers in 09 saw very few VLGC transactions, with just two sales recorded. One of them, however, was remarkable as it marked the entrance of a new player in the sector, Stolt Nielsen, which until then had specialised in the transport of chemical products. Stolt Nielsen acquired the Althea Gas (82,500 cbm, built 03) from the Japanese shipowner Iino Kaiun in November for a price of around $53m, which corresponds more or less to its construction price. The second sale in the VLGC segment was that of the Berge Racine (81,600 cbm, built 1985) by the Bergesen (BW Gas) group to Chinese interests for approximately $12m. During the year BW Gas also sold three VLGCs built between 1979 and 1984 for demolition. Again, no sales were registered in the LGC segment. Instead, demolition continued to dominate the news (despite lower scrap prices than the previous year), and in total four VLGC and seven LGC were removed from service, all of them built between 1977 and Midsize The Midsize gas carrier segment saw just two second hand transactions this year. The first involved an older ship, the Shetland (15,070 cbm, built 1981) sold by the Ofer group (Zodiac) in September to Benelux Overseas. The second deal concerned the sale en-bloc of two sisterships, the Vidzeme and Kurzeme (,700 cbm, 1997), by Latvian Shipping to the Singaporean shipowner Pacific Carriers, for a combined price of around $26.5m. By comparison, two years ago similar ships were fetching around $45m. In contrast to the previous year, when no ships in this category exited the fleet, six units were sold for demolition in 09: one ship by the Ofer group, the Sussex (15,070 cbm, built 1981) and two by BW Gas, the BW Herakles (30,450 cbm, built 1982) and the Havrim (37,350 cbm, built 1980). Ships under 15,000 cbm The lion s share of the LPG second hand market in 09 revolved around small gas carriers of up to 6,000 cbm, for which we noted around 15 transactions, but at significantly lower prices than the previous year (around 25% less): Stealth Gas alone sold three ships in the course of the last quarter of the year, the Gas Fortune (3,500 cbm, built 1995), Gas Natalie (3,0 cbm, built 1997) and Gas Crystal (3,0 cbm, built 1990), to add to the Gas Sophie (3,500 cbm, built 1995) sold in the middle of the year. It is interesting to note that the price obtained at the end of the year was 15% lower than at mid-year ($6.6m against $5.6m). Allocean, facing financial difficulties, sold en-bloc two modern units, the Ocean Primary and the Ocean Prima (4,000 cbm, built 07), in the early part of the year to Italy s Deiulemar Navigazione. And in July Peru s Transgas Shipping acquired the Galp Lisboa (3,250 cbm, built 1983) from Sacor Maritima for close to $1m. In keeping with 08, very few ships of this class were sold for demolition, and an identical number of five ships were removed from service during the year. All these ships were built between 1977 and 1980, and thus a respectable age for retirement. In conclusion, the significant fall in newbuilding prices combined with the drop in freight rates resulting from the economic slowdown will continue to weigh on the value of second hand ships. Together with the low ratio of demolitions to deliveries, this does not give rise to much optimism for 10.
65 Ship-to-ship transfer from the FLANDERS LIBERTY, LPG carrier, 84,500 cbm, delivered in 07 by South Korean shipyard Daewoo, operated by Belgian shipowner Exmar 10 A n n u a l R e v i e w 62 63
66 Between
67 LNG SHIPPING FOR THE LNG MARKET, 09 WAS QUITE A PARADOX: WHILE GLOBAL LNG PRODUCTION CAPACITY INCREASED 30% TO JUST OVER 2M TONNES/YEAR, THE NEWBUILDING MARKET EXPERIENCED ONE OF ITS WORST EVER YEARS. Just one ship was ordered in China, and none at all in South Korea, which has won the lion s share of contracts in recent years. GDF SUEZ NEPTUNE 145,130 cbm, a regasification vessel, delivered in November 09 by South Korea s Samsung Heavy Industries heaven and hell 10 A n n u a l R e v i e w 64 65
68 market in 09 Another major event during the year was the construction of the last Q-flex carrier out of the massive 50-ship series ordered by Qatar in 05. Thus we are witnessing the end of a cycle of building LNG carriers, and optimism is only likely to return with the start of new projects or the introduction of new business models in the LNG chain. THE GEOGRAPHICAL RE-BALANCING OF LNG PROJECTS BETWEEN THE MIDDLE EAST AND THE PACIFIC ZONE WAS ONE OF THE MOST IMPORTANT TRENDS OF 09. Spot market rates have almost doubled over the past year, rising from $25,000/day to $45,000/day Project analysis no.ships NUMBER OF LNG CARRIERS ORDERED AND DELIVERED 19 LNG Carriers ordered LNG Carriers delivered The portfolio of LNG projects underway, and for which the final investment decision has been taken, is not declining and currently represents around 100m tonnes per year in liquefaction capacity. Qatari projects represent around 40% of this additional capacity. However one also notes a strong rise in projects in Asia, especially in Australia, which now also represents 40% of the scheduled extra capacity. The geographical re-balancing of LNG projects between the Middle East and the Pacific zone was one of the most important trends of 09, and will obviously affect LNG transport models in years to come. One also notes a break in the Atlantic projects, both in West Africa (Nigeria/Angola) and also in Russia (Shtokman). Two major projects were confirmed in Asia in 09: Australia s Gorgon project (three trains of 5m tonnes/year) and the PNG project in Papua New Guinea (one train of 6.5m tonnes/ year). Most of the Gorgon volumes are destined for the countries of the region: Shell has an agreement with China for 2m tonnes/year, Chevron with the Japanese for most of its 7.5m tonnes/year, while ExxonMobil reached agreement with China for 2m tonnes/year and 1.5m tonnes/year with India. LNG CARRIERS DELIVERED & AVERAGE CAPACITY no.ships Cbm Number of new delivered LNG carriers Average Capacity of new delivered LNG carriers in 000 cbm Trend (Average Capacity of new delivered LNG carriers in 000 cbm)

69 MESAIMEER Q-flex LNG tanker, 212,000 cbm, delivered in 08 by South Korean shipyard Hyundai Ulsan to Nakilat Thus one sees clearly that the geographic pole has shifted towards the Pacific. This phenomenon is going to increase in the next five years, so that the region becomes the natural supplier for China, India, Japan, and even possibly South Korea. Without presuming the ratification of future liquefaction projects, Australasia offers tremendous potential for growth, in a region that is both geopolitically stable and economically familiar. The identified projects amount to a capacity of around 50m tonnes per annum. mt/yr LIQUEFACTION CAPACITY VS SHIPPING TRANSPORTATION CAPACITY Liquefaction capacity in m tonnes/year LNG shipping capacity in cbm Cbm The other areas of deposits are situated in more uncertain zones, both for economic-political reasons (Nigeria, Iran) and for technical reasons (Russia, Qatar), but they form a huge base of LNG resources for the future. A best-case projection for suggests we could see a tripling of LNG production capacity. At a more predictable level, production capacity could reach 300m tonnes per year by 13, representing an increase of 50% over 5 years - a real note of optimism in the current gloom. LNG remains above all the liquid transport mode of an abundant and very promising energy resource under gaseous form the LnG newbuilding market An observation of LNG orders since the early 1990s will help us identify trends, the development in prices, and put the current market - which is particularly favourable for buyers - in context. In today s dollars, the price of an LNG newbuilding has evolved from $280m for an LNG carrier built at Saint Nazaire in 1991 (MISC) to $150m twelve years later, which was when the South Korean shipyards joined the club of LNG shipbuilding and exporting countries. This represents a price variation of some 46%. After the last newbuilding contract was signed in 08 at $250m, the shipyards indicated a price in the order of $280m. In reality, no orders have been signed at this level, and the fall in prices has been sharp and sudden, culminating in the order of a fifth Chinese LNG carrier this year for $5m a drop of 18%! The decline is less however than in other ship sectors where levels have collapsed by as much as 40% over the same period. Still, this goal of the yards to secure a price of $280m would not necessarily have been a godsend. Newbuilding prices for LNG carriers have not benefited from the record level of orders between 06 and 09. Indeed in this period, they have not even caught up with levels of years ago! 10 A n n u a l R e v i e w 66 67
70 market in 09 NEWBUILDING PRICE EVOLUTION SINCE 1990 (yearly averages) US$m- m 300 MISC contracts with Ch. de l'atlantique LNG ,000 cbm in $m LNG ,000 cbm in m S. Korean yards 03 price war US$210m Abu Dhabi contracts with Aker (impact of the Finnish devaluation on the price) 157m The extent of the price change is thus particularly limited for LNG carriers in comparison with other parts of the energy fleet. It was the first tender offer by Repsol which triggered this price war. The South Korean shipyards had been building for their domestic market (Kogas) but were anxious to become key players in the LNG market. At this time the number of shipyards capable of building LNG carriers rose from eight (Chantiers d Atlantique, Fincantieri, Mitsubishi, HDW, Turku, NKK and Kawasaki) to around fifteen, with the entry of the five main South Korean yards, the Spanish shipyards and Hudong in China. It was this increased competition which prevented the price of LNG carriers from rebounding when demand reached record levels in By comparison, the price of a VLCC more than doubled between 03 and 08 from around $65m to $150m. When we compare the price of an LNG carrier in its Euro-equivalent since 1992, the curve is even flatter and the band of fluctuation ranges only from 4m in 1993 to 141m in 03. At end 09, we estimate the price of a 160,000 cbm LNG carrier with DFDE propulsion and a membrane containment system at $210m. (The only order placed in 09, and thus serving as a reference, was a 145,000 cbm vessel with NO96 membrane containment system at China s Hudong for a price around this level.) By way of reference, $210m is equivalent to 157m with an exchange rate of $1.33 to the Euro, a level at the low end of the exchange rate fluctuations seen over the past 15 years. By contrast, with the current exchange rate of $1.5 to the Euro, one obtains a price equivalent to 140m, the lowest Euro price ever seen. Never in the history of LNG shipbuilding have the conditions combined to produce such a low price, and the situation is clearly favourable to the buyer. Strong competition from South Korean shipbuilders, who are seeking to maintain production output in the face of Chinese competition, together with a very favourable exchange rate, has created exceptional conditions for ordering. Highlights A number of events occurring in 09 deserve specific analysis: It is interesting to note that the sudden increase in the number of LNG shipbuilders at the end of the 1990s had the same catalyst: the exchange of technology with another industry. It was the TGV (Train à Grande Vitesse) that would turn South Korea into an LNG shipbuilder, and a metro train that would do the same for China, providing an irreversible transfer of know-how. Another interesting observation is the frequent lament of a market collapse, with newbuildings going straight from the yard to lay-up. The image is certainly striking but it does not tell the whole truth. The LNG ship, to date, remains a project ship. It is delivered directly to its charterer, whether there are cargoes to transport or not. It is the charterer, or the project, which suffers. The open ship is the responsibility of the charterer, except for those few speculative ships (representing less than 6% of the fleet) which are the responsibility of the owner.

71 Despite the sharp increase in the number of ships and players in recent years, the level of fragmentation is still too low for a real market to emerge. LNG has not yet reached the critical mass needed to make a market and in this sense it is not a commodity. However the projects under development represent a future output of around 70m tonnes/year and the production of LNG should double in the next ten years. We conclude that the prospects are quite good then for both orders and vessel employment. If the liquefaction capacity rises to 400m tonnes per year, this will require a doubling in the current fleet! A promising future indeed Let s turn now to this marginal spot market: spot rates have almost doubled over the past year, rising from $25,000/day to $45,000/ day. However the handful of spot cargoes appearing have done their best to appear in places where there are no ships. Hence the paradox: the bulk of the spot fleet is unemployed but unable to benefit from these spot movements! The technology itself continues to advance: several new FPSO and FSRU projects have been launched. Meanwhile a new chapter has started in the great LNG adventure. During 09 offshore operations became a vital segment of the LNG industry, a development which will help to expand sources of production and transport routes. Undoubtedly, the concept of liquefaction close to the reservoir will have significant consequences, and a large number of smaller reservoirs will become exploitable, changing the geography of supply. The balance of resources will also depend on the arrival of a major new producer: Australia, with an anticipated production of 100m tonnes per year. This profound change in the LNG landscape should also lead to reflection over the form of production and procurement contracts. However this cannot happen without an overhaul of the once-sacrosanct principles which have been used to date. Thus there remains potential in the transportation of LNG, the projects themselves and in the technology. The market must adapt but there remain significant uncertainties over freight rates. It is clear that the current 25-year charters are not sufficient to provide a return for the vessels. Meanwhile more than a dozen carriers are currently unemployed, and the likelihood of new orders in 10 is not strong. However, some newbuilding contracts may be placed for the Australian projects and in this respect it will be interesting to observe the approach of the Chinese yards, and whether they opt to take a long-term strategic position in the market. VARIOUS SCENARIOS OF FLEET AVAILABILITY LNG fleet below 25 years LNG fleet below 35 years LNG capacity below 35 years LNG capacity below 25 years Cbm IF THE LIQUEFACTION CAPACITY RISES TO 400M TONNES PER YEAR, THIS WILL REQUIRE A DOUBLING IN THE CURRENT FLEET A n n u a l R e v i e w 68 69
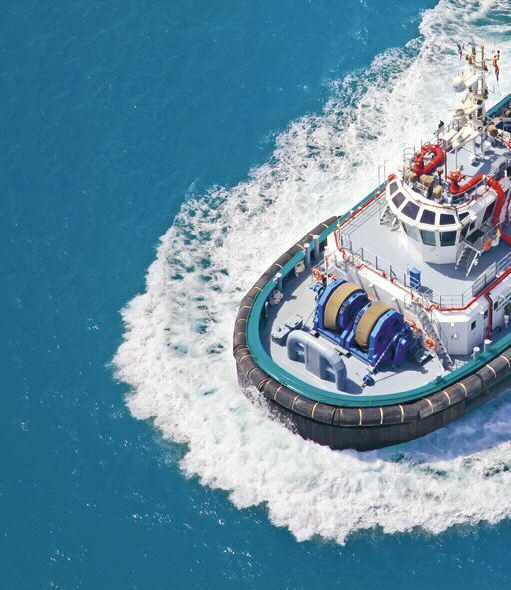
72 A

73 BOURBON YACK Terminal tug, 100t BP, designed by Robert Allan Ltd, delivered by Grandweld to Bourbon in 09 THE OIL AND GAS INDUSTRY FINISHED 09 WITH MIXED SENTIMENTS. ON THE ONE HAND, RELATIVELY HIGH OIL PRICES AND THE RECOVERY IN FINANCIAL MARKETS, PLUS IMPROVEMENTS IN THE WORLD ECONOMY, HAD PAVED THE WAY FOR HEALTHIER OFFSHORE MARKETS. On the other hand, the availability of offshore tonnage in all the vessel segments had pulled down rates and revenues. The struggle to secure vessel employment and financing kept the key marketing men and treasurers busy throughout A n n u a l R e v i e w 70 71

74 le The marché offshore de la and construction specialised navale ships en market 08 In 09 Drilling AS EXPECTED, THE DRILLING INDUSTRY FACED A CHALLENGING YEAR. As expected, the drilling industry faced a challenging year, and the sector was directly impacted by the global decline in exploration and production expenditure which fell approximately 15% during the year. These difficult market conditions led to a substantial decline in utilisation and day rates, particularly in the shallow water segment. The jack-up rig market was further hit by the heavy flow of newbuildings which came onstream in 09. All in all, the main players emerged from the year relatively unharmed, and even set their sights on rig and company purchase opportunities. The three sixth generation semisubmersibles initially ordered by Petromena at Jurong Singapore were eventually sold to Diamond Offshore and Grupo R Mexico. During the year the newbuilding orderbook remained almost unchanged, save for a massive order from IOEC Iran at ZPMC China for ten jack-up rigs via Spanish investment company ADHK; another jack-up rig for Saudi interests; and the confirmation of two drillships and one semi-submersible rig at DSME by respectively Odebrecht and PetroServ in Brazil. The ongoing Petrobras tender for up to 28 rigs has raised expectations but also challenges: all rigs will have to be built in Brazil and so the four main South Korean shipbuilders, as well as Singapore s Jurong and Keppel, have developed their plans and signed joint ventures with Brazilian industrial groups to tackle the tender. Drilling contractors are concerned as to whether they really want to be caught between tough contractual delivery requirements, and newbuilding yards who have yet to develop their facilities and build the rigs; besides, the much higher cost of construction in Brazil will require higher rates than in the international market. Will the prohibitive cost of re-activating cold stacked rigs enhance market conditions? Increased tendering activity at the end of 09 has provoked a wave of cautious optimism in the industry, although all eyes will be monitoring the future oil price, and hoping for a steady rate around the $80/bbl level. Subsea Construction and Installation During 09, it became clear that the offshore subsea contractors would not maintain their heavy workload of the previous year, while at the same time the year generated numerous opportunities for the acquisition of distressed assets which were either under-financed or without employment. As a result, rather than meeting their support tonnage needs through long-term charters, offshore contractors turned instead to the oversupplied OSV spot and term market to secure their required tonnage. Aquanos Norway sold its three newbuilding contracts to, respectively, Tidewater, Mermaid Maritime of Thailand and Island Offshore of Norway. Meanwhile Rieber acquired SEA4 s two intervention maintenance repair vessels under construction in Spain. Technip purchased the Oceanteam103 from its former distressed owners (the vessel will replace the ageing reel-lay vessel Apache), and the same company commissioned the Skandi Arctic, the most sophisticated DPIII DSV to date.
75 ECO III 10,300 dwt, former tanker built by Yardimci in 08, converted to a well tester in 09, owned by TMM, operated by Pemex Acergy acquired the DP3-5000TLC heavy lift vessel Borealis, which is being outfitted at Sembawang Shipyard in Singapore. The vessel will be equipped with the J-lay tower presently fitted on their lay barge Polaris, hence will they put in service a full field development unit. Finally, Hallin Offshore has been acquired by Superior Energy in the US, and Seajacks International by Riverstone Holdings. The growing demand for windmill installation and maintenance over the past year has led some shipowners to order very specialised vessels. Securing employment for vessels recently delivered, or soon to be delivered, will be challenging, considering most of the major projects have been, or are being put on hold. Once again, Petrobras impressive spending plan will probably help to improve market conditions in 10. As the time of asset opportunities is coming to an end, 10 will likely initiate a fierce battle between the subsea and service support contractors to maintain their market shares, and their access to new valuable installation and construction contracts. In this technology- and asset-driven sector, it is essential that players maintain their investment levels. PSV-aHtS Since the end of 08, shipowners have considerably reduced their PSVS and AHTS newbuilding orders. Nevertheless, a continuous flow of units has been delivered in 09, mainly AHTS 60/80t BP from China, and PSVs ranging from 1,500 dwt to 3,500 dwt. Demand remains on the high side. However, due to the oversupply rates suffered, especially during the last quarter of 09, and the utilisation rate returned to below 85% in the North Sea for the first time since 06. The trend in these markets is still for an increasing sophistication in these types of vessel: DP2 for the most recent additions to the fleet, plus FiFi and, more and more frequently, diesel electric propulsion. While initially it seemed diesel electric propulsion would be reserved for the high end of these markets, it has now become a common requirement in the small and medium size segments. The strategies of the main types of client in this market are different: The Oil Majors are working on cost reduction since the price of a barrel of oil fell back under $80, and are likely to renegotiate some long-term contracts and relationships with regular owners. This could lead to the arrival of new shipowning challengers in areas such as west Africa. They are also looking more closely at the green implications for vessels, and are receptive to ways of reducing the consumption and emission of gas, even in the more extreme cases considering the use of LNG, as is the case in Norway. However, they are not ready to pay a very high price to reach this target. The large National Oil Companies, such as ONGC, Petrobras etc are expanding or renewing their fleets, generally under the form of tenders with a significant local component. The contractors, such as Technip, Acergy and Saipem, which are project-oriented, were more active later in the year, securing tonnage for the coming months for projects which may have been slowed down or postponed, but which are not cancelled. 10 A n n u a l R e v i e w 72 73

76 The offshore and specialised ships market In 09 AL JABER V LCT, sold in 09 to ORTEC SPS Gabon SINCE THE END OF 08, OWNERS HAVE CONSIDERABLY REDUCED THEIR PSV AND AHTS NEWBUILDING ORDERS. Demand was mostly for 80/90t BP tugs rather than for the 100t-plus BP vessels In this market, owners with solid balance sheets and cash resources will have opportunities to buy existing and recent assets from shipowners or financing companies which ordered ships on a speculative basis (especially in north Europe and the Far East). towage 09 continued to see numerous harbour tug boats delivered by shipyards, most of them ordered on a speculative basis, in particular by Turkish shipyards for Turkish owners. At the same time, the reduction in maritime traffic forced tug operators to delay, or even halt their fleet renewal and expansion programmes. This situation led to many speculative owners placing recently-built tugs, including 70/80t BP designs, on the sale and purchase market. TRENDS IN AHTS AVERAGE CHARTER RATES - NORTH SEA /day These opportunities will not help the shipyards to win newbuilding contracts, except for in some of the niche trades such as the Caspian Sea and west coast Africa, using specially designed vessels (eg low draft; winterized vessels). In the terminal tug market, the chartering market was difficult throughout the year as there were few new harbour operations and few new oil and/or gas terminals. Moreover, demand was mostly for 80/90t BP tugs rather than for the 100t-plus BP vessels. These market trends left some of the terminal tugs owned by speculative owners idle, including some of the sophisticated and powerful 100t BP units. TRENDS IN PSV AVERAGE CHARTER RATES - NORTH SEA /day /06 05/06 09/06 01/07 05/07 09/07 01/08 05/08 09/08 01/09 05/09 09/09 01/10 01/06 05/06 09/06 01/07 05/07 09/07 01/08 05/08 09/08 01/09 05/09 09/09 01/10 > 18,000 bhp 15-18,000 bhp 10-15,000 bhp dwt dwt > dwt

77 This will certainly help owners deal with the bollard pull question, ie 80t BP versus 100t BP. Even though there are fewer operators managing 100t BP terminal tugs, these vessels are about 15% more expensive than the 80t BP, and there is not enough demand to support a huge development in this portion of the terminal tug fleet. In this context, it will be increasingly difficult for the shipyards especially the Turkish yards to continue to build on spec and thereafter sell units at a decent price. FRANCHE TERRE Deep freezing purse seiner, delivered by Piriou shipyard to Sapmer in 09 Photo credit: Marcel Mochet/AFP Dredging As we predicted at the end of 08, the decline in activity continued into 09. Offshore civil engineering and vast land reclaim projects scheduled for 10/11 could help secure employment for those very large size hopper units on order, for which finding work otherwise remains a challenge. One has to note that some of the newbuilding units delivered in 09 went on to replace older units. Among the dredging companies, the leading Belgian and Dutch operators are financially healthy and should be able to face 10 without too many problems. In addition, the current low newbuilding prices offer opportunities for longterm development projects, such as fall pipe units and fleet renewal projects in the mediumsize segment. This was to an extent the case when Belgium s JDN took the opportunity to contract two 7,500 cbm THSDs and one DPII side stone dumping vessel in October 09. In the harbour dredging market, the ageing fleet, the development of new demand in some emerging countries, and the size increase in vessels, kept the second hand market quite healthy in 09 which should remain the case in 10. Outlook There are some 435 offshore hulls scheduled for delivery in 10, not counting the slippage from the 09 delivery schedule. This will certainly benefit charterers, who are likely to profit from discounted rates and for longer contract periods. The decline in revenues could also cause major issues between shipowners and their financiers. By contrast, newbuilding cancellations, demolition and lay-ups should provide a positive influence on earnings. Meanwhile, the expenditure and production spending programmes announced so far suggest that investment did indeed bottom out in 09. Thus the general consensus is that 10 will be a transition year, albeit a challenging one, while 11 will bring the first sure signs of a proper recovery. 10 A n n u a l R e v i e w 74 75
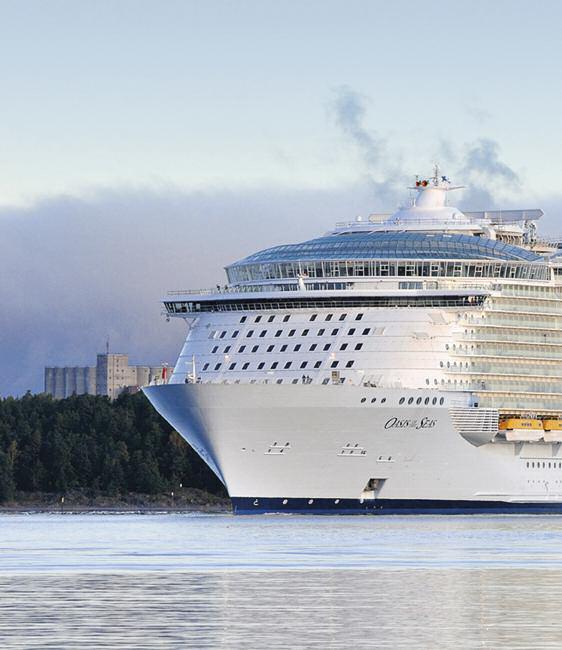
78 Atough

79 THE CRUISE SECTOR DID NOT ESCAPE THE GENERAL DOWNTURN SEEN IN 09, AND IT WAS ONLY BY SIGNIFICANTLY DROPPING THEIR PRICES THAT THE CRUISE COMPANIES MANAGED TO ACHIEVE ACCEPTABLE LOAD FACTORS. This has of course affected the financial results of the companies, most of whom have suspended their investments in the hope of better times to come. OASIS OF THE SEAS Cruise vessel, 225,000 gt, 2,700 cabins, delivered by STX Finland to Royal Caribbean International year! 10 A n n u a l R e v i e w 76 77
80 Le marché de La construction navale en 08 market in 09 The Carnival group, which closes its financial accounts in November, announced a decline in sales from $14.6bn to $13.2bn in 09, and a reduction in profit from $2.3bn to $1.8bn, although this is still a remarkable result given few cruise companies will post positive numbers for 09. At fleet level, the highlight of the year was undoubtedly the delivery of the Oasis of the Seas by STX Europe to Royal Caribbean International. Many superlatives have been used to describe this ship and arguably it represents the first step in the evolution of the cruise ship into a floating resort. The size of the ship will certainly allow for substantial economies of scale, though it has still to be seen if the concept proves popular with customers and no doubt the commercial results will be keenly awaited by the industry. Either way, it remains a highly innovative strategy in a normally conservative industry, and quite a feat at the shipbuilding level. This year Carnival again maintained its undisputed leadership with five new units delivered. Deliveries Nine newbuildings left the shipyards in the course of 09, the same number as the previous year. These ships represent an additional capacity of 23,500 lower berths, compared to the 25,600 introduced in 08. Despite the delivery of the Oasis of the Seas, which marks a new step in the enlargement of cruise ships (with a total capacity of more than 6,300 passengers and 5,400 lower berths), the average size of the vessels delivered in 09 was slightly inferior to 08, mainly due to the completion of two small luxury vessels for Seabourn and Silversea. This year Carnival again maintained its undisputed leadership with five new units delivered: In March, Aida Cruises took delivery of the Aida Luna (1,025 cabins), the third unit in a series of six ordered from Meyer Werft. The remaining three vessels will be built with a slightly higher capacity (approximately 1,100 cabins). In early June, Costa Cruises took simultaneous delivery of two ships from Fincantieri. The Costa Luminosa (1,130 cabins) and Costa Pacifica (1,504 cabins) both joined the fleet of Carnival s Italian subsidiary. Still in the month of June, Seabourn Cruise Line received its first new ship since 1992 with the delivery of the Seabourn Odyssey (225 cabins), the first in a series of three sisterships under construction at Italy s Mariotti and for which the hulls have been sub-contracted to Ci.Mar. (San Giorgio di Nogaro). Finally, in September the Carnival Dream (1,804 cabins), the only new Carnival ship destined for the American market this year, was delivered to Carnival Cruise Line by Fincantieri; it is currently the biggest ship in the Carnival fleet. As in the previous year, two ships joined the RCCL group in 09: Celebrity Cruises took delivery of the Celebrity Equinox (1,426 cabins) from Meyer Werft. It is the second ship in a series of five on order at the German shipyard, with the final three scheduled to join the company s fleet between now and 12. This year all eyes were on the delivery of the Oasis of the Seas (2,704 cabins) by STX Europe (Turku) at the end of October. Its dimensions (225,000 gt, 361m), and the diversity of the facilities onboard, mark a new milestone in the enlargement of cruise ships following on from the Freedom of the Seas delivered in 06 (only 154,000 gt and 339m!). After some difficulties, Royal Caribbean completed financing for the Oasis of the Seas and its sistership the Allure of the Seas, which will be delivered in the autumn of 10, proof that the financial market regained its colour in the course of the second half of the year and that the cruise sector remains an attractive investment to the banks providing it is well managed. By contrast, MSC Cruises took delivery of just one ship in 09, down from two ships in 08: The MSC Splendida (1,675 cabins) was delivered in July, joining its sistership which was delivered at the very end of 08 by the same shipbuilder, STX France (Saint- Nazaire).
 joined its owners fleet in December.")
81 SILVER SPIRIT Cruise vessel, 36,000 gt, 270 cabins, delivered by Fincantieri to Silversea Cruises Finally, a second luxury cruise ship was delivered at the end of the year, this time for Silversea Cruises: The Silver Spirit (270 cabins, close to a tenth of the size of the Oasis of the Seas!) joined its owners fleet in December. Built at Fincantieri s Ancona yard, it is now despite its modest dimensions the biggest ship operated by Silversea, whose previous newbuildings now date back to 00 and 01. new orders A combination of the financial crisis, the overall sluggishness in the market, and the difficulty in finding competitive finance, meant just one order was placed in the course of 09 (against three the previous year), a phenomenon not seen since 01. And it was no surprise that the Carnival group chose Fincantieri as the recipient of this new order, a unit of 1,804 cabins. The new ship will be similar to the Carnival Dream (delivered 09) and will join Carnival Cruise Line in the spring of 12. The dollardenominated contract was signed on terms very favourable to the owner, both in terms of the price and the financing. The total cost per available lower berth equates to us$0,000, a reduction of 15% in dollar terms on the previous ship in the series. Discussions are now underway to expand the Princess Cruises fleet by two new units. There was one particular event which surprised the small world of cruise ship construction in 09: the announcement of a signed letter of intent with South Korean yard Samsung to build a $1.1bn 105,000 gt residential cruise ship for US-based company Utopia Residences. The ship, which will have 0 luxury apartments plus 4 cabins, builds on the first ship of this type, The World, which was launched in 02 with 110 apartments and 88 suites. According to the promoters, the final contract is expected to be signed in mid-10, pending financing. By year-end the situation for the European shipyards had become somewhat worrying, as four orders in two years is insufficient, of course, to provide full employment for those yards specialising in cruise ship construction. The STX Group will deliver its three remaining cruise ships in 10, two from Saint- Nazaire and one from Turku. Meanwhile Fincantieri has a longer orderbook with four ships for delivery in 11 and two in 12, but will nonetheless find it difficult to maintain activity at its four specialised sites. Only Meyer Werft is doing exceptionally well, with a balanced spread of work up to 12 and, most importantly, a diversified client list. 10 will be a crucial year for some of these shipyards! CRUISESHIPS DELIVERED IN 09 AND ORDERBOOK AT END 09 Lower berths ships ships ships ships 3 10 A n n u a l R e v i e w Mariotti STX Europe Meyer Werft Fincantieri 1 0 ships Deliv. in
82 market in 09 the second hand market JUST ONE ORDER WAS PLACED IN THE COURSE OF 09, A PHENOMENON NOT SEEN SINCE 01. It was in the second hand market that the impact of the crisis was perhaps most felt It was in the second hand market that the impact of the crisis was perhaps most felt as there was a significant increase in the number of ship auctions, either by creditors or by legal receivers. This was the case for ships operated by the Dutch company Club Cruises (declared bankrupt at the end of 08), and those operated by Hebridean International Cruises and Adriatic Cruises. All Leisure Holidays, which operates the brands Voyages of Discovery, Seadream Yacht Club and Swan Hellenic, bought the Hebridean Princess (1964, 30 cabins, built as a ferry and converted to a cruise ship in 1989) in April for a price of $2.3m following the bankruptcy of Hebridean International Cruises. In November, All Leisure also snapped up the Alexander Von Humboldt (1990, 266 cabins), which was auctionned after the failure of its previous owner, Club Cruises. The bankruptcy of Hebridean International Cruises also led to the sale of the Hebridean Spirit (01, 40 cabins) in March to private interests who intend to convert the vessel into a yacht. The Costa Europa (1986, 747 cabins) will transfer in April 10 from the Carnival group (Costa Cruises) to Thomson Cruises, by the way of a ten-year bareboat charter with a purchase option attached that can be exercised any time after a period of five years. The Artemis (1984, 594 cabins) was sold in September by P&O Cruises (Carnival group) to Artania Shipping (Phoenix Reisen) with a charter back until April 12, at which time it will join the Phoenix fleet, probably under the name Artania. The purchase option held by Classic International (Arcalia Shipping) with Carige Bank on the Athena (built in 1994 using the hull of the Stockholm of 1948, 250 cabins) was exercised at the beginning of the year. Among the ships sold in the wake of Club Cruises bankruptcy, the Albatros (1973, 412 cabins) was handed over to Phoenix Reisen at the start of the year. Also following the failure of Club Cruises, the Van Gogh (1975, 214 cabins) was sold at auction in June for a price in the region of $6.5m to Salamis. The ship will replace the Salamis Glory and be renamed Salamis Filoxenia. The Flamenco I (1972, 264 cabins) was also put up for sale at auction in March by the Norwegian creditors of Club Cruises, with the ship going to Singapore-based Star Shipping for a price of $3.4m. After being withdrawn from the international market due to its incompatibility with the new SOLAS 10 regulations, the Black Prince (1996, 237 cabins) was sold in October by Fred Olsen for $2.4m to the Venezuelan company Saveca, which will use the ship for coastal cruises under the name Ola Esmeralda. After many twists, Saga Cruises finally bought the Astoria (1981, 304 cabins) at auction in Gibraltar during the summer. The ship will be the subject of a complete upgrade and will be renamed Saga Pearl II. The Oceanic (1965, 552 cabins), operated by Pullmantur (RCCL), was sold to the humanitarian organisation Japan Peace Boat. The Iris (1982, 245 cabins) was sold by Mano Maritime to Kristina Cruises in December. The ship, a former ice-class ro-ro, will be renovated and renamed Kristina Katerina.

83 MSC SPLENDIDA Cruise vessel, 138,000 gt, 1,675 cabins, delivered by STX France to Mediterranean Shipping Cruises the second hand market Surprisingly, the crisis did not prompt a large amont of demolition in 09 and a total of eight ships were scrapped, compared to four the previous year. Furthermore, many of these ships were retired due to the new SOLAS regulations which come into force in 10, rather than the economic climate. The first casualty of SOLAS 10, the Regal Empress (ex- Olympia, 1953), was sold for scrap in March. This was followed by a second fatality, the Glory (ex- Anna Nery, 1962), which was retired from service by Salamis Tours and sold for demolition at the end of the year. Also incompatible with the SOLAS rules, the Saga Rose (ex- Gripsholm, 1965) made its last stop in France in November for Saga Holidays and should finish its career as a floating hotel. After ten years in the cruise casino market, the Golden Princess (ex- Pearl of Scandinavia, 1967) was sold for demolition in September. The Ocean Odyssey (ex- Eros, 1965), arrested in Cochin since the end of 08 following the failure of its marketing in the Indian Ocean, was also sold for demolition in September. Although initially scheduled to be converted to a floating hotel and museum in Hamburg, the Marco Polo II (ex- Hamburg, 1967) was finally sold for demolition in India in February. Following the bankruptcy of Adriatic Cruises, the Dalmacija (1965, 142 cabins) was sold for scrap in Turkey. Finally, the Blue Monarch (1966, 242 cabins), marketed by Monarch Classic Cruises since 07, was sold for scrap in December. As regards companies, we note several changes, in many cases linked to the poor economic conditions during the year. Tour operator Transocean Tours was declared bankrupt in September, which led to the return of the three ships it operated on charter: the Ocean Countess, the Marco Polo and the Astor. The first two vessels have now found alternative employment with a UK tour operator. The Danish group Clipper sold the 50% share it held in International Shipping Partners, which will be 100% owned by its management, although it will keep close links with Clipper. In June, the Carnival group, through its subsidiary Costa, bought out the Orizonia Corp s 25% shareholding in Iberocruceros (a 75/25 joint venture formed between Carnival and Orizonia/Iberojet in the spring of 08). The company easycruise, including the ship easycruise Life (1981, 270 cabins), was sold to Hellenic Seaways. The concept of cheap cruising without service has yet to truly prove itself. Thus at the start of 10 there is considerable anxiety about the ability of some European cruise building yards to survive, failing the emergence of new orders. There are currently few owners in a position to order ships, and the existing building capacity seems in excess of the industry s expected needs in the mediumterm. Over the last ten years, the pace of cruise ship ordering has averaged between 10 and 12 units per year and European shipbuilding production is currently based on this volume, which will be difficult to maintain in the immediate future. Furthermore, there is the added risk of competition from Asian shipbuilders who would like to expand into this area in order to offset a lack of activity in their traditional shipbuilding segments. Building a cruise ship requires a network of sub-contractors and specialist suppliers with an expertise that takes considerable time to acquire. If the order slump persists too long, this could adversely affect the skills and competences in certain areas of Europe. 10 A n n u a l R e v i e w 80 81

84 CMA CGM NABUCCO Containership, 8,500 teu, delivered in 06 by South Korean shipyard Hyundai Ulsan to CMA CGM

85 09 WITNESSED THE WORST DOWNTURN THAT THE INDUSTRY HAS FACED SINCE THE ADVENT OF CONTAINERISATION. CONTAINERISED VOLUMES DWINDLED BY AN ESTIMATED 10% GLOBALLY. Box rates fell to their lowest ever levels, while charter rates hardly paid for daily operating expenses, leaving little or no spare money left to repay capital and interest let alone investors. 10 A n n u a l R e v i e w 82 83
86 Le marché de La construction navale en 08 market in 09 THE LINER OPERATORS ENDED THE YEAR WITH CUMULATIVE OPERATING LOSSES OF CLOSE TO $15BN. Demand is gradually returning, with positive growth expected for 10 Thus the liner operators ended the year with cumulative operating losses of close to $15bn, despite an improvement in the spot market in the second half of the year. Adjustments in capacity led to a reduction of 22% in east-west tonnage supply between October 08 and December 09. By end 09 the idle fleet was hovering around 1.5m teu, while extra-slow steaming kept over 0,000 teu busy that would otherwise have been left idle. Despite these negative developments, investors in the shipping lines appear to be factoring in a recovery in 10, even as some carriers warn that the industry will remain unprofitable in the near future. The outlook for the liner market has improved during the winter period Despite it being the traditional low season, both volumes and freight rates have increased. Meanwhile there has been a stronger-thanexpected surge in demand during the pre-lunar New Year period up to mid-february. Furthermore, extra slow steaming is absorbing excess capacity quicker than anticipated, especially for the larger vessel sizes. A number of positive factors have emerged to support the more optimistic forecasts: Carriers have maintained a degree of pricing discipline despite the overcapacity. High operating losses have made it unsustainable for carriers to continue to reduce rates to gain volume. Carriers are now more ready to withdraw capacity than in the past and relinquish market share given the unprofitable conditions. Supply growth is being managed by carriers, through demolition, delivery deferrals, the layup of surplus vessels, and the return of excess chartered tonnage. The rise in fuel prices (from $0 to $500 per tonne during 09) has also helped absorb a significant part of the excess capacity through extra-slow steaming at the expense of transit times - a trend that has also been encouraged by environmentally-conscious shippers as a way of reducing CO 2 emissions. Demand is gradually returning, with positive growth expected for 10 compared to the 10% decline in container throughput recorded in 09. Investors can also take comfort from the fact that no major carriers have been forced into insolvency to date, despite the difficult trading conditions. Most of the major shipping lines have successfully launched fundraising initiatives, while the more troubled carriers have undergone financial restructurings, enabling them to ride out the worst of the crisis. More than $12bn has been raised by the lines in order to boost their battered balance sheets. EVOLUTION OF CHARTER RATES $ /day (12 month t/c rates) teu teu teu teu 500 teu /04 07/04 01/05 07/05 01/06 07/06 01/07 07/07 01/08 07/08 01/09 07/09 Source: BRS Alphaliner
87 East-west carrying capacity down Duringthe17monthperiodfromAugust08(thepeakofthemarket)toJanuary10,thecapacityonthethree maineast-westroutesfellbyalmost24%,droppingfrom916,000teuperweekto700,000teu. MostaffectedwastheFarEast-Med-Europeroute,whichrecordedafallof25%insupply,against21%forthe FarEast-NorthAmericaroute.The25%fallontheFarEast-Med-Europealonehashadastrongimpacton containershipdemand,asitisalongdistancerouteemploying25%moretonnagethanthefareast-north Americarouteforcomparablecargovolumes. AsfortheEurope-NorthAmericaroute,tonnagesupplyhasfallenby25%,althoughitrepresentsonly30% ofthecapacityoneachoftheothertwoeast-westroutes. the fleet As of 1 st January 10, the cellular fleet stood at 4,719 cellular ships totaling 13,057,000 teu, a rise of just 5.6% compared to a year earlier and the lowest figure in a decade, according to BRS-Alphaliner records. During 09, deliveries of cellular tonnage totalled 269 ships of 1,071,000 teu, while 4 units representing 380,000 teu were scrapped. Only two orders of 1,060 teu were placed in 09, together with four part-cellular conros of 2,9 teu. These have been the only orders in the 15 month period following the collapse of Lehman Bros. During this same period, 350,000 teu has been removed from the orderbook through cancellations or through the conversion of containership orders into tankers or bulkers. The orderbook thus fell to 4,7,000 teu at 1 st January 10, representing 36% of the existing fleet at that time. This is down from the all-time high of 7,100,000 teu recorded 18 months earlier, when the orderbook reached the equivalent of 60% of the existing fleet in the wake of a record wave of orders for 10,000-14,000 teu units. The orderbook still remains imbalanced, with 90% of the capacity on order concentrated on ships over 4,000 teu. The orderbook for ships above 4,000 teu represents a staggering 55% of the existing fleet of this size, while the figure is less than 9% for ships below 4,000 teu. This influx of large ships is having significant consequences on the structure of the market. The fast-increasing VLCS/ULCS fleet is accelerating the concentration of services, particularly on the Far East-North Europe trade. The large ships allow economies of scale and the lowest cost per slot, especially when fuel prices are high. As unemployed VLCS started to pile up in early 09, carriers began to adjust services by closing loops in order to improve their load ratios, using the largest ships wherever possible. Carriers, surprised by the extent of the downturn, reacted strongly after 24 of their largest units were left unemployed in March. Their strategy paid off. The number of idle VLCS dwindled to just half a dozen by the end of June. Evolution of the cellular fleet Year Number Teu Progr ,240 1,718, % ,312 1,857, % ,399 2,016, % ,490 2,213, % ,593 2,396, % ,739 2,662, % ,912 2,990, % ,107 3,369, % ,336 3,877, % ,516 4,298, % 00 2,615 4,528, % 01 2,730 4,957, % 02 2,894 5,569, % 03 3,031 6,137, % 04 3,179 6,683, % 05 3,344 7,326,4 9.6% 06 3,599 8,267, % 07 3,938 9,593, % 08 4,306 10,925, % 09 4,657 12,367, % 10 4,719 13,057, % 11 4,895 14,331, % 12 5,029 15,789, % 13 5,079 16,609, % 14 5,050 16,852, % Source: BRS Alphaliner - Figures are given at 1 st January of each year : Fleet estimates derived from orderbook as at 1 st Jan. 10 with provision for slippage, deferrals and scrapping 10 A n n u a l R e v i e w 84 85

88 market in 09 Thus carriers have optimised their loops to employ their largest ships as far as possible. Since economies of scale rise as bunker prices increase, carriers operating a large fleet of VLCS and ULCS have a distinct advantage in an era of high oil prices. Another positive element for fleet supply is the forecast reduction in deliveries, thanks to deferrals, order cancellations and conversions to other ship types. Scrapping has also helped, with 380,000 teu deleted from the cellular fleet in 09 alone. The demolition figure rises to 450,000 teu for the 15-month period following the banking meltdown. We expect demolition to reach a total of 500,000 teu in the two years to come. These figures are summed up here: Impact of fleet / orderbook moves on the supply at 31 Dec 11 (since 1 st Oct 08) (source : BRS-Alphaliner) Impact of cancellations and conversions (01 Oct Dec 09) : minus 350,000 teu Impact of deferrals of orders on 31 Dec 11 supply : minus 700,000 teu Impact of actual scrappings (01 Oct Dec 09) : minus 450,000 teu Impact of expected scrappings (01 Nov Dec 11) : minus 500,000 teu Total impact (difference in forecasts at 01 Oct 08 and at 31 Dec 09) minus 2,000,000 teu THE INCREASE IN CAPACITY SUPPLY STANDS TODAY AT AN AVERAGE 8.5% PER YEAR FOR The 2m teu difference implies that the total fleet at 31 st December 11 should stand at around 15.8m teu, instead of the 17.9m teu forecast back on 1 st October 08 (factoring in a moderate rate of scrapping). Thus in annual growth terms, the increase in capacity supply stands today at an average 8.5% for (three years), much less than the 13.1% forecasted when the crisis started to unfurl in October 08. Further cuts and slippages are expected. Some small shipyards already affected by significant delays, such as those in Vietnam, may have already lost some orders (ships under 1,500 teu). Other carriers have possibly deferred or cancelled orders without the information filtering out, or will do so in the near future. These additional moves - if confirmed - will further dampen the impact of supply increases. The increase in the bunker price will also bring the supply/demand balance back to equilibrium faster than expected. As we enter an age of expensive oil, the impact will be an enduring one (although it could backfire if the oil price rises too much). Another positive aspect in the short to medium term is the development of currency parities. The strengthening of the Euro against the US dollar appears to be a long-term trend. And with the Asian currencies traditionally tracking the US dollar rather than the Euro, the latter is also appreciating notably against the Asian currencies. A strong Euro will give a boost to European purchases in Asia, with a positive impact on Far East-Europe volumes. In terms of demand for large containerships, this evolution is interesting as the Far East-Europe route is a long distance one, employing roughly 30% more ships than the Far East-US trade for comparable volumes. After all, the strong rise of the Euro in 07 was partly responsible for the capacity bubble observed during the year on the Far East-Europe route, so history could repeat itself although probably not with the same vigor (however, the Greek crisis seen in February 10 is having an adverse impact). These trends, combined with order deferrals, cancellations and scrapping, could lead to the full employment of all ships above 6,000 teu by end 11 based on a moderate growth scenario, and even of all ships above 4,000 teu based on a more optimistic scenario. This conclusion is based on the global fleet structure and does not take into account individual situations. In particular, MSC and CMA CGM may have difficulties employing all their VLCS/ULCS during 10 and 11, while those carriers with few or no VLCS/ULCS on order will not benefit from the same economies of scale and may find it hard to remain competitive.
89 the carriers The three major lines (Maersk, MSC and CMA CGM) may be able to avoid idling or laying up their 5,000-7,000 teu over-panamaxes as they are also heavily involved in the north-south trades and high-volume secondary trades. In addition, they have actively tried to find solutions to maximise the use of their 5,000-7,000 teu units. They could optimize the use of such ships on routes such as Europe-ME-India and also on innovative multitrade east-west loops, in which they replace 4,000-5,000 teu Panamaxes. These latter ships could be shifted to north-south loops, displacing in turn the ships of 2,000-3,500 teu. As these latter ships are often chartered-in vessels on 12 or 24 month contracts, they could be offloaded on the expiry of their charters. This has resulted in a build-up of 2,000-3,000 teu ships which have been redelivered to their owners and are now without good employment prospects. This size range is indeed the most affected, with an idle rate of some 22%. The horizon remains cloudy for these ships, even in the case of a serious recovery. Non-operating LINER OPERATORS "TOP 25" - AT 1 ST JANUARY 10 (Source : BRS-Alphaliner) owners account for more than three quarters of the idle 2,000-3,000 teu fleet. As a side effect of this trend towards deploying larger ships, carriers offering Far East- North Europe services with ships of a limited size (typically 4,000 teu) are often left with no choice but to drop their own services and opt for slot-buying on the remaining services. This has been the case for Zim, PIL and Wan Hai (although Zim could make a comeback later, when it receives sufficient 8,000+ teu newbuildings). The displaced 4,000 teu ships have in turn replaced the 2,500-3,500 teu units on the carriers other services. The three major lines will thus have a definitive advantage once the crisis is over, thanks to the high number of VLCS and ULCS in their fleets and their lower slot costs. In other words, large carriers such as Maersk, MSC, CMA CGM or Zim, who have invested heavily in ships over 10,000 teu (directly and through long-term charters), will have an advantage once their current troubles are hopefully solved. A STRONG EURO WILL GIVE A BOOST TO EUROPEAN PURCHASES IN ASIA, WITH A POSITIVE IMPACT ON FAR EAST-EUROPE VOLUMES. The three major lines will thus have a definite advantage once the crisis is over APM-Maersk Mediterranean Shg Co CMA CGM Group Evergreen Line APL Hapag-Lloyd COSCO Container L. CSCL Hanjin Shipping NY K Line MOL CSAV Group OOCL Yang Ming Line Hamburg Süd Group Zim Hyundai M.M. UASC PIL (Pacific Int. Line) MISC Berhad Wan Hai Lines HDS Lines Sea Consortium RCL (Regional Container L.) Operated fleets Based on existing fleet at January 1 st 10 teu capacity available on board operated ships - All subsidiaries are consolidated - in '000 teu in service in order 10 A n n u a l R e v i e w 86 87
90 the containership market in 09 In terms of cost per slot, a typical Far East-Europe loop run with 13,000 teu ships (neo-panamax), loaded at 95% volume with an average speed of 18.2 knots, provides a saving of around 18% over a similar loop with 8,500 teu ships, and a reduction of 27% over a loop with 6,500 teu ships (taking into account ship costs and container costs, but excluding port and canal dues, handling costs and expenses external to the ships). It is worth noting that the 13,000 teu loop loses its cost advantage when the load ratio falls to 77% - 78% if it is compared with a 8,500 teu loop with a filling ratio of 95%, all other things being equal. So, for the moment, the huge orderbook of big ships is painful. There are too many units and they will continue to cast their long shadow over the market for the next three years. But since most will come onstream regardless, as shipyards are reluctant to cancel them, the market must deal with the situation. And while it is distressing at the moment, many of these large ships should subsequently be regarded as a boon to the carriers that invested in them (viewed from 14-15). In the end, seen from the perspective of the next decade, the crisis will have accelerated the trend towards service concentration, leaving fewer carriers able to compete in the Asia-Europe corridor. Smaller east-west carriers with fewer VLCS, and for many of them no ULCS, will find it harder to compete with the major lines especially on the Far East-Europe route. Furthermore, the opening of the new Panama locks in 14 should also benefit the majors, because they will be able to populate Far East-Caribbean-USEC loops with 10,000-13,000 teu ships without significantly disturbing their Far East-Europe services. This cannot be said of the smaller carriers, even operating in alliances. That said, there are still 17 neo-panamax units of 12,500-13,000 teu which are charter-free, and it is possible some carriers could also order some additional 10,000 teu ships for delivery, assuming the economy recovers in the interim. Operators significant corporate moves in 09 New operators of liner services MajesticEnrichShipping(MES),Malaysia,wasformed and launched a service connecting Singapore to Malaysia. YanghaiShippingCo(YSC),Korea,wasformedbythe formerceoofkmtctooperateintraasiaservices. PacificOrientLine(POL),Taiwan,wasformedto launchaserviceconnectingkaohsiungtoguam andmarianaislands. MBGShipping,SouthAfrica,wasformedtooperate aserviceconnectingsouthafricatoeurope. HDSLines,Iran,wasformedbyIranianintereststo takeoverthecontainershippingactivitiesofirislines. HartmannAsiaLines(HAL),thesingaporearmof germannon-operatingownerhartmannreederei, haslaunchedseveralfeedershuttlesinthebengal Bayareausingin-housetonnage. SEShipping,Singapore(affiliateofSuzlonEnergy, India),haslaunchedaregularmultipurposeservice connectingeuropetooceania,anzandsouthafrica. Cessations of activity in liner shipping SenatorLinie,theGermanaffiliateofHanjinShipping,ceased trading.hanjinshippingtookoverinitsownnametheformer SenatorLinieservices. NewEconLine,Singapore,ceasedtrading. E.P.carriers,Singapore,ceasedtrading. Hull&HatchLines(H&H),Dubai,ceasedtrading. GlobalContainerLines,USA,ceasedtrading. Contenemar,Spain,ceasedtrading. GreatOceanContainerLine(GOCL),HongKong,ceased trading. Bulcon,theliner/containerarmofNavigationMaritimeBulgare, closeditslinerservices. MISCBhd,Malaysia,lefttheFarEast-Europetrade,effective 1January10.ItalsolefttheGrandAllianceasaresult. Significant other moves ContainershipsOY,Finland,acquired100%oftheshares ofturkishcompanycontazmaritimetransport&trades.a Eimskip,Iceland,soldits65%shareinContainershipsOY tocontainerfinanceltdoy,finland.

91 the second hand market for containerships NEDLLOYD BARENTSZ Containership, 5,600 teu, delivered in 00 by Germany's Kvaerner Warnow, owned and operated by Maersk Line Not surprisingly, analysis of the containership market reveals a virtual freeze on sale and purchase activity in 09. A total freeze? Not in terms of volume, since we can still identify 132 second hand sales concluded for further trading. However this figure cannot conceal a profound crisis in the sector, which is reflected in the total amount of sales in price terms. Even if not all transaction prices were reported during the year, we estimate the total value of sales in 09 at around one third of the previous year (based on 154 sales in 08), and as little as a quarter of the value in 07 (based on 225 sales). In the demolition market, a purge started in the segment after the summer of 08 and largely continued throughout the remainder of the year. Close to 190 ships made their final journey either to a beach in India, Pakistan or Bangladesh or to a Chinese shipyard for demolition: in total, more than 300,000 teu was eliminated in 09. Overall, since October 08, 211 cellular ships of 392,400 teu have been scrapped (equivalent to 3% of the global fleet by teu). Another important point to highlight is the fall in the average age of ships demolished, which reached around 27 years in 09. This compares to an average of 30 years in the previous four years. This trend appears to be continuing and it is not unreasonable to expect that the mean could fall to 25 years or less for certain size segments. We also note in this purge that close to 60% of the ships scrapped were over 3,000 teu. Several forecasts predict that the average age of demolition will continue to fall. We can however foresee a slight flattening in this trend due to the exorbitant prices paid by shipowners over the last four years to acquire these ships which were constructed in the early 1990s. As such, many will prefer to put the ships in lay-up, at least for a time, rather than demolish them. Regarding sales for further trading, the abruptness of the market decline completely paralysed shipowner-investors (non-operating owners) during the first half of the year, and less than 30 ships were sold in the course of this period. The global recession, linked to the financial crisis and combined with the crisis specific to the maritime industry, were the main causes of the lacklustre demand. It was only after June that sale and purchase activity tentatively restarted, thanks to price levels that were half or even a third of previous levels for certain ships. WE NOTE THAT CLOSE TO 60% OF THE SHIPS SCRAPPED WERE OVER 3,000 TEU. 10 A n n u a l R e v i e w 88 89
.")
92 market in 09 For some owners such as Eastwind Maritime in the US, the sharp knife of bankruptcy fell, resulting in the sale of its entire container fleet to the Ofer group (15 ships of 1,000 to 2,000 teu built between 1985 and 1992). Similarly Allocean, linked to Australian interests, was forced to sell its 26 ships to Lomar Corp (Logothetis) including seven containerships ranging from 750 teu to 2,500 teu, all built between 1995 and 01. Other owners distinguished themselves this year by selling several units, either to reduce debt and their financial exposure vis-a-vis the banks, or to rationalise their fleets by disposing of ships which no longer fit in with their services. We have already noted that redeliveries alone were not sufficient for some owners/ operators to improve their circumstances. As such, one notes the sale by CMA CGM of seven ships for further trading and five ships for demolition. Symbolic of the fall in values, we can also point to the sale of six 1,700 teu containerships by Cido Shipping at prices ranging from $17.25m to $22m (with charters attached), while these same ships fetched prices of $50m in 07 THE REAL HEADACHE WAS LINKED TO LOAN TO VALUE CLAUSES IMPOSED BY FINANCIERS IN MORTGAGE CONTRACTS. Sale of containerships by size Less than 900 teu inc 43 (18 mpp) 900 teu to 2,000 teu ,000 teu to 3,000 teu More than 3,000 teu total If 09 was a notoriously quiet year for sale and purchase brokers, it has not been the same for the owners or their bankers. The real headache was linked to loan to value clauses imposed by the financiers in the mortgage contracts, which turned out to be deadly for both owners and banks. How to extract oneself from a contract where the market value of the asset has been divided by two or even three, while at the same time the shipowner faces tighter liquidity prohibiting the company from making early payments? And what are the options for the bank in instances where it has the right to seize the ship? A sale? This solution may not be prudent in a market where price levels are the cause of the original problem. Lay-up? A solution which may be more expensive than reaching an amicable agreement with the original mortgage holder. This dilemma weighed, and continues to weigh, heavily on the shoulders of all the players in a sector where the future largely depends on: the number of ships sold for demolition, the development of the fleet in lay-up, the rescheduling of deliveries, the cancellation of orders, and finally the return of confidence to the financial markets. Depending on how these parameters develop, and even with world growth back on track, the road may still be long before the market returns to a state of calm. Until then the natural investment mechanisms will likely remain jammed.

93 MSC TOMOKO Containership, 8,400 teu, delivered in 06 by South Korean shipyard Daewoo to MSC 10 A n n u a l R e v i e w 90 91

94 CIUDAD DE CADIZ Ro-ro/PCTC, 17.5 knots, delivered in 09 by Singapore Technologies Marine, operated by Fret Cetam for the transportation of Airbus components, also able 850 cars on 8 decks Lof ight at the

95 THE FURY UNLEASHED BY THE MARKET REVERSAL IN THE FINAL MONTHS OF 08 CAME INTO FULL SWING DURING THE COURSE OF 09. It featured an oversupply of tonnage in all available sizes, low to zero demand for tonnage, and declining to weak charter rates. the end tunnel? 10 A n n u a l R e v i e w 92 93
96 The ro-ro market in 09 Overall, we can surmise that charter rates dropped % on average. Throughout the year, mean chartering activity plummeted. To stem the tide, operators had no other choice but to overhaul their existing strategies, rationalizing and reorganizing their fleet deployments. Uncompetitive and loss-making routes were shut down. New services and routes were set up in an effort to absorb surplus tonnage, while at the same time creating with mixed results new demand and cargo flows. In order to secure already existing cargo volumes, freight rates were slashed indiscriminately. Where applicable, operations were integrated, maximizing the available synergies. The car market, itself painfully adjusting to continued low sales, was unable to offer any respite. The result was a cutthroat environment, with the weakest players being weeded out and only the strongest surviving but at a high price. Newcomers to the market enjoyed mixed fortunes: some threw in the towel whilst others have weathered the storm, for now. Thefollowingcompanieseitherfiledforbankruptcy,suspendedorceasedoperations:Ersal,VyborgShipping, CS&Partnere,Contenemar,FastmedLine,LogitecLines,AveLine,GlobalContainerLines,andEmroll. Afterthefailureofitstie-upwithDSVduetoanti-trustrestrictions,DFDSpurchasedNorfolkline, inacashandstockdealthatsawapmoller-maersktakeanapproximate30%stakeindfds. TheMediterraneanbasinwasthemaintheatreofactivity,wheredemandfromtheNearEastern andnorthafricancountriessufferedless. Unsurprisingly, sale and purchase activity followed suit, contracting from a peak of 44 deals during 08 to a mere 16 in 09, of which 63% were over the age of 25 years. The tight credit environment meant that most buyers were cash-rich and that overall prices remained low hence why the average age was very high. The exception was Cotunav, whose fleet rejuvenation stepped up a gear with the en bloc purchase of two 00 built, 2,600 lane meter (lm) units (Maersk Voyager and Maersk Vlaardingen) from Norfolkline at a healthy reported price of 32m each. Interestingly enough, Turkish companies were the most active overall, while Greeks and Scandinavians stood on the sidelines. Of the 30 deliveries that were expected during the year, only 10 were actually delivered. Nine units were re-scheduled Acciona s Super Fast Baleares from Navantia; Nor-Cargo s two units from Pinky; Rolldock s Rolldock Sea, Sky and Star from Larsen & Toubro; Seatrans s two units from Pinky and hull 357 from Bharati. Five units were delayed and are now due to be delivered in 10 Tor Jutlandia, Rolldock Sun, Wessex (Odense hull 219), Jose Maria Entrecanales, and Seacargo s hull 358 at Bharati. Three units were cancelled Clipper s Clipper Peak at Huelva; and Spliethoff s Steelca and Woodca at Szczecinska Nowa. In addition, Acciona Trasmediterranea cancelled their third unit from Navantia, which was due to be delivered in 11, while Vyborg Shipping s order for 6 units at Uljanik was cancelled when the former went bankrupt. In line with our predictions, scrappings soared from 16 in 08 to 33 in 09 a 106% surge! The average age of the vessels scrapped was 30.6 years, the average lane meters were 1,122 (based on 30 ships as information was unavailable for three ships) and activity was consistent throughout the year. Once vessels were laid up, the costs of re-activating them exceeded the low charter revenues, making demolition the less costly solution. Primary victims were units in the small/medium size range, i.e. between 600-1,800 lm. CommercialFleetDonbass(CFD)aswellas Latvian ShippingCo.haveexitedthemarketwith thedemolitionoftheirrespectivero-rofleets. Continued low earnings coupled with increasing environmental concerns particularly in connection with the entry into force in July 10 of MARPOL s annex VI lead us to believe that 10 will be another year of high demolition activity. New orders plunged by 83% from a staggering 30 in 08 to five in 09! The latter consists of one unit for Ilshin Enterprise Co. at Dae Sun Shipbuilding and of four deep sea con-ro units able 6,000 lm for Ignazio Messina at Daewoo. None of these five is destined for the tramp market. The potentially positive effect of a gradual correction of newbuilding prices throughout the
97 MAZARINE Ro-ro, 2,900 lm, 18.5 knots, the first in the series of six ConRo 2 ordered by Cobelfret at German shipyard FSG, delivered in June 09 year was more than offset by the tight credit environment, leaving most players reluctant at best but mainly unable to order tonnage. In addition, the depressed charter market ensured that any intentions to order speculatively were stifled at birth. The orderbook for 10 shows that 38 units or 56,000 lm are due to be delivered of which six are destined for the tramp market and are all unfixed. Of these six units, only one is under 1,800 lm (Al Hurreya 3), the rest being between 3,600-3,800 lm. Looking further ahead, 32 ships or 90,000 lm are scheduled for delivery during the course of 11, of which only three units, each able 3,600 lm, do not have employment lined up. This oversupply of larger units will likely exert a downward pressure on the charter rates achievable in this segment. However, more importantly, it is still very much unclear whether demand will be able to absorb this steady flow of supply in its entirety. The answer hinges on the success or failure of the policies fostering the global recovery, particularly in the advanced economies of Europe and its periphery, where the ro-ro market is centered. Considering the daunting challenges that lie ahead for policymakers, we suspect that their rebalancing acts will proceed gradually and with mixed results, translating into another year of low mean chartering activity and weak charter rates. Furthermore, it is unlikely that 10 will see a sharp rise in sale and purchase activity because of lingering credit constraints. Those with deep pockets, however, should be able to find bargains but in a limited number. The substantial fall in Japanese highway tolls and their potential removal during the course of 10 could have devastating effects on their domestic ro-ro market. It is unclear, though, how far the ripple effects will reach because Japan is more a source of second hand car carriers and ferries, not pure ro-ro tonnage, which in most cases is unsuitable for European trading. Within the 1,0-1,800 lm size segment the total fleet stands at 125 units with a total capacity of around 183,000 lm, which represents an approximate 17% fall compared to 08. Representing the backbone of the tramp market, this size segment is not being replenished, but rather continues to shrink. Approximately 46 units, with a total capacity of around 67,000 lm, within this size will be 30 years old by 11, in other words prime candidates for demolition. A critical scarcity looms ahead and when autonomous private demand does recover, we suspect that a market distortion will emerge that will see the remaining tonnage in this size segment earn proportionately more than the larger sizes. The French Ministry of Defense (MOD) and the ARK project, which represents the MODs of Denmark and Germany, are both hard at work to secure future strategic sealift capacity and so far the most likely scenario would see their actions generating orders of newbuilding tonnage in the larger size segments. Due to the concerns we have already expressed about the market s ability to absorb the already existing orderbook, such a development could further aggravate the oversupply situation, even though the deliveries would most likely occur well after 11. Slow steaming has witnessed marginal application because of the nature of ro-ro trades, whilst, in some areas and routes, there appears to be a tendency to switch from accompanied trailers to unaccompanied or drop trailers. Whether this will extend further remains unclear and is perhaps unlikely given the idiosyncrasies of each area and trade. However, even if only some routes currently served with ro-pax tonnage change to pure ro-ro, the most trailer-oriented units are the ones likely to be absorbed. Since most of the larger size segment on order falls into this category, this could perhaps, in part, alleviate their surplus. Based on our previous observations, if the US proceeds with their troop withdrawal from Iraq according to schedule in August 10, we do not expect that this will lead to a sudden hike in demand for ro-ro tonnage, the US flagged fleet having suffered just like the commercial one and being hungry for employment. 10 A n n u a l R e v i e w 94 95
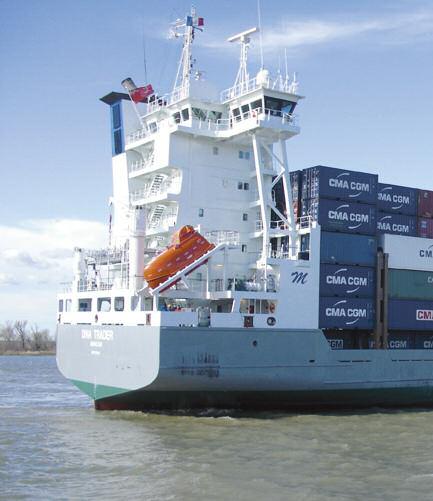
98 The Arm
99 A YEAR AGO WE REMINDED OUR READERS THAT THE MARINE AND TRANSPORT INSURANCE MARKET WILL ALWAYS BE GUIDED BY THE LAWS OF SUPPLY AND DEMAND. AS SUCH, WE PREDICTED THAT THE REDUCTION, EVEN ELIMINATION, OF INSURERS PROFIT MARGINS IN THE WAKE OF THE GLOBAL FINANCIAL CRISIS WOULD INEVITABLY LEAD TO AN INCREASE IN TECHNICAL PREMIUMS AND A REDUCTION IN CAPACITY. This trend could already be observed at the start of 09 in the hull insurance and P&I markets, and to a lesser extent in cargo insurance. DINA TRADER Containership, 868 teu, delivered in 07 by Sietas Shipyard, operated by Myklebusthaug Management AS Wrestle 10 A n n u a l R e v i e w 96 97
100 Le the MARChé MARINe de INSURANCe LA CoNStRUCtIoN NAvALe EN MARKET 08 IN 09 On the face of it, shipowners, charterers (also significantly affected) and other transport professionals enjoyed a relatively stable marine insurance market in 09, with the exception of extra costs related to piracy and a general increase in P&I premiums in February 09. Insurers should still experience a significant fall in premium volumes in 09 compared to 08, mainly as a result of factors related to the financial crisis: lower insured values, reduced transport volumes, unemployed ships etc. However newbuilding deliveries, and the banks (mortgagees ) requirement to maintain sufficient sum insured, moderated the fall in both hull and P&I volumes during the year. Thus the overall decline in transport premium volume of 3.6% recorded in 08 compared to 07 (excluding P&I) should continue in 09. Number of incidents MAJOR AND TOTAL LOSSES IUMI 09 BRUGES Total Serious ex TL Total Loss Hull Insurance Sources: LMIU According to figures published by the International Union of Marine Insurers (IUMI) in September 09, the hull insurance market recorded a 2.4% increase in premium volume in 08 compared to 07. At the same time, there was a sharp drop in the number of total losses and major events during 08 compared to the previous year. However, according to comments reported by the same IUMI companies, Hull insurers have lost money every year since 1997! Note that insurers taken individually do not necessarily give the same speech In the first half of 09, hull insurers generally managed to push through technical increases of around 2.5% - 5% for those shipowners with satisfactory statistical results. Several insurers categorically refused to renew fleets without increasing rates. However, during the second quarter of 09 this trend weakened and the principal objectives of the insurers became: To retain the accounts of those shipowners with satisfactory statistical results (implementing neither increases or decreases). To exclude piracy risk from hull cover, in cases where it was still included. To secure fairly significant premium increases for those shipowners with below average statistical results but a healthy outlook. Finally, to exclude from their portfolios those shipowners which had expanded too quickly in the boom years without the financial means to support this development and for whom financial prospects were fragile. At the same time, insurance brokers were being specifically approached by customers, anxious to reduce their insurance budgets, to negotiate discounts for vessel unemployment and premium reductions to reflect their lower insured values. In this already tight market, with both shipowners and insurers wanting to improve their results (the former through lower premiums, the latter through higher premiums), new insurers also attempted to enter the market (notably in Norway and Asia). Clients also appeared more willing to spread their business, even among new and inexperienced insurers. Thus competition was particularly strong during the year, and it would not be surprising if 09 constituted the 13 th year of losses for hull insurers.
101 War Insurance and Piracy In contrast to hull and machinery, war insurance is currently profitable for insurers and there was fierce competition over premiums in 09. This competition was taking place at a time of high risk, mainly due to the rise of piracy in the Aden Gulf/Indian Ocean and Gulf of Guinea. We have seen in the last months a tendency by hull and machinery insurers to push the piracy risk into war insurance, with war risk insurers accepting such risks subject to potential additional premium or deductibles. However, when the piracy risk is placed within the hull or war policy, one must be aware that ransom payments are not covered! This does not stop hull or war insurers paying a ransom under sue & labour or General Average clauses, but it must be done on a discretionary basis. We would strongly recommend shipowners purchase a special Kidnap & Ransom Insurance as this will pay not only for the ransom, but also for loss of ransom, negotiators fees, medical care for the crew, travel and accommodation costs, salaries, legal liabilities etc Such insurance can be purchased on a transit basis or on a worldwide/annual basis. The Cargo Insurance Market The global financial crisis had a double impact on the cargo insurance market. The combination of lower commodity prices and reduced cargo volumes (European exports fell 10% - %) led to a significant contraction in the overall value covered by cargo insurers. Furthermore, during the year no significant new business emerged to boost demand for insurance. Although the cargo cake was reducing for insurers, most continued to participate in the sector which, over the past decade, has produced the most profitable results in the marine and transport insurance industry. As usual, new players entered the market and, as usual, domestic insurance capacity was able to respond to the new demand, except in the case of a few specific commodity or species lines. Thus competition was strong on the big well-known accounts, which obtained significant premium decreases, while the middle-tier market remained stable. This competition is taking place in a market which showed a 62% combined loss ratio for 08, and thus can withstand some price reductions. We note that during the year charterers showed a marked interest in new products protecting their liabilities against acts of piracy, though this business still remains marginal compared to the overall premium volume. It is difficult to say how 10 will develop: figures issued by the IMF show that in November 09 the worldwide volume 140 % 1 % 100 % 80 % 60 % 40 % % 0 % MARINE HULL AND CARGO/TRANSPORT GROSS ULTIMATE LOSS RATIO AS OF 09 IUMI 09 BRUGES U/W Year 1997 to 08 Marine Hull Cargo/Transport Cargo 05: including US impact (Katrina) Hull 06: Claims incurred 07 attaching to Sources : IUMI Conference in Bruges in 09 (Facts and Figures Committee) of exports returned to levels seen in October 08 (just before the crash) and thus demand for cargo insurance may strengthen in 10. If this is sustained, one can speculate that cargo insurance prices will remain stable while overall income will increase substantially. However if the market remains depressed, the pressure on prices will continue and could spread to the middle-tier market. 10 A n n u a l R e v i e w 98 99
 industry has been preparing itself for the February Club renewal season.")
102 MARKET IN 09 ROYAL ACCORD Capesize bulk carrier, 180,129 dwt, delivered in 09 by the Japanese yard Imabari Saijo, operated by NYK Line The P&I Market The January 1 renewal date has passed and the Protection & Indemnity (P&I) industry has been preparing itself for the February Club renewal season. The recovery in the financial markets has enabled the Clubs to even out the investment losses of the previous year and, despite continued underwriting losses, announce more moderate general increases ranging from 0% to 12.5% (averaging at 4.54%). The Clubs long-held desire to break even on their technical underwriting accounts is coming. This suggests that over recent renewals (which included double-digit increases) the mutual market has been steadily returning to the basic fundamentals of underwriting at breakeven and has decided to rely less on investment income. However this has come at a price for shipowners, as statistics show the cost of P&I insurance has increased considerably over the past 30 years in order to cover shipowners ever increasing exposure. With many shipowners suffering heavily from the economic situation, money has been hard to come by and with the high cost of P&I cover we could see more shipowners (with vessels below 10,000 gt) turning to the fixed premium market. If this happens, such shipowners will retain some of their liability in the desperate hope that no claims are made in the areas where they are not covered. As from February 10, the retention of the P&I Clubs will increase from 7% to 8% per event. Claims in excess of this new level will be pooled among the 13 Clubs of the International Group, which of course benefits from a common reinsurance programme. Trends and prospects for 10 It is unlikely that the global recovery, which seems to be emerging, will be of such a magnitude that it significantly changes the supply/demand relationship in the marine and transport insurance market, a relationship that is currently in the insurance buyers favour. Thus, overall, we can expect a stabilisation in the premium levels, or even a slight softening. Paradoxically, it is probably in the hull & machinery segment that the downward pressure will be the strongest. Newbuilding deferrals, negotiated in the wake of the financial crisis, most probably peaked in 09, while the number of deliveries in 10 and 11 will significantly expand the world fleet. Even if trade recovers, we are unlikely to see a proportional increase in freight rates. As a result, owners will almost certainly put more pressure on hull insurers. However this hypothesis of a stabilisation, or even decline, in the market will only be borne out if the financial crisis does not affect the capacity offered by marine and transport insurers. Have all the insurers accounts been purged? Have all the losses linked to 08 s financial crisis been accounted for? The emergence of problems at a major insurance company, as happened in 08, could reverse the seemingly inevitable downward trend if it forces a reduction in capacity. Prudence remains the name of the game therefore, and this may explain a recent trend towards more litigation between insurers and the insured. It may also be why, despite the favourable market, the movement of accounts to new insurers has been relatively limited and indeed mainly due to the reduced underwriting capacity of some domestic insurers. This report has been prepared by CAP-MARINE Assurances & Réassurances SAS in partnership with Barry Rogliano Salles.
Long Term Trends in Shipbuilding HVB Press Conference. 20 th September 2006 Stephen Gordon, Clarkson Research
 Long Term Trends in Shipbuilding HVB Press Conference 20 th September 2006 Stephen Gordon, Clarkson Research Introduction Background to Shipbuilding Investment The Current Orderbook The Product Mix Regional
This Week s Overview of Shipping Investments SECONDHAND / DEMOLITION / NEW BUILDING MARKET ANALYSIS
 This Week s Overview of Shipping Investments SECONDHAND / DEMOLITION / NEW BUILDING MARKET ANALYSIS Week Ending: 1 st November 2013 (Week 44, Report No: 44/13) (Given in good faith but without guarantee)
Demand, Supply & Capacity in the Shipbuilding Industry
 Demand, Supply & Capacity in the Shipbuilding Industry million dwt Ship completions by region 120 100 80 60 Other Europe Japan Korea China "Europe" includes Russia SOURCE: IHS-Fairplay 40 20 42.3 0 0.4
Petrofin Research Greek fleet statistics
 Petrofin Research 2 nd part of Petrofin Research : Greek fleet statistics In this 2 nd part of Petrofin research, the Greek Fleet Statistics, we analyse the composition of the Greek fleet, in terms of
This Week s Overview of Shipping Investments SECONDHAND / DEMOLITION / NEW BUILDING MARKET ANALYSIS
 This Week s Overview of Shipping Investments SECONDHAND / DEMOLITION / NEW BUILDING MARKET ANALYSIS Week Ending: 15 th November 2013 (Week 46, Report No: 46/13) (Given in good faith but without guarantee)
This Week s Overview of Shipping Investments SECONDHAND / DEMOLITION / NEW BUILDING MARKET ANALYSIS
 This Week s Overview of Shipping Investments SECONDHAND / DEMOLITION / NEW BUILDING MARKET ANALYSIS Week Ending: 8 th November 2013 (Week 45, Report No: 4513) (Given in good faith but without guarantee)
The World s Largest Buyer of Ships and Offshore Assets
 The World s Largest Buyer of Ships and Offshore Assets 9 th Annual Marine Money London Ship Finance Forum, 24 January 218 Evan F. Sproviero, Head of Projects, GMS 1 A. Recycling Prices and Residual Values
18th November 2013 GMS Ship Recycling Conference - Tokyo 1
 18th November 2013 GMS Ship Recycling Conference - Tokyo 1 Agenda 1. Industry Facts 2. Ship recycling Boom and Corrections 3. Ship Recycling: Source of Recovery? 4. Changing Role of Cash Buyer 5. Closing
PETROFIN RESEARCH Greek fleet statistics January 2018 based on data as of end December 2017
 based on data as of end December RESEARCH AND ANALYSIS: GREEK FLEET STATISTICS 2ND PART OF PETROFIN RESEARCH PETROFIN RESEARCH 2 year anniversary of Greek fleet analysis CONTENTS OF PETROFIN RESEARCH PART
WHEN IS THE NEXT SHIPPING BOOM?
 WHEN IS THE NEXT SHIPPING BOOM? By Ravi K Mehrotra CBE Executive Chairman Foresight Group, London Samunder Club April & May 2012 Houston and Florida, USA 1 WHEN IS THE NEXT SHIPPING BOOM? I am not a fortune
IATA ECONOMIC BRIEFING DECEMBER 2008
 ECONOMIC BRIEFING DECEMBER 28 THE IMPACT OF RECESSION ON AIR TRAFFIC VOLUMES Recession is now forecast for North America, Europe and Japan late this year and into 29. The last major downturn in air traffic,
WÄRTSILÄ CORPORATIONO O
 WÄRTSILÄ CORPORATIONO O Handelsbanken Nordic Large Cap Seminar 12 September 2011 CHRISTOPH VITZTHUM GROUP VICE PRESIDENT, SERVICES 1 Wärtsilä This is Wärtsilä SHIP POWER POWER PLANTS SERVICES 2 Wärtsilä
Update on the Constantly Changing Shipbuilding Market
 . Update on the Constantly Changing Shipbuilding Market Martin Stopford, MD Clarkson Research LSE Ship Finance Conference 14 th Nov 2 Martin Stopford, H. Clarkson, Research & Publications Division 12th
Ship Scrapping - Market Pressures. IMSF Oslo Foteini Kanellopoulou, Senior Analyst 23 May 2012
 Ship Scrapping - Market Pressures IMSF Oslo Foteini Kanellopoulou, Senior Analyst 23 May 212 Disclaimer The material and the information contained herein (together, the "Information") are provided by H.
Airlines across the world connected a record number of cities this year, with more than 20,000 city pair connections*
 1 Airlines across the world connected a record number of cities this year, with more than 20,000 city pair connections*. This is a 1,351 increase over 2016 and a doubling of service since 1996, when there
E u r o E c o n o m i c a Issue 1(37)/2018 ISSN:
/2018 ISSN:") Issue 1(37)/2018 ISSN: 1582-8859 An Overview on the Shipbuilding Market in Current Period and Forecast Carmen Gasparotti 1, Eugen Rusu 2 Abstract: The work presents the evolution of the shipbuilding market
Issue 1(37)/2018 ISSN: 1582-8859 An Overview on the Shipbuilding Market in Current Period and Forecast Carmen Gasparotti 1, Eugen Rusu 2 Abstract: The work presents the evolution of the shipbuilding market
GROUP ULJANIK PLOVIDBA CONSOLIDATED AUDITED FINANCIAL STATEMENTS FOR THE PERIOD JANUARY - DECEMBER 2014
 GROUP ULJANIK PLOVIDBA CONSOLIDATED AUDITED FINANCIAL STATEMENTS FOR THE PERIOD JANUARY - DECEMBER 2014 Pula, April 2015 CONTENT: Consolidated audited Financial Statements of GROUP ULJANIK PLOVIDBA with
Quarterly Aviation Industry Performance
 Quarterly Aviation Industry Performance ALAFCO Aviation Lease and Finance Company K.S.C.P. Quarterly Aviation Industry Performance 3Q17 (Updated November 17) Prepared by: Strategic Planning department
AIR TRANSPORT MARKET ANALYSIS MAY 2011
 AIR TRANSPORT MARKET ANALYSIS MAY 2011 KEY POINTS May saw a renewed expansion in both air travel and freight, after a soft patch during the previous three months. Air travel volumes were 6.8% higher than
Greek Shipping : Greece s steaming force
 Greek Shipping : Greece s steaming force Dr. Nikolas P. Tsakos President & CEO 1 Tsakos Energy Navigation, Ltd A New York Stock Exchange Listed Company WORLD FLEET by the nationality of owner WORLD FLEET
IUMI 2005 Amsterdam Facts & Figures Committee
 Report on Marine Insurance Premium 23 and 24 IUMI 25 Amsterdam Facts & Figures Committee Tore Forsmo, Managing Director Astrid Seltmann, Analyst The Central Union of Marine Underwriters, Oslo, Norway Thanks
2012 RESULT PRESENTATION
 212 RESULT PRESENTATION BJÖRN ROSENGREN, PRESIDENT & CEO 25 JANUARY 213 Wärtsilä Net sales back to growth with stable profitability 212 development Order intake EUR 4,94 million, +9% Net sales EUR 4,725
Dry Bulk Market Weekly Highlights Week 17 - Dry Cargo Market Highlights for the period of 21-April-2011 until 28-April-2011
 Dry Bulk Market ly Highlights 17 - Dry Cargo Market Highlights for the period of 21-April-211 until 28-April-211 17 28/4/211 Baltic Indices / Dry Bulk Spot Rates 16 21/4/211 ±% $/day $/day Point Diff 211
«Να κάνουμε την κρίση ευκαιρία" Ανάλυση των αγορών Bulkers & Tankers
 «Να κάνουμε την κρίση ευκαιρία" Ανάλυση των αγορών Bulkers & Tankers Aδελφότης των Υδραίων Αθηνών 3ο Ναυτιλιακό Συνέδριο Σεπτέμβριος 2011 Section 1: Dry Bulkers Presentation Contents Dry Bulker fleet overview:
THE PROFESSIONALS ADVISORS & SUPERVISORS FOR NEWBUILDINGS
 GAINS Inc. THE PROFESSIONALS ADVISORS & SUPERVISORS FOR NEWBUILDINGS GAINS Inc. ADVISORS & SUPERVISORS THE PROFESSIONALS FOR NEWBUILDINGS COMPANY S PROFILE INDEX SCOPE OF BUSINESS / VISION EXISTING CLIENTELE
COSCO CORPORATION. (SINGAPORE) LTD FY2003 Full Year Results. Presentation
 LTD FY2003 Full Year Results. Presentation") COSCO CORPORATION (SINGAPORE) LTD FY2003 Full Year Results Presentation 11 February 2004 1 Outline of Presentation 1. Background & Corporate Restructuring Exercise 2. Operations Review 3. Financial Review
COSCO CORPORATION (SINGAPORE) LTD FY2003 Full Year Results Presentation 11 February 2004 1 Outline of Presentation 1. Background & Corporate Restructuring Exercise 2. Operations Review 3. Financial Review
IATA ECONOMICS BRIEFING AIRLINE BUSINESS CONFIDENCE INDEX OCTOBER 2010 SURVEY
 IATA ECONOMICS BRIEFING AIRLINE BUSINESS CONFIDENCE INDEX OCTOBER SURVEY KEY POINTS Results from IATA s quarterly survey conducted in October show business conditions continued to improve during the third
MAXIMUM LEVELS OF AVIATION TERMINAL SERVICE CHARGES that may be imposed by the Irish Aviation Authority ISSUE PAPER CP3/2010 COMMENTS OF AER LINGUS
 MAXIMUM LEVELS OF AVIATION TERMINAL SERVICE CHARGES that may be imposed by the Irish Aviation Authority ISSUE PAPER CP3/2010 COMMENTS OF AER LINGUS 1. Introduction A safe, reliable and efficient terminal
Managing through disruption
 28 July 2016 Third quarter results for the three months ended 30 June 2016 Managing through disruption 3 months ended Like-for-like (ii) m (unless otherwise stated) Change 30 June 2016 30 June 2015 change
Golden Ocean Group Limited Q results March 1, 2007
 Golden Ocean Group Limited Q4 2006 results March 1, 2007 PROFIT & LOSS 2005 2006 (in thousands of $) 2006 2005 Oct-Dec Oct-Dec Jan - Dec Jan - Dec Operating Revenues 37 292 91 253 Time charter revenues
EASYJET INTERIM MANAGEMENT STATEMENT FOR THE QUARTER ENDED 31 DECEMBER 2010
 20 January 2011 easyjet Interim Management Statement Page 1 of 5 20 January 2011 EASYJET INTERIM MANAGEMENT STATEMENT FOR THE QUARTER ENDED 31 DECEMBER 2010 Highlights: Total revenue up by 7.5% to 654
The role of the Cash Buyer
 The role of the Cash Buyer 18th November 2013 GMS Tokyo Conference on Ship Recycling 1 Agenda 1. Cash Buyers and their expertise in the ship recycling industry 2. The Changing Role of a Cash Buyer 3. Meeting
QANTAS DELIVERS STRONG FIRST HALF RESULT DESPITE HIGHER FUEL BILL
 ASX and Media Release Sydney, 21 February 2019 QANTAS DELIVERS STRONG FIRST HALF RESULT DESPITE HIGHER FUEL BILL Underlying Profit Before Tax: $780 million (down $179 million) Statutory Profit Before Tax:
Aircraft industry takes off while air transport remains grounded
 Aircraft industry takes off while air transport remains grounded Ludovic Subran, Chief Economist Aéronautique: l industrie en mode supersonique, le transport en mode planeur Yann Ludovic Subran, Lacroix,
ANNUAL REVIEW SHIPPING AND SHIPBUILDING MARKETS
 SHIPPING AND SHIPBUILDING MARKETS Contents THE DRY BULK SHIPPING MARKET P 22 THE SHIPBUILDING MARKET P 04 THE TANKER MARKET P 34 THE CHEMICAL CARRIER MARKET P 48 THE LPG AND CHEMICAL GAS SHIPPING MARKET
% change vs. Dec ALL VISITS (000) 2,410 12% 7,550 5% 31,148 1% Spend ( million) 1,490 15% 4,370-1% 18,710 4%
 2,410 12% 7,550 5% 31,148 1% Spend ( million) 1,490 15% 4,370-1% 18,710 4%") HEADLINES FULL YEAR 2012 (PROVISIONAL) 1 Overall visits 31.148 million visits making 2012 the best year for inbound tourism since 2008 but not a record. 1% increase in visits on 2011 (30.798 visits) slightly
HEADLINES FULL YEAR 2012 (PROVISIONAL) 1 Overall visits 31.148 million visits making 2012 the best year for inbound tourism since 2008 but not a record. 1% increase in visits on 2011 (30.798 visits) slightly
HIA-RP Data Residential Land Report
 HIA-RP Data Residential Land Report March Qtr 29 Land s Back on the Rise The latest HIA-RP Data Residential Land Report highlights a rebound in raw land values following some moderation over 28. Median
INTERIM REPORT JANUARY-JUNE 2012 BJÖRN ROSENGREN, PRESIDENT & CEO 18 JULY 2012
 INTERIM REPORT JANUARY-JUNE 212 BJÖRN ROSENGREN, PRESIDENT & CEO 18 JULY 212 Highlights Q2/212 Order intake EUR 1,198 million, +2% Net sales EUR 1,99 million, +6% Book-to-bill 1.9 (1.13) EBIT EUR 113 million,
SHIP MANAGEMENT SURVEY. January June 2018
 CENTRAL BANK OF CYPRUS EUROSYSTEM SHIP MANAGEMENT SURVEY January June 2018 INTRODUCTION The Ship Management Survey (SMS) is conducted by the Statistics Department of the Central Bank of Cyprus and concentrates
PETROFIN RESEARCH Greek shipping companies January 2018 based on data as of December 2017
 1 2017 RESEARCH AND ANALYSIS: GREEK SHIPPING COMPANIES 1ST PART OF 2017 PETROFIN RESEARCH Petrofin Research are pleased to announce the release of the first part of their 2017 Greek Shipping research.
I The shipping market contents ISL
 Comment - Charts and Tables concerning The Shipping Market World Merchant Fleet Tanker Market Bulk Carrier Market Tab. 1 Additions/Reductions by Ship Types 2014-2016 and up to June 2017... III Tab. 2 Size
IATA ECONOMIC BRIEFING FEBRUARY 2007
 IATA ECONOMIC BRIEFING FEBRUARY 27 NEW AIRCRAFT ORDERS KEY POINTS New aircraft orders remained very high in 26. The total of 1,834 new orders for Boeing and Airbus commercial planes was down slightly from
Handelsbanken Nordic Large Cap Seminar
 Handelsbanken Nordic Large Cap Seminar BJÖRN ROSENGREN, PRESIDENT AND CEO 10 SEPTEMBER 2012 Wärtsilä This is Wärtsilä POWER PLANTS SHIP POWER SERVICES 2 Wärtsilä Global net sales - top 10 countries Norway
Land area 1.73 million km 2 Queensland population (as at 31 December 2017) Brisbane population* (preliminary estimate as at 30 June 2017)
 Brisbane population* (preliminary estimate as at 30 June 2017)") Queensland - 11 Queensland OVERVIEW Queensland is nearly five times the size of Japan, seven times the size of Great Britain, and two and a half times the size of Texas. Queensland is Australia s second
Queensland - 11 Queensland OVERVIEW Queensland is nearly five times the size of Japan, seven times the size of Great Britain, and two and a half times the size of Texas. Queensland is Australia s second
(ships destined for scrap went for trading)
") Ship Recycling Trends, Developments & Outlook July 23, 2009 Ship Recycling: Trends, Developments & Outlook 1 Ship-Recycling: From 2004 late 2008 Slowest periods in history of ship recycling More than 5-fold
Ship Recycling Trends, Developments & Outlook July 23, 2009 Ship Recycling: Trends, Developments & Outlook 1 Ship-Recycling: From 2004 late 2008 Slowest periods in history of ship recycling More than 5-fold
Worldwide Fleet Forecast
 Worldwide Fleet Forecast Presented to: Montreal June 6, 26 DAVID BECKERMAN Director, Consulting Services Agenda State of the Industry Worldwide Fleet Regional Jets Narrowbody Jets Large Widebody Jets Freighter
IATA ECONOMICS BRIEFING
 IATA ECONOMICS BRIEFING NEW AIRCRAFT ORDERS A POSITIVE SIGN BUT WITH SOME RISKS FEBRUARY 26 KEY POINTS 25 saw a record number of new aircraft orders over 2, for Boeing and Airbus together even though the
WÄRTSILÄ CORPORATION
 WÄRTSILÄ CORPORATION INTERIM REPORT JANUARY-JUNE 214 18 JULY 214 Björn Rosengren, President & CEO Wärtsilä Highlights Q2/214 NEW PIC Order intake EUR 1,163 million, +9% Net sales EUR 1,132 million, -2%
Quarterly Aviation Industry Performance
 Quarterly Aviation Industry Performance ALAFCO Aviation Lease and Finance Company K.S.C.P. Quarterly Aviation Industry Performance (March - June 17) Prepared by: Strategic Planning department 1 Quarterly
SHIP MANAGEMENT SURVEY. July December 2017
 SHIP MANAGEMENT SURVEY July December 2017 INTRODUCTION The Ship Management Survey is conducted by the Statistics Department of the Central Bank of Cyprus and concentrates primarily on transactions between
Globus Maritime Limited Trading Update and Financial Highlights for the Three Months and Nine Months Ended September 30, 2007.
 Globus Maritime Limited Trading Update and Financial Highlights for the Three Months and Nine Months Ended September 30, 2007. Athens, Greece, November 15, 2007. Globus Maritime Limited (AIM: GLBS), a
Hans-Peter Ring EADS Chief Financial Officer. Cowen Conference February 8 th 2012
 Hans-Peter Ring EADS Chief Financial Officer Cowen Conference February 8 th 2012 Safe Harbour Statement 2 Disclaimer This presentation includes forward-looking statements. Words such as anticipates, believes,
SHIP POWER YOUR SHORTER ROUTE TO BIGGER PROFITS. JAAKKO ESKOLA Group Vice President, Ship Power
 SHIP POWER YOUR SHORTER ROUTE TO BIGGER PROFITS Group Vice President, Ship Power 1 Wärtsilä 29 March 2012 Shipping has a future 90% of world trade is still done by sea NO SUPRISE it doesn t cost a thing
Market Commentary. Greece s Shipping Sector: Overview and Outlook
 Market Commentary November 10, 2010 Greece s Shipping Sector: Overview and Outlook Overview Greece is a maritime nation by tradition and is one of the world's largest shipping powers. Greek shipping is
ASL Marine Holdings Ltd.
 ASL Marine Holdings Ltd. SHIPBUILDING SHIPREPAIR SHIPCHARTERING Pulse of Asia 2008 - Presentation 8 th July 2008 1 Presentation Outline Company Profile 9M FY2008 Financial Review Business Review - Shipbuilding
GOLDEN DESTINY MONTHLY NEWBUILDING REPORT
 ISSUE NO.04/2013 APRIL 2013 MONTHLY NEWBUILDING REPORT ORDERING ACTIVITY (per vessel type) by Greek and Foreign Owners GOLDEN DESTINY MONTHLY NEWBUILDING REPORT highlights the volume of transactions in
Press Release. Bilfinger 2017: Stable foundation laid for the future
 Press Release February 14, 2018 Bilfinger 2017: Stable foundation laid for the future Organic growth in orders received after three years of decline Trend reversal: Output volume better than expected Growth
Air China Limited Announces 2010 Annual Results
 Air China Limited Announces 2010 Annual Results Profit reaches record high on strong economic growth Hong Kong March 29, 2011 Air China Limited ( Air China or the Company, together with its subsidiaries,
Danish Shipping. Facts and Figures. June 2018
 Danish Shipping Facts and Figures June 2018 2 Table of Contents 1. Danish Shipping Industry 4 The Danish Merchant Fleet 4 Danish Shipping Exports 6 Employment 8 CEO Survey 10 2. Global Merchant Fleet 12
2015 RESEARCH AND ANALYSIS: GREEK FLEET STATISTICS 2ND PART OF 2015 PETROFIN RESEARCH CONTENTS OF PETROFIN RESEARCH PART 2
 based on data as of September RESEARCH AND ANALYSIS: GREEK FLEET STATISTICS 2ND PART OF CONTENTS OF PART 2 RESULTS AT A GLANCE (P. 2) SECTION A: VITAL STATISTICS OF THE ENTIRE GREEK FLEET (P. 3) SECTION
Airbus. Tom Enders Airbus. 15 & 16 December 2011
 Airbus Tom Enders Airbus Global Investor Forum Global Investor Forum 15 & 16 December 2011 Safe Harbour Statement 2 Disclaimer This presentation includes forward-looking statements. Words such as anticipates,
AIR TRANSPORT MARKET ANALYSIS APRIL 2011
 AIR TRANSPORT MARKET ANALYSIS APRIL 2011 KEY POINTS From this month we provide an assessment of global scheduled air transport markets, adding domestic to international, and including both IATA and non-iata
US $ 1,800 1,600 1,400 1,200 1,000
 IATA ECONOMIC BRIEFING JULY 9 INFRASTRUCTURE COSTS SUMMARY Historical data indicates that during recession periods infrastructure providers usually increase their prices while other prices are falling
Media Release. Qantas Group Full Year 2017 Financial Result 1. Sydney, 25 August 2017
 Media Release Qantas Group Full Year 2017 Financial Result 1 Sydney, 25 August 2017 Underlying Profit Before Tax: $1,401 million (second highest in Qantas history) Statutory Profit Before Tax: $1,181 million
S&P Market Trends during December: Secondhand Newbuilding Demolition
 This Week s Overview of Shipping Investments SECONDHAND / DEMOLITION / NEW BUILDING MARKET ANALYSIS Week Ending: 13 th December 2013 (Week 50, Report No: 50/13) (Given in good faith but without guarantee)
FY 2013 Nippon Paint Group Analysts' Meeting for Financial Results of First Half FY 2013
 FY 2013 Nippon Paint Group Analysts' Meeting for Financial Results of First Half FY 2013 November 18, 2013 Nippon Paint Co., Ltd. Disclaimer The forward-looking statements in this document are based on
Thank you for participating in the financial results for fiscal 2014.
 Thank you for participating in the financial results for fiscal 2014. ANA HOLDINGS strongly believes that safety is the most important principle of our air transportation business. The expansion of slots
Tanker Market Outlook. 12th Mare Forum Ship Finance 2012 Foteini Kanellopoulou, Senior Analyst Amsterdam, 31 October 2012
 Tanker Market Outlook 12th Mare Forum Ship Finance 212 Foteini Kanellopoulou, Senior Analyst Amsterdam, 31 October 212 Tanker Market Outlook 12th Mare Forum Ship Finance 212 Disclaimer The material and
Interim Report 6m 2014
 August 11, 2014 Interim Report 6m 2014 Investors and Analysts Conference Call on August 11, 2014 Joachim Müller, CFO Latest ad-hoc release (August 4, 2014) Reduction of forecast, primarily due to a further
Ship Recycling: The last pillar of shipping. February 22, nd Annual Capital Link Greek Shipping Forum 1
 Ship Recycling: The last pillar of shipping February 22, 2011 2 nd Annual Capital Link Greek Shipping Forum 1 Where do old ships go? Indian subcontinent India, Bangladesh and Pakistan China Turkey February
AEROFLOT ANNOUNCES FY 2017 IFRS FINANCIAL RESULTS
 AEROFLOT ANNOUNCES FY 2017 IFRS FINANCIAL RESULTS Moscow, 1 March 2018 Aeroflot Group ( the Group, Moscow Exchange ticker: AFLT) today publishes its audited financial statements in accordance with International
LEAVING THE RED Creating a profitable airline
 Despite airline industry growth over decades, the majority of airline businesses remain consistently unprofitable over an entire business cycle. - Ganna Demydyuk, Choosing financial KPI in the Airline
Survey on Employment in European Shipbuilding Countries. - Selected Results -
 AgS-Monitoring Shipbuilding Survey on Employment in European Shipbuilding Countries - Selected Results - Sector Committee Shipbuilding 04.05.2015 - Brussels Thorsten Ludwig Industry Related Developments
Index of business confidence. Monthly FTK (Billions) Aug 2013 vs. Aug 2012 YTD 2013 vs. YTD 2012 Aug 2013 vs. Jul 2013
 Aug 2013 vs. Aug 2012 YTD 2013 vs. YTD 2012 Aug 2013 vs. Jul 2013") AIR PASSENGER MARKET ANALYSIS AUGUST 2013 KEY POINTS Air travel markets expanded strongly in August. Global revenue passenger kilometers were up 6.8% compared to a year ago, an improvement on July growth
AIR PASSENGER MARKET ANALYSIS AUGUST 2013 KEY POINTS Air travel markets expanded strongly in August. Global revenue passenger kilometers were up 6.8% compared to a year ago, an improvement on July growth
WÄRTSILÄ CORPORATION
 WÄRTSILÄ CORPORATION UBS PAN EUROPEAN SMALL & MIDCAP CONFERENCE RAIMO LIND, EVP & CFO 19 MAY 211 1 Wärtsilä Q1/11 Highlights Net sales EUR 1,83 million, +18% Order intake EUR 979 million, +11% Operating
Land area 1.73 million km 2 Queensland population (December 2015) Brisbane population* (June 2015)
 Brisbane population* (June 2015)") Queensland - 18 Queensland OVERVIEW Queensland is nearly five times the size of Japan, seven times the size of Great Britain, and two and a half times the size of Texas. Queensland is Australia s second
Queensland - 18 Queensland OVERVIEW Queensland is nearly five times the size of Japan, seven times the size of Great Britain, and two and a half times the size of Texas. Queensland is Australia s second
Final Results 31 December 2013
 Final Results 31 December 2013 Clarkson PLC 10 March 2014 www.clarksons.com Agenda Headline results Divisional performance Business Model & Strategy The market Outlook 10 March 2014 Final Results www.clarksons.com
HK GAAP RESULTS RELEASE 25 February 2008 STAR CRUISES GROUP ANNOUNCES FOURTH QUARTER AND FULL YEAR RESULTS FOR 2007
 HK GAAP RESULTS RELEASE 25 February 2008 FOR IMMEDIATE RELEASE INTERNATIONAL STAR CRUISES GROUP ANNOUNCES FOURTH QUARTER AND FULL YEAR RESULTS FOR 2007 Key points for the quarter in comparison with 4Q
FIRST QUARTER OPERATING PROFIT IMPROVES TO $274 MILLION
 1 August 2006 Page 1 of 4 No. 03/06 1 August 2006 FIRST QUARTER OPERATING PROFIT IMPROVES TO $274 MILLION HIGHLIGHTS OF THE GROUP S PERFORMANCE 1st Quarter 2006-07 Year-on-Year % Change Operating revenue
SLOW STEAMING A transientt fashion or here to stay?
 SLOW STEAMING A transientt fashion or here to stay? Modern box vessels cruising slower than ships in the era of sail... Dynamar B.V. Noorderkade 1G 1823 CJ ALKMAAR The Netherlands Phone: +31 725147400
COMMISSION OF THE EUROPEAN COMMUNITIES SIXTH REPORT FROM THE COMMISSION TO THE COUNCIL ON THE SITUATION IN WORLD SHIPBUILDING
 COMMISSION OF THE EUROPEAN COMMUNITIES Brussels, 13.11.2002 COM(2002) 622 final SIXTH REPORT FROM THE COMMISSION TO THE COUNCIL ON THE SITUATION IN WORLD SHIPBUILDING TABLE OF CONTENTS 1. Introduction...3
Land area 1.73 million km 2 Queensland population (as at December 2016) Brisbane population* (preliminary estimate as at 30 June 2016)
 Brisbane population* (preliminary estimate as at 30 June 2016)") Queensland - 11 Queensland OVERVIEW Queensland is nearly five times the size of Japan, seven times the size of Great Britain, and two and a half times the size of Texas. Queensland is Australia s second
Queensland - 11 Queensland OVERVIEW Queensland is nearly five times the size of Japan, seven times the size of Great Britain, and two and a half times the size of Texas. Queensland is Australia s second
PROFIT OF $1.24b ON STRONG REVENUE GAINS BUT FUEL COSTS REMAIN GREATEST CHALLENGE
 PROFIT OF $1.24b ON STRONG REVENUE GAINS BUT FUEL COSTS REMAIN GREATEST CHALLENGE HIGHLIGHTS OF THE GROUP S PERFORMANCE Financial Year 2005-06 4th Quarter 2005-06 Apr 2005 Mar 2006 Year-on-Year % Change
WÄRTSILÄ CORPORATION RESULT PRESENTATION JANUARY Björn Rosengren, President & CEO. Wärtsilä
 WÄRTSILÄ CORPORATION RESULT PRESENTATION 2014 29 JANUARY 2015 Björn Rosengren, President & CEO Wärtsilä Highlights 2014 good performance in challenging markets Order intake EUR 5,084 million, +5% Net sales
$168 MILLION PROFIT FOR FIRST HALF
 2 November 2012 Page 1 of 4 No. 05/12 02 November 2012 $168 MILLION PROFIT FOR FIRST HALF GROUP FINANCIAL PERFORMANCE First Half 2012-13 The SIA Group registered a net profit of $168 million in the first
TARIFF OF HARBOUR DUES
 PORT OF GDYNIA AUTHORITY S.A. JOINT-STOCK COMPANY TARIFF OF HARBOUR DUES Valid from 1 July 2007 The Tariff established by the Port of Gdynia Authority, S.A. under Resolution no. 168/II/2004 of 18 August
AIR TRANSPORT MARKET ANALYSIS JULY 2011
 AIR TRANSPORT MARKET ANALYSIS JULY 2011 KEY POINTS Despite an increasingly gloomy economic outlook, air travel continued to expand at a pace close to trend in July, to a level 5.9% higher than a year earlier.
FONASBA ANNUAL MEETING. The containership market. Centro de Navegación n (Argentina)
") FONASBA ANNUAL MEETING The containership market Centro de Navegación n (Argentina) Eng.. Rodolfo García a Piñeiro Lima, October 2013 Overview 2012 (general) 2012 not a year to remember in the shipping
FONASBA ANNUAL MEETING The containership market Centro de Navegación n (Argentina) Eng.. Rodolfo García a Piñeiro Lima, October 2013 Overview 2012 (general) 2012 not a year to remember in the shipping
PREMIUM TRAFFIC MONITOR JULY 2014 KEY POINTS
 PREMIUM TRAFFIC MONITOR JULY 2014 KEY POINTS Growth in international air passengers was weak for a second consecutive month with a 2.6% increase in July compared to a year ago premium seat numbers rose
a twilight year for liner shipping
 The container ship market in 2016 a twilight year for liner shipping Jan Tiedemann senior analyst liner shipping and ports Alphaliner container fleet snapshot: August 2016 no. of cellular ships: 5,160
Cathay Pacific Airways Cathay Pacific Airways 2008 Annual Results Investor Relations Meeting 11 March June 2009
 Cathay Pacific Airways Cathay Pacific Airways 2008 Annual Results Investor Relations Meeting 11 March 2009 22 June 2009 Airline Strategy Continue to grow our extensive international network, expand frequencies
2009 Business Aviation Outlook
 2009 Business Aviation Outlook 23 rd Year of Survey, 18 th consecutive public report release 1,200 Corporate flight departments from around the world Aircraft Manufacturers and other sources 5 year purchase
MONTHLY MARKET OVERVIEW
 MONTHLY MARKET OVERVIEW 1 st 28 th February 219 SUMMARY OF CONTENT Value analysis Total second hand S&P activity Newbuilding activity Demolition activity Charter rate analysis +44 () 23 26 5555 vesselsvalue.com
2009 Business Aviation Outlook
 2009 Business Aviation Outlook 2009 Business Aviation Outlook 23 st Year of Survey, 18 th consecutive public report release 1,200 Corporate flight departments from around the world Aircraft Manufacturers
MONTHLY NEW BUILDING REPORT
 MONTHLY NEW BUILDING REPORT February 2006 Newbuilding Prices Chart $140,00 $120,00 $100,00 $80,00 $60,00 $40,00 $20,00 $0,00 8/1/04 9/1/04 10/1/04 11/1/04 12/1/04 1/1/05 2/1/05 3/1/05 4/1/05 5/1/05 6/1/05
Domestic, U.S. and Overseas Travel to Canada
 Domestic, U.S. and Overseas Travel to Canada Short-Term Markets Outlook Second Quarter 2007 / Executive Summary Prepared for: The Canadian Tourism Commission (CTC) By: February 2007 www.canada.travel Background
QANTAS HALF YEAR 2015 FINANCIAL RESULTS 1
 QANTAS HALF YEAR 2015 FINANCIAL RESULTS 1 Key points: Underlying Profit Before Tax: $367 million Statutory Profit After Tax: $206 million Transformation benefits: $374 million Comparable unit cost reduction:
KOPONEN VICE PRESIDENT, FINANCE & CONTROL, SHIP POWER
 WÄRTSILÄ IN CHINA KEVA trip to Shanghai TIMO KOPONEN VICE PRESIDENT, FINANCE & CONTROL, SHIP POWER 7.11.2011 1 Wärtsilä Agenda What is Wärtsilä today? Where is ship building today? Why Wärtsilä is in China?
Half-yearly Report 2013
 Half-yearly Report 2013 Financial result unchanged PORT OF ROTTERDAM THROUGHPUT DECREASED SLIGHTLY Throughput in the port of Rotterdam in the first half of the year decreased by 0.9% compared to the first
Finnair Q Result
 17 August 2016 CEO Pekka Vauramo CFO Pekka Vähähyyppä Finnair Q2 2016 Result 1 Highlights of the second quarter The seventh consecutive quarter of profit improvement Fukuoka & Guangzhou route openings