ASL Marine Holdings Ltd.
|
|
|
- Janis Barber
- 5 years ago
- Views:
Transcription
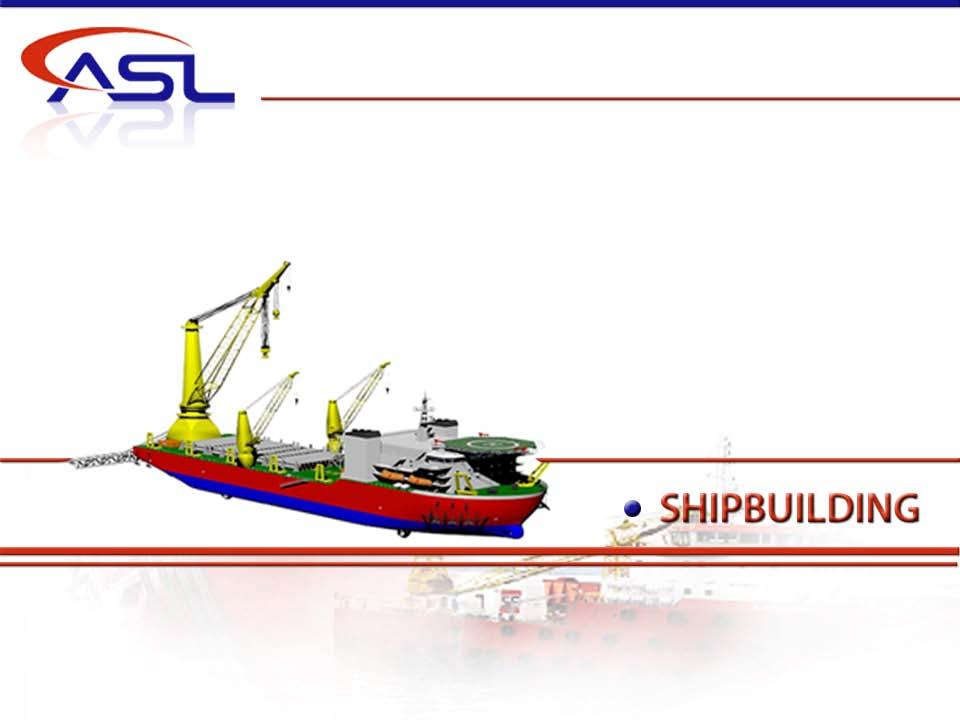
1 ASL Marine Holdings Ltd. SHIPBUILDING SHIPREPAIR SHIPCHARTERING Pulse of Asia Presentation 8 th July
2 Presentation Outline Company Profile 9M FY2008 Financial Review Business Review - Shipbuilding - Shiprepair - Shipchartering Business Outlook and Growth Drivers 2 2

 150,000dwt Graving Dry Dock + 20,000dwt Floating Dock in")
3 Company Profile Listed on SGX-ST Mainboard on 17 March 2003 Engages in 3 core businesses:- - Shipbuilding, - Shiprepair & Conversion - Shipchartering Shipbuilding and Shiprepair 3 shipyards in Singapore, Batam (Indonesia) and Guangdong (China) 150,000dwt Graving Dry Dock + 20,000dwt Floating Dock in Batam 3 3

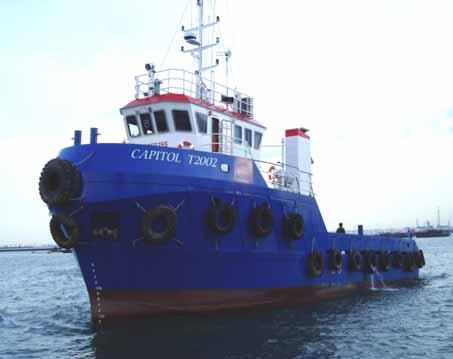
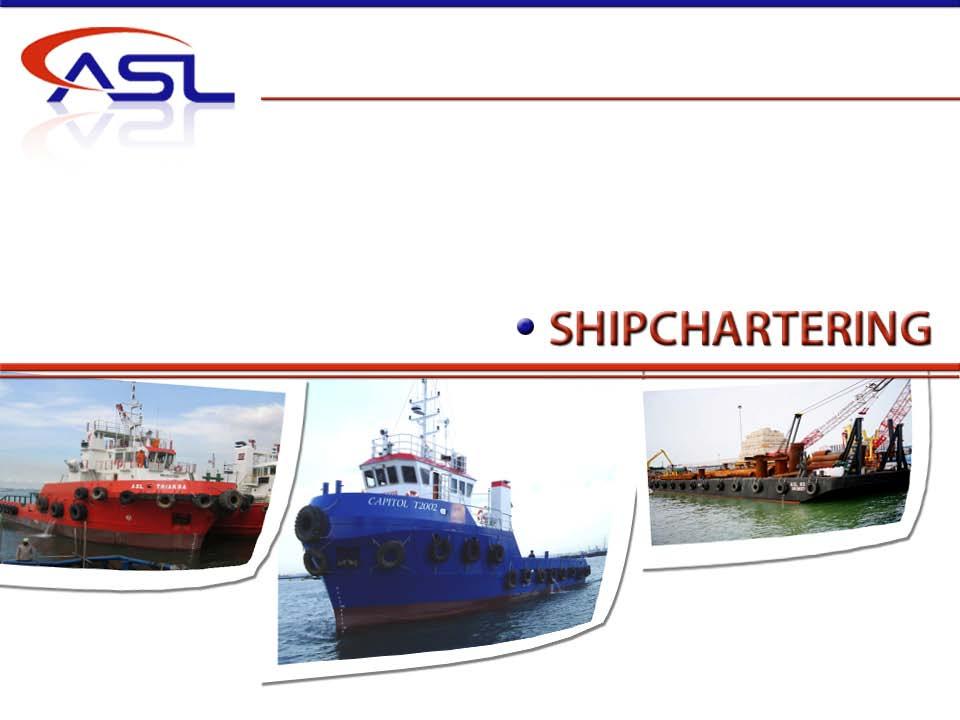
4 Company Profile Shipchartering Owns 175 vessels (61 tug, 3 AHT and 111 barge as at 31 March 2008) Engages in - Offshore Oil and Gas - Marine Infrastructure - Dredging, Land Reclamation & Marine Construction Works, and - Transportation of Cargoes such as aggregate, heavy equipment etc 4 4

5 ASL Marine Holdings Ltd. SHIPBUILDING SHIPREPAIR SHIPCHARTERING 9M FY2008 Financial Review (Nine Months Ended 31 March 2008) 5
6 9M FY2008 Financial Review $ million 9M FY2008 9M FY2007 Growth FY2007 Shipbuilding % Shiprepair % 43.5 Shipchartering % 72.2 Total Revenue % Gross Profit % 52.2 Gross Margin 18.7% 15.2% 23.0% 16.4% Net Profit % 40.2 Net Margin 14.8% 11.7% 26.5% 12.6% 6 6
7 9M FY2008 Financial Review CASH FLOW 9M FY2008 $ million 9M FY2007 $ million Change % FY 2007 Net cash generated from operating activities % 38.4 Net cash used in investing activities (48.4) (45.0) 7.5% (65.8) Net cash (used in)/ generated from financing activities Net increase in cash and cash equivalents Cash and cash equivalents at beginning of period Cash and cash equivalents at end of period (12.0) % ,500.8% % %
8 9M FY2008 Financial Review 9M FY2008 9M FY2007 FY2007 Earnings per Share* (cents) Fully Diluted EPS** (cents) Return on Equity (annualised) 26.2% 25.9% 26.3% Return on Total Assets (annualised) 10.1% 10.0% 9.1% As at 31-Mar Jun-07 Net Asset Value Per Share*** (cents) Gearing ratio Net Gearing ratio Net cash 0.51 * Based on weighted average of 280,988,596 (9M FY2007: 250,477,491, FY2007: 251,347,249) Ordinary Shares in issue during the period ** Based on weighted average of 294,225,032 (9M FY2007: 270,520,527, FY2007: 274,585,892) Ordinary Shares in issue during the period *** Based on 300,298,485 (30-Jun-07: 256,206,000) Ordinary Shares in issue 8 8
9 9M FY2008 Financial Review As at 31-Mar Jun-07 Share Price (cents) Price Earnings ratio Price / Net Assets Value per share Market Capitalisation ($ 000) 303, ,
10 9M FY2008 Financial Review 350 Revenue $' million Net Profit $' million FY2005 FY2006 FY2007 9M FY2007 9M FY2008 Shipbuilding Shiprepair Shipchartering 0 FY2005 FY2006 FY2007 9M FY2007 9M FY2008 Shipbuilding Shiprepair Shipchartering 9M FY2008 revenue rose by 21.9% compared to 9M FY2007, approx 89.5% of FY2007 revenue 9M FY2008 net profit rose by 54.3% compared to 9M FY2007, approx 104.7% of FY2007 net profit 10 10
11 Revenue & Gross Profit by Activities The Group s strategy is to grow all 3 business segments so as to maintain sustainable profit even during economical downturn 9M FY2008 Revenue $285.1 million $47.0m $64.7m $173.4m 9M FY2008 Gross Profit $53.2 million $19.0m $18.7m $15.5m 11 11
12 12 12

 152.2 9M FY2007 173.4 9M FY2008 202.")
13 Shipbuilding Revenue 13.9% to $173.4 million in 9M FY2008 Gross Profit 69.6% to $18.7 million in 9M FY2008 Gross margin from 7.2% in 9M FY2007 to 10.8% in 9M FY Construction of increased number of vessels with higher contract values - Improved pricing derived from higher value projects Revenue ($ m) M FY M FY FY2007 Gross Profit ($ m) M FY2007 9M FY2008 FY
14 Record Shipbuilding Order Book $ million At 30 Jun 03 At 30 Jun 04 At 30 Jun 05 At 30 Jun 06 At 30 Jun 07 At 31 Mar 08 Level of shipbuilding enquiry remains healthy The Group continuously purchases and keeps in stock steel materials required for its shipbuilding operation Approx 33%, 41% and 26% of S$750m are denominated in S$, US$ and Euro respectively. Beside utilising natural hedge, the Group entered into plain vanilla forward contracts to hedge against FX exposures 14 14
15 Record Shipbuilding Order Book Type of vessels Unit $ million % Offshore Support Vessels Tugs Dredgers Others TOTAL Offshore Support Vessels comprised AHT(1), AHTS(10), Subsea Operation Vessel (1), Heavy Lift Cum Pipelay Vessel(1), Emergency Response & Rescue vessels(6) Tugs comprised Azimuth Stern Drive Tugs(8) and Rotor Tugs(14) Portfolio of customers from diverse sectors Riding on strong demand for support vessels used in offshore oil & gas exploration & production activities 15 15
16 16 16
 Gross Profit ($ m) 50.")
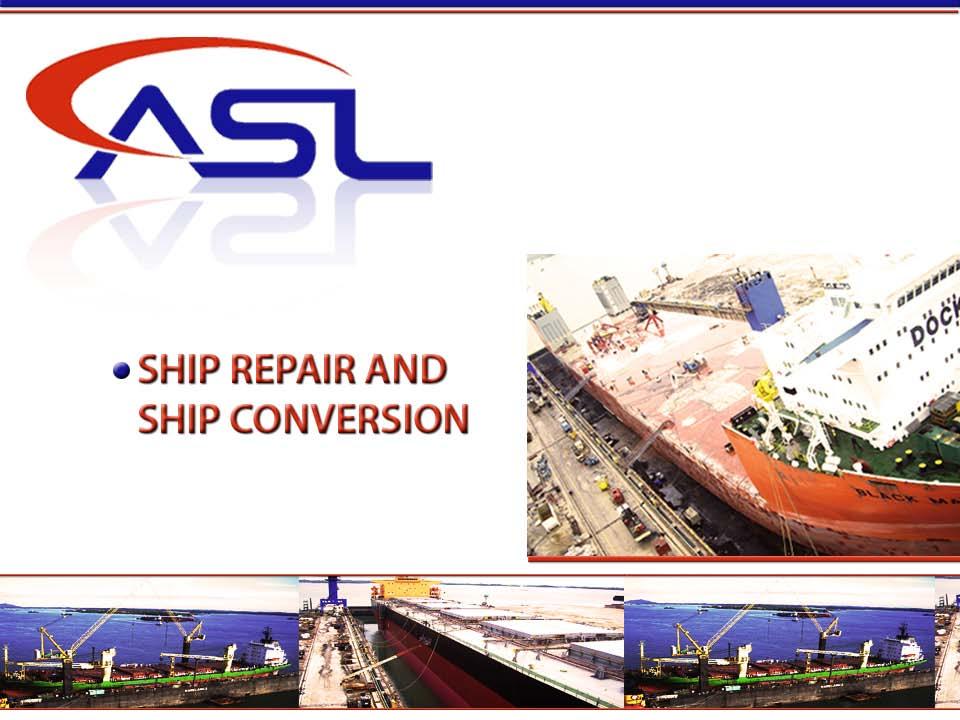
17 Ship Repair and Ship Conversion Revenue 52.0% to $47.0 million in 9M FY2008 Gross Profit 119.3% to $15.5 million in 9M FY2008 Gross margin from 22.8% to 32.9% in 9M FY Increased number of shiprepair and ship conversion jobs undertaken - Higher margin shiprepair jobs undertaken - Improved operating efficiency Revenue ($ m) Gross Profit ($ m) M FY2007 9M FY2008 FY M FY2007 9M FY2008 FY


18 Ship Repair and Ship Conversion Healthy level of enquiry Operating at full capacity Increased number of repeat customers Plans Lengthening of existing graving dry dock Addition of a Panamax and a Handymax graving dry dock 18 18
19 SHIPCHARTERING SHIPCHARTERING OPERATIONS 19 19
20 Shipchartering Revenue 27.6% to $64.7 million in 9M FY2008 Gross profit 9.5% to $19.0 million in 9M FY2008 Gross margin from 34.3% to 29.5% in 9M FY Enlarged fleet size (No. of vessels increased from 151 to 175) - Lower vessel utilisation due to more vessels under mandatory repair in 9M FY Higher proportion of charter income under contract of affreightment (9M FY2008: 29.5% 9M FY2007:18.0%) Revenue ($ m) Gross Profit ($ m) M FY2007 9M FY2008 FY2007 9M FY2007 9M FY2008 FY
21 Shipchartering 9M FY2008 9M FY2007 FY2007 Fleet Size (units) Tugs Anchor Handling Tugs Barges Total number of vessels Average age of vessels (years) Utilization Rate (%) Tugs / AHT 77% 82% 82% Barges 77% 83% 81% 21 21

22 ASL Marine Holdings Ltd. SHIPBUILDING SHIPREPAIR SHIPCHARTERING SHIPCHARTERING Business Outlook and Growth Drivers 22

23 Business Outlook Shipbuilding Continual demand from its niche market in specialised vessels for:- - Offshore oil & gas exploration & production activities Anchor Handling Towing and Supply Vessel Diving Support Vessel Pipelay Vessel - Land reclamation and dredging Cutter Suction Dredger Water Injection Dredger Hopper Barges - Port and terminal operations ASD Tugs Rotor Tugs - Infrastructure development Towing Tugs Workboats Barges Offshore Oil & Gas Production Source: Energyfiles Ltd, DBS Vickers (million barrels per day) Increased activity in deep water O&G production has led to increased demand in Offshore Support Vessels 23 23
24 Business Outlook Shipbuilding (no. of vessels) An ageing global AHTS fleet is still in a renewal mode Source: Clarksons According to Clarksons, there were US$189.9 bln worth of shipbuilding orders placed in
25 Business Outlook Shiprepair and Ship Conversion Healthy demand generated by the increase in world fleet and shipping cargo volume Buoyant offshore oil and gas exploration & production activities - Life extension of older vessels - Conversion/ Modification of vessels (Heavy lift/ Accomodation Vessel, FSO/FPSO, Pipelay Vessel etc) Implementation by the International Maritime Organisation of more stringent regulatory requirements and standards on ships - Older single-hulled tankers to be phased out by 2010 worldwide As per Det Norske Veritas in a recent publication, shipping industry expected to face a ship repair capacity crunch 25 25
26 Business Outlook Shipchartering Enlarged fleet size through planned fleet renewal and expansion programme Demand remains strong from:- - Buoyant offshore oil and gas activities - Domestic infrastructure construction projects in Singapore such as port expansion and integrated resort - Infrastructure development in the Middle East which generate demand for vessels such as tugs and barges used in the support of land reclamation and dredging projects 26 26
27 Group Growth Drivers Shipbuilding Order Book Shipbuilding order book of $750 million as at 31 March Level of shipbuilding enquiry remains healthy Enhancement of Shipyard Capabilities Lengthening of existing 150,000 dwt graving drydock from 260 meter to approx 360 meter for repair of larger vessels such as Capesize bulker, FSO/FPSO etc Adding two new graving drydocks with length of approx 220 meter and 180 meter for repair of medium-sized vessels such as Panamax, Handy/ Handymax, medium range tankers etc Total investment of $30 million, expected to be completed in
28 Group Growth Drivers Shipchartering Expanding Fleet Shipchartering order book of approximately $14 million as at 31 March 2008 for long term shipchartering contracts As at 31 March 2008, expects to take delivery of 22 vessels worth approximately $48 million. These vessels include towing tugs, Straight Supply vessel, AHT/S vessel, Anchor Handling tug (of which internally built: 11 vessels worth approximately $23 million) In 9M FY2008, the Group acquired $76.1 million plant and equipment, of which $52.2 million pertained to acquisition of vessels 28 28
29 29 29
Corporate Presentation 5 March 2003
 Corporate Presentation 5 March 2003 Agenda Investment Highlights Business Overview Financial Highlights Competitive Strengths Business Strategies & Future Plans Growth Prospects Corporate Presentation
COSCO CORPORATION. (SINGAPORE) LTD FY2003 Full Year Results. Presentation
 LTD FY2003 Full Year Results. Presentation") COSCO CORPORATION (SINGAPORE) LTD FY2003 Full Year Results Presentation 11 February 2004 1 Outline of Presentation 1. Background & Corporate Restructuring Exercise 2. Operations Review 3. Financial Review
COSCO CORPORATION (SINGAPORE) LTD FY2003 Full Year Results Presentation 11 February 2004 1 Outline of Presentation 1. Background & Corporate Restructuring Exercise 2. Operations Review 3. Financial Review
Globus Maritime Limited Trading Update and Financial Highlights for the Three Months and Nine Months Ended September 30, 2007.
 Globus Maritime Limited Trading Update and Financial Highlights for the Three Months and Nine Months Ended September 30, 2007. Athens, Greece, November 15, 2007. Globus Maritime Limited (AIM: GLBS), a
Golden Ocean Group Limited Q results March 1, 2007
 Golden Ocean Group Limited Q4 2006 results March 1, 2007 PROFIT & LOSS 2005 2006 (in thousands of $) 2006 2005 Oct-Dec Oct-Dec Jan - Dec Jan - Dec Operating Revenues 37 292 91 253 Time charter revenues
2012 RESULT PRESENTATION
 212 RESULT PRESENTATION BJÖRN ROSENGREN, PRESIDENT & CEO 25 JANUARY 213 Wärtsilä Net sales back to growth with stable profitability 212 development Order intake EUR 4,94 million, +9% Net sales EUR 4,725
1H 2003 Results Announcement. August 1, 2003 SUMMARY
 1H 2003 Results Announcement August 1, 2003 SUMMARY SembCorp Marine s revenue declined by 0.4 per cent to $489.8 million Operating profit increased by 5.4 per cent to $40.7 million PBT (before exceptional
WÄRTSILÄ CORPORATION
 WÄRTSILÄ CORPORATION INTERIM REPORT JANUARY-SEPTEMBER 21 OLE JOHANSSON, PRESIDENT & CEO 2 OCTOBER 21 1 Wärtsilä Q3/1 Highlights Order intake EUR 1,4 million (+38%) Net sales EUR 1,39 million (-11%) Operating
Wärtsilä Corporation. Interim Report January-March 2005 Ole Johansson, President & CEO. 4 May Wärtsilä
 Wärtsilä Corporation Interim Report January-March 2005 Ole Johansson, President & CEO 4 May 2005 Highlights of the first quarter Net sales up by 9.4% to EUR 570.7 million (521.7) Operating income improved
Oxley Delivers Stellar Growth of 58% in PATMI to. S$130.9 million for HY2017
 For immediate release Oxley Delivers Stellar Growth of 58% in PATMI to S$130.9 million for HY2017 - Half-year revenue increased by 19% year-on-year to S$732.2 million - Gross profit margin increased from
WÄRTSILÄ CORPORATION RESULT PRESENTATION JANUARY Björn Rosengren, President & CEO. Wärtsilä
 WÄRTSILÄ CORPORATION RESULT PRESENTATION 2014 29 JANUARY 2015 Björn Rosengren, President & CEO Wärtsilä Highlights 2014 good performance in challenging markets Order intake EUR 5,084 million, +5% Net sales
INTERIM REPORT JANUARY-JUNE 2012 BJÖRN ROSENGREN, PRESIDENT & CEO 18 JULY 2012
 INTERIM REPORT JANUARY-JUNE 212 BJÖRN ROSENGREN, PRESIDENT & CEO 18 JULY 212 Highlights Q2/212 Order intake EUR 1,198 million, +2% Net sales EUR 1,99 million, +6% Book-to-bill 1.9 (1.13) EBIT EUR 113 million,
PAXOCEAN GROUP. Corporate Presentation. 30 September 2017
 PAXOCEAN GROUP Corporate Presentation 30 September 2017 Kuok Group Worldwide Group History & Milestone PaxOcean Engineering Zhuhai was formed by Kuok (Singapore) Limited and Guangdong Yuexin Ocean Engineering
Presentasjon av Farstad Shipping ASA
 Rederiforbundet 01.03.16 Presentasjon av Farstad Shipping ASA Karl-Johan Bakken - CEO Torstein L. Stavseng - CFO Farstad Shipping ASA Looking ahead from 2015 Dressing the Company for the Future Strategically
Tat Hong Reports 13% Decline in FY2017 Revenue
 FOR IMMEDIATE RELEASE Registration No: 199105392H Tat Hong Reports 13 Decline in FY2017 Revenue - Cash and cash equivalents of S$114.3 million - Cash flow from operations of S$85.2 million - Net gearing
Morgan Stanley 2011 Emerging Companies Conference 9 June 2011
 Morgan Stanley 2011 Emerging Companies Conference 9 June 2011 Company Overview Mermaid Marine Australia Limited (MMA) is Australia s largest integrated marine services provider to the offshore oil and
FIRST QUARTER OPERATING PROFIT RISES TO $281 MILLION
 27 July 2017 Page 1 of 5 No. 03/17 27 July 2017 FIRST QUARTER OPERATING PROFIT RISES TO $281 MILLION Revenue improvement seen for all SIA Group airlines, but pressure on yields remains Earnings supported
SHIPBUILDING INDUSTRY CORPORATION (SBIC) VIETNAM MARITIME INDUSTRY (Presentation at ASEF 9 th Forum)
 VIETNAM MARITIME INDUSTRY (Presentation at ASEF 9 th Forum)") SHIPBUILDING INDUSTRY CORPORATION (SBIC) VIETNAM MARITIME INDUSTRY (Presentation at ASEF 9 th Forum) VIETNAM MARITIME INDUSTRY (Presentation at ASEF 9 th Forum) Contents Vietnam Overview Vietnam Maritime
SHIPBUILDING INDUSTRY CORPORATION (SBIC) VIETNAM MARITIME INDUSTRY (Presentation at ASEF 9 th Forum) VIETNAM MARITIME INDUSTRY (Presentation at ASEF 9 th Forum) Contents Vietnam Overview Vietnam Maritime
2012 Result. Mika Vehviläinen CEO
 2012 Result Mika Vehviläinen CEO 1 Agenda Market environment in Q4 Business performance and strategy execution Outlook Financials 2 Market Environment According to IATA, Global air travel continues to
2Q 2008 INTERIM REPORT Unaudited
 2Q 2008 INTERIM REPORT Unaudited HIGH UTILISATION AND STRONG CASH FLOW IN 2Q 2008 Ocean HeavyLift ASA (OHL) continues to deliver strong results in the second quarter of 2008. TC equivalent revenues came
AIRBUS. H Roadshow Presentation. July 2018
 AIRBUS H1 2018 Roadshow Presentation July 2018 H1 18 HIGHLIGHTS 2 Robust commercial aircraft environment Backlog of ~7,200 a/c underpins ramp-up plans H1 financials reflect mainly A350 performance and
Table 1 shows the number of licensed SBSR firms in the country by category and geographical division.
 THE PHILIPPINE SHIPBUILDING AND SHIP REPAIR INDUSTRY STATISTICAL REPORT 2002 INDUSTRY PROFILE MARINA-Licensed SBSR Firms As of December 2002, 423 SBSR entities were licensed with the Maritime Industry
WÄRTSILÄ CORPORATION
 WÄRTSILÄ CORPORATION UBS PAN EUROPEAN SMALL & MIDCAP CONFERENCE RAIMO LIND, EVP & CFO 19 MAY 211 1 Wärtsilä Q1/11 Highlights Net sales EUR 1,83 million, +18% Order intake EUR 979 million, +11% Operating
WÄRTSILÄ CORPORATIONO O
 WÄRTSILÄ CORPORATIONO O Handelsbanken Nordic Large Cap Seminar 12 September 2011 CHRISTOPH VITZTHUM GROUP VICE PRESIDENT, SERVICES 1 Wärtsilä This is Wärtsilä SHIP POWER POWER PLANTS SERVICES 2 Wärtsilä
GROUP FINANCIAL HIGHLIGHTS
 AGENDA FINANCIAL HIGHLIGHTS OPERATIONS HIGHLIGHTS INCOME STATEMENT REVIEW BALANCE SHEET REVIEW KEY PERFORMANCE INDICATORS OPERATIONAL REVIEW AIRLINES COMPARATIVE PERFORMANCE OUTLOOK GROUP FINANCIAL HIGHLIGHTS
ABX. Holdings, Inc. BB&T Transportation Conference. February 2008
 ABX Holdings, Inc. BB&T Transportation Conference February 2008 1 Safe Harbor Statement Except for historical information contained herein, the matters discussed in this presentation contain forward-looking
World-Class. World-Wide.
 World-Class. World-Wide. FINCANTIERI MARINETTE MARINE FINCANTIERI BAY SHIPBUILDING FINCANTIERI ACE MARINE Complete Marine Solutions. Complete Marine Solutions. Complete Marine Solutions. Complete Marine
Demand, Supply & Capacity in the Shipbuilding Industry
 Demand, Supply & Capacity in the Shipbuilding Industry million dwt Ship completions by region 120 100 80 60 Other Europe Japan Korea China "Europe" includes Russia SOURCE: IHS-Fairplay 40 20 42.3 0 0.4
WÄRTSILÄ CORPORATION
 WÄRTSILÄ CORPORATION INTERIM REPORT JANUARY-MARCH 211 OLE JOHANSSON, PRESIDENT & CEO 2 APRIL 211 1 Wärtsilä Q1/11 Highlights Net sales EUR 1,83 million, +18% Order intake EUR 979 million, +11% Operating
Cebu Air, Inc. Annual Stockholders Briefing. 24 June cebupacificair.com
 Cebu Air, Inc. Annual Stockholders Briefing 24 June 2015 cebupacificair.com Business Updates Passengers (M) Operating Statistics 2014: Passenger traffic grew 17.5% to 16.9M. Seat capacity grew 14.8% to
Wärtsilä Corporation. Interim Report January-September 2006 Ole Johansson, President & CEO. 31 October Wärtsilä
 Wärtsilä Corporation Interim Report January-September 26 Ole Johansson, President & CEO 31 October 26 Highlights Q3/26 Strong order intake continued (+25%) Net sales +26% Operating income +29% Strong cash
FIRST QUARTER OPERATING PROFIT IMPROVES TO $274 MILLION
 1 August 2006 Page 1 of 4 No. 03/06 1 August 2006 FIRST QUARTER OPERATING PROFIT IMPROVES TO $274 MILLION HIGHLIGHTS OF THE GROUP S PERFORMANCE 1st Quarter 2006-07 Year-on-Year % Change Operating revenue
Ramsay Health Care Limited Results Briefing Half Year ended 31 December 2018
 Ramsay Health Care Limited Results Briefing Half Year ended 31 December 2018 Craig McNally, Group Managing Director & Bruce Soden, Group Finance Director 28 February 2019 ramsayhealth.com Agenda Group
For personal use only
 SMS Management & Technology Level 41 140 William Street Melbourne Victoria 3000 Australia T +61 1300 842 767 F +61 1300 329 767 www.smsmt.com Melbourne Sydney Brisbane Canberra Adelaide Hong Kong Vietnam
Final Results 31 December 2013
 Final Results 31 December 2013 Clarkson PLC 10 March 2014 www.clarksons.com Agenda Headline results Divisional performance Business Model & Strategy The market Outlook 10 March 2014 Final Results www.clarksons.com
PROFIT OF $1.24b ON STRONG REVENUE GAINS BUT FUEL COSTS REMAIN GREATEST CHALLENGE
 PROFIT OF $1.24b ON STRONG REVENUE GAINS BUT FUEL COSTS REMAIN GREATEST CHALLENGE HIGHLIGHTS OF THE GROUP S PERFORMANCE Financial Year 2005-06 4th Quarter 2005-06 Apr 2005 Mar 2006 Year-on-Year % Change
Acquisition of Singapore Cruise Centre
 (Prefer to use a daylight pix and a SATS pix on cruise) Acquisition of Singapore Cruise Centre Growing SATS Gateway Services 26 September 2013 1 Forward Looking Statements This presentation may contain
Jason Marine, provider of integrated solutions of marine communication, navigation and automation systems, launches IPO
 Jason Marine Group Limited 194 Pandan Loop #06-05 Pantech Business Hub Singapore 128383 Tel: +65 6872 0211 Fax: +65 6872 1800 www.jason.com.sg PRESS RELEASE Contact Information August Consulting Tel: (65)
WÄRTSILÄ CORPORATION
 WÄRTSILÄ CORPORATION INTERIM REPORT JANUARY-JUNE 214 18 JULY 214 Björn Rosengren, President & CEO Wärtsilä Highlights Q2/214 NEW PIC Order intake EUR 1,163 million, +9% Net sales EUR 1,132 million, -2%
WÄRTSILÄ CORPORATION
 WÄRTSILÄ CORPORATION INTERIM REPORT JANUARY-SEPTEMBER 215 22 OCTOBER 215 Björn Rosengren, President & CEO Wärtsilä Highlights Q3/215 Order intake EUR 1,86 million, -17% Net sales EUR 1,222 million, +9%
HATTEN LAND LIMITED. Shaping the Future, Melaka and Beyond. FY2017 Results. Corporate Presentation 17 August 2017
 HATTEN LAND LIMITED Shaping the Future, Melaka and Beyond FY2017 Results Corporate Presentation 17 August 2017 Disclaimer Information in this presentation may contain forward-looking statements that reflect
Overview. > Normalised earnings* before taxation of, up 30% > Statutory earnings before taxation of, up 40% > Statutory net profit after taxation of
 1 Overview > Normalised earnings* before taxation of, up 30% > Statutory earnings before taxation of, up 40% > Statutory net profit after taxation of > Operating revenue of > Strong operating cash flow
KOPONEN VICE PRESIDENT, FINANCE & CONTROL, SHIP POWER
 WÄRTSILÄ IN CHINA KEVA trip to Shanghai TIMO KOPONEN VICE PRESIDENT, FINANCE & CONTROL, SHIP POWER 7.11.2011 1 Wärtsilä Agenda What is Wärtsilä today? Where is ship building today? Why Wärtsilä is in China?
Long Term Trends in Shipbuilding HVB Press Conference. 20 th September 2006 Stephen Gordon, Clarkson Research
 Long Term Trends in Shipbuilding HVB Press Conference 20 th September 2006 Stephen Gordon, Clarkson Research Introduction Background to Shipbuilding Investment The Current Orderbook The Product Mix Regional
AIRBUS H Roadshow Presentation. New York July 31 st, 2017
 AIRBUS H1 2017 Roadshow Presentation New York July 31 st, 2017 H1 2017 HIGHLIGHTS 2 Healthy commercial aircraft environment; robust backlog of 6,771 a/c supports ramp-up plans H1 financials reflect delivery
This Week s Overview of Shipping Investments SECONDHAND / DEMOLITION / NEW BUILDING MARKET ANALYSIS
 This Week s Overview of Shipping Investments SECONDHAND / DEMOLITION / NEW BUILDING MARKET ANALYSIS Week Ending: 1 st November 2013 (Week 44, Report No: 44/13) (Given in good faith but without guarantee)
YONGNAM HOLDINGS LIMITED (Company Registration No N) (Incorporated in the Republic of Singapore on 19 October 1994)
 (Incorporated in the Republic of Singapore on 19 October 1994)") YONGNAM HOLDINGS LIMITED (Company Registration No. 199407612N) (Incorporated in the Republic of Singapore on 19 October 1994) NEWS RELEASE YONGNAM REPORTS THIRD QUARTER NET PROFIT OF S$2.0 MILLION - Revenue
YONGNAM HOLDINGS LIMITED (Company Registration No. 199407612N) (Incorporated in the Republic of Singapore on 19 October 1994) NEWS RELEASE YONGNAM REPORTS THIRD QUARTER NET PROFIT OF S$2.0 MILLION - Revenue
WÄRTSILÄ CORPORATION
 WÄRTSILÄ CORPORATION 26 RESULT PRESENTATION OLE JOHANSSON, PRESIDENT & CEO 6 FEBRUARY 27 1 Wärtsilä Highlights 26 Order intake +32.4% Order book +52.8% Net sales +26.6% Operating income +29.2% Profitability
THIRD QUARTER OPERATING PROFIT UP 13% TO $330 MILLION
 13 February 2018 Page 1 of 7 ` No. 01/18 13 February 2018 THIRD QUARTER OPERATING PROFIT UP 13% TO $330 MILLION Higher carriage and load factors for all passenger airlines Strong earnings for SIA Cargo
Results Presentation 27 May 2008
 Yongmao Holdings Limited Results Presentation 27 May 2008 Agenda About Yongmao FY08 Performance Review Outlook & Strategy 2 Company Overview Leading designer and manufacturer of tower cranes and accessories
Record Result. 2006/07 Full Year Results Investor Presentation. Moved on successfully following bid. Profit before tax % to $1,032 million
 2006/07 Full Year Results Investor Presentation August 16 2007 Record Result Moved on successfully following bid Profit before tax + 53.8% to $1,032 million Group returning above Cost of Capital 2 Key
Marine/Offshore Industry Conference. Bristow Group Inc. March 29, 2012
 Marine/Offshore Industry Conference Bristow Group Inc. March 29, 2012 Bristow is the leading provider of helicopter transportation services to the global offshore industry Bristow flies crews and light
CENTURION CORP ACHIEVES RECORD NET PROFIT OF S$31.1 MILLION FROM ITS CORE BUSINESS OPERATIONS FOR FY2014
 PRESS RELEASE For Immediate Release CENTURION CORP ACHIEVES RECORD NET PROFIT OF S$31.1 MILLION FROM ITS CORE BUSINESS OPERATIONS FOR FY2014 Highest ever revenue of S$84.4 million for FY2014 63% growth
Interim Report 3m Bilfinger Berger SE, Mannheim May 10, 2012 Joachim Müller, CFO
 Interim Report 3m 2012 Bilfinger Berger SE, Mannheim May 10, 2012 Joachim Müller, CFO Bilfinger Berger SE Interim report 3m 2012 May 10, 2012 Page 1 3m 2012: Highlights Growth in output volume and orders
WÄRTSILÄ CORPORATION
 WÄRTSILÄ CORPORATION INTERIM REPORT JANUARY-JUNE 215 17 JULY 215 Björn Rosengren, President & CEO Wärtsilä Highlights Q2/215 Order intake EUR 1,159 million, +2% Net sales EUR 1,23 million, +1% Book-to-bill.94
First Quarter Results August 31 st, 2006
 First Quarter Results 2006-07 August 31 st, 2006 Key features of the First Quarter Market context Sustained global economic growth, and a recovery in Europe Average jet fuel price of 691 $/t, up 25% year-on-year
S$ million 2Q2012 2Q2011 Change 1H2012 1H2011 Change Revenue % % Gross Profit % % Gross Profit Margin
 Roxy-Pacific Holdings Limited NEWS RELEASE ROXY-PACIFIC ACHIEVES 8% INCREASE IN NET PROFIT TO S$17.7 MILLION IN 2Q2012 - Revenue rises 13% to S$52.7 million - 18% surge in revenue from Property Development
For personal use only
 ASX and Media Release QANTAS DELIVERS RECORD FIRST HALF PROFIT, INVESTS IN AIRCRAFT AND TRAINING Sydney, 22 February 2018 Underlying Profit Before Tax: $976 million (up 15%) Record results for Qantas Domestic,
Information meeting. 12 September 2011
 Information meeting 12 September 2011 Full Year 2010-11 key data April 2010-March 2011 Revenues in billions Operating result in millions 77% Passenger 18.10 +11.3% -44 +874 13% Cargo 3.16 +29.5% +69 +505
1HFY2015 Results: Media & Analyst Briefing 12 March 2015 T T J HOLDINGS LIMITED STRUCTURES THAT SHAPE THE FUTURE 1HFY2015 RESULTS BRIEFING
 1HFY2015 Results: Media & Analyst Briefing 12 March 2015 Business overview One of the largest structural steel fabricators with a reputation as a leading structural steel specialist S1-accredited company
RYANAIR ANNOUNCES RECORD Q1 PROFIT INCREASE
 RYANAIR ANNOUNCES RECORD Q1 PROFIT INCREASE Ryanair, Europe s largest low fares airline today (Tuesday, 6 Aug 2002) announced its biggest increase in Q1 profits (end 30 Jun 02). Passenger traffic during
INTERIM REPORT JANUARY-JUNE 2013
 INTERIM REPORT JANUARY-JUNE 213 BJÖRN ROSENGREN, PRESIDENT & CEO 18 JULY 213 Wärtsilä Highlights Q2/213 NEW PIC Order intake EUR 1,71 million, -11% Net sales EUR 1,152 million, +5% Book-to-bill.93 EBITA
Air China Limited Interim Results. August Under IFRS
 Air China Limited 21 Interim Results Under IFRS August 21 1 Agenda 21 Interim Results Overview Business Overview Financial Overview Outlook 2 2 2 21 Interim Results 3 21 Interim Results Overview 4 4 4
% S$ million 9M2010 9M2009
 Roxy-Pacific Holdings Limited NEWS RELEASE ROXY-PACIFIC CONTINUES TO REPORT STRONG GROWTH IN 3Q2010 - Revenue surges 41 to S$53.1 million - 46 jump in pre-tax profit to S$11.0 million - 44 increase in
TUI News Investor Relations
 records very successful financial year 2013/2014 Merger with TUI Travel PLC about to be closed Significant outperformance against earnings targets in full financial year 2013/2014; earnings growth driven
FIRST QUARTER OPERATING PROFIT IMPROVES 69% TO $463 MILLION
 FIRST QUARTER OPERATING PROFIT IMPROVES 69% TO $463 MILLION PARENT AIRLINE OPERATIONS DRIVE GROUP OPERATING PROFIT The Group made an operating profit of $463 million for the first quarter of 2007-08; an
2017 Pre-Close Analyst Briefing. 5 January 2018 Hong Kong
 2017 Pre-Close Analyst Briefing 5 January 2018 Hong Kong 2 Agenda 2017 Business & Performance - Pre-close Michelle Low, Finance Director Patrick Healy, Managing Director Swire Beverages Q&A 3 2017 Business
Yongnam Holdings Limited
 Yongnam Holdings Limited FY2008 Results Presentation February 27, 2009 Contents Our Business Corporate Updates FY2008 Financial Performance Prospects and Market Outlook Growth Strategies and Plans Key
GRINDROD LIMITED AUDITED RESULTS AND DIVIDEND ANNOUNCEMENT for the year ended 31 December 2016
 www.grindrod.com GRINDROD LIMITED AUDITED RESULTS AND DIVIDEND ANNOUNCEMENT for the year ended 31 December 2016 Wifi access guest@sun Presentation and Announcement download www.grindrod.com > Investor
JAPAN AIRLINES Co., Ltd. Financial Results 1 st Quarter Mar/2017(FY2016) July 29, 2016
 July 29, 2016") JAPAN AIRLINES Co., Ltd. Financial Results Mar/2017(FY2016) July 29, 2016 Today s Topics P.1 P.2 P.13 From the first quarter of this fiscal year, figures for Revenue Passengers Carried, ASK, RPK and Load
JAPAN AIRLINES Co., Ltd. Financial Results Mar/2017(FY2016) July 29, 2016 Today s Topics P.1 P.2 P.13 From the first quarter of this fiscal year, figures for Revenue Passengers Carried, ASK, RPK and Load
Finnair Group Annual Report 1 January 31 December 2006
 Finnair Group Annual Report 1 January 31 December 2006 2006: A year for restructuring Scheduled Passenger Traffic transforming to meet Asian traffic demands Labour negotiations to cut 670 jobs 80 million
HATTEN LAND LIMITED. Shaping the Future, Melaka and Beyond. Corporate Presentation 12 October 2017
 HATTEN LAND LIMITED Shaping the Future, Melaka and Beyond Corporate Presentation 12 October 2017 Disclaimer Information in this presentation may contain forward-looking statements that reflect the current
Press Release. Bilfinger with dynamic start to financial year 2018
 Press Release May 15, 2018 Bilfinger with dynamic start to financial year 2018 Book-to-bill ratio reaches 1.2 in the first quarter Fourth consecutive growth quarter in orders received Adjusted EBITA above
ABC Group Presentation
 ABC Group Presentation Introduction Since 1982, ABC Maritime, a Swiss based family owned group of companies, offers complete solutions to the world s maritime communities of ship owners, trading houses,
SECOND QUARTER OPERATING PROFIT IMPROVES TO $87 MILLION
 12 November 2013 Page 1 of 5 No. 05/13 12 November 2013 SECOND QUARTER OPERATING PROFIT IMPROVES TO $87 MILLION GROUP FINANCIAL PERFORMANCE Second Quarter 2013-14 The Group earned an operating profit of
Developing the Shipping Ecosystem Ship Repair and Dry Docks. R.V.Vimal Head Offshore & Commercial Chowgule Lavgan Yard.
 Developing the Shipping Ecosystem Ship Repair and Dry Docks R.V.Vimal Head Offshore & Commercial Chowgule Lavgan Yard. History Evolution Current Scenario Practices Innovation Challenges History Not long
Capabilities for the Job
 The Largest Shipyard In Thailand Unithai Shipyard and Engineering operates Thailand's largest shipyard, located within the country's main international deep sea port of Laem Chabang, which is at the heart
AEROFLOT ANNOUNCES FY 2017 IFRS FINANCIAL RESULTS
 AEROFLOT ANNOUNCES FY 2017 IFRS FINANCIAL RESULTS Moscow, 1 March 2018 Aeroflot Group ( the Group, Moscow Exchange ticker: AFLT) today publishes its audited financial statements in accordance with International
Copa Holdings Reports Record Earnings of US$41.8 Million for 4Q06 and US$134.2 Million for Full Year 2006
 Copa Holdings Reports Record Earnings of US$41.8 Million for 4Q06 and US$134.2 Million for Full Year 2006 Panama City, Panama --- March 7, 2007. Copa Holdings, S.A. (NYSE: CPA), parent company of Copa
THIRD QUARTER OPERATING PROFIT UP 51% TO $675 MILLION
 THIRD QUARTER OPERATING PROFIT UP 51% TO $675 MILLION GROUP FINANCIAL PERFORMANCE Third Quarter 2007-08 The Group made an operating profit of $675 million in the third quarter of financial year 2007-08,
YONGNAM HOLDINGS LIMITED (Company Registration No N) (Incorporated in the Republic of Singapore on 19 October 1994)
 (Incorporated in the Republic of Singapore on 19 October 1994)") YONGNAM HOLDINGS LIMITED (Company Registration No. 199407612N) (Incorporated in the Republic of Singapore on 19 October 1994) NEWS RELEASE YONGNAM POSTS 28.4% RISE IN REVENUE TO S$96.9 MILLION FOR 3Q2016
YONGNAM HOLDINGS LIMITED (Company Registration No. 199407612N) (Incorporated in the Republic of Singapore on 19 October 1994) NEWS RELEASE YONGNAM POSTS 28.4% RISE IN REVENUE TO S$96.9 MILLION FOR 3Q2016
KSH HOLDINGS LIMITED. Corporate Presentation May 27, 2014
 KSH HOLDINGS LIMITED Corporate Presentation May 27, 2014 KSH Corporate Presentation OVERVIEW KSH Holdings Limited RESULTS FY2014 UPDATES Corporate Developments OUTLOOK Strategies Moving Forward CONCLUSION
STRONG OPERATING RESULTS LIFT NET PROFIT 7.3% TO $932 MILLION
 STRONG OPERATING RESULTS LIFT NET PROFIT 7.3% TO $932 MILLION GROUP FINANCIAL PERFORMANCE First Half 2007-08 The Group achieved an operating profit of $982 million for the first half of financial year
ANA HOLDINGS Financial Results for the Three Months Ended June 30, 2018
 ANA HOLDINGS NEWS ANA HOLDINGS Financial Results for the Three Months Ended June 30, 2018 TOKYO, July 31, 2018 ANA HOLDINGS INC. (hereinafter ANA HD ) today reports its financial results for the three
Financial Results 1 st Quarter Mar/2016 (FY2015) 30 July, 2015
 30 July, 2015") Financial Results Mar/2016 (FY2015) 30 July, 2015 Today s Topics P.2 P.3 P.15 1 Overview of FY Mar/2016 Financial Results Operating Revenue Operating Profit 320 307.0 +4.9Bn (+1.6%) 312.0 50 +17.6Bn (+94.6%)
Financial Results Mar/2016 (FY2015) 30 July, 2015 Today s Topics P.2 P.3 P.15 1 Overview of FY Mar/2016 Financial Results Operating Revenue Operating Profit 320 307.0 +4.9Bn (+1.6%) 312.0 50 +17.6Bn (+94.6%)
QANTAS ANNOUNCES PROFIT RESULT HALF-YEAR ENDED 31 DECEMBER 2009
 QANTAS ANNOUNCES PROFIT RESULT HALF-YEAR ENDED 31 DECEMBER 2009 HIGHLIGHTS TWO BRAND STRATEGY DELIVERS RESILIENCE AND CONTAINS COSTS Statutory Net Profit Before Tax of $90 million Underlying Profit Before
WHEN IS THE NEXT SHIPPING BOOM?
 WHEN IS THE NEXT SHIPPING BOOM? By Ravi K Mehrotra CBE Executive Chairman Foresight Group, London Samunder Club April & May 2012 Houston and Florida, USA 1 WHEN IS THE NEXT SHIPPING BOOM? I am not a fortune
Corporate Presentation. 1April 2018
 Corporate Presentation 1April 2018 Kuok Group Worldwide Group History & Milestone PaxOcean Engineering Zhuhai was formed by Kuok (Singapore) Limited and Guangdong Yuexin Ocean Engineering Acquisition of
Conference Philip Adkins (CEO) Cristijn Sarvaas (CFO) September 2008
 Cristijn Sarvaas (CFO) September 2008") Pareto Oil & Offshore Conference 2008 Philip Adkins (CEO) Cristijn Sarvaas (CFO) September 2008 9/21/2008 2 Fairstar in brief Founded in 2005 to become a leading provider of high-end ocean transportation
Pareto Oil & Offshore Conference 2008 Philip Adkins (CEO) Cristijn Sarvaas (CFO) September 2008 9/21/2008 2 Fairstar in brief Founded in 2005 to become a leading provider of high-end ocean transportation
SIA ENGINEERING COMPANY 1 st Half FY17/18 Financial Review
 SIA SIA ENGINEERING ENGINEERING COMPANY COMPANY 11 st st Half Half FY17/18 FY17/18 Performance Performance Review Review 1 2 SIA ENGINEERING COMPANY 1 st Half FY17/18 Financial Review 1H17/18 Financial
DFDS A/S H Analyst meeting 30 August 2006
 DFDS A/S H1 2006 Analyst meeting 30 August 2006 DFDS A/S Contents The half-year in brief Strategy on track DFDS Seaways DFDS Tor Line Half-year accounts & profit forecast 2006 DFDS A/S H1 2006 in brief
Thank you for participating in the financial results for fiscal 2014.
 Thank you for participating in the financial results for fiscal 2014. ANA HOLDINGS strongly believes that safety is the most important principle of our air transportation business. The expansion of slots
FY2015 2nd Quarter Business Results
 FY2015 2nd Quarter Business Results Project AH A MAY products Yamaha Corporation and Yamaha Motor Co., Ltd. make products by exchanging the design divisions and their design fields, and present a joint
Annual Results Air New Zealand
 Annual Results 2011 Air New Zealand Highlights Normalised earnings* $75m Net cash position of $860m Operating cash flow down 5% Gearingat467% at 46.7% Final dividend 2.5 cents per share (unimputed) New
AIR NEW ZEALAND ANNUAL RESULTS ANNUAL RESULTS
 AIR NEW ZEALAND ANNUAL RESULTS 2008 1 HIGHLIGHTS Record operating revenue, up 9% Normalised earnings* $197m Net cash position of $1.3bn Launched direct service to Vancouver and Beijing Award winning product
Finnair Group Interim Report 1 January 30 September 2008
 Finnair Group Interim Report 1 January 30 September 2008 1 31/10/2008 Presentation name / Author Airline industry at a historical turning point Expensive fuel price in the beginning of 2008 has dramatical
Finnair Q Result
 Finnair Q1 2015 Result 7 May 2015 CEO Pekka Vauramo, Interim CFO Mika Stirkkinen 1 Turbulent market environment The weakness of the Finnish economy continued to be reflected in the demand in the first
Cathay Pacific Airways Analyst & Investor Briefing June Cathay Pacific Airways Interim Results 6 August 2008
 Cathay Pacific Airways 2010 Analyst & Investor Briefing June 2010 Cathay Pacific Airways 2008 Interim Results 6 August 2008 Airline Strategy Remains largely unchanged Grow our international network, expand
ANNUAL GENERAL MEETING 22 November 2005
 ANNUAL GENERAL MEETING 22 November 2005 CHAIRMAN S OVERVIEW FY 2005 Year of transition, Affinity acquisition doubles size of company Affinity acquisition most exciting development in Ramsay history welcomed
PARENT AIRLINE OPERATIONS LIFT GROUP PROFIT
 PARENT AIRLINE OPERATIONS LIFT GROUP PROFIT HIGHLIGHTS OF THE GROUP S PERFORMANCE Financial Year 2006-07 4th Quarter 2006-07 Apr 2006 Mar 2007 Year-on-Year % Change Jan-Mar 2007 Year-on-Year % Change Operating
GROUP ULJANIK PLOVIDBA CONSOLIDATED AUDITED FINANCIAL STATEMENTS FOR THE PERIOD JANUARY - DECEMBER 2014
 GROUP ULJANIK PLOVIDBA CONSOLIDATED AUDITED FINANCIAL STATEMENTS FOR THE PERIOD JANUARY - DECEMBER 2014 Pula, April 2015 CONTENT: Consolidated audited Financial Statements of GROUP ULJANIK PLOVIDBA with