INVESTOR PRESENTATION. August 2017
|
|
|
- Gwendolyn Clark
- 6 years ago
- Views:
Transcription


1 INVESTOR PRESENTATION August 2017
2 Important Notice This presentation is for information purposes only and does not constitute or form part of an offer, solicitation, recommendation or invitation for the sale or purchase or subscription of securities, including units in Frasers Logistics & Industrial Trust ( FLT, and the units in FLT, the Units ) or any other securities of FLT. No part of it nor the fact of its presentation shall form the basis of or be relied upon in connection with any investment decision, contract or commitment whatsoever. The past performance of FLT and Frasers Logistics & Industrial Asset Management Pte. Ltd., as the manager of FLT (the Manager ), is not necessarily indicative of the future performance of FLT and the Manager. This presentation contains forward-looking statements, including forward looking financial information, that involve assumptions, known and unknown risks, uncertainties and other factors which may cause the actual results, performance, outcomes or achievements of FLT or the Manager, or industry results, to be materially different from those expressed in such forward-looking statements and financial information. Such forward-looking statements and financial information are based on certain assumptions and expectations of future events regarding FLT's present and future business strategies and the environment in which FLT will operate. The Manager does not guarantee that these assumptions and expectations are accurate or will be realised. You are cautioned not to place undue reliance on these forwardlooking statements, which are based on the Manager s current view of future events. The Manager does not assume any responsibility to amend, modify or revise any forward-looking statements, on the basis of any subsequent developments, information or events, or otherwise, subject to compliance with all applicable laws and regulations and/or the rules of the Singapore Exchange Securities Trading Limited ( SGX-ST ) and/or any other regulatory or supervisory body or agency. The information and opinions in this presentation are subject to change without notice, its accuracy is not guaranteed and it may not contain all material information concerning FLT. None of Frasers Centrepoint Limited, FLT, the Manager, Perpetual (Asia) Limited, in its capacity as trustee of FLT, or any of their respective holding companies, subsidiaries, affiliates, associated undertakings or controlling persons, or any of their respective directors, officers, partners, employees, agents, representatives, advisers or legal advisers makes any representation or warranty, express or implied, as to the accuracy, completeness or correctness of the information contained in this presentation or otherwise made available or as to the reasonableness of any assumption contained herein or therein, and any liability whatsoever (in negligence or otherwise) for any loss howsoever arising, whether directly or indirectly, from any use, reliance or distribution of this presentation or its contents or otherwise arising in connection with this presentation is expressly disclaimed. Further, nothing in this presentation should be construed as constituting legal, business, tax or financial advice. The value of Units and the income derived from them, if any, may fall or rise. Units are not obligations of, deposits in, or guaranteed by, the Manager or any of its affiliates. An investment in the Units is subject to investment risks, including the possible loss of the principal amount invested. Investors should note that they have no right to request the Manager to redeem their Units while the Units are listed. It is intended that holders of Units may only deal in their Units through trading on the SGX- ST. Listing of the Units on the SGX-ST does not guarantee a liquid market for the Units. Nothing in this presentation constitutes or forms a part of any offer to sell or solicitation of any offer to purchase or subscribe for securities for sale in Singapore, the United States or any other jurisdiction in which such offer, solicitation or sale would be unlawful prior to registration or qualification under the securities laws of any such jurisdiction. 1
3 Table of Contents Section Contents Page 1 Introduction to FLT 3 2 Portfolio Overview 8 3 Financial Highlights 18 4 Sponsor 24 5 Strategy and Outlook 28 2

4 Introduction to FLT 17 Hudson Court, Keysborough, Victoria
 Melbourne (Victoria) Properties 30 Sydney")
 40.4% % of Portfolio (2) 29.")
 Properties 4 GLA 33,038 sq m Perth (Western")
 27.8% % of Portfolio (2) 1.")
 Includes the six properties acquired by FLT in August 2017 and one remaining")
5 Portfolio Overview The Largest Initial Pure-Play Australian Logistics and Industrial REIT listed in Singapore 61 PROPERTIES (1) Melbourne (Victoria) Properties 30 Sydney (New South Wales) Properties 15 (3) GLA 646,264 sq m GLA 405,471 sq m Valuation A$770.2m Valuation A$553.4m % of Portfolio (2) 40.4% % of Portfolio (2) 29.0% Brisbane Perth Adelaide Sydney Melbourne Brisbane (Queensland) Properties 11 GLA 247,724 sq m Adelaide (South Australia) Properties 4 GLA 33,038 sq m Perth (Western Australia) Properties 1 GLA 20,143 sq m Valuation A$530.9m Valuation A$35.2m Valuation A$18.2m % of Portfolio (2) 27.8% % of Portfolio (2) 1.8% % of Portfolio (2) 1.0% (1) Includes the six properties acquired by FLT in August 2017 and one remaining property to be acquired at a later date (2) By valuation (3) 14 properties located in Sydney, 1 property is located in Wollongong 4


")
 43 Efficient Drive, Truganina, VIC (Ceva Tech Facility) 29")
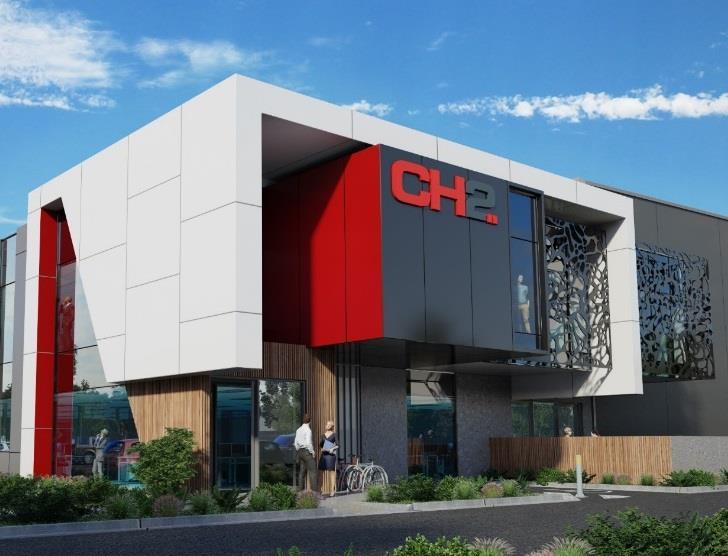
 17 Hudson Court, Keysborough, VIC (CH2 Facility) June")


6 Developments Since Listing Listed on the SGX ST on 20 June 2016 Acquired Indian Drive and Pearson Road Call Option Properties First Portfolio Acquisition Announced proposed acquisition of seven industrial properties for A$169.3 million on 6 June Completed Properties 3 Development Properties 111 Indian Drive, Keysborough, VIC Lot 1 Pearson Road, Yatala, QLD Listed on the SGX-ST on 20 June 2016 Initial Portfolio: 51 properties in Australia Acquisitions accretive to DPU Pearson Road Property is the first industrial facility in Queensland to achieve a 6 Star Green Star Design rating Lot 1, Horsley Drive Business Park, NSW (Survitec & Phoenix Facility) South Park Drive, Dandenong South, VIC (Ecolab Facility) 8 Stanton Road, Seven Hills, NSW (Yusen Facility) 43 Efficient Drive, Truganina, VIC (Ceva Tech Facility) 29 Indian Drive, Keysborough, VIC (Stanley Black & Decker Facility) Lot 1, Pearson Road, Yatala, QLD (Beaulieu Facility) 17 Hudson Court, Keysborough, VIC (CH2 Facility) June 2016 August 2016 November 2016 June 2017 July 2017 August 2017 Completion of Development Properties Acquired Martin Brower Call Option Property Private Placement and Extraordinary General Meeting Completion of Acquisition of Six Properties 28 June 2017 Private Placement 78 million units at S$ times subscribed 1 August 2017 Comprising the four completed properties and the Beaulieu Facility Doriemus Drive, Truganina, VIC 4 Kangaroo Avenue, Eastern Creek, NSW Schenker Extension and CEVA Logistic completed on 24 and 30 June 2016 respectively Ahead of targeted completion date of July 2016 as originally stated in the Prospectus 1 Burilda Close, Wetherill Park, NSW Prime, new industrial facility with 20-year lease longest in FLT s Portfolio Certified 6 Star Green Star Design rating 26 July 2017 Extraordinary General Meeting Obtained Unitholders Approval to proceed with the portfolio acquisition 15 August 2017 For the Stanley Black & Decker Facility 5
7 Acquisition of Seven Properties in Australia Acquisition of 7 Properties Located In Australia s Three Largest Industrial Markets Properties 7 Brisbane 1 asset Gross Lettable Area ( GLA ) Aggregate Valuation (1) Aggregate Acquisition Amount (2) 124,527 sq m A$171.3 million A$169.3 million Sydney 2 assets Melbourne 4 assets Occupancy (3) 100% WALE (4) Average Age (5) 9.5 years 2.5 years Completed equity raising through placement and issuance of 78 million new units on 6 July 2017 Unitholders approval obtained at the Extraordinary General Meeting held on 26 July 2017 Completion of acquisition for six out of seven properties in August 2017 (1) Based on the higher of the two independent valuationsconducted by CBRE ValuationsPty Ltd, SavillsValuationsPty Ltd (onlyfor the CEVA Tech Facility) and Urbis ValuationsPty Ltd (for all the seven properties save for the CEVA Tech Facility) as at 30 April 2017 (2) The aggregate acquisition amount payable is subject to adjustments arising from the actual GLA being more or less than the estimated GLA of the Development Properties (the Development Properties Adjustments ), with the maximum aggregate acquisition amount for the 7 new properties takinginto account the Development Properties Adjustmentsbeing approximatelya$171.5 million (3) Including pre-committed leases for the Development Properties as at 30 June 2017 (4) The weighted average lease expiry computed through application of Adjusted Gross Rental Income ( Adjusted GRI ) (being the contracted rental income and estimated recoverable outgoings of the Completed Properties under the relevant existing lease for the first month after the completion of the contracts of sale in respect of the Completed Properties (the Completed Properties Contracts of Sale ), and for the Development Properties, the contracted rental income and estimated recoverable outgoings under the relevant pre-committed lease for the first month following the estimated practical completion of the respective Development Properties) and assuming that the pre-committed tenancies for the Development Properties and the tenancies for the Completed Properties have commenced as at 30 June 2017 (5) As at 30 June
8 Growth Since IPO Key portfolio, performance and trading metrics have improved since IPO Portfolio At IPO Current (1) Number of Properties GLA (sq m) 1,156,825 1,352, % Portfolio Value (A$ m) 1, , % Occupancy (%) ppt 99.4 WALE (Years) 6.9 Unchanged 6.9 Financial Indicators IPO Forecast YTD (2) Distributable Income (A$ 000) 96, % 101,386 DPU (Singapore cents) % 7.08 Trading Performance At IPO 30 June 17 Unit Price (S$) S$ % S$1.08 Market Capitalisation (S$ m) 1,268.4m +21.9% 1,545.9m (1) As at 30 June Includes the six properties acquired by FLT in August 2017 and one remaining property to be acquired at a later date (2) For the period from 20 June 2016 to 30 June

9 Portfolio Overview 29 Indian Drive, Keysborough, Victoria

10 Portfolio Concentrated in Major Industrial Markets - Melbourne FLT s properties in Melbourne are primarily located in the west and south east industrial precincts and services Melbourne s port and large south eastern residential population base New South Wales Map of Melbourne Sub-market Location No. of Properties Precinct Characteristic South Australia E D F G New South Wales South East North D 6 A 6 Access to M1 (Monash Freeway) and M3 (EastLink) B 8 Services the large south eastern residential C 2 population base Access to key freeways, including the Tullamarine Freeway, Citylink Tollway, and Western Ring Road, together with the Tullamarine Airport. Sydney is accessed via the Hume Highway West E 6 Close to the shipping port and access to the M1, Geelong Road, M80 Western Ring Road South Australia C B A New South Wales City Fringe F 1 G 1 Access to the M1 (Westgate Freeway) linking it to the west precinct A A South Park Industrial Estate South Park Industrial Estate E E West Park Industrial Estate West Park Industrial Estate Total 30 B B The Keys Industrial Park The Key Industrial Park F F Altona Industrial Park Altona Industrial Park C C D D Clayton South & Mulgrave Clayton South & Mulgrave Melbourne Airport Business Park Melbourne Airport Business Park G G Port Melbourne Port Melbourne 9

11 Portfolio Concentrated in Major Industrial Markets - Sydney FLT s properties in Sydney are well-connected to major freeways, Sydney s port and are able to service growing population in the north west Queensland Map of Sydney Sub-market Location No. of Properties Precinct Characteristic South Australia A C DC B DE Outer Central West Outer North West A 4 Excellent access to key motorways, including M7, M4 and other main arterial roads B 2 C 2 D 4 E 1 Third-party logistics ( 3PL ), retail and wholesale distribution centres for key brand name operators are located in this precinct Close to M2 and M7 and access to the large and growing north west population corridor Supply is moderately constrained sites suit smaller development Outer South West F 1 Access to the M5 and South Sydney/Port, the Southern Sydney Freight Line and Moorebank Intermodal terminal EF Victoria Victoria Port Kembla (Wollongong) N.A. 1 One of the three major trade ports within New South Wales and is situated within the southern industrial city of Wollongong A A B Eastern Creek Eastern Creek Pemulwuy D Seven Hills Total 15 BC Seven Pemulwuy Hills E Winston Hills D C E Winston Hills Wetherill Park Smeaton Grange F Smeaton Grange 10

12 Portfolio Concentrated in Major Industrial Markets - Brisbane FLT s properties in Brisbane are primarily concentrated in the southern sub-market, which has good road linkages to the north, west and south to the Gold Coast residential population bases Northern Territory JI HI Map of Brisbane Sub-market Southern No. of Location Properties A 1 B 1 C 1 D 1 E 1 F 1 G 1 H 2 Precinct Characteristic Largest geographical industrial precinct that has good road linkages to the north, west and south to the Gold Coast residential population New South Wales B A D F G C E H New South Wales Trade Coast I 1 Northern J 1 Close to key infrastructure, including Port of Brisbane and the Brisbane Airport Access north and south via the M1 Supply is constrained. Alternative use is strong competition for development in neighbouring suburbs Services the population to the North of Brisbane via the Gympie Road, Bruce Highway and Houghton Highway Limited availability of development land AA B B C Flint Street Flint Street Boundary Road Boundary Road Siltstone Place F G F Shettleston Street Shettleston Street G Sandstone Place Sandstone Place H Queensport Road Total 11 CD Siltstone Stradbroke Place Street H Pearson I Earnshaw Road Road E D Platinum Street Stradbroke Street I Queensport Road E Platinum Street J Earnshaw Road 11
13 FLT Portfolio Metrics 90.5% of FLT s portfolio (by value) comprised of freehold and long leasehold land tenure assets Land Tenure by Value (1)(2) Other Leasehold 9.5% Portfolio Age by GLA (3) > 10 Yrs 23.8% <2 Yrs 23.1% 76.2% of FLT s portfolio (by GLA) is less than 10 years old with lower capital expenditure requirements > 80 Year Leasehold 30.3% Freehold 60.2% 5-10 Yrs 35.4% 2-5 Yrs 17.7% Geographical Breakdown by GLA and Value Diversified portfolio across five states in Australia Focus on Australia s three largest capital cities of Sydney, Melbourne and Brisbane WA, SA, 1.5% 2.4% VIC, 47.8% GLA NSW, 30.0% QLD, 18.3% VIC, 40.4% SA, WA, 1.8% 1.0% Value QLD, 27.8% NSW, 29.0% (1) Valuation for pre-acquisition portfolio of 54 properties as at 30 September 2016 (save for the property located at Lot 3 Horsley Drive Business Park, Cnr Horsley Drive & Cowpasture Road, Wetherill Park, New South Wales (the Martin Brower Property ) which was valued on 1 October 2016) (2) Valuation for the seven new properties are based on the Aggregate Valuation (3) As at 30 June

 32 Gibbon Road, Winston hills, New South Wales 7,812 sq m lease executed with Tailored Packaging to")
 to November 2031 (2) 18 20 Butler Boulevard, Adelaide Airport, South")
 The GLA of 19,299 sq m refers to the existing lettable area and excludes")
14 Leasing Updates Management continues to proactively engage with tenants well before lease expiry 140,246 sq m of new lease and lease renewals since FLT s listing, representing 11.4% of total Portfolio GLA 94.0% Tenant retention rate (1) for all leasing transactions from the Listing Date to 30 June 2017 Lease Renewals and New Leasing Activity (1 January 2017 to 30 June 2017) 32 Gibbon Road, Winston hills, New South Wales 7,812 sq m lease executed with Tailored Packaging to April Jets Court, Melbourne Airport, Victoria 5,299 sq m lease extension to December Platinum Street, Crestmead, Queensland 19,299 sq m lease extension (and asset enhancement) to November 2031 (2) Butler Boulevard, Adelaide Airport, South Australia 6,991 sq m lease extension to March 2021 (1) Retention rate would have been 100% if excluding the lease surrender by Australian Geographic due to a solvent exit arrangement (2) The GLA of 19,299 sq m refers to the existing lettable area and excludes the planned expansion of 1,238 sq m, which is due for completion in January

15 Asset Enhancement Proposed location of new extension, canopy and solar panels Property: Tenant: Description: Platinum Street, Crestmead, Queensland Stramit Corporation Pty Limited 1,238 sq m expansion of the warehouse, installation of a 773 sq m awning and further building upgrades and sustainability initiatives Expected Return on Cost: 10% Expected Completion Date: January
 contribution for the month of June 2017 (1) ) (by")


 Includes the six properties")
16 Well-diversified Tenant Base Top 10 Tenants Breakdown of Tenants By Trade (% of Gross Rental Income ( GRI ) contribution for the month of June 2017 (1) ) (by Gross Rental Income for the month of June 2017 (1) ) % of GRI WALE (Years) Coles Manufacturing 17.0% Others 6.7% Consumer 43.2% CEVA Logistics Schenker Toll Holdings Logistics 33.1% TTI Mazda Martin Brower H.J. Heinz DHL Global Forwarding Unilever Consumer sector tenants Logistics sector tenants (1) Includes the six properties acquired by FLT in August 2017 and one remaining property to be acquired at a later date 15
17 Portfolio Lease Expiry Profile No concentration risk of lease expiry (no single financial year has more than 16% lease expiries up to 30 September 2025) Only 2.5% lease expiries to end FY18 Provides stability of cash flows Lease Expiry by Gross Rental Income(¹) (2) 32.5% 21.7% 0.2% 0.5% 2.3% 10.7% 15.3% 13.9% 8.2% 12.8% 10.4% 10.1% 15.8% 10.8% 4.0% 4.0% 7.9% 8.0% 5.6% 4.8% Sep 2017 Sep 2018 Sep 2019 Sep 2020 Sep 2021 Sep 2022 Sep 2023 Sep 2024 Sep 2025 Sep 2026 and beyond Jun 2017 IPO (as disclosed in Prospectus) (1) As at 30 June 2017, and excluding straight lining rental adjustments (2) Includes the six properties acquired by FLT in August 2017 and one remaining property to be acquired at a later date 16
 (by GLA) Not Eligible, 23.0% Not Rated, 9.")


18 Sustainability FLT has the largest industrial Green Star performance rated portfolio in Australia Green Initiatives include undertaking LED & solar PV analysis for existing properties FLT s Green Star-rated status (1,2) (by GLA) Not Eligible, 23.0% Not Rated, 9.6% Potential sustainability benefits Reduces ongoing occupancy costs Attracting new tenants, especially those using sustainability as a criteria Performance rated, 67.4% Assists in retaining tenants at lease expiry Decreases building obsolescence Sustainability initiatives Energy-efficient LED lighting Solar PV Systems Minimises vacancy downtime Building and Internal works Geothermal heating and cooling Surface level geoair heat pump Utilise geothermal heating and cooling systems to take advantage of the stable temperature underground using a piping system Lot 1 Pearson Road, Yatala, Queensland LED lighting to warehouse and office areas 1 Burilda Close, Wetherill Park, New South Wales Rooftop Solar PV system to generate renewable energy for use on site Underground geoair loops Integrated in the base design of the Quatius Logistics and Survitec & Phoenix properties (1) Green Star rating is awarded by the Green Building Council of Australia (GBCA) which has assessed the Properties against nine key performance criteria energy, water, transport, materials, indoor environment quality, management, land use & ecology, emissions and innovation (2) As at 30 June 2017 and Includes the six properties acquired by FLT in August 2017 and one remaining property to be acquired at a later date 17

19 Financial Highlights Lot 1 Horsley Drive Business Park, New South Wales
20 Financial Performance (Quarter ended 30 June 2017) (A$ 000) Actual Forecast (1) Change (%) Contributing factors Gross revenue 40,226 40,290 (0.2) Adjusted net property income (2) 30,843 30,856 - Adjusted Net Property Income for the Quarter at A$30.8 million was in line with Quarter Forecast. Actual gross revenue for the Quarter excluding straight lining rental adjustment was in line with Quarter Forecast. Finance costs (4,220) (5,198) 18.8 Interest savings from lower actual weighted average interest rate of 2.8% (3) per annum compared to Forecast weighted average interest rate of 3.4% (3) per annum Lower debt funding as compared to Forecast Distributable income to Unitholders DPU (Singapore cents) 25,047 23, Due mainly to: Interest savings Lower withholding tax on distributable income (1) Please refer to Note 1 in Paragraph 9 of FLT s Financial Statements Announcement dated 28 July 2017 for details on the forecast figures for the quarter ended 30 June (2) Net property income excluding straight lining rental adjustments (3) Excluding upfront debt related expenses 19
21 Financial Performance (Financial Period ended 30 June 2017) (A$ 000) Actual (1) Forecast (2) Change (%) Gross revenue 163, , Adjusted net property income (3) 125, ,303 (0.1) Contributing factors Variance from Forecast is due to rental income contribution from the previously vacant tenancy at Lot 5 Kangaroo Avenue which was leased from April 2016 and the acquisition of the two call option properties (Indian Drive and Pearson Road Properties) one month ahead of Forecast Partially offset by the two month delay in acquiring the Martin Brower call option property and one-off repairs and maintenance costs incurred for some of the properties Finance costs (16,390) (20,076) 18.4 Interest savings from lower actual weighted average interest rate of 2.8% (4) per annum compared to Forecast weighted average interest rate of 3.4% (4) Lower debt funding as compared to Forecast Distributable income to Unitholders DPU (Singapore cents) 101,386 96, Due mainly to: Interest savings Lower trust expenses Lower withholding tax on distributable income (1) The Actual results for the FLT Group for the financial period from 30 November 2015 (date of constitution) to 30 June 2017 comprises the actual results for the quarters ended 30 June 2017, 31 March 2017 and 31 December 2016 and (i) in respect of the non-queensland Properties, 108 days of operation from 14 June 2016 to 30 September 2016; and (ii) in respect of the Queensland Properties, 102 days of operation from 20 June 2016 to 30 September Please refer to Note 1 in Paragraph 9 of FLT s Financial Statements Announcement dated 28 July 2017 for details (2) Please refer to Note 1 in Paragraph 9 of FLT s Financial Statements Announcement dated 28 July 2017 for details on the Forecast figures for the financial period from 30 November 2015 to 30 June 2017 (3) Net property income excluding straight lining rental adjustments (4) Excluding upfront debt related expenses 20
22 DPU Quarter ended 30 June 2017 (Singapore cents, 1 April 2017 to 30 June 2017) Financial Period ended 30 June 2017 (Singapore cents, 20 June 2016 to 30 June 2017) 5.5% 6.7% Forecast (1) Actual Forecast (1) (2) Actual (1) Please refer to Note 1 in Paragraph 9 of FLT s Financial Statements Announcement dated 28 July 2017for details on the Forecast figures for the financial period from 30 November 2015to 30 June 2017 (2) The Actual results for the FLT Group for the financial period from 30 November 2015 (date of constitution) to 30 June 2017 comprises the actual results for the quarters ended 30 June 2017, 31 March 2017 and 31 December 2016 and (i) in respect of the non-queensland Properties, 108 days of operation from 14 June 2016 to 30 September 2016; and (ii) in respect of the Queensland Properties, 102 days of operation from 20 June 2016to 30 September Please refer to Note 1 in Paragraph 9 of FLT s Financial Statements Announcement dated 28 July 2017 for details 21
23 Balance Sheet Value of investment properties has increased 9.4% from A$1.60 billion at IPO to A$1.75 billion as at 30 June 2017 due mainly to acquisition of the three call option properties (A$ 000) As at 30 June 2017 Investment properties 1,752,543 Other non-current assets 2,965 Current assets 54,663 Total assets 1,810,171 Non-current liabilities 537,159 Current liabilities 16,314 Total liabilities 553,473 Net asset value per Unit (A$) 0.87 Net asset value per Unit (S$)
24 Capital Management As at 30 June 2017 Weighted average cost of borrowings is 2.8%(¹) per annum Healthy interest cover ratio of 9.5 times No near term refinancing risks Low gearing level of 29.3% Available debt headroom of A$517 million to reach 45.0% aggregate leverage limit Debt Composition Floating VS Hedged Debt Maturity Profile (A$ m) Floating 21% $170 $160 $200 Fixed 79% No debt expiry in FY2017 and FY2018 Total Gross Borrowings A$530 million FY2017 FY2018 FY2019 FY2020 FY2021 (1) Excluding upfront debt related expenses 23

25 Sponsor 43 Efficient Drive, Truganina, Victoria

26 Sponsor: Frasers Centrepoint Limited A Leading International Real Estate Company One of Singapore s top property companies with total assets of S$25b (1) Multi-segment expertise industrial, residential, retail, office, business space properties and hospitality Engaged in the entire real estate value chain One of the Top Residential Developers in Singapore One of the Largest Retail Mall Owners / Operators in Singapore Leading Australian Multi-segment Developer and Owner/Operator Globally Scalable Hospitality Operator (1) As at 30 June
27 Frasers Property Australia Leading Integrated Industrial Player FPA (previously Australand ) is a significant diversified property group in Australia with ~S$3.6b in total assets as at 31 December 2016 FPA became wholly-owned by the FCL Group in October 2014 and the creation of FLT to be a strategic partner in the industrial sector is a key objective for both FPA and FCL The industrial business line is of significant importance to FPA, representing approximately one-third of FPA s asset base FPA S COMPLETE IN-HOUSE VALUE CHAIN Opportunity Identification and Development Asset and Property Management Funds Expertise Strong Industrial Delivery Capabilities Proven Asset Management Track Record Unparalleled Funds Expertise Consistent market leader in industrial D+C market with c.15% - 25% market share (1) A$3.5b of assets and 3.1 million sq m built form completed (2) 100% of IPO portfolio developed inhouse Industrial development pipeline with an on completion value of A$850m In-house construction and delivery platform, a key point of difference vs. competitors End to end from lease negotiation to property and facilities management Tenant retention rate of 81.0% (3) Approx. 50% repeat business Seven previous funds/jvs managed by Frasers Property Australia since 2001 Gross value of funds managed is approximately A$1.7b Strong track record of delivering healthy returns Source: Frasers Centrepoint Limited (1) FPA market share was not calculated in 2013 and 2014 and in 2008 and 2009 was a combined 15% average across both years. (2) Since (3) Retention rate is for FLT portfolio from
28 Alignment of Interest between the Sponsor, REIT Manager and Unitholders The substantial interest of the Sponsor in FLT aligns the Sponsor and Unitholders interest. Management fee structure aligns the REIT Manager and Unitholders interest. Substantial Sponsor ownership in FLT REIT Manager Fee structure The Sponsor is the largest Unitholder in FLT Sponsor ownership of 19.9% (1) Management Fee Fee Structure Base Fee 0.4% p.a. of Deposited Property Substantial strategic investment in FLT Performance Fee 5.0% p.a. of Distributable Income Total REIT Management Fee for FP2016 (annualised): 0.64% of Deposited Properties TCCI (2) has committed 6.0% (1) as a strategic investor 100% base fee and performance fee in units for the FP2016 and PY2017 to align interest of REIT manager and unitholders Performance fee structure incentivises the REIT Manager to grow distributable income and DPU (1) As at 4 August 2017 (2) TCC Group Investments Limited 27

29 STRATEGY & OUTLOOK South Park Drive, Dandenong South, Victoria
30 Strategic Objectives Prime and modern industrial and logistics portfolio in key Australian markets Deliver stable and regular distributions to unitholders Achieve long term growth in DPU Proactive leasing strategy: High occupancy rate, long WALE and well-diversified tenant base 3.2% average annual built-in rental increments; AEI (1) potential for portfolio properties ROFR of 13 existing properties from Sponsor and Sponsor s development pipeline (2) Third-party acquisitions Optimal capital mix and prudent capital management (1) Asset Enhancement Initiative (2) Only completed income-producing real estate assets which are used for logistics or industrial purposes are included in the ROFR 29
31 Australian Economy Snapshot Economic Growth Australia s 1017 GDP grew 1.7% year on year, driven by household consumption, public spending and a buildup of business inventories; partially tempered by falls in exports (affected by adverse weather) and dwelling investment during the March quarter Business investment has picked up in those states not directly affected by the declines in mining investment. The Reserve Bank of Australia indicates GDP growth is anticipated to strengthen gradually, with the transition from a resource driven economy to lower levels of mining investment Official Interest Rates Australian GDP Annual Growth Rates (%) The RBA maintained the cash rate at 1.5%, consistent with sustainable growth in the economy and achieving inflation target over time Australian government 10 year bond yields at 2.61% Unemployment Rate Low unemployment rate of 5.6% (%) Australian Cash Rate Sources: Reserve Bank of Australia Australian Economy Snapshot (14 July 2017), Statement by Philip Lowe, Governor: Monetary Policy Decision (4 July 2017), Reserve Bank of Australia Capital Market Yields Government Bonds Daily (8 August 2017), Reserve Bank of Australia, Government-Bonds-Daily-Australian-Government-10-year-bond-Units-Per-cent-per-annum-Series-ID-FCMYGBAG10D 30
32 Australian Industrial Market Australian industrial supply is marginally above the long term average with construction activity predominantly concentrated in Melbourne and Sydney Occupier demand has been strong for both existing and speculative facilities, resulting in rental growth and lower vacancies in Sydney and Melbourne Australian investment sales volume remains restricted due to the declining level of investment grade stock coming to market Given the pent up investor demand for a limited pool of stabilised assets, corporate sale and leaseback activity has emerged and the transactions have evidenced a further compression in prime yields SQM ('000s) Australian Total Industrial Supply 2,000 1,600 1, As at Completed Sources: JLL Real Estate Intelligence Service Industrial Market Snapshot 2Q 2017; Knight Frank Industrial Vacancy Report July year annual average
33 Jun-07 Jun-08 Jun-09 Jun-10 Jun-11 Jun-12 Jun-13 Jun-14 Jun-15 Jun-16 Jun-17 Prime grade net fact rent $psm p.a. Melbourne Industrial Market Supply: Supply levels remain above the long term average and total supply in 2017 is anticipated to be close to the previous construction peak Demand: Take up levels are increasing with 246,400 sqm of absorption recorded through both existing vacancies (51%) and pre-lease deals (49%), driven by the logistics and wholesale trade sectors Rents: While incentive levels remain higher compared to other markets, prime rental growth was recorded on a net and effective basis across all precincts except for the City Fringe Vacancy: As a result of strong absorptions (predominantly in the West), vacancy levels are falling and on course for a return to the long term average SQM ('000s) 900 Melbourne Industrial Total Supply 150 Melbourne Prime Grade Net Face Rents $81 $86 $84 $83 $84 $86 $88 $89 $89 $90 $ As at 2017 Completed 10 year annual average Sources: Jones Lang LaSalle Real Estate Intelligence Service Melbourne Industrial Final Data 2Q17; Jones Lang LaSalle Real Estate Intelligence Service Melbourne Industrial Snapshot 2Q17; Jones Lang LaSalle Real Estate Data Solution Melbourne Construction Projects from 2Q07 to 2Q17 32
34 Jun-07 Jun-08 Jun-09 Jun-10 Jun-11 Jun-12 Jun-13 Jun-14 Jun-15 Jun-16 Jun-17 Prime grade net fact rent $psm p.a. Sydney Industrial Market Supply: Sydney is experiencing rising pre-lease developments associated with speculatively developed facilities Demand: Take-up result of 343,200 sqm almost double that of the 10-year average, led by occupiers from both the wholesale trade and retail trade sectors. Demand has been further boosted by increased infrastructure investment in New South Wales Rents: Prime rents have continued to strengthen and the growth has been the strongest level in the past 10 years due to increased demand and limited vacancy Vacancy: Sydney is currently experiencing reduced letting up times and levels of immediately available prime stock are limited for large-space occupiers who are looking to relocate. As a result the occupiers have moved to the pre-lease market to secure space SQM ('000s) 1, Sydney Industrial Total Supply Sydney Prime Grade Net Face Rents $112 $113 $109 $109 $113 $115 $121 $121 $123 $124 $130 As at 2017 Completed 10 year annual average Sources: Jones Lang LaSalle Real Estate Intelligence Service Sydney Industrial Final Data 2Q17; Jones Lang LaSalle Real Estate Intelligence Service Sydney Industrial Snapshot 2Q17; Jones Lang LaSalle Real Estate Data Solution Sydney Construction Projects from 2Q07 to 2Q17 33
35 Jun-07 Jun-08 Jun-09 Jun-10 Jun-11 Jun-12 Jun-13 Jun-14 Jun-15 Jun-16 Jun-17 Prime grade net fact rent $psm p.a. Brisbane Industrial Market Supply: Supply levels in Brisbane are relatively low compared to the Melbourne and Sydney markets. However, Brisbane is on the rise to the long term average with a number of pre-lease projects currently under construction (primarily in the South) which are anticipated to reach completion in the second half of 2017 Demand: Occupier demand has exhibited steady improvement with most of the absorptions recorded in the Trade Coast. Enquiry levels are high for modern buildings with operational efficiencies due to competitive effective rents. Rents: Further contraction in prime net face rents across all precincts as a result of relatively high vacancy and aggressive incentives offered by developers to compete for pre-commitments Vacancy: Letting up periods remain lengthy (average 18.4 months estimated by Knight Frank) despite some improvement to vacancy levels SQM ('000s) Brisbane Industrial Total Supply Brisbane Prime Grade Net Face Rents $112 $116 $113 $117 $118 $120 $120 $119 $118 $117 $ As at 2017 Completed 10 year annual average Sources: Jones Lang LaSalle Real Estate Intelligence Service Brisbane Industrial Final Data 2Q17; Jones Lang LaSalle Real Estate Intelligence Service Brisbane Industrial Snapshot 2Q17; Jones Lang LaSalle Real Estate Data Solution Brisbane Construction Projects from 2Q07 to 2Q17; Knight Frank Brisbane Industrial Vacancy Report 2Q17 34
36 Summary FLT Highlights (For the Financial Period ended 30 June 2017 (1) ) A$101.4 mil Distributable Income 4.7% Above Forecast 7.08 Singapore cents DPU 5.5% Above Forecast 29.3% Aggregate Leverage (2) Available debt headroom for growth Key Portfolio Metrics (2)(3) 99.4% Occupancy 6.9 years WALE 6.6 years Portfolio Age 3.2% Average Fixed Rental Increases (1) For the period from 20 June 2016 to 30 June 2017 (2) As at 30 June 2017 (3) Includes the six properties acquired by FLT in August 2017 and one remaining property to be acquired at a later date 35

37 a Lot 1 Pearson Road, Yatala, Queensland THANK YOU Investor relations contact Mr. Ng Chung Keat Frasers Logistics & Industrial Asset Management Pte. Ltd. ir@fraserslogisticstrust.com Website:
Frasers Logistics & Industrial Trust
 Frasers Logistics & Industrial Trust Investor Presentation 1 Burilda Close, Wetherill Park, New South Wales February 2017 Important Notice This presentation is for information purposes only and does not
QUARTERLY UPDATE 31 MARCH 2017
 AUSTRALIAN PROPERTY OPPORTUNITIES FUND QUARTERLY UPDATE 31 MARCH 2017 The Australian Property Opportunities Fund (APOF I or the Fund) is pleased to provide this update for the March quarter 2017 (Q1 2017)
GOING PLACES MACARTHURCOOK OFFICE PROPERTY TRUST
 GOING PLACES MACARTHURCOOK OFFICE PROPERTY TRUST ANNUAL REPORT 2006 1 2 3 4 1 2 181 Miller Street, North Sydney, NSW 150 170 Leichhardt Street, Spring Hill, Brisbane, QLD 3 4 38 Akuna Street, Canberra,
Investor Briefings First-Half FY2016 Financial Results
 Cedar Woods Properties Limited Investor Briefings First-Half FY2016 Financial Results 26 February 2016 Cedar Woods Presentation 2 Snapshot of Achievements in FY2016 Extensive portfolio of residential estates
FAR EAST H-TRUST POSTS 2Q 2014 INCOME AVAILABLE FOR DISTRIBUTION OF $22.1 MILLION
 Highlights: FAR EAST H-TRUST POSTS 2Q 2014 INCOME AVAILABLE FOR DISTRIBUTION OF $22.1 MILLION Gross revenue of $29.6 million in 2Q 2014 amidst challenging operating environment Net property income of $26.6
For personal use only
 3Q15 Stockland Update Implementing our Strategy Isles of Newport, Brisbane Agenda Topic Page Group Update 03 Commercial Property 05 Residential 09 Retirement Living 10 Summary and Outlook 11 2 Group Update
Frasers Commercial Trust I China Square Central Hotel Transaction II 357 Collins Street Acquisition
 Artist s impression of the Hotel 357 Collins Street, Melbourne, Australia Frasers Commercial Trust I China Square Central Hotel Transaction II 357 Collins Street Acquisition 27 April 2015 Important notice
Goodman Property Trust. 30 & 31 October 2018 NAB First Look USPP Conference, Sydney
 Goodman Property Trust 30 & 31 October 2018 NAB First Look USPP Conference, Sydney Contents Presented by: Andy Eakin Chief Financial Officer James Spence Director Investment Management GMT overview 3 Auckland
Q3 FY18 Business Highlights
 Q3 FY18 RESULTS Q3 FY18 Business Highlights 1 2 3 4 5 6 7 Record passengers 7.1m, record revenues 423m Investing in growth 24% passenger growth in Q3 Disciplined cost management flat ex-fuel CASK Largest
A-HTRUST to deepen presence in Japan with the acquisition of a portfolio of hotels
 Press Release For Immediate Release A-HTRUST to deepen presence in Japan with the acquisition of a portfolio of hotels Deepens presence in Osaka, a gateway city with a strong hospitality market, which
DEXUS Property Group (ASX: DXS) ASX release
 ASX release") 6 May 2013 DEXUS and DWPF to acquire strategic office investment in Perth DEXUS Property Group (DEXUS or DXS) and DEXUS Wholesale Property Fund (DWPF) today announced the joint acquisition of a strategic
6 May 2013 DEXUS and DWPF to acquire strategic office investment in Perth DEXUS Property Group (DEXUS or DXS) and DEXUS Wholesale Property Fund (DWPF) today announced the joint acquisition of a strategic
Euroz Rottnest Investor Briefing
 Cedar Woods Properties Limited Euroz Rottnest Investor Briefing 15 March 2016 Cedar Woods Presentation 2 Snapshot of Achievements in FY2016 Extensive portfolio of residential estates in Perth and WA regions,
Agenda. Overview. The Proposed Acquisitions. Benefits to Suntec REIT. Conclusion. Trust Management (Suntec) Limited
 Limited") Agenda Overview The Proposed Acquisitions Benefits to Suntec REIT Conclusion 2 Overview Increased diversification 1 property Existing Portfolio 408 tenants 2.1 mil sqft of Net Lettable Area ( NLA ) $2.2
Agenda Overview The Proposed Acquisitions Benefits to Suntec REIT Conclusion 2 Overview Increased diversification 1 property Existing Portfolio 408 tenants 2.1 mil sqft of Net Lettable Area ( NLA ) $2.2
Charter Hall Long WALE REIT
 Electrolux, Beverley, South Australia Virgin Australia Head Office, Bowen Hills, Queensland Bunnings, South Mackay, Queensland 15 February 2018 Charter Hall Long WALE REIT FY18 Half Year Results Agenda
FY2016 Financial Results
 Cedar Woods Properties Limited FY2016 Financial Results 25 August 2016 Cedar Woods Presentation 2 Agenda 1 Company Overview 2 FY16 Financial Highlights 3 Operational Overview 4 Market Conditions 5 Company
1Q FY2014/15. Financial Results Presentation. 13 August 2014 S Y D N E Y M E L B O U R N E B R I S B A N E C A I R N S
 1Q FY2014/15 Financial Results Presentation 13 August 2014 S Y D N E Y M E L B O U R N E B R I S B A N E C A I R N S B E I J I N G T O K Y O O S A K A S I N G A P O R E Disclaimer This presentation on
Lippo Malls Indonesia Retail Trust 4Q 2016 Results Presentation
 Lippo Malls Indonesia Retail Trust 4Q 2016 Results Presentation 15 February 2017 Disclaimer Certain statements in this presentation concerning our future growth prospects are forward-looking statements,
GOLD COAST OFFICE OVERVIEW
 GOLD COAST OFFICE OVERVIEW JANUARY 2014 Gold Coast OVERVIEW Gold Coast office stock at January 2014 totalled 459,890 sqm, down by almost 4,000 sqm on the mid-year stock level. Around 2,000 sqm of refurbished
Brisbane. Executive Summary. Economic Overview. Q Industrial Market Commentary
 Q3 2017 Industrial Market Commentary Brisbane Executive Summary The Brisbane industrial market is showing tangible signs of improvement, after relatively soft leasing conditions in 2016. Gross take-up
Investor Meeting Presentation. 4 June 2014
 Investor Meeting Presentation 4 June 2014 COMPANY OVERVIEW 1Q2014 RESULTS OVERVIEW OPERATION HIGHLIGHTS Q&A 2 Founded in 1963, listed on the Singapore Exchange in 1964 Three core businesses: - Property
Half Year F1 Results. November 4, 2015
 Half Year F1 Results November 4, 2015 F17 Q1 Results 20 JULY 2016 Q1 BUSINESS HIGHLIGHTS Passenger growth of 18% to 5.8m pax on 17% seat growth Record underlying profit of 38.6m (+14%) despite Easter effect
Frasers Commercial Trust Non-deal roadshow in Hong Kong April 2016
 Frasers Commercial Trust Non-deal roadshow in Hong Kong 25-26 April 2016 Important notice Certain statements in this Presentation constitute forward-looking statements, including forward-looking financial
Forward-Looking Statements Statements in this presentation that are not historical facts are "forward-looking" statements and "safe harbor
 2017 Annual Meeting of Shareholders Presentation May 2017 Forward-Looking Statements Statements in this presentation that are not historical facts are "forward-looking" statements and "safe harbor statements"
CapitaMalls Asia Limited Asia s Leading Mall Developer, Owner and Manager Singapore China Malaysia Japan India
 CapitaMalls Asia Limited Asia s Leading Mall Developer, Owner and Manager Singapore China Malaysia Japan India Joint Venture with Changi Airport Group to Develop an Iconic Mixed-Use Development at Changi
Great Portland Estates Trading Update Strong Operational Performance
 Press Release 6 July 2017 Great Portland Estates Trading Update Strong Operational Performance Great Portland Estates plc ( GPE ) today publishes its trading update for the quarter to 30 June 2017. Continued
23 February The Manager Market Announcements Australian Securities Exchange Limited 20 Bridge Street SYDNEY NSW 2000.
 Level 1 157 Grenfell Street Adelaide SA 5000 GPO Box 2155 Adelaide SA 5001 Adelaide Brighton Ltd ACN 007 596 018 Telephone (08) 8223 8000 International +618 8223 8000 Facsimile (08) 8215 0030 www.adbri.com.au
Frasers Commercial Trust. Portfolio details as at 31 March 2018
 Frasers Commercial Trust Portfolio details as at 31 March 2018 20 April 2018 Portfolio Composition 2 Asset values Total: S$2,219.2 million as at 31 March 2018^ Singapore: S$1,226.0 million (55%) Australia:
Virgin Australia Holdings Limited (ASX: VAH) H1 FY18 Results 1
 H1 FY18 Results 1") Virgin Australia Holdings Limited (ASX: VAH) H1 FY18 Results 1 Summary of H1 FY18 Group Outcomes 2 Group Underlying Profit Before Tax of $102.5 million up 142.3% Group Statutory Profit After Tax of $4.4
Virgin Australia Holdings Limited (ASX: VAH) H1 FY18 Results 1 Summary of H1 FY18 Group Outcomes 2 Group Underlying Profit Before Tax of $102.5 million up 142.3% Group Statutory Profit After Tax of $4.4
GOLD COAST OFFICE OVERVIEW
 GOLD COAST OFFICE OVERVIEW Q1 2015 Gold Coast OVERVIEW Gold Coast office stock at January 2015 totalled 472,022sqm, up by just over 12,000sqm over the past year. The only new building completed in 2014,
Frasers Commercial Trust. Portfolio details as at 30 June 2018
 Frasers Commercial Trust Portfolio details as at 30 June 2018 25 July 2018 Portfolio Composition 2 Asset values Total: S$2,242.9 million as at 30 June 2018^ Singapore: S$1,239.6 million (55%) Australia:
Wizz Air aims to increase market share with F17 capacity growth of 20% Q3 passenger growth of 20%, Load Factor of 88% (+2.3ppt)
") Q3 F17 FINANCIAL RESULTS 1 FEBRUARY 2017 BUSINESS HIGHLIGHTS Current market conditions favour ULCCs Wizz Air aims to increase market share with F17 capacity growth of 20% Q3 passenger growth of 20%, Load
Q3 F17 FINANCIAL RESULTS 1 FEBRUARY 2017 BUSINESS HIGHLIGHTS Current market conditions favour ULCCs Wizz Air aims to increase market share with F17 capacity growth of 20% Q3 passenger growth of 20%, Load
Centurion Corporation Limited
 Centurion Corporation Limited Corporate Presentation 6 January 2014 Disclaimer This presentation and the accompanying presentation materials (if any) ("Presentation") are made for informational purposes,
2012 Full Year Results Briefing. 28 February 2013
 2012 Full Year Results Briefing 28 February 2013 1 KEY FINANCIALS & STRATEGY BUSINESS REVIEW OUTLOOK Q&A 2 UOL GROUP LIMITED KEY FINANCIALS & STRATEGY GWEE LIAN KHENG GROUP CHIEF EXECUTIVE 3 S$m FY 2012
Frasers Hospitality Trust Third Quarter Distribution Income Rose 9.6% to $23.0 Million
 PRESS RELEASE Frasers Hospitality Trust Third Quarter Distribution Income Rose 9.6% to $23.0 Million Boosted mainly by the addition of Novotel Melbourne on Collins and better performance of Australia,
FCOT Portfolio detail as at 30 September 2017
 FCOT Portfolio detail as at 30 September 2017 Portfolio Composition 2 Asset values Net property income TOTAL: S$2,070.9 million as at 30 September 2017^ Singapore: S$1,212.0 million (59%) Australia: S$858.9
Copa Holdings Reports Record Earnings of US$41.8 Million for 4Q06 and US$134.2 Million for Full Year 2006
 Copa Holdings Reports Record Earnings of US$41.8 Million for 4Q06 and US$134.2 Million for Full Year 2006 Panama City, Panama --- March 7, 2007. Copa Holdings, S.A. (NYSE: CPA), parent company of Copa
m3commentary MELBOURNE CBD OFFICE
 m3commentary MELBOURNE CBD OFFICE Spring 2016 Key Research Contacts: Jennifer Williams National Director NSW (02) 8234 8116 Erin Obliubek Research Manager VIC (03) 9605 1075 Casey Robinson Research Manager
Centuria Property Funds Limited CENTURIA METROPOLITAN REIT
 Australian Securities Exchange - Company Announcements Platform Centuria Property Funds Limited CENTURIA METROPOLITAN REIT Victorian Asset Tour Monday, 7 May 2018 Centuria Property Funds Limited (CPFL),
Parques Reunidos Expands to Australia with the Acquisition of Wet n Wild Sydney July 2018
 Parques Reunidos Expands to Australia with the Acquisition of Wet n Wild Sydney July 2018 Disclaimer This document does not constitute or form part of any purchase, sales or exchange offer, nor is it an
OPERATING AND FINANCIAL HIGHLIGHTS SUBSEQUENT EVENTS
 Copa Holdings Reports Financial Results for the Third Quarter of 2016 Excluding special items, adjusted net income came in at $55.3 million, or adjusted EPS of $1.30 per share Panama City, Panama --- November
The Manager Company Announcements Australian Stock Exchange Limited Sydney NSW Dear Sir. Demerger of BHP Steel
 The Manager Company Announcements Australian Stock Exchange Limited Sydney NSW 2000 Dear Sir Demerger of BHP Steel At the time of the announcement of the creation of the DLC between BHP Limited and Billiton
OPERATING AND FINANCIAL HIGHLIGHTS SUBSEQUENT EVENTS
 Copa Holdings Reports Net Income of US$6.2 Million and EPS of US$0.14 for the Third Quarter of 2015 Excluding special items, adjusted net income came in at $37.4 million, or EPS of $0.85 per share Panama
For personal use only Property Portfolio. 31 December 2013
 Property Portfolio. 31 December 2013 Front Cover Property Flint Street Inala, QLD Contents. 1About Australand 2Investment Property Overview 6 Overview 12 Portfolio 44 Office Overview 48 Office Portfolio
State of the States October 2017 State & territory economic performance report. Executive Summary
 State of the States October 2017 State & territory economic performance report. Executive Summary NSW ON TOP; VICTORIA CLOSES IN How are Australia s states and territories performing? Each quarter CommSec
OPERATING AND FINANCIAL HIGHLIGHTS
 Copa Holdings Reports Net Income of US$32.0 Million and EPS of US$0.72 for the Second Quarter of 2012 Excluding special items, adjusted net income came in at $58.6 million, or EPS of $1.32 per share Panama
Land area 1.73 million km 2 Queensland population (as at December 2016) Brisbane population* (preliminary estimate as at 30 June 2016)
 Brisbane population* (preliminary estimate as at 30 June 2016)") Queensland - 11 Queensland OVERVIEW Queensland is nearly five times the size of Japan, seven times the size of Great Britain, and two and a half times the size of Texas. Queensland is Australia s second
Queensland - 11 Queensland OVERVIEW Queensland is nearly five times the size of Japan, seven times the size of Great Britain, and two and a half times the size of Texas. Queensland is Australia s second
OPERATING AND FINANCIAL HIGHLIGHTS. Subsequent Events
 Copa Holdings Reports Net Income of $103.8 million and EPS of $2.45 for the Third Quarter of 2017 Excluding special items, adjusted net income came in at $100.8 million, or EPS of $2.38 per share Panama
Q2 FY2011 Results Presentation
 A Structured Ship Finance Provider Q2 FY2011 Results Presentation g l o b a l p a r t n e r f o r p r e m i u m o p e r a t o r s 1 Important Notice This presentation has been prepared by PST Management
Frasers Commercial Trust. Portfolio details as at 30 September 2018
 Frasers Commercial Trust Portfolio details as at 30 September 2018 19 October 2018 Portfolio Composition 2 Asset values Total: S$2,133.5 million as at 30 September 2018^ Singapore: S$1,140.4 million (54%)
Citigroup Investor Conference October 2010
 Citigroup Investor Conference October 2010 Disclaimer Important information This presentation ti has been prepared in good faith, but no representation ti or warranty, express or implied, is made as to
The Proposed Joint Ventures with The Straits Trading Company Limited And Toga Pty Ltd
 The Proposed Joint Ventures with The Straits Trading Company Limited And Toga Pty Ltd DISCLAIMER This Presentation should be read in conjunction with the Circular to Shareholders dated 24 June 2013 issued
MARKET OUTLOOK. 01 Walkability & Accessibility 02 Infrastructure & Employment 03 Population & Demographics 04 Residential Market 05 Rental Market
 MARKET OUTLOOK BRAYBROOK Close to the city in Melbourne s growing west, access to jobs, services and relative affordability are attracting new residents to Braybrook and driving price growth. 01 Walkability
Land area 1.73 million km 2 Queensland population (December 2015) Brisbane population* (June 2015)
 Brisbane population* (June 2015)") Queensland - 18 Queensland OVERVIEW Queensland is nearly five times the size of Japan, seven times the size of Great Britain, and two and a half times the size of Texas. Queensland is Australia s second
Queensland - 18 Queensland OVERVIEW Queensland is nearly five times the size of Japan, seven times the size of Great Britain, and two and a half times the size of Texas. Queensland is Australia s second
Analyst and Investor Conference Call Q Ulrik Svensson, CFO and Member of the Executive Board
 Analyst and Investor Conference Call Q2 2017 Ulrik Svensson, CFO and Member of the Executive Board Frankfurt, 2 August 2017 Disclaimer The information herein is based on publicly available information.
INTERIM REVIEW OF AUSTRALIAN CONSTRUCTION MARKET CONDITIONS JULY 2015
 INTERIM REVIEW OF AUSTRALIAN CONSTRUCTION MARKET CONDITIONS JULY 2015 2 Review of Australian Construction Market Conditions July 2015 Trade bottlenecks continue in New South Wales, Victoria and Queensland
CONTACT: Investor Relations Corporate Communications
 NEWS RELEASE CONTACT: Investor Relations Corporate Communications 435.634.3200 435.634.3553 Investor.relations@skywest.com corporate.communications@skywest.com SkyWest, Inc. Announces Second Quarter 2017
AHG ANNOUNCES SOLID FULL YEAR RESULT, ACQUISITION OF FIRST AUDI FRANCHISE AND $90 MILLION PLACEMENT TO SUPPORT EXECUTION OF FURTHER GROWTH INITIATIVES
 Not for release or distribution in the United States AHG ANNOUNCES SOLID FULL YEAR RESULT, ACQUISITION OF FIRST AUDI FRANCHISE AND $90 MILLION PLACEMENT TO SUPPORT EXECUTION OF FURTHER GROWTH INITIATIVES
OPERATING AND FINANCIAL HIGHLIGHTS. Subsequent Events
 Copa Holdings Reports Financial Results for the First Quarter of 2016 Excluding special items, adjusted net income came in at US$69.9 million, or EPS of US$1.66 per share Panama City, Panama --- May 5,
A Conversation With Folkestone. November 2017
 A Conversation With Folkestone November 2017 1 POPULATION GROWTH BY STATE Australian Population Growth by State: March 2017 Population (m) Growth in Year ( 000) % Change in Year VIC 6.3 149.4 2.4 ACT 0.4
Investment Opportunity
 Investment Opportunity Quest Apartment Hotel Pakenham Street, Fremantle Investment Highlights 120 key Quest serviced apartment development Fremantle s CBD is undergoing renewal and Sirona Capital is a
OPERATING AND FINANCIAL HIGHLIGHTS. Subsequent Events
 Copa Holdings Reports Net Income of US$113.1 Million and EPS of US$2.57 for the First Quarter of 2015 Excluding special items, adjusted net income came in at US$106.0 million, or EPS of US$2.41 per share
INVESTOR PRESENTATION. 3 Oct 2018
 INVESTOR PRESENTATION 3 Oct 2018 DISCLAIMER This presentation should be read in conjunction with the unaudited second quarter financial statements of Far East Orchard Limited ( FEOrchard ) for the period
Quarterly Interim Management Statement. Three Months to June 30, 2015
 Quarterly Interim Management Statement Three Months to June 30, 2015 BUSINESS HIGHLIGHTS FOR Q1 Record Q1 profitability despite negative Easter effect Lower unit costs further increasing our cost advantage
1HFY2012 RESULTS PRESENTATION
 1HFY2012 RESULTS PRESENTATION 21st February 2012 AWARD WINNING PROPERTY DEVELOPER Listed 1994, consistently profitable, always paid dividends Strategically located and diverse residential portfolio Urban
Qantas Airways Limited
 Qantas Airways Limited Macquarie Australia Conference 8 May 2014 Qantas Guiding Strategic Principles Safety is always our first priority The first choice for customers in every market we serve Maintaining
Devine Limited Annual General Meeting. The Marriott Hotel 515 Queen Street, Brisbane 31 October, am
 Devine Limited Annual General Meeting The Marriott Hotel 515 Queen Street, Brisbane 31 October, 2008 11.00am Agenda 1. Welcome 2. Chairman s Address 3. Managing Director s Address 4. Formal Business CHAIRMAN
Lend Lease Investment Management Australia
 Lend Lease Investment Management Australia Tarun Gupta CEO Australia Lend Lease Investment Management Appropriate photo Market Update May 2007 Australian Business Overview: Funds Under Management (FUM)
The Residential Outlook for South Australia
 The Residential Outlook for South Australia Matthew King Economist HOUSING INDUSTRY ASSOCIATION February 2011 Overview Economic backdrop Other important matters Interest rates & bank lending Renovations
Frasers Centrepoint Limited. Australia Business Overview. 10 June 15. Central Park, Sydney
 Frasers Centrepoint Limited Australia Business Overview 10 June 15 Central Park, Sydney Important Notice Certain statements in this Presentation constitute forward-looking statements, including forward-looking
OPERATING AND FINANCIAL HIGHLIGHTS
 Copa Holdings Reports Financial Results for the Fourth Quarter of 2015 Excluding special items, adjusted net income came in at $31.7 million, or EPS of $0.73 per share Panama City, Panama --- February
THIRD QUARTER RESULTS 2018
 THIRD QUARTER RESULTS 2018 KEY RESULTS In the 3Q18 Interjet total revenues added $ 6,244.8 million pesos that represented an increase of 7.0% over the revenue generated in the 3Q17. In the 3Q18, operating
M2 Group Ltd 2014 Interim Results
 M2 Group Ltd 2014 Interim Results 24 February 2014 Geoff Horth, CEO Presentation Content Record Financial Performance Strong Organic Growth FY14 Priorities and Guidance Slide 2, 24 February 2014 Record
COMMERCIAL UPDATE 21 September 2006
 COMMERCIAL UPDATE 21 September 2006 1 STEVE MANN CEO, Commercial & Industrial Division Stockland Commercial Division update 2 PRESENTATION AGENDA C&I Business Model C&I Mission SEE The Future of Australian
The GPT Group today announced its operational update for the March 2017 quarter.
 THE GPT GROUP ANNOUNCES 27 April 2017 March Quarter Operational Update The GPT Group today announced its operational update for the March 2017 quarter. Key Highlights Retail specialty sales growth of 2.4
South Australian Centre for Economic Studies June 2016 Economic Briefing Report 28 June, 2016
 Steve Whetton, Executive Director, SA Centre for Economic Studies South Australian Centre for Economic Studies June 216 Economic Briefing Report 28 June, 216 Per cent Global GDP Growth 1 8 Developing Countries
2016 Half-Yearly Results
 Presentation 29th July 2016 2016 Half-Yearly Review Underlying profit down 6% Commercial portfolio benefited from higher occupancy Steady contribution from mainland China residential business Profit attributable
ARSN Interim Report Responsible Entity Brookfield Capital Management Limited ACN AFSL
 Brookfield Prime Property Fund ARSN 110 096 663 Interim Report 2015 Responsible Entity Brookfield Capital Management Limited ACN 094 936 866 AFSL 223809 1 Message from the Chairman 2 Half Year Review 5
QANTAS DELIVERS STRONG FIRST HALF RESULT DESPITE HIGHER FUEL BILL
 ASX and Media Release Sydney, 21 February 2019 QANTAS DELIVERS STRONG FIRST HALF RESULT DESPITE HIGHER FUEL BILL Underlying Profit Before Tax: $780 million (down $179 million) Statutory Profit Before Tax:
Land area 1.73 million km 2 Queensland population (as at 31 December 2017) Brisbane population* (preliminary estimate as at 30 June 2017)
 Brisbane population* (preliminary estimate as at 30 June 2017)") Queensland - 11 Queensland OVERVIEW Queensland is nearly five times the size of Japan, seven times the size of Great Britain, and two and a half times the size of Texas. Queensland is Australia s second
Queensland - 11 Queensland OVERVIEW Queensland is nearly five times the size of Japan, seven times the size of Great Britain, and two and a half times the size of Texas. Queensland is Australia s second
Heathrow (SP) Limited
 Limited") Draft v2.0 10 Feb Heathrow (SP) Limited Results for year ended 31 December 2013 24 February 2014 Strong operational and financial performance in 2013 Passenger satisfaction at record high and over 72 million
Draft v2.0 10 Feb Heathrow (SP) Limited Results for year ended 31 December 2013 24 February 2014 Strong operational and financial performance in 2013 Passenger satisfaction at record high and over 72 million
DEXUS Property Group (ASX: DXS) ASX release
 ASX release") 11 February 2016 DEXUS and DWPF acquire North Sydney site for premium office development DEXUS Property Group (DEXUS) and DEXUS Wholesale Property Fund (DWPF) today announced that they have jointly entered
11 February 2016 DEXUS and DWPF acquire North Sydney site for premium office development DEXUS Property Group (DEXUS) and DEXUS Wholesale Property Fund (DWPF) today announced that they have jointly entered
Copa Holdings Reports Fourth Quarter and Full Year 2007 Results
 Copa Holdings Reports Fourth Quarter and Full Year 2007 Results Panama City, Panama --- February 21, 2008. Copa Holdings, S.A. (NYSE: CPA), parent company of Copa Airlines and Aero Republica, today announced
Dexus Property Group INVESTOR PORTFOLIO
 Dexus Property Group INVESTOR PORTFOLIO 31 December 2017 www.dexus.com Table of Contents GP Plus Healthcare Centre, 16 Playford Boulevard, Elizabeth 1 15-23 Whicker Road, Gillman 1 Westfield West Lakes,
4Q FY2011/12 Investor Presentation
 Ascendas India Trust 11 th Annual General Meeting 27 th June 2018 4Q FY2011/12 Investor Presentation ASEAN Stars Conference 2012 1 March 2012 Asia s First Listed Indian Property Trust Asia s First Listed
SkyWest, Inc. Announces First Quarter 2018 Profit
 NEWS RELEASE CONTACT: Investor Relations Corporate Communications 435.634.3200 435.634.3553 Investor.relations@skywest.com corporate.communications@skywest.com SkyWest, Inc. Announces First Quarter 2018
IAG results presentation. Quarter One th May 2018
 IAG results presentation Quarter One 2018 4 th May 2018 Highlights Willie Walsh, Chief Executive Officer Highlights Another strong quarter performance with an operating profit of 280m (5.6% margin, +2.3pts)
Revenue Gross Profit Profit Before Tax Profit After Tax
 TA CORPORATION LTD (Incorporated in the Republic of Singapore on 7 March 2011) (Company Registration No. 201105512R) NEWS RELEASE TA CORPORATION 1Q2012 PROFIT AFTER TAX SOARS 113.5% to S$16.4 MILLION -
Results Presentation FY17
 ASPEN GROUP LIMITED Results Presentation FY17 31 August 2017 Contents 1 2 3 4 5 6 7 FY17 Highlights Financial Results Market Update Portfolio and Acquisitions Update Operating Model Outlook Appendices
Investor Briefing. 4 October 2018 Goodman Property Trust
 Investor Briefing 4 October 2018 Goodman Property Trust Contents Presented by: John Dakin Chief Executive Officer James Spence Director Investment Management Michael Gimblett General Manager - Development
Results Presentation 1H FY18
 ASPEN GROUP LIMITED Results Presentation 1H FY18 23 February 2018 Contents 1 2 3 4 5 1H FY18 Highlights Financial Results Portfolio and Acquisitions Update Outlook Appendices 1 1H FY18 Highlights 3 1H
MGM GROWTH PROPERTIES LLC Second Quarter 2016 Earnings Presentation
 MGM GROWTH PROPERTIES LLC Second Quarter 06 Earnings Presentation August 4, 06 Forward-Looking Statements Statements in this presentation that are not historical facts are "forward-looking" statements
HATTEN LAND LIMITED. Shaping the Future, Melaka and Beyond. FY2017 Results. Corporate Presentation 17 August 2017
 HATTEN LAND LIMITED Shaping the Future, Melaka and Beyond FY2017 Results Corporate Presentation 17 August 2017 Disclaimer Information in this presentation may contain forward-looking statements that reflect
Fourth Quarter 2015 Financial Results
 Fourth Quarter 2015 Financial Results AerCap Holdings N.V. February 23, 2016 Disclaimer Incl. Forward Looking Statements & Safe Harbor This presentation contains certain statements, estimates and forecasts
INVESTOR PRESENTATION. Imperial Capital Global Opportunities Conference September 2015
 INVESTOR PRESENTATION Imperial Capital Global Opportunities Conference September 2015 Forward-looking Statements This presentation contains forward-looking statements within the meaning of the Private
For personal use only
 Sydney Airport Holdings Limited ABN 85 075 295 760 AFSL 236875 Central Terrace Building 10 Arrivals Court Sydney International Airport New South Wales 2020 T 1800 181 895 or +61 2 9667 9871 F +61 2 9667
Cebu Air, Inc. 2Q2014 Results of Operation
 Cebu Air, Inc. 2Q2014 Results of Operation 1 Disclaimer This information provided in this presentation is provided only for your reference. Such information has not been independently verified and, as
1H2017 Financial Results. 4 August 2017
 1H2017 Financial Results 4 August 2017 COMPANY OVERVIEW 1H2017 RESULTS OVERVIEW OPERATION HIGHLIGHTS 2 Founded in 1963, listed on the Singapore Exchange in 1964 Three core businesses: - Property development
Quarter Interim Management Statement. 28 July 2010
 Quarter 3 2010 Interim Management Statement 28 July 2010 Week 4 priorities and initial impressions Priorities: Engage with staff, shareholders, customers and key suppliers Mitigation plan for recent operational
Tiger Airways Holdings Limited FY11 Results
 Tiger Airways Holdings Limited FY11 Results May 2011 Financial Year Ended 31 March 2011 Disclaimer The information contained in this presentation (the "Information") is provided by Tiger Airways Holdings
Annual General Meeting. 20 April 2011
 Annual General Meeting 20 April 2011 Presentation outline 1 FY2010 in review 2 Financial highlights 3 Looking ahead 2 1. FY2010 in review A strident leap forward December 2010 Recent acquisitions in Indonesia: