INVESTOR PRESENTATION. 3 Oct 2018
|
|
|
- Linette Morris
- 5 years ago
- Views:
Transcription
1 INVESTOR PRESENTATION 3 Oct 2018
2 DISCLAIMER This presentation should be read in conjunction with the unaudited second quarter financial statements of Far East Orchard Limited ( FEOrchard ) for the period ended 30 June This presentation is for information only and does not constitute an offer or solicitation of an offer to subscribe for, acquire, purchase, dispose of or sell any shares in FEOrchard or any other securities or investment. This presentation may contain forward-looking statements that involve assumptions, risks and uncertainties. Statements in this presentation that are not historical facts are statements of future expectations with respect to the financial conditions, results of operations and businesses, and related plans and objectives. These forward-looking statements are based on FEOrchard s current intentions, plans, expectations, assumptions and views about future events and are subject to risks, uncertainties and other factors, many of which are outside FEOrchard s control. Because actual results, performance or events could differ materially from FEOrchard s current intentions, plans, expectations, views and assumptions about the future, such forward-looking statements are not, and should not be construed as a representation as to future performance of FEOrchard. It should be noted that the actual performance of FEOrchard may vary significantly from such statements. While FEOrchard and its affiliates have taken reasonable care to ensure the accuracy and completeness of the information provided in this presentation, they will not be liable for any loss or damage of any kind (whether direct, indirect or consequential losses or other economic loss of any kind) suffered due to any omission, error, inaccuracy, incompleteness, or otherwise, any reliance on such information. Neither FEOrchard nor any of its affiliates shall be liable for the content of information provided by or quoted from third parties. The information in this presentation is subject to change without notice. 2


3 CONTENTS About Far East Orchard Business Overview Hospitality Property Financials Strategic Focus
4 ABOUT FAR EAST ORCHARD

5 ABOUT FAR EAST ORCHARD 5
 Denmark, Germany, Hungary, Malaysia Hotel Ownership &")

6 DIVERSIFIED GROWTH PLATFORMS United Kingdom Residential Purpose-built Student Accommodation ( PBSA ) Denmark, Germany, Hungary, Malaysia Hotel Ownership & Management Singapore Hotel Ownership & Management Residential Commercial & Medical Suites Australia Hotel Ownership & Management Residential New Zealand Hotel Management 6


7 H O S P I T A L I T Y
 100% Hospitality Management Hospitality")
8 FAR EAST HOSPITALITY Far East Orchard Limited The Straits Trading Company Limited Toga Group 70% 30% 50% Far East Hospitality Holdings Pte Ltd ( FEHH ) Hospitality Management Hospitality Asset Hospitality Investment 50% Toga Hotel Holdings Unit Trust ( TFE Hotels ) 100% Hospitality Management Hospitality Assets 100% 8


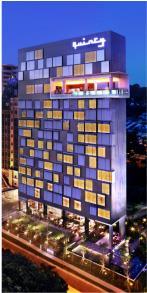
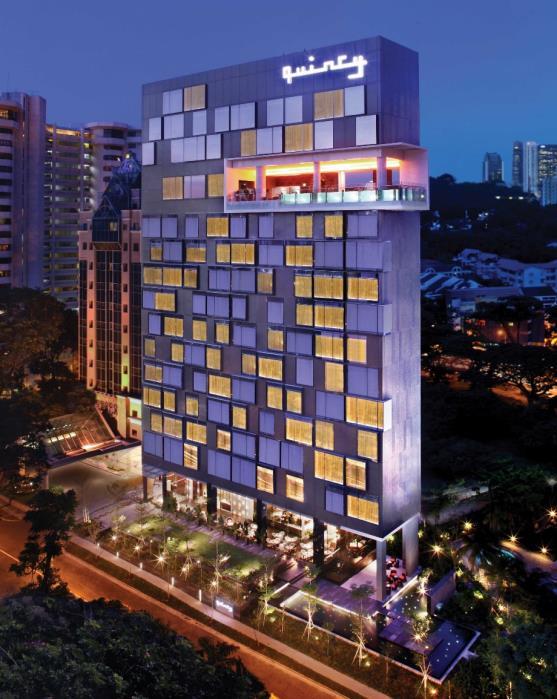
9 OWNED HOSPITALITY PROPERTIES Effective Interest 100% Effective Interest 70% KL, Malaysia Oasia Suites Kuala Lumpur Rooms : 247 Perth, Australia Rendezvous Hotel Perth Scarborough Rooms : 336 Perth Central, Australia Rendezvous Hotel Perth Central Rooms : 103 Melbourne, Australia Rendezvous Hotel Melbourne Rooms : 340 Effective Interest 35% Sydney, Australia Adina Apartment Hotel Sydney Darling Habour Rooms : 114 Adelaide, Australia Adina Apartment Hotel Adelaide Treasury Rooms : 79 Brisbane, Australia Adina Apartment Hotel Brisbane Rooms : 220 Darwin, Australia Travelodge Resort Darwin Rooms : 224 Sydney, Australia 280 George Street [Under Development] Effective Interest 35% Berlin, Germany Adina Apartment Hotel Berlin Checkpoint Charlie Rooms : 127 Berlin, Germany Adina Apartment Hotel Berlin Mitte Rooms : 139 Frankfurt, Germany Adina Apartment Hotel Frankfurt Neue Oper Rooms : 134 Frankfurt, Germany Adina Apartment Hotel Copenhagen Rooms : 128 Includes directly owned properties and properties held through joint ventures 9

 Adina Apartment Hotel")

10 2018 OPENINGS Adina Serviced Apartments Canberra Dickson, Australia (Opened in Mar 2018) Vibe Hotel North Sydney, Australia (Opened in Apr 2018) Adina Apartment Hotel Brisbane, Australia (Opened in Jul 2018) The Calile Hotel Brisbane, Australia (Opened in Sep 2018) 10

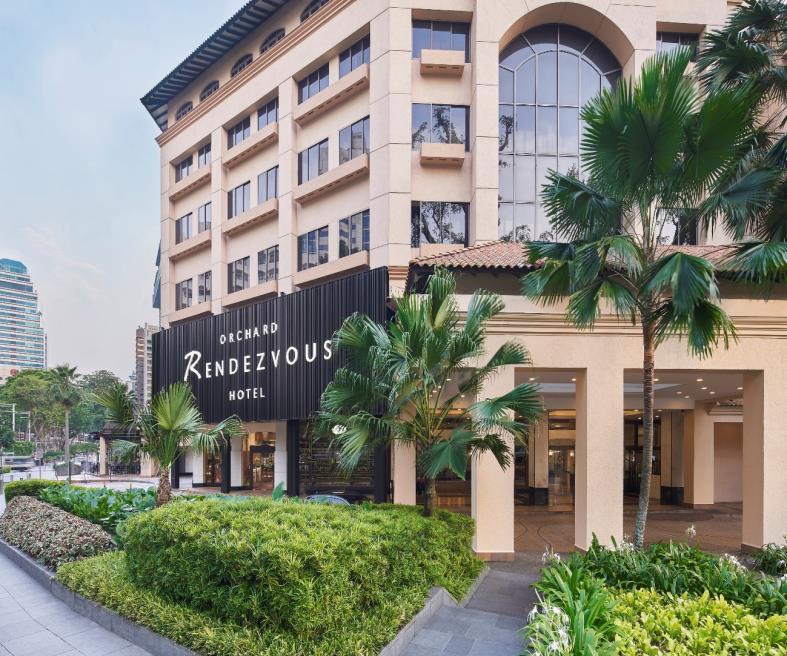
11 OUR HOSPITALITY PORTFOLIO 94 properties with 14,700 rooms* DENMARK 1 property 128 rooms 9 properties ~1,350 rooms GERMANY HUNGARY 1 property 97 rooms 20 properties >4,150 rooms SINGAPORE MALAYSIA 1 property ~ 250 rooms AUSTRALIA 59 properties ~8,300 rooms NEW ZEALAND 3 properties ~450 rooms * As at Sep


12 P R O P E R T Y
13 DEVELOPMENT TRACK RECORD ( ) Project Type Effective Interest TOP No. of Units/beds % sold as at 30 Jun 2018 euhabitat Residential 20% % SBF Center Commercial 20% % RiverTrees Residences Residential 30% % Harbourfront Balmain (Sydney, Australia) Residential, Commercial 50% % Portland Green Student Village ( PGSV ) - Bryson Court (Newcastle upon Tyne, UK) PGSV - Marshall Court (Newcastle upon Tyne, UK) PGSV - Newton Court (Newcastle upon Tyne, UK) PBSA 100% N.A. PBSA 100% N.A. PBSA 100% N.A. 13


14 ONGOING DEVELOPMENT PROJECTS Expected completion in 2019 Expected completion in 2021 Former Westminster Fire Station London, United Kingdom 17 units and a restaurant FEOrchard s Effective Interest: 98% Woods Square Singapore 514 units FEOrchard s Effective Interest: 33% 14


15 INVESTMENTS - UK STUDENT ACCOMMODATION Portland Green Student Village, Newcastle upon Tyne Total no. of beds in operational portfolio: 1,469 Brighton Under Development Bryson Court 366 beds Marshall Court 196 beds Newton Court 295 beds Opened in Aug 2018 Hollingdean Road 193 beds Expected completion in 2019 Rosedale Court 338 beds Turner Court 274 beds 15


16 INVESTMENTS - HEALTHCARE Novena Specialist Center Novena Medical Center SBF Center Medical Suites for Sale : 30 Medical Suites for Lease : 10 Medical Suites for Sale : 7 Medical Suites for Lease : 37 Medical Suites for Sale : 1 16
17 FINANCIALS
18 3-YEAR FINANCIAL HIGHLIGHTS 2017 S$' S$' S$'000 Property Development Sales ,829 Operating profit/(loss) 173 (267) 5,439 Share of profit of joint ventures 6,941 50,433 6,819 Share of profit of associated companies - (352) (3) Property Investment Sales 14,821 15,011 11,349 Operating profit 6,517 7,312 6,527 Share of profit of joint ventures Hospitality Sales 136, , ,689 Operating profit 12,098 16,803 20,995 Share of profit of joint ventures 4,590 18,646 10,170 Share of profit of associated companies 2,678 2,649 2,551 Total Sales 151, , ,867 Total Operating Profit 33,128 95,224 52,498 Profit Attributable to Equity Holders of the Company 21,606 65,041 29,138 18
19 3-YEAR FINANCIAL HIGHLIGHTS Property Development Earnings from property development is lumpy in nature. The recognition of sale and profit is dependent on project completion and sales Share of profit of joint ventures in FY2016 was from the joint venture projects - SBF Center and RiverTrees Residences Joint venture project, Harbourfront Balmain in Sydney, was completed in FY2017. Share of profit recognised in FY2017 was for 75% of the units sold and delivered to the buyers in the same year Property Investment Reduce the lumpiness from the development business Extension into the student accommodation asset class in the UK in 2015 has enabled us to strengthen our recurring income base Hospitality Core contributor to our recurring income base Sales declined as certain onerous hospitality leases in Australia and New Zealand progressively came to an end in FY2015 and FY2016. The Group would no longer be financially burdened by these loss-making leases Share of profit of joint ventures in FY2016 and FY2015 were boosted by one-off gain from the sale of a hotel in Sydney and Brisbane in the respective years 19
20 1H2018 FINANCIAL HIGHLIGHTS 1H2018 $'000 1H2017 $'000 Increase/ (Decrease) % Sales 74,945 75,426 (0.6) Gross profit 26,753 24, Profit before income tax 9,522 9,861 (3.4) Profit attributable to shareholders 9,223 6,
21 1H2018 KEY FINANCIAL INDICATORS Healthy balance sheet and low gearing ratio 30 Jun Dec 17 Net asset value per share (1) (S$) Debt equity ratio Profit attributable to shareholders (S$ 000) 1H2018 1H2017 9,223 6,682 Basic and diluted EPS (2) 2.17 cents 1.58 cents 1 Based on number of issued shares at the end of the period 2 Based on weighted average number of ordinary shares in issue. Figures have been rounded. 21
22 DIVIDEND DISTRIBUTION FY17 FY16 FY15 First and Final Dividend 6.00 cents 6.00 cents 6.00 cents Dividend Yield 1 4.2% 4.0% 3.8% 1 Based on Far East Orchard s closing share price at book closure date $1.44(16 May 2018), $1.51(15 May 2017), $1.57 (13 May 2016) 22
23 STRATEGIC FOCUS
24 OUR STRATEGIC FOCUS Our long-term strategy is to improve the quality of our earnings and smooth out the lumpiness in earnings that is inherent as a property developer Recurring Income Non-Recurring Income Hospitality Management Hospitality Ownership & Healthcare Assets Student Accommodation Property development Increase number of hospitality management contracts Acquire strategic assets Divest properties to recycle capital for re-deployment towards higher yielding growth Seek suitable real estate development opportunities 24
25 BUILDING A STRONGER HOSPITALITY PORTFOLIO * 2023 TARGET >90 PROPERTIES 115 PROPERTIES 150 PROPERTIES >14,000 ROOMS > 18,500 ROOMS OR 30,000 ROOMS *Based on signed management contracts as at Sep


26 STRONG HOSPITALITY PIPELINE TO >90 PROPERTIES >14,000 ROOMS Adina Apartment Hotel Macquarie Park Sydney, Australia Adina Apartment Hotel Melbourne West End, Australia Vibe Hotel Darling Harbour, Australia 2020 * 115 PROPERTIES > 18,500 ROOMS Adina Apartment Hotel Freiburg, Germany Adina Apartment Hotel Munich, Germany Village Hotel at Sentosa, Singapore *Based on signed management contracts as at Sep

27 UK STUDENT ACCOMMODATION TARGET 1,174 BEDS 1,469 BEDS 3,000 BEDS 27

28 BUILDING OUR ORGANISATIONAL BACKBONE INVESTMENTS IN ORGANISATIONAL BACKBONE WILL SUPPORT OUR STRONG PIPELINE Total pipeline supply of ~3,700 rooms across 21 properties by 2020* Build younger talent pool Cost controls to maximise profits Strengthen backend infrastructure Increase productivity and scalability, and streamline processes *Based on signed management contracts as at Sep 2018
29 T H A N K Y O U
The Proposed Joint Ventures with The Straits Trading Company Limited And Toga Pty Ltd
 The Proposed Joint Ventures with The Straits Trading Company Limited And Toga Pty Ltd DISCLAIMER This Presentation should be read in conjunction with the Circular to Shareholders dated 24 June 2013 issued
(Incorporated in the Republic of Singapore) (Company Registration No H)
 (Company Registration No H)") FAR EAST ORCHARD LIMITED (Incorporated in the Republic of Singapore) (Company Registration No. 196700511H) MEDIA RELEASE FAR EAST ORCHARD TO SET UP JOINT VENTURE WITH THE STRAITS TRADING COMPANY TO CONDUCT
FAR EAST ORCHARD LIMITED (Incorporated in the Republic of Singapore) (Company Registration No. 196700511H) MEDIA RELEASE FAR EAST ORCHARD TO SET UP JOINT VENTURE WITH THE STRAITS TRADING COMPANY TO CONDUCT
FAR EAST ORCHARD TO ENTER INTO A JOINT VENTURE WITH TOGA GROUP TO FORM ONE OF THE LARGEST HOSPITALITY MANAGEMENT PLATFORMS IN AUSTRALIA
 FAR EAST ORCHARD LIMITED (Incorporated in the Republic of Singapore) (Company Registration No. 196700511H) MEDIA RELEASE FAR EAST ORCHARD TO ENTER INTO A 50-50 JOINT VENTURE WITH TOGA GROUP TO FORM ONE
Centurion Corporation Limited
 Centurion Corporation Limited Corporate Presentation 6 January 2014 Disclaimer This presentation and the accompanying presentation materials (if any) ("Presentation") are made for informational purposes,
Investor Meeting Presentation. 4 June 2014
 Investor Meeting Presentation 4 June 2014 COMPANY OVERVIEW 1Q2014 RESULTS OVERVIEW OPERATION HIGHLIGHTS Q&A 2 Founded in 1963, listed on the Singapore Exchange in 1964 Three core businesses: - Property
SET Opportunity Day #3/2011
 SET Opportunity Day #3/2011 2Q11 & 1H11 Performance & Outlook 18 August 2011 The views expressed here contain some information derived from publicly available sources that have not been independently verified.
1H2017 Financial Results. 4 August 2017
 1H2017 Financial Results 4 August 2017 COMPANY OVERVIEW 1H2017 RESULTS OVERVIEW OPERATION HIGHLIGHTS 2 Founded in 1963, listed on the Singapore Exchange in 1964 Three core businesses: - Property development
Centurion Corporation Limited Presentation. January 2015
 Centurion Corporation Limited Presentation January 2015 Disclaimer This presentation should be read in conjunction with the Company s 3Q 2014 Unaudited Financial Statement Announcement for the period ended
1Q2017 Financial Results. 12 May 2017
 1Q2017 Financial Results 12 May 2017 COMPANY OVERVIEW 1Q2017 RESULTS OVERVIEW OPERATION HIGHLIGHTS 2 Founded in 1963, listed on the Singapore Exchange in 1964 Three core businesses: - Property development
Oxley Delivers Stellar Growth of 58% in PATMI to. S$130.9 million for HY2017
 For immediate release Oxley Delivers Stellar Growth of 58% in PATMI to S$130.9 million for HY2017 - Half-year revenue increased by 19% year-on-year to S$732.2 million - Gross profit margin increased from
HK GAAP RESULTS RELEASE 12 August 2008 STAR CRUISES GROUP ANNOUNCES FIRST HALF RESULTS FOR 2008
 HK GAAP RESULTS RELEASE 12 August 2008 FOR IMMEDIATE RELEASE INTERNATIONAL STAR CRUISES GROUP ANNOUNCES FIRST HALF RESULTS FOR 2008 The below commentary is prepared based on the comparison of the results
3Q2017 Financial Results. 9 November 2017
 3Q2017 Financial Results 9 November 2017 COMPANY OVERVIEW 3Q2017 RESULTS OVERVIEW OPERATION HIGHLIGHTS 2 Founded in 1963, listed on the Singapore Exchange in 1964 Three core businesses: - Property development
FY2016 Financial Results
 Cedar Woods Properties Limited FY2016 Financial Results 25 August 2016 Cedar Woods Presentation 2 Agenda 1 Company Overview 2 FY16 Financial Highlights 3 Operational Overview 4 Market Conditions 5 Company
Investor Briefings First-Half FY2016 Financial Results
 Cedar Woods Properties Limited Investor Briefings First-Half FY2016 Financial Results 26 February 2016 Cedar Woods Presentation 2 Snapshot of Achievements in FY2016 Extensive portfolio of residential estates
Centurion Corporation Limited 4Q and FY 2015 Financial Results. 23 February 2016
 Centurion Corporation Limited 4Q and FY 2015 Financial Results 23 February 2016 Disclaimer This presentation should be read in conjunction with the Company s 4Q and FY 2015 Unaudited Financial Statement
Indiabulls Real Estate Limited (CIN : L45101DL2006PLC148314)
") Indiabulls Real Estate Limited (CIN : L45101DL2006PLC148314) Earnings Update Audited Financial Results FY 2013-14 April 23, 2014 Safe Harbor Statement This document contains certain forward looking statements
Indiabulls Real Estate Limited (CIN : L45101DL2006PLC148314) Earnings Update Audited Financial Results FY 2013-14 April 23, 2014 Safe Harbor Statement This document contains certain forward looking statements
2010 Full Year Results Briefing. 22 February 2011
 2010 Full Year Results Briefing 22 February 2011 1 2010 IN SUMMARY RESULTS OVERVIEW PERFORMANCE REVIEW GOING FORWARD Q&A 2 UOL GROUP LIMITED 2010 IN SUMMARY RESULTS OVERVIEW GWEE LIAN KHENG GROUP CHIEF
FY2017 Financial Results
 Cedar Woods Properties Limited FY2017 Financial Results 22 August 2017 Cedar Woods strategy Cedar Woods Presentation 2 To grow and develop our national project portfolio, diversified by: geography product
PAN PACIFIC HOTELS GROUP LIMITED 2010 FULL YEAR RESULTS BRIEFING 22 FEB 2011
 PAN PACIFIC HOTELS GROUP LIMITED 2010 FULL YEAR RESULTS BRIEFING 22 FEB 2011 2010 RESULTS OVERVIEW STRATEGIC & OPERATIONS HIGHLIGHTS NEO SOON HUP CHIEF FINANCIAL OFFICER 2 CONTENTS Focus and Highlights
Euroz Rottnest Investor Briefing
 Cedar Woods Properties Limited Euroz Rottnest Investor Briefing 15 March 2016 Cedar Woods Presentation 2 Snapshot of Achievements in FY2016 Extensive portfolio of residential estates in Perth and WA regions,
HATTEN LAND LIMITED. Shaping the Future, Melaka and Beyond. FY2017 Results. Corporate Presentation 17 August 2017
 HATTEN LAND LIMITED Shaping the Future, Melaka and Beyond FY2017 Results Corporate Presentation 17 August 2017 Disclaimer Information in this presentation may contain forward-looking statements that reflect
Interim Report 3m Bilfinger Berger SE, Mannheim May 10, 2012 Joachim Müller, CFO
 Interim Report 3m 2012 Bilfinger Berger SE, Mannheim May 10, 2012 Joachim Müller, CFO Bilfinger Berger SE Interim report 3m 2012 May 10, 2012 Page 1 3m 2012: Highlights Growth in output volume and orders
Results Presentation 1H FY18
 ASPEN GROUP LIMITED Results Presentation 1H FY18 23 February 2018 Contents 1 2 3 4 5 1H FY18 Highlights Financial Results Portfolio and Acquisitions Update Outlook Appendices 1 1H FY18 Highlights 3 1H
Ramsay Health Care Limited Results Briefing Year ended 30 June 2018
 Ramsay Health Care Limited Results Briefing Year ended 30 June 2018 Craig McNally, Managing Director & Bruce Soden, Group Finance Director 30 August 2018 ramsayhealth.com Agenda Group Performance Overview
CENTURION CORP ACHIEVES RECORD NET PROFIT OF S$31.1 MILLION FROM ITS CORE BUSINESS OPERATIONS FOR FY2014
 PRESS RELEASE For Immediate Release CENTURION CORP ACHIEVES RECORD NET PROFIT OF S$31.1 MILLION FROM ITS CORE BUSINESS OPERATIONS FOR FY2014 Highest ever revenue of S$84.4 million for FY2014 63% growth
THIRD QUARTER OPERATING PROFIT UP 13% TO $330 MILLION
 13 February 2018 Page 1 of 7 ` No. 01/18 13 February 2018 THIRD QUARTER OPERATING PROFIT UP 13% TO $330 MILLION Higher carriage and load factors for all passenger airlines Strong earnings for SIA Cargo
CENTURION CORP RECORDS 43% NET PROFIT GROWTH TO S$10.2 MILLION IN 3Q 2017
 PRESS RELEASE For Immediate Release CENTURION CORP RECORDS 43% NET PROFIT GROWTH TO S$10.2 MILLION IN 3Q 2017 Net profit grew 43% to S$10.2 million in 3Q 2017, against revenue growth of 15% to S$32.3 million
Crown Resorts Limited
 Crown Resorts Limited 2015 Full Year Results Presentation 13 August 2015 1 Crown Resorts Limited Results Overview Crown Resorts Limited (Crown) performance: Overall, the results for Crown s portfolio of
For personal use only
 SMS Management & Technology Level 41 140 William Street Melbourne Victoria 3000 Australia T +61 1300 842 767 F +61 1300 329 767 www.smsmt.com Melbourne Sydney Brisbane Canberra Adelaide Hong Kong Vietnam
Q3 FY18 Business Highlights
 Q3 FY18 RESULTS Q3 FY18 Business Highlights 1 2 3 4 5 6 7 Record passengers 7.1m, record revenues 423m Investing in growth 24% passenger growth in Q3 Disciplined cost management flat ex-fuel CASK Largest
1HFY2012 RESULTS PRESENTATION
 1HFY2012 RESULTS PRESENTATION 21st February 2012 AWARD WINNING PROPERTY DEVELOPER Listed 1994, consistently profitable, always paid dividends Strategically located and diverse residential portfolio Urban
23 February The Manager Market Announcements Australian Securities Exchange Limited 20 Bridge Street SYDNEY NSW 2000.
 Level 1 157 Grenfell Street Adelaide SA 5000 GPO Box 2155 Adelaide SA 5001 Adelaide Brighton Ltd ACN 007 596 018 Telephone (08) 8223 8000 International +618 8223 8000 Facsimile (08) 8215 0030 www.adbri.com.au
1Q FY2014/15. Financial Results Presentation. 13 August 2014 S Y D N E Y M E L B O U R N E B R I S B A N E C A I R N S
 1Q FY2014/15 Financial Results Presentation 13 August 2014 S Y D N E Y M E L B O U R N E B R I S B A N E C A I R N S B E I J I N G T O K Y O O S A K A S I N G A P O R E Disclaimer This presentation on
2012 Full Year Results Briefing. 28 February 2013
 2012 Full Year Results Briefing 28 February 2013 1 KEY FINANCIALS & STRATEGY BUSINESS REVIEW OUTLOOK Q&A 2 UOL GROUP LIMITED KEY FINANCIALS & STRATEGY GWEE LIAN KHENG GROUP CHIEF EXECUTIVE 3 S$m FY 2012
Leaving the Competition Behind. Second Quarter (Apr-Jun) 2009 Results
 2009 Results") Leaving the Competition Behind Second Quarter (Apr-Jun) 2009 Results 12 Aug 2009 1 Disclaimer Information contained in our presentation is intended solely for your reference. Such information is subject
Leaving the Competition Behind Second Quarter (Apr-Jun) 2009 Results 12 Aug 2009 1 Disclaimer Information contained in our presentation is intended solely for your reference. Such information is subject
For personal use only
 THE GPT GROUP ANNOUNCES 29 October 2014 September Quarter Operational Update Key Highlights 2014 earnings guidance upgraded to at least 4 per cent earnings per security (EPS) growth Strong leasing momentum
THIRD QUARTER OPERATING PROFIT UP 96%
 4 February 2016 Page 1 of 7 No. 01/16 4 February 2016 THIRD QUARTER OPERATING PROFIT UP 96% Healthy expansion at SilkAir and Scoot Slide in fuel prices provided cost relief to the Group, in a weak yield
KSH HOLDINGS LIMITED. Corporate Presentation May 27, 2014
 KSH HOLDINGS LIMITED Corporate Presentation May 27, 2014 KSH Corporate Presentation OVERVIEW KSH Holdings Limited RESULTS FY2014 UPDATES Corporate Developments OUTLOOK Strategies Moving Forward CONCLUSION
A Conversation With Folkestone. November 2017
 A Conversation With Folkestone November 2017 1 POPULATION GROWTH BY STATE Australian Population Growth by State: March 2017 Population (m) Growth in Year ( 000) % Change in Year VIC 6.3 149.4 2.4 ACT 0.4
Aspen Achieves Record Net Profit of RM85.4 Million in FY2017
 PRESS RELEASE - FOR IMMEDIATE RELEASE Aspen Achieves Record Net Profit of RM85.4 Million in FY2017 4Q FY2017 Net Profit of RM42.0 Million Almost Matches 9M FY2017 Net Profit of RM43.4 Million Strong revenue
Wizz Air aims to increase market share with F17 capacity growth of 20% Q3 passenger growth of 20%, Load Factor of 88% (+2.3ppt)
") Q3 F17 FINANCIAL RESULTS 1 FEBRUARY 2017 BUSINESS HIGHLIGHTS Current market conditions favour ULCCs Wizz Air aims to increase market share with F17 capacity growth of 20% Q3 passenger growth of 20%, Load
Q3 F17 FINANCIAL RESULTS 1 FEBRUARY 2017 BUSINESS HIGHLIGHTS Current market conditions favour ULCCs Wizz Air aims to increase market share with F17 capacity growth of 20% Q3 passenger growth of 20%, Load
FULL YEAR OPERATING PROFIT RISES TO $259 MILLION 25 CENTS SPECIAL DIVIDEND PROPOSED OUTLOOK REMAINS CHALLENGING
 8 May 2014 Page 1 of 5 No. 02/14 8 May 2014 FULL YEAR OPERATING PROFIT RISES TO $259 MILLION 25 CENTS SPECIAL DIVIDEND PROPOSED OUTLOOK REMAINS CHALLENGING GROUP FINANCIAL PERFORMANCE Financial Year 2013-14
Citigroup Investor Conference October 2010
 Citigroup Investor Conference October 2010 Disclaimer Important information This presentation ti has been prepared in good faith, but no representation ti or warranty, express or implied, is made as to
Cebu Air, Inc. 4 th Quarter and Full Year 2017 Results of Operations. cebupacificair.com
 Cebu Air, Inc. 4 th Quarter and Full Year 2017 Results of Operations cebupacificair.com Disclaimer The information provided in this presentation is provided only for your reference. Such information has
$131 MILLION OPERATING PROFIT IN THIRD QUARTER AMID CHALLENGING ENVIRONMENT
 7 February 2013 Page 1 of 3 No. 01/13 07 February 2013 $131 MILLION OPERATING PROFIT IN THIRD QUARTER AMID CHALLENGING ENVIRONMENT GROUP FINANCIAL PERFORMANCE Third Quarter 2012-13 The SIA Group recorded
SECOND QUARTER OPERATING PROFIT IMPROVES TO $87 MILLION
 12 November 2013 Page 1 of 5 No. 05/13 12 November 2013 SECOND QUARTER OPERATING PROFIT IMPROVES TO $87 MILLION GROUP FINANCIAL PERFORMANCE Second Quarter 2013-14 The Group earned an operating profit of
Corporate Presentation 2012/13 Interim Results
 Corporate Presentation 2012/13 Interim Results 26 February 2013 0 Disclaimer The information contained in this presentation is intended solely for your personal reference. Such information is subject to
PROFIT OF $1.24b ON STRONG REVENUE GAINS BUT FUEL COSTS REMAIN GREATEST CHALLENGE
 PROFIT OF $1.24b ON STRONG REVENUE GAINS BUT FUEL COSTS REMAIN GREATEST CHALLENGE HIGHLIGHTS OF THE GROUP S PERFORMANCE Financial Year 2005-06 4th Quarter 2005-06 Apr 2005 Mar 2006 Year-on-Year % Change
Crown Resorts Limited
 Crown Resorts Limited 2016 Half Year Results Presentation 25 February 2016 1 Crown Resorts Limited Results Overview Crown Resorts Limited (Crown) performance: The 2016 First Half results across Crown s
FIRST QUARTER OPERATING PROFIT RISES TO $281 MILLION
 27 July 2017 Page 1 of 5 No. 03/17 27 July 2017 FIRST QUARTER OPERATING PROFIT RISES TO $281 MILLION Revenue improvement seen for all SIA Group airlines, but pressure on yields remains Earnings supported
UOL Group 3Q2018 Financial Results 13 November 2018
 UOL Group 3Q2018 Financial Results 13 November 2018 AGENDA 3Q2018 KEY FINANCIALS OPERATION HIGHLIGHTS 2 COMPANY OVERVIEW UOL Group Limited (UOL) was founded in 1963 and listed on the Singapore Exchange
TUI GROUP INVESTOR PRESENTATION
 TUI GROUP INVESTOR PRESENTATION German Investment Conference UniCredit / Kepler Munich, 26-27 September 2012 Future-related statements This presentation contains a number of statements related to the future
STRONG OPERATING RESULTS LIFT NET PROFIT 7.3% TO $932 MILLION
 STRONG OPERATING RESULTS LIFT NET PROFIT 7.3% TO $932 MILLION GROUP FINANCIAL PERFORMANCE First Half 2007-08 The Group achieved an operating profit of $982 million for the first half of financial year
UOL Group 1H2018 Financial Results 3 August 2018
 UOL Group 1H2018 Financial Results 3 August 2018 AGENDA 1H2018 KEY FINANCIALS OPERATION HIGHLIGHTS 2 COMPANY OVERVIEW UOL Group Limited (UOL) was founded in 1963 and listed on the Singapore Exchange in
Qantas Group - Positioned for Growth and Sustainable Returns
 Qantas Group - Positioned for Growth and Sustainable Returns Tino La Spina, Qantas Group Chief Financial Officer Macquarie Australia Conference 3 May 2018 Third Quarter 1 FY18 Trading Update Q3 trading
Investor update presentation. November 2016
 Investor update presentation November 2016 Content Update on Q3 2016 financial performance 3-8 Recap on ATG Evolution 9-10 Update on hospitality strategic business unit 11-14 Update on online travel and
2008 INTERIM ANNOUNCEMENT
 (Stock Code: 78) 2008 INTERIM ANNOUNCEMENT FINANCIAL HIGHLIGHTS Six months ended 30th June, 2008 (Unaudited) Six months ended 30th June, 2007 (Unaudited) HK$ M HK$ M Revenue 750.8 622.0 Operating profit
Presentation on Results for the 2nd Quarter FY Idemitsu Kosan Co.,Ltd. November 14, 2018
 Presentation on Results for the 2nd Quarter FY 2018 Idemitsu Kosan Co.,Ltd. November 14, 2018 Table of Contents 1. FY 2018 2nd Quarter Financials (1) Overview (2) Segment Information 2. Reference Materials
Ramsay Health Care Limited Results Briefing Half Year ended 31 December 2018
 Ramsay Health Care Limited Results Briefing Half Year ended 31 December 2018 Craig McNally, Group Managing Director & Bruce Soden, Group Finance Director 28 February 2019 ramsayhealth.com Agenda Group
The Property Franchise Group
 The Property Franchise Group Capital Markets Event 22 October 2015 This afternoon s agenda 2 15:15 Welcome Richard Martin, Chairman 15:20 Introduction to MartinCo PLC Ian Wilson, Chief Executive Officer
GROUP FINANCIAL HIGHLIGHTS
 AGENDA FINANCIAL HIGHLIGHTS OPERATIONS HIGHLIGHTS INCOME STATEMENT REVIEW BALANCE SHEET REVIEW KEY PERFORMANCE INDICATORS OPERATIONAL REVIEW AIRLINES COMPARATIVE PERFORMANCE OUTLOOK GROUP FINANCIAL HIGHLIGHTS
THIRD QUARTER NET PROFIT OF $397 MILLION ON RECORD REVENUE
 THIRD QUARTER NET PROFIT OF $397 MILLION ON RECORD REVENUE HIGHLIGHTS OF THE GROUP S PERFORMANCE 3rd Quarter 2005-06 9 Months 2005-06 Year-on-Year Apr-Dec % Change 2005 Oct-Dec 2005 Year-on-Year % Change
FULL YEAR FINANCIAL REPORT
 FULL YEAR FINANCIAL REPORT 1 Jan 31 Dec 2013 27 February 2014 ANALYST / MEDIA BRIEFING Artist s Impression of Lush Acres FINANCIAL HIGHLIGHTS Artist s Impression of D Nest KEY FINANCIAL HIGHLIGHTS Delivered
Quarterly Meeting# 4/2018
 Quarterly Meeting# 4/2018 3Q18 & 9M18 Performance & Outlook 14 November 2018 1 2016 ERAWAN. All rights reserved. The views expressed here contain some information derived from publicly available sources
Crown Resorts Limited
 Crown Resorts Limited Annual General Meeting 20 October 2016 1 Presentation Outline F16 Year in Review 2 Crown Resorts Limited Group Result F16 Normalised $m F15 Normalised $m Variance F/(U) F16 Actual
JAPAN AIRLINES Co., Ltd. Financial Results 1 st Quarter Mar/2018(FY2017)
") JAPAN AIRLINES Co., Ltd. Financial Results Mar/2018(FY2017) July 31, 2017 Today s Topics P.1 P.2 P.3 P.4 P.6 P.15 Overview of Financial Results for (FY2017) 1 st quarter resulted in an increase in both
JAPAN AIRLINES Co., Ltd. Financial Results Mar/2018(FY2017) July 31, 2017 Today s Topics P.1 P.2 P.3 P.4 P.6 P.15 Overview of Financial Results for (FY2017) 1 st quarter resulted in an increase in both
RAMSAY HEALTH CARE REPORTS 17.7% RISE IN FULL YEAR CORE EPS AND 16.8% RISE IN CORE NET PROFIT
 ASX ANNOUNCEMENT 30 August 2016 RAMSAY HEALTH CARE REPORTS 17.7% RISE IN FULL YEAR CORE EPS AND 16.8% RISE IN CORE NET PROFIT Financial Highlights Core net profit after tax 1 (Core NPAT) up 16.8% to $481.4
FIRST HALF NET PROFIT UP 32% TO $425 MILLION
 7 November 2017 Page 1 of 7 No. 05/17 7 November 2017 FIRST HALF NET PROFIT UP 32% TO $425 MILLION Improvement led by higher operating profit All passenger airlines recorded higher flown revenue Interim
9M 13 Results. October 31, M 13 Results.
 October 31, 2013 www.atresmediacorporacion.com 1 9M 13 Highlights According to Infoadex, Total Ad market declined by -12.6% in 9M 13 (TV and Radio down by -10.4% and -12.7% yoy respectively) Atresmedia
JAPAN AIRLINES Co., Ltd. Financial Results 1 st Quarter Mar/2017(FY2016) July 29, 2016
 July 29, 2016") JAPAN AIRLINES Co., Ltd. Financial Results Mar/2017(FY2016) July 29, 2016 Today s Topics P.1 P.2 P.13 From the first quarter of this fiscal year, figures for Revenue Passengers Carried, ASK, RPK and Load
JAPAN AIRLINES Co., Ltd. Financial Results Mar/2017(FY2016) July 29, 2016 Today s Topics P.1 P.2 P.13 From the first quarter of this fiscal year, figures for Revenue Passengers Carried, ASK, RPK and Load
PRESS ANNOUNCEMENT JULY 28, 1999 For Immediate Release STAR CRUISES REPORTS RECORD SECOND QUARTER EARNINGS
 PRESS ANNOUNCEMENT JULY 28, 1999 For Immediate Release STAR CRUISES REPORTS RECORD SECOND QUARTER EARNINGS STAR CRUISES PLC announced record net income of US$20.7 million (US 3.3 cents earnings per share)
FIRST QUARTER OPERATING PROFIT IMPROVES 69% TO $463 MILLION
 FIRST QUARTER OPERATING PROFIT IMPROVES 69% TO $463 MILLION PARENT AIRLINE OPERATIONS DRIVE GROUP OPERATING PROFIT The Group made an operating profit of $463 million for the first quarter of 2007-08; an
Cebu Air, Inc. 2Q2014 Results of Operation
 Cebu Air, Inc. 2Q2014 Results of Operation 1 Disclaimer This information provided in this presentation is provided only for your reference. Such information has not been independently verified and, as
2011 Full Year Results Briefing. 24 February 2012
 2011 Full Year Results Briefing 24 February 2012 1 KEY FINANCIALS 2011 HIGHLIGHTS PERFORMANCE REVIEW GOING FORWARD Q&A 2 UOL GROUP LIMITED KEY FINANCIALS 2011 HIGHLIGHTS GWEE LIAN KHENG GROUP CHIEF EXECUTIVE
RESULTS PRESENTATION 22 FEBRUARY 2019
 RESULTS PRESENTATION 22 FEBRUARY 2019 H A L F Y E A R E N D E D 3 1 D E C E M B E R 2 0 1 8 EVENT YEAR END RESULTS WEBCAST AND DIAL IN DETAILS FRIDAY 22 FEBRUARY 2019 9:00 AM (AEDT) Access a webcast of
1H2018 Financial Results
 Cedar Woods Properties Limited 1H2018 Financial Results 22 February 2018 Cedar Woods strategy Cedar Woods Presentation 2 To grow and develop our national project portfolio, diversified by: geography product
Devine Limited Annual General Meeting. The Marriott Hotel 515 Queen Street, Brisbane 31 October, am
 Devine Limited Annual General Meeting The Marriott Hotel 515 Queen Street, Brisbane 31 October, 2008 11.00am Agenda 1. Welcome 2. Chairman s Address 3. Managing Director s Address 4. Formal Business CHAIRMAN
Cathay Pacific Airways Interim Results for the six months ended 30 June 2012
 Cathay Pacific Airways Interim Results for the six months ended 30 June 2012 8 August 2012 1 Interim Result 1H2012 1H2011 Change Group attributable (loss) / profit HK$ million (935) 2,808-133.3% Group
Financial Results 3 rd Quarter MAR/2016 (FY2015)
") Financial Results MAR/2016 (FY2015) January 29 th, 2016 CONTENTS P.1 P.2 P.3 P.4~ Overview of FY MAR/16 Results Operating Revenue Operating Profit 1,030 1,020 1,010 +1.0Bn 1,022.3 1,023.4 (+0.1%) 180 160
Financial Results MAR/2016 (FY2015) January 29 th, 2016 CONTENTS P.1 P.2 P.3 P.4~ Overview of FY MAR/16 Results Operating Revenue Operating Profit 1,030 1,020 1,010 +1.0Bn 1,022.3 1,023.4 (+0.1%) 180 160
HK GAAP RESULTS RELEASE 18 November 2005
 HK GAAP RESULTS RELEASE 18 November 2005 FOR IMMEDIATE RELEASE INTERNATIONAL STAR CRUISES GROUP ANNOUNCES THIRD QUARTER AND FIRST NINE MONTHS RESULTS FOR 2005 Key points for the quarter in comparison with
Financial Results 1 st Quarter Mar/2016 (FY2015) 30 July, 2015
 30 July, 2015") Financial Results Mar/2016 (FY2015) 30 July, 2015 Today s Topics P.2 P.3 P.15 1 Overview of FY Mar/2016 Financial Results Operating Revenue Operating Profit 320 307.0 +4.9Bn (+1.6%) 312.0 50 +17.6Bn (+94.6%)
Financial Results Mar/2016 (FY2015) 30 July, 2015 Today s Topics P.2 P.3 P.15 1 Overview of FY Mar/2016 Financial Results Operating Revenue Operating Profit 320 307.0 +4.9Bn (+1.6%) 312.0 50 +17.6Bn (+94.6%)
Management Presentation. March 2016
 Management Presentation March 2016 Forward looking statements This presentation as well as oral statements made by officers or directors of Allegiant Travel Company, its advisors and affiliates (collectively
4Q17 & FY17 Results Briefing
 4Q17 & FY17 Results Briefing 1 Disclaimer This document is provided to you for information only and should not be relied on or used as a basis for making any specific investment, business or commercial
FY 13 Results. February 26, FY 13 Results.
 February 26, 2014 www.atresmediacorporacion.com 1 FY 13 Highlights According to external sources, Total Ad market declined by -8.0% in 2013 (TV and Radio down by -6.2% and -11.0% yoy respectively) Atresmedia
HOPEWELL HOLDINGS LIMITED ANNOUNCES FY 2018/19 INTERIM RESULTS
 Press Release HOPEWELL HOLDINGS LIMITED ANNOUNCES FY 2018/19 INTERIM RESULTS Highlights 1H FY19 (1 April to 30 September 2018) First financial year after the change of financial year end date from 30 June
HATTEN LAND LIMITED. Shaping the Future, Melaka and Beyond. Corporate Presentation 12 October 2017
 HATTEN LAND LIMITED Shaping the Future, Melaka and Beyond Corporate Presentation 12 October 2017 Disclaimer Information in this presentation may contain forward-looking statements that reflect the current
Global Mega-trends Urbanisation a key driver of growth. Steve McCann Group CEO and Managing Director Lend Lease
 Global Mega-trends Urbanisation a key driver of growth Steve McCann Group CEO and Managing Director Lend Lease 2 We operate in four regions across 12 countries LONDON Operating since 1991 NEW YORK Operating
S$ million 2Q2012 2Q2011 Change 1H2012 1H2011 Change Revenue % % Gross Profit % % Gross Profit Margin
 Roxy-Pacific Holdings Limited NEWS RELEASE ROXY-PACIFIC ACHIEVES 8% INCREASE IN NET PROFIT TO S$17.7 MILLION IN 2Q2012 - Revenue rises 13% to S$52.7 million - 18% surge in revenue from Property Development
Analyst and Investor Conference Call Q Ulrik Svensson, CFO and Member of the Executive Board
 Analyst and Investor Conference Call Q2 2017 Ulrik Svensson, CFO and Member of the Executive Board Frankfurt, 2 August 2017 Disclaimer The information herein is based on publicly available information.
HK GAAP RESULTS RELEASE 25 February 2008 STAR CRUISES GROUP ANNOUNCES FOURTH QUARTER AND FULL YEAR RESULTS FOR 2007
 HK GAAP RESULTS RELEASE 25 February 2008 FOR IMMEDIATE RELEASE INTERNATIONAL STAR CRUISES GROUP ANNOUNCES FOURTH QUARTER AND FULL YEAR RESULTS FOR 2007 Key points for the quarter in comparison with 4Q
$168 MILLION PROFIT FOR FIRST HALF
 2 November 2012 Page 1 of 4 No. 05/12 02 November 2012 $168 MILLION PROFIT FOR FIRST HALF GROUP FINANCIAL PERFORMANCE First Half 2012-13 The SIA Group registered a net profit of $168 million in the first
THIRD QUARTER OPERATING PROFIT MARGINALLY UP AT $293 MILLION
 7 February 2017 Page 1 of 6 No. 01/17 7 February 2017 THIRD QUARTER OPERATING PROFIT MARGINALLY UP AT $293 MILLION Fuel cost savings more than offset lower passenger flown revenue stemming from yield erosion
Air China Limited Annual Results. March Under IFRS
 Air China Limited 21 Annual Results Under IFRS March 211 Agenda Part 1 Highlights Part 2 Business Overview Part 3 Financial Overview Part 4 Outlook 2 Part 1 Highlights Steady Economic Growth; Asia Pacific
FIRST QUARTER OPERATING PROFIT IMPROVES TO $274 MILLION
 1 August 2006 Page 1 of 4 No. 03/06 1 August 2006 FIRST QUARTER OPERATING PROFIT IMPROVES TO $274 MILLION HIGHLIGHTS OF THE GROUP S PERFORMANCE 1st Quarter 2006-07 Year-on-Year % Change Operating revenue
Analysts and Investors conference call. Q results. 15 May 2013
 Analysts and Investors conference call Q1 2013 results 15 May 2013 Management summary Key messages of Q1 2013 +6% +9% +3.3%p. Q1 2013 operational KPIs are in line with 109.7 116.2 6.5 7.1 82.3 85.6 expectations,
RECORD REVENUE AND EFFICIENCY DRIVE SOFTEN IMPACT OF HIGH FUEL COST, ENABLE HALF YEAR PROFIT OF $578 MILLION
 RECORD REVENUE AND EFFICIENCY DRIVE SOFTEN IMPACT OF HIGH FUEL COST, ENABLE HALF YEAR PROFIT OF $578 MILLION HIGHLIGHTS OF THE GROUP S PERFORMANCE First Half 2005-06 2nd Quarter 2005-06 Apr-Sep 2005 Year-on-Year
Results Briefing Year ended 30 June 2013
 Ramsay Health Care Limited Results Briefing Year ended 30 June 2013 Christopher Rex, Managing Director 29 August 2013 AGENDA 1. Group Operational and Financial Highlights 2. Segment Operational and Financial
Goodman Property Trust. 30 & 31 October 2018 NAB First Look USPP Conference, Sydney
 Goodman Property Trust 30 & 31 October 2018 NAB First Look USPP Conference, Sydney Contents Presented by: Andy Eakin Chief Financial Officer James Spence Director Investment Management GMT overview 3 Auckland
1H 13 Results. July 25th, H 13 Results.
 July 25th, 2013 www.atresmediacorporacion.com 1 1H 13 Highlights According to Infoadex, Total Ad market declined by -14% in 1H 13 (TV and Radio down by -13% and -14% yoy respectively) Atresmedia Television
% S$ million 9M2010 9M2009
 Roxy-Pacific Holdings Limited NEWS RELEASE ROXY-PACIFIC CONTINUES TO REPORT STRONG GROWTH IN 3Q2010 - Revenue surges 41 to S$53.1 million - 46 jump in pre-tax profit to S$11.0 million - 44 increase in