Results Presentation FY17
|
|
|
- Earl Francis
- 5 years ago
- Views:
Transcription

1 ASPEN GROUP LIMITED Results Presentation FY17 31 August 2017

2 Contents FY17 Highlights Financial Results Market Update Portfolio and Acquisitions Update Operating Model Outlook Appendices

3 FY17 Highlights 3
4 FY17 Highlights 1.1 Aspen continues it s acquisitions program enabled by enhanced platform STRATEGIC FINANCIAL PORTFOLIO Reset business strategy and established action plans focused on scaling of the Group Strong pipeline of potential acquisitions in varying stages of diligence > $90 million Established $80 million finance facility supporting strategic objectives Exit of 3 non-core assets ~$34 million in progress and program continues Reset corporate overheads to be in line with the revised operational scale of the business Renewed focus on operations and operational management Earnings and distribution in line with guidance - 90% payout ratio Positive operating cash flows at $5 million up 6% on FY16 Secured earnings through 1 year contract extension of Woodside at Aspen Karratha Village Zero debt on balance sheet 60% 1 core assets growth achieved through tourism park acquisitions negotiated in FY17 Secured 91 DA approvals across all sites ~7% increase in development potential DA granted at Four Lanterns for 28 new homes DA granted at Tomago Van Village for 53 new homes Expansion of Adelaide Caravan Park 10 new sites added Growth opportunities through value enhancing development (VED) and asset repositioning 1. Includes Koala Shores - Acquisition remains conditional, expected to be completed Q2 FY18 4


5 Key milestones 1.2 1H FY17 2H FY Simplification of corporate structure & reduced corporate overhead Management change Appointment of CEO Joel Cann and CFO Emmanuel Zammit Acquisition Tourist Park Tween Waters 1H FY17 distribution 2.1cps in line with guidance Acquisitions Tourist Parks Barlings Beach Koala Shores 1 Established $80 million finance facility Woodside tenancy contract at Aspen Karratha Village extended to January 2019 Spearwood South Industrial property contracted for sale settling in September 17 2H FY17 distribution 2.5 cps in line with guidance Targeting ~$70 - $90 million in acquisitions Development to commence at Tomago and Four Lanterns Exit of non-core assets ~$34 million 1. Acquisition remains conditional - expected to be completed Q2 FY18 5


6 Financial Results 6
7 Key performance metrics 2.1 Performance reflects rebasing of group at lower scale Operational Performance Distributable earnings FY17 $m FY16 $m FY17 $m Change % Statutory (loss) / profit (0.2) 9.9 (102.2%) Revenue (3.6%) Operating earnings (6.2%) MER% 3 4.2% 3.5% - Operating earnings Add: Property depreciation Less: Stay in business capex (0.4) (0.4) Distributable earnings Distribution 4.6 Payout Ratio 90% CPS Statutory Loss Current year impacted by Impairments and losses related to legacy assets and liabilities totalling $2.5 million Net impairment in the value of core assets $0.9 million Investment driven acquisition costs incurred of $1.4 million Revenue Prior year includes APPF management fees of $0.9 million Portfolio revenue adjusted for APPF management fees increased 2% due to distribution gains under the revised operating model Operating earnings $4.5 million 6.2% decrease from the prior year, entirely due to a reduction in earnings as a result of the disposal of the Aspen Parks Property Fund (APPF) during the prior year Distribution 4.6 cps in line with guidance 1. FY16 figure presented on a deconsolidated basis excluding APPF performance for comparative purposes 2. Excludes the non-controlling interest share of APPF results 3. MER based on average total assets 7
8 Reconciliation of statutory profit to operating earnings 2.2 June 17 $m June 16 1 $m Statutory (loss) / profit after tax (0.2) 9.9 Tax benefit - - Statutory (loss) / profit before tax (0.2) 9.9 Fair value gain on deconsolidation of APPF / Gain on termination of management rights in APPF / Other income - (22.5) Change in fair value of investment properties and PPE Administration / restructuring expenses (0.1) 1.3 Finance costs Other expenses (including transaction / acquisition costs) Change in fair value of assets held for sale 2.2 (0.1) Loss from equity accounted investees - (1.2) 4.7 (5.1) Operating earnings FY16 figure presented on a deconsolidated basis excluding APPF performance 2. Excludes the non-controlling interest share of APPF results 8
9 Financial position 2.3 Balance Sheet FY17 $m FY16 $m Change $m Accommodation property assets (8.6) Assets held for sale Cash (26.1) Debt Gearing % NAV (5.0) NAV $ per security (0.04) NAV per security (0.09) 1.22 Property assets Two acquisitions (Tween Waters and Barlings Beach) settled for $20.3 million. Acquisition of Koala Shores remains under conditional contract with expected settlement 2Q FY18. Cash Cash utilisation of $26.0 million in FY17 Acquisition of PPE - $22.5 million Distributions paid - $7.4 million Share buyback - $0.7 million Offset by Operating cash flows - $5.0 million NAV NAV decline of $0.04 to $1.22 per security Decline attributed to net Fair value decline of legacy assets $0.02 Acquisition and due diligence costs written off $0.01 Changes in legacy provisions $0.01 Tourism/ Residential Corporate Assets held for sale Cash Trade and other receivables Other Liabilities NAV 30 June Includes $1 million (FY16: $1.8 million) non statutory property carrying value adjustments 9


10 Market Update 10
11 Sector Focus Tourism 3.1 Domestic visitors and expenditure FY16 and FY17 comparative Domestic Tourism Growth Australia 3% Visits NSW Visits 4% Growth WA VISITORS9.5m 5% SPEND $7.3b 2% NT VISITORS1.5m 7% SPEND $1.9b 2% QLD VISITORS21.2m 4% SPEND $15.3b 6% SA Visits 1% Growth NT Visits 7% Decline International Tourism Growth Australia 9% Visitors Caravan and Camping Sector stable Year on Year SA VISITORS6.1m 1% SPEND $3.9b 8% VIC VISITORS22.5m 6% SPEND $12.7b 12% NSW VISITORS29.4m 4% SPEND $16.7b 3% TAS VISITORS2.5m 7% SPEND $2.3b 30% Source: National Visitor Survey March 2017 Overseas Arrivals and Departures (OAD) March 2017, ABS Cat. No
12 Sector Focus Tourism 3.2 Domestic visitors Forecast FY18 Domestic Tourism Growth Australia 1.5% Visitor Nights NSW Visits 0.9% Growth WA NIGHTS 43m.6% NT NIGHTS 8m 1% QLD NIGHTS 87m 3.1% SA Visits 2.7% Growth NT Visits 1% Growth International Tourism Growth Australia 8.7% Visitor Nights SA NIGHTS 22m 2.7% VIC NIGHTS 66m.7% NSW NIGHTS 99m.9% TAS NIGHTS 11m.8% Source: Tourism Forecasts 2017 Tourism Research Australia
13 Sector Focus Tourism 3.3 Aspen positioned to capitalise in this environment High international visitation to Australia will be predominantly focused on the capital cities - driving city hotel rates up. Domestic consumers will be looking outside the major cities for better value for their holiday dollar. Sluggish economic and wages growth placing household budgets under pressure. Consumers looking for a great value holiday product that fits into a tight household budget Lower rates of growth in outbound international travel by Australians is forecast due to weaker economic factors. The Australian holiday maker will increasingly be looking to domestic destinations for their next holiday. Oil prices predicted to remain stable at the current historically low rate. Self-drive holidays will remain a cost effective holiday option with fuel prices under control. Increased demand for holidays in regional Australia Increased demand for affordable holidays Increased demand for domestic holidays Lowering barriers to self-drive travel Tourism accommodation businesses with a strong affordable value proposition strongly placed to gain significant market share of the domestic traveller. Aspen in a strong position to grow by getting the value mix right. Source: National Visitor Survey March 2017 Overseas Arrivals and Departures (OAD) March 2017, ABS Cat. No
14 Sector Focus Retirement 3.4 Value of intending retirees homes significantly outweighs savings at an average of 495k offering significant opportunity to unlock capital through downsizing Total intending to retire 2016: 395, : 411,000 Intended Retirement Age 61 yrs $286k (+3.6%) $268k (+4.7%) Average Gross Wealth* Average net Worth Average Debt from 58 in Average gross wealth position of intending retirees $286,000 $276k $256k Average value of intending retirees home per person $495, $20k 2016 $18k (-10.0%) Source: Roy Morgan Single Source: 12 months to October 2014 (n=447) and October 2016 (n=432). Base: Australians 14+ intending to retire in the next 12 months. *Excluding value of owner occupied home. 14


15 Portfolio and Acquisitions Update 15

16 Property portfolio % 1 core assets growth achieved through tourism park acquisitions negotiated in FY17 30 June 2016 $m % Core Retirement / Tourism % Corporate % % Non-core Industrial % Held for Sale 6.4 7% % Total Property % 34% 7% Retirement / Tourism Corporate Industrial $86m 46% Held for Sale 13% 30 June 2017 $m % Core Retirement / Tourism % Corporate % % Non-core Industrial - - Held for Sale % % Total Property % 29% 9% $115m 62% Retirement / Tourism Corporate Industrial Held for Sale Three high quality acquisitions during FY17 Tween Waters $6.8 million Barlings Beach $13.25 million Koala Shores $10.2 million 1 Barlings Beach Strong pipeline of potential acquisitions in varying stages of diligence: > $90 million 3 Non-core assets all contracted for sale. Proceeds of ~ $34 million expected in 1H FY18 1. Includes Koala Shores acquisition which remains conditional - expected to be completed Q2 FY18 16
 3.9 13.9 6.8 24.6 Value per ha ($m) 2.38 0.81 1.51 1.")
 0.07 0.06 0.07 0.06 FY17 occupancy rates (LT) 98% 91% 100% FY17 occupancy rates (ST) N/A 56% 100% Four Lanterns Estate 1.")
 VED and DA s 5.")
17 Accommodation portfolio 4.2 Retirement Four Lanterns Estate Tomago Van Village 3 Mandurah Gardens Estate Total State NSW NSW WA - Carrying value 4 ($m) Cap rate % 7.75% 9.00% 8.75% 8.39% Land tenure Freehold Freehold Freehold - Area (ha) Value per ha ($m) Inventory Extended Short cabins Short sites Total DA approved Pre-DA Total Total potential sites Value per site ($m) FY17 occupancy rates (LT) 98% 91% 100% FY17 occupancy rates (ST) N/A 56% 100% Four Lanterns Estate 1. Cabins used for short-stay, annual or corporate accommodation 2. Sites used for caravans or designated camping 3. Assumes future conversion from mixed use to predominately retirement 4. Includes value attributed to non-income earning components (eg) VED and DA s 5. Total sites net off consolidation of pre-existing lots Tomago Van Village Mandurah Gardens Estate 17
 1.9 8.8 6.5 1.5 18.7 Value per ha ($m) 3.79 1.51 1.57 6.33 2.")
 0.08 0.05 0.07 0.10 0.07 FY17 occupancy rates (LT) N/A 100% N/A N/A FY17 occupancy rates (ST) 49% 7 24% 7 N/A 71% Adelaide Caravan Park Barlings Beach 1.")
18 Accommodation portfolio 4.3 Tourism BIG4 Tween Waters Barlings Beach 4 BIG4 Koala Shores 5 Adelaide Caravan Park Total State NSW NSW NSW SA - Carrying value 6 ($m) Cap rate % 8.75% 8.50% % 8.89% Land tenure Freehold Freehold Freehold/ Leasehold Freehold1 - Area (ha) Value per ha ($m) Inventory Extended Short cabins Short sites Total DA approved Pre-DA Total Total potential sites Value per site ($m) FY17 occupancy rates (LT) N/A 100% N/A N/A FY17 occupancy rates (ST) 49% 7 24% 7 N/A 71% Adelaide Caravan Park Barlings Beach 1. In-place zoning for medium density residential 2. Cabins used for short-stay, annual or corporate accommodation 3. Sites used for caravans or designated camping 4. Includes group lodge accommodating ~12 guests 5. Acquisition remains conditional - expected to be completed Q2 FY18 6. Includes value attributed to non-income earning components (eg) VED and DA s 7. Annualised average occupancy due to timing of acquisition BIG4 Tween Waters BIG4 Koala Shores 18
 0.")
19 Accommodation portfolio 4.4 Corporate Aspen Karratha Village Total State WA - Carrying value 2 ($m) Cap rate % 17.75% 17.75% Land tenure Freehold - Area (ha) Value per ha ($m) Inventory Extended - - Short cabins Short sites Total DA approved - - Pre-DA - - Total - - Total potential sites Aspen Karratha Village Value per site ($m) FY17 occupancy rates (LT) N/A 1. Cabins used for short-stay, annual or corporate accommodation 2. Includes value attributed to non-income earning components (eg) VED and DA s FY17 occupancy rates (ST) 89% 19
, will provide for a")
20 Development and pipeline 4.5 Tomago Van Village Development Tomago Development approval granted for 53 new homes, which will allow for progressive development and after consolidations (generally short stay), will provide for a net increase of circa 34 homes by the end of 2020 and shift park revenue composition to predominately permanent residents. Project to launch in FY18 Construction expected to commence Q2FY18 with first settlements in Q4FY18. Yield, staging and timeframes Stage 1 construction Stage 2 construction Existing buildings Developed over four stages Progressive consolidation of ~40 park owned sites provides for development of 74 new dwellings resulting in net increase of 34 homes Anticipated sell out Q2FY20 Proposed development site plan 20

21 Development and pipeline 4.6 Four Lanterns expansion Development Secured development approval for 28 new homes Strong community interest and demand for affordable product in metropolitan Sydney Site recycling has enhanced the overall presentation of the park to deliver improved yields Construction expected to commence in Q3FY18 subject to external infrastructure provider and first homes to arrive on site Q4FY18 Yield, staging and timeframes Twenty eight new homes to be developed in four stages Anticipated sell out Q1FY19 Major works comprise decommissioning of private sewer plant and connection to municipal services Proposed development site plan 21
 Settlement expected to occur 29 September 2017 Midland Conditional contract $2.")
22 Non core assets 4.7 Aspen s continues to divest its legacy assets Spearwood South Industrial Estate Contracted for sale at $28.0m (3.4% discount to 1H FY17 book value) Settlement expected to occur 29 September 2017 Midland Conditional contract $2.5 million Anticipated settlement in 1H FY18 Aspen Whitsunday Shores Pty Ltd (AWSS) Settled remaining development syndicate land asset for $3.5 million on15 August 2017 Syndicate to proceed with wind-up Disposal of AWSS and Midlands attribute immediate uplift in sustainable earnings. Midland and AWSS contributed losses of ~$0.3 million to FY 17 earnings. 22


23 Operating Model 23
24 Operating model 5.1 Operating model aims to produce high yielding returns in affordable accommodation augmented by development returns through the upgrade of sites and expansion of parks Aspen continues to identify and pursue opportunities in our three existing sectors Tourism, Retirement and Corporate acquisitions Our operating model enables expansion into adjacent sectors leveraging our capability in Operations, Development and Marketing / Distribution Additional efficiency opportunities exist through the establishment and operation of geographic clusters RETIREMENT CORPORATE TOURISM Sectors Stay duration Operating capability 24
25 Operating model 5.2 Create, own and operate communities at affordable prices BUY 3 core sectors Tourism, Retirement and Corporate Off or near market Specialist acquisition skills Execution capabilities ENHANCE Business plan Opportunity driven (e.g.) intensification Combined in-house operational expertise Financially disciplined OPERATE Distribution and revenue management strategy Operational focus, managing financial performance EPS / DPS 25

26 Outlook 26


27 Outlook 6.1 Portfolio expansion targeting ~$90 million in acquisitions Commence development at Tomago and Four Lanterns Complete exit of non-core assets yielding ~$34 million Earnings growth expected in line with portfolio expansion BIG4 Tween Waters Barlings Beach 6.1 BIG 4 Koala Shores 27
28 Appendices 28
29 Aspen Portfolio NSW Property Type Number of sites 1 Four Lanterns Retirement Tomago Retirement Koala Shores 1 Tourism Barlings Beach Tourism Tween Waters Tourism 96 Total 756 WA Property Type Number of sites SA Property Type Number of sites Mandurah Retirement Adelaide Tourism 93 8 Karratha Village Corporate 180 Total 93 Total Acquisition remains conditional - expected to be completed Q2 FY18 29

")


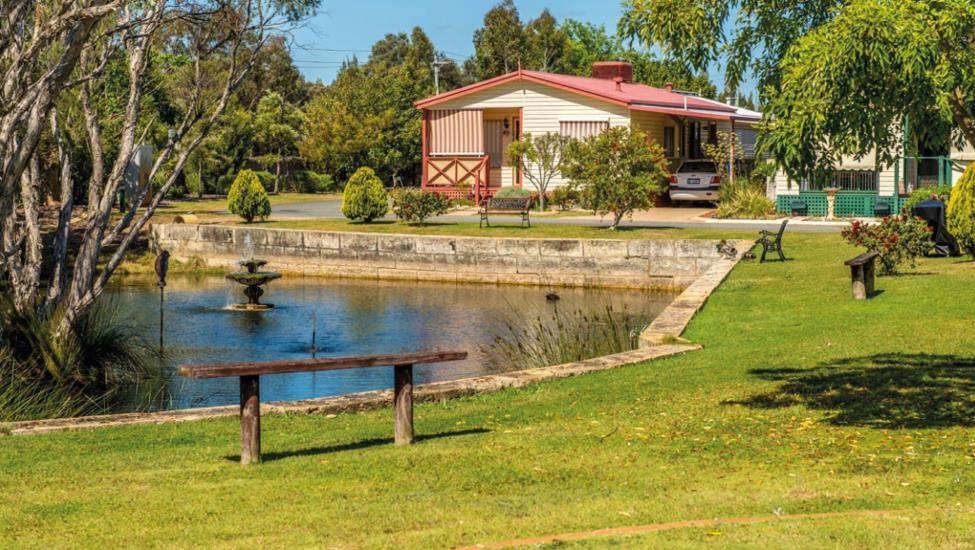
30 Acquisition: BIG4 Tween Waters Holiday Park 7.2 South Coast, NSW (7.5hrs South of Sydney) December 16 Location Far South Coast, adjacent Merimbula town centre (170kms south of Batemans Bay) Type Beachfront, full tourist park with recently renovated cabins and water play park RETIREMENT CORPORATE Scale 96 sites including 31 cabins TOURISM Opportunity Earnings growth via leveraging of distribution capability and establishment of South Coast cluster Sectors Stay duration Operating capability Acquisition price Ingoing yield (excl. acq. costs) Extended sites Short sites Total area Tenure $6.8m 9.4% ha Freehold 30
 January 2016 Location Absolute beachfront adjacent to")


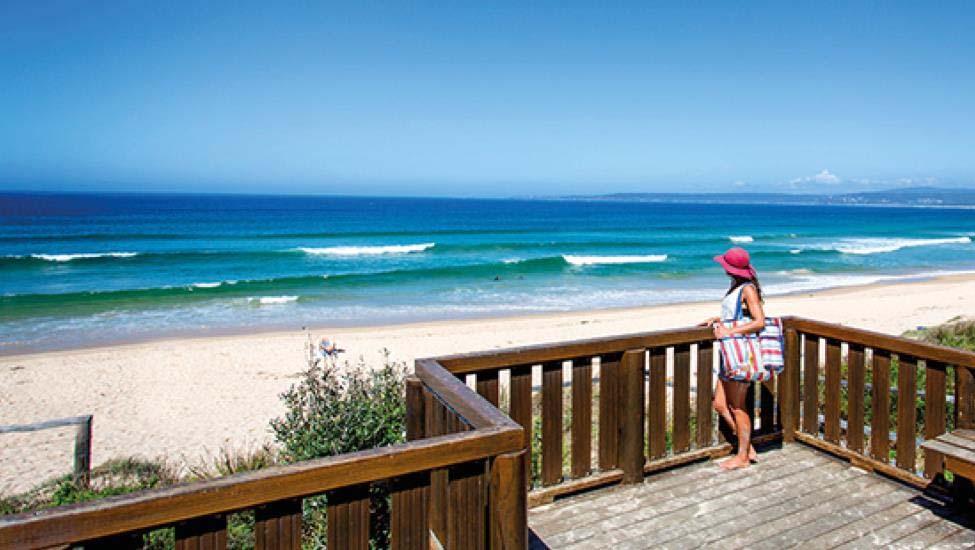
31 Acquisition: Barlings Beach Holiday Park 7.3 South Coast, NSW (6hrs South of Sydney) January 2016 Location Absolute beachfront adjacent to Tomakin Village 17km s south of Batemans Bay Type Beachfront, predominantly tourism park with Canberra, Sydney and local region client base RETIREMENT CORPORATE Scale 258 sites including 23 permanents, 171 annuals, 35 cabins and 29 sites Opportunity Highly stable earnings due to predominant share of annual and permanent sites, earnings improvement opportunity through leveraging of distribution capability. Potential for additional cabins on beachfront location sites. Presentation enhancement through continued replacement of aging caravans with new cabins on annual sites. 1. Includes $1.25m delayed settlement (12 months) Acquisition price Ingoing yield (excl. acq. costs) Extended sites Short sites TOURISM Total area Sectors Stay duration Operating capability Tenure $13.3m 1 9.1% ha Freehold 31
 November 2016 Location 45km from")


 Extended sites Short sites Total area Tenure $10.2m 9.5% - 143 6.")
32 Acquisition: BIG4 Koala Shores Holiday Park Central Coast, NSW (2hrs North of Sydney) November 2016 Location 45km from Newcastle, 25km from Tomago Van Village establishes NSW North Coach cluster. 15 minutes from Newcastle airport Type Full tourist park, water frontage, newly renovated cabins and excellent park presentation Scale 143 sites including 34 cabins RETIREMENT TOURISM CORPORATE Opportunity Earnings growth potential via leveraging of distribution capability and clustering with Tomago Van Village Sectors Stay duration Operating capability Acquisition price Ingoing yield (excl. acq. costs) Extended sites Short sites Total area Tenure $10.2m 9.5% ha Freehold/Leasehold 1. Acquisition remains conditional - expected to be completed Q1 FY18 32
33 Operating earnings 7.6 Profit / (loss) from operations Accommodation - Aspen Group properties APPF properties APPF management fees / equity Non-core Total gross profit Operating expenses and depreciation (6.5) (12.6) Net Financial income / (expenses) 0.6 (1.6) Operating profit before tax Income tax expense - - Operating profit after tax NCI (APPF only) - (1.2) APZ share of operating profit after tax add backs Distributable earnings APZ distributions FY17 $m FY16 1 $m 1. FY16 figure presented on a deconsolidated basis excluding APPF performance 2. Relates to depreciation less stay in business capex 33
34 Balance sheet 7.7 Cash Property Assets Assets held for sale / other assets Total Assets Debt - - Other Total Liabilities Net Assets Net Assets attributed to Aspen Group NAV per share Gearing % - - Jun 17 $m Jun 16 $m 1. Includes $1 million (FY16: $1.8 million) in unrecognised non statutory adjustments 34


35 Disclaimer This presentation has been prepared by Aspen Group ( Aspen ) and should not be considered in any way to be an offer, invitation, solicitation or recommendation with respect to the subscription for, purchase or sale of any security, and neither this document nor anything in it shall form the basis of any contract or commitment. Prospective investors should make their own independent evaluation of an investment in Aspen. Nothing in this presentation constitutes investment, legal, tax or other advice. The information in this presentation does not take into account your investment objectives, financial situation or particular needs. The information does not purport to constitute all of the information that a potential investor may require in making an investment decision. Aspen has prepared this presentation based on information available to it. No representation or warranty, express or implied, is made as to the fairness, accuracy, completeness or correctness of the information, opinions and conclusions contained in this presentation. To the maximum extent permitted by law, none of Aspen, its directors, employees or agents, nor any other person accepts any liability, including, without limitation, any liability arising from fault or negligence on the part of any of them or any other person, for any loss arising from the use of this presentation or its contents or otherwise arising in connection with it. This presentation contains forward looking information. Indications of, and guidance on, future earnings, distributions and financial position and performance are forward looking statements. Forward looking statements are based on Aspen Group s current intentions, plans, expectations, assumptions, and beliefs about future events and are subject to risks, uncertainties and other factors which could cause actual results to differ materially. Aspen Group and its related bodies corporate and their respective directors, officers, employees, agents, and advisers do not give any assurance or guarantee that the occurrence of any forward-looking information, view or intention referred to in this presentation will actually occur as contemplated. All references to dollar amounts are in Australian currency unless otherwise stated.
Results Presentation 1H FY18
 ASPEN GROUP LIMITED Results Presentation 1H FY18 23 February 2018 Contents 1 2 3 4 5 1H FY18 Highlights Financial Results Portfolio and Acquisitions Update Outlook Appendices 1 1H FY18 Highlights 3 1H
Investor Briefings First-Half FY2016 Financial Results
 Cedar Woods Properties Limited Investor Briefings First-Half FY2016 Financial Results 26 February 2016 Cedar Woods Presentation 2 Snapshot of Achievements in FY2016 Extensive portfolio of residential estates
23 February The Manager Market Announcements Australian Securities Exchange Limited 20 Bridge Street SYDNEY NSW 2000.
 Level 1 157 Grenfell Street Adelaide SA 5000 GPO Box 2155 Adelaide SA 5001 Adelaide Brighton Ltd ACN 007 596 018 Telephone (08) 8223 8000 International +618 8223 8000 Facsimile (08) 8215 0030 www.adbri.com.au
Q3 FY18 Business Highlights
 Q3 FY18 RESULTS Q3 FY18 Business Highlights 1 2 3 4 5 6 7 Record passengers 7.1m, record revenues 423m Investing in growth 24% passenger growth in Q3 Disciplined cost management flat ex-fuel CASK Largest
Virgin Australia Holdings Limited (ASX: VAH) H1 FY18 Results 1
 H1 FY18 Results 1") Virgin Australia Holdings Limited (ASX: VAH) H1 FY18 Results 1 Summary of H1 FY18 Group Outcomes 2 Group Underlying Profit Before Tax of $102.5 million up 142.3% Group Statutory Profit After Tax of $4.4
Virgin Australia Holdings Limited (ASX: VAH) H1 FY18 Results 1 Summary of H1 FY18 Group Outcomes 2 Group Underlying Profit Before Tax of $102.5 million up 142.3% Group Statutory Profit After Tax of $4.4
Citigroup Investor Conference October 2010
 Citigroup Investor Conference October 2010 Disclaimer Important information This presentation ti has been prepared in good faith, but no representation ti or warranty, express or implied, is made as to
Analyst and Investor Conference Call Q Ulrik Svensson, CFO and Member of the Executive Board
 Analyst and Investor Conference Call Q2 2017 Ulrik Svensson, CFO and Member of the Executive Board Frankfurt, 2 August 2017 Disclaimer The information herein is based on publicly available information.
Qantas Airways Limited
 Qantas Airways Limited Macquarie Australia Conference 8 May 2014 Qantas Guiding Strategic Principles Safety is always our first priority The first choice for customers in every market we serve Maintaining
Interim Report 6m 2014
 August 11, 2014 Interim Report 6m 2014 Investors and Analysts Conference Call on August 11, 2014 Joachim Müller, CFO Latest ad-hoc release (August 4, 2014) Reduction of forecast, primarily due to a further
P esent n atio i n o n f or o H alf l Y e Y ar E n E d n e d d d 31 D ecemb m e b r 2 008
 Queensland WA & QLD Report Summary Strong revenue growth of 61.8% to $234.5m Strong cash flow from operations of $20.9m Net debt to equity 23.2% Underlying net profit of $8.2m (before goodwill impairment
Half Year F1 Results. November 4, 2015
 Half Year F1 Results November 4, 2015 F17 Q1 Results 20 JULY 2016 Q1 BUSINESS HIGHLIGHTS Passenger growth of 18% to 5.8m pax on 17% seat growth Record underlying profit of 38.6m (+14%) despite Easter effect
Euroz Rottnest Investor Briefing
 Cedar Woods Properties Limited Euroz Rottnest Investor Briefing 15 March 2016 Cedar Woods Presentation 2 Snapshot of Achievements in FY2016 Extensive portfolio of residential estates in Perth and WA regions,
Wizz Air aims to increase market share with F17 capacity growth of 20% Q3 passenger growth of 20%, Load Factor of 88% (+2.3ppt)
") Q3 F17 FINANCIAL RESULTS 1 FEBRUARY 2017 BUSINESS HIGHLIGHTS Current market conditions favour ULCCs Wizz Air aims to increase market share with F17 capacity growth of 20% Q3 passenger growth of 20%, Load
Q3 F17 FINANCIAL RESULTS 1 FEBRUARY 2017 BUSINESS HIGHLIGHTS Current market conditions favour ULCCs Wizz Air aims to increase market share with F17 capacity growth of 20% Q3 passenger growth of 20%, Load
FY2016 Financial Results
 Cedar Woods Properties Limited FY2016 Financial Results 25 August 2016 Cedar Woods Presentation 2 Agenda 1 Company Overview 2 FY16 Financial Highlights 3 Operational Overview 4 Market Conditions 5 Company
Centurion Corporation Limited
 Centurion Corporation Limited Corporate Presentation 6 January 2014 Disclaimer This presentation and the accompanying presentation materials (if any) ("Presentation") are made for informational purposes,
INVESTOR PRESENTATION. Imperial Capital Global Opportunities Conference September 2015
 INVESTOR PRESENTATION Imperial Capital Global Opportunities Conference September 2015 Forward-looking Statements This presentation contains forward-looking statements within the meaning of the Private
Lend Lease Investment Management Australia
 Lend Lease Investment Management Australia Tarun Gupta CEO Australia Lend Lease Investment Management Appropriate photo Market Update May 2007 Australian Business Overview: Funds Under Management (FUM)
Ramsay Health Care Limited Results Briefing Half Year ended 31 December 2018
 Ramsay Health Care Limited Results Briefing Half Year ended 31 December 2018 Craig McNally, Group Managing Director & Bruce Soden, Group Finance Director 28 February 2019 ramsayhealth.com Agenda Group
INVESTOR PRESENTATION. 3 Oct 2018
 INVESTOR PRESENTATION 3 Oct 2018 DISCLAIMER This presentation should be read in conjunction with the unaudited second quarter financial statements of Far East Orchard Limited ( FEOrchard ) for the period
Thank you for participating in the financial results for fiscal 2014.
 Thank you for participating in the financial results for fiscal 2014. ANA HOLDINGS strongly believes that safety is the most important principle of our air transportation business. The expansion of slots
FY2017 Financial Results
 Cedar Woods Properties Limited FY2017 Financial Results 22 August 2017 Cedar Woods strategy Cedar Woods Presentation 2 To grow and develop our national project portfolio, diversified by: geography product
INVESTOR PRESENTATION. May 2015
 INVESTOR PRESENTATION May 2015 Forward-looking Statements This presentation contains forward-looking statements within the meaning of the Private Securities Litigation Reform Act of 1995 that reflect the
QANTAS HALF YEAR 2015 FINANCIAL RESULTS 1
 QANTAS HALF YEAR 2015 FINANCIAL RESULTS 1 Key points: Underlying Profit Before Tax: $367 million Statutory Profit After Tax: $206 million Transformation benefits: $374 million Comparable unit cost reduction:
QUARTERLY UPDATE 31 MARCH 2017
 AUSTRALIAN PROPERTY OPPORTUNITIES FUND QUARTERLY UPDATE 31 MARCH 2017 The Australian Property Opportunities Fund (APOF I or the Fund) is pleased to provide this update for the March quarter 2017 (Q1 2017)
Qantas Group - Positioned for Growth and Sustainable Returns
 Qantas Group - Positioned for Growth and Sustainable Returns Tino La Spina, Qantas Group Chief Financial Officer Macquarie Australia Conference 3 May 2018 Third Quarter 1 FY18 Trading Update Q3 trading
Tat Hong Reports 13% Decline in FY2017 Revenue
 FOR IMMEDIATE RELEASE Registration No: 199105392H Tat Hong Reports 13 Decline in FY2017 Revenue - Cash and cash equivalents of S$114.3 million - Cash flow from operations of S$85.2 million - Net gearing
Preliminary Figures FY 2016
 February 14, 2017 Preliminary Figures FY 2016 Capital Markets Day 2017 Tom Blades (CEO) Disclaimer This presentation has been produced for support of oral information purposes only and contains forwardlooking
AIR CANADA REPORTS 2010 THIRD QUARTER RESULTS; Operating Income improved $259 million or 381 per cent from previous year s quarter
 AIR CANADA REPORTS 2010 THIRD QUARTER RESULTS; Operating Income improved $259 million or 381 per cent from previous year s quarter MONTRÉAL, November 4, 2010 Air Canada today reported operating income
Interim Report 3m Bilfinger Berger SE, Mannheim May 10, 2012 Joachim Müller, CFO
 Interim Report 3m 2012 Bilfinger Berger SE, Mannheim May 10, 2012 Joachim Müller, CFO Bilfinger Berger SE Interim report 3m 2012 May 10, 2012 Page 1 3m 2012: Highlights Growth in output volume and orders
Fourth Quarter 2015 Financial Results
 Fourth Quarter 2015 Financial Results AerCap Holdings N.V. February 23, 2016 Disclaimer Incl. Forward Looking Statements & Safe Harbor This presentation contains certain statements, estimates and forecasts
Overview. > Normalised earnings* before taxation of, up 30% > Statutory earnings before taxation of, up 40% > Statutory net profit after taxation of
 1 Overview > Normalised earnings* before taxation of, up 30% > Statutory earnings before taxation of, up 40% > Statutory net profit after taxation of > Operating revenue of > Strong operating cash flow
A Conversation With Folkestone. November 2017
 A Conversation With Folkestone November 2017 1 POPULATION GROWTH BY STATE Australian Population Growth by State: March 2017 Population (m) Growth in Year ( 000) % Change in Year VIC 6.3 149.4 2.4 ACT 0.4
GATWICK AIRPORT LIMITED
 GATWICK AIRPORT LIMITED Investor briefing CAA Q6 Final Proposals 7 October 2013 AGENDA Introduction Airport Commitments o Price o Service o Other terms CAA licence & monitoring, underpinning the Airport
Charter Hall Long WALE REIT
 Electrolux, Beverley, South Australia Virgin Australia Head Office, Bowen Hills, Queensland Bunnings, South Mackay, Queensland 15 February 2018 Charter Hall Long WALE REIT FY18 Half Year Results Agenda
JAL Group Announces its FY Medium-Term Business Plan
 JAL Group Announces its FY2006-2010 Medium-Term Business Plan -Mobilize the Group s Strengths to Regain Trust - Tokyo, Thursday March 2, 2006: The JAL Group today announced its medium-term business plan
Highlights from the Annual Results December 2007
 Highlights from the Annual Results December 2007 Disclaimer The information in this document is taken from the BAA 2007 Annual Results ( the Results ) which were published on 11 March 2008 and other public
SKYCITY ENTERTAINMENT GROUP LIMITED (SKC) INVESTOR PRESENTATION FOR UBS INVESTOR CONFERENCE
 INVESTOR PRESENTATION FOR UBS INVESTOR CONFERENCE") 13 November 2017 Client Market Services NZX Limited Level 1, NZX Centre 11 Cable Street WELLINGTON Copy to: ASX Market Announcements Australian Stock Exchange Exchange Centre Level 6 20 Bridge Street Sydney
13 November 2017 Client Market Services NZX Limited Level 1, NZX Centre 11 Cable Street WELLINGTON Copy to: ASX Market Announcements Australian Stock Exchange Exchange Centre Level 6 20 Bridge Street Sydney
For personal use only
 Cedar Woods Properties Limited Queensland Projects Tour Cedar Woods Presentation 2 Cedar Woods Charter Cedar Woods Purpose to create long term value for our shareholders through the disciplined acquisition,
RESULTS RELEASE 20 August GENTING HONG KONG GROUP ANNOUNCES FIRST HALF RESULTS FOR 2015 Highlights
 RESULTS RELEASE 20 August 2015 FOR IMMEDIATE RELEASE INTERNATIONAL GENTING HONG KONG GROUP ANNOUNCES FIRST HALF RESULTS FOR 2015 Highlights The commentary below is prepared based on a comparison of the
For personal use only
 HELLOWORLD ANNOUNCES RESULTS FOR THE YEAR ENDED 30 JUNE 2014 HIGHLIGHTS Total Transaction Value (TTV) of $4.9 billion Adjusted EBITDAI (1) of $40.6 million Loss before tax of $61.2 million includes the
RESEARCH NOTE. Qantas Group Ltd Neutral
 1 RESEARCH NOTE Qantas Group Ltd Neutral Price: A$5.80 Price Target: A$6.17 ASX: QAN 18 September 2017 Myer Holdings (MYR) reported disappointing FY17 results and guided to a weak start to the FY18 year,
1HFY2012 RESULTS PRESENTATION
 1HFY2012 RESULTS PRESENTATION 21st February 2012 AWARD WINNING PROPERTY DEVELOPER Listed 1994, consistently profitable, always paid dividends Strategically located and diverse residential portfolio Urban
OPERATING AND FINANCIAL HIGHLIGHTS. Subsequent Events
 Copa Holdings Reports Net Income of $103.8 million and EPS of $2.45 for the Third Quarter of 2017 Excluding special items, adjusted net income came in at $100.8 million, or EPS of $2.38 per share Panama
Performance Update Macquarie Conference
 Performance Update Macquarie Conference Martin Earp, CEO 2 May 2018 Contents Re-cap on Industry Trends Re-cap on IVC s Strategic Response Update on Protect & Grow Update on Q1 Performance Update on 2018
FULL YEAR RESULTS A RECORD YEAR OF GROWTH
 2012 FULL YEAR RESULTS A RECORD YEAR OF GROWTH A RECORD YEAR OF GROWTH FINANCIAL HIGHLIGHTS Sales revenue up 41% to $555.6m EBITDA up 57% to $55.7m Net profit up 66% to $39.1m Earnings per share up 40%
For personal use only
 HELLOWORLD TRAVEL LIMITED RESULTS ANNOUNCEMENT Highlights for the year ended 30 June 2018 Total Transaction Value (TTV) growth of 3.5% to $6.1 billion, underpinned by strong air ticket sales volume growth.
Managing through disruption
 28 July 2016 Third quarter results for the three months ended 30 June 2016 Managing through disruption 3 months ended Like-for-like (ii) m (unless otherwise stated) Change 30 June 2016 30 June 2015 change
Dalata Hotel Group Strategy Update. Dermot Crowley, Deputy CEO, Business Dev & Finance
 Dalata Hotel Group Strategy Update Dermot Crowley, Deputy CEO, Business Dev & Finance The Value Proposition in March 2014 POSITIVE OUTLOOK FOR DEMAND Positive outlook for increased number of international
DEXUS Property Group (ASX: DXS) ASX release
 ASX release") 11 February 2016 DEXUS and DWPF acquire North Sydney site for premium office development DEXUS Property Group (DEXUS) and DEXUS Wholesale Property Fund (DWPF) today announced that they have jointly entered
11 February 2016 DEXUS and DWPF acquire North Sydney site for premium office development DEXUS Property Group (DEXUS) and DEXUS Wholesale Property Fund (DWPF) today announced that they have jointly entered
Goodman Property Trust. 30 & 31 October 2018 NAB First Look USPP Conference, Sydney
 Goodman Property Trust 30 & 31 October 2018 NAB First Look USPP Conference, Sydney Contents Presented by: Andy Eakin Chief Financial Officer James Spence Director Investment Management GMT overview 3 Auckland
Financial Results 1 st Quarter Mar/2016 (FY2015) 30 July, 2015
 30 July, 2015") Financial Results Mar/2016 (FY2015) 30 July, 2015 Today s Topics P.2 P.3 P.15 1 Overview of FY Mar/2016 Financial Results Operating Revenue Operating Profit 320 307.0 +4.9Bn (+1.6%) 312.0 50 +17.6Bn (+94.6%)
Financial Results Mar/2016 (FY2015) 30 July, 2015 Today s Topics P.2 P.3 P.15 1 Overview of FY Mar/2016 Financial Results Operating Revenue Operating Profit 320 307.0 +4.9Bn (+1.6%) 312.0 50 +17.6Bn (+94.6%)
Cebu Air, Inc. 2Q2014 Results of Operation
 Cebu Air, Inc. 2Q2014 Results of Operation 1 Disclaimer This information provided in this presentation is provided only for your reference. Such information has not been independently verified and, as
2017 results: REVENUE up to million (+1.6%), NET PROFIT FOR THE PERIOD 1 shows significant increase to million (+12.
, NET PROFIT FOR THE PERIOD 1 shows significant increase to million (+12.") Business Results in 2017: Significant Rise in Profits of the Flughafen Wien Group Management Board Announces Substantial Upward Revision of Earnings Guidance and Traffic Figures for 2018 2017 results:
Business Results in 2017: Significant Rise in Profits of the Flughafen Wien Group Management Board Announces Substantial Upward Revision of Earnings Guidance and Traffic Figures for 2018 2017 results:
Copa Holdings Reports Net Income of $49.9 million and EPS of $1.18 for the Second Quarter of 2018
 Copa Holdings Reports Net Income of $49.9 million and EPS of $1.18 for the Second Quarter of 2018 Panama City, Panama --- Aug 8, 2018. Copa Holdings, S.A. (NYSE: CPA), today announced financial results
Volaris Reports Strong First Quarter 2015: 32% Adjusted EBITDAR Margin, 9% Operating Margin
 Volaris Reports Strong First Quarter 2015: 32% Adjusted EBITDAR Margin, 9% Operating Margin Mexico City, Mexico, April 22, 2015 Volaris* (NYSE: VLRS and BMV: VOLAR), the ultra-low-cost airline serving
Ramsay Health Care Limited Results Briefing Year ended 30 June 2018
 Ramsay Health Care Limited Results Briefing Year ended 30 June 2018 Craig McNally, Managing Director & Bruce Soden, Group Finance Director 30 August 2018 ramsayhealth.com Agenda Group Performance Overview
E190 REPLACEMENT & FLEET UPDATE JULY 11, 2018
 1 E190 REPLACEMENT & FLEET UPDATE JULY 11, 2018 SAFE HARBOR This presentation contains forward-looking statements within the meaning of the Private Securities Litigation Reform Act of 1995, Section 27A
Net Debt, $m 1, ,733.7
 Virgin Australia Holdings Limited (ASX: VAH) FY17 Results: Stronger Cash and Balance Sheet, Statutory and Underlying Loss, Outlook Improving 1 Summary of FY17 Financial Outcomes Group Underlying Loss Before
JAPAN AIRLINES Co., Ltd. Financial Results 1 st Quarter Mar/2017(FY2016) July 29, 2016
 July 29, 2016") JAPAN AIRLINES Co., Ltd. Financial Results Mar/2017(FY2016) July 29, 2016 Today s Topics P.1 P.2 P.13 From the first quarter of this fiscal year, figures for Revenue Passengers Carried, ASK, RPK and Load
JAPAN AIRLINES Co., Ltd. Financial Results Mar/2017(FY2016) July 29, 2016 Today s Topics P.1 P.2 P.13 From the first quarter of this fiscal year, figures for Revenue Passengers Carried, ASK, RPK and Load
Group First Half Account Settlement For FY2007
 JAL GroupFirst Half Account Settlement For FY2007 Nov 7 th 2007 Japan Airlines JAL 2007 1 Disclaimer Unless specifically dealing with matters of historical fact, the plans, forecasts and strategies described
Quarterly Interim Management Statement. Three Months to June 30, 2015
 Quarterly Interim Management Statement Three Months to June 30, 2015 BUSINESS HIGHLIGHTS FOR Q1 Record Q1 profitability despite negative Easter effect Lower unit costs further increasing our cost advantage
The Qantas Group A Strong, Sustainable Future Alan Joyce, CEO Qantas Airways. Macquarie Australia Conference 4 May 2012
 The Qantas Group A Strong, Sustainable Future Alan Joyce, CEO Qantas Airways Macquarie Australia Conference 4 May 2012 Overview Fleet renewal now substantially complete FY13 capital expenditure reduced
USA Acquisition Summary. December 2010
 USA Acquisition Summary December 2010 www.roadbearrv.com Strategic Intent 1. To leverage the existing business capabilities in a significant sized and growing tourism market with a similar customer base.
Parques Reunidos Expands to Australia with the Acquisition of Wet n Wild Sydney July 2018
 Parques Reunidos Expands to Australia with the Acquisition of Wet n Wild Sydney July 2018 Disclaimer This document does not constitute or form part of any purchase, sales or exchange offer, nor is it an
HK GAAP RESULTS RELEASE 12 August 2008 STAR CRUISES GROUP ANNOUNCES FIRST HALF RESULTS FOR 2008
 HK GAAP RESULTS RELEASE 12 August 2008 FOR IMMEDIATE RELEASE INTERNATIONAL STAR CRUISES GROUP ANNOUNCES FIRST HALF RESULTS FOR 2008 The below commentary is prepared based on the comparison of the results
The Manager Company Announcements Australian Stock Exchange Limited Sydney NSW Dear Sir. Demerger of BHP Steel
 The Manager Company Announcements Australian Stock Exchange Limited Sydney NSW 2000 Dear Sir Demerger of BHP Steel At the time of the announcement of the creation of the DLC between BHP Limited and Billiton
OPERATING AND FINANCIAL HIGHLIGHTS. Subsequent Events
 Copa Holdings Reports Net Income of US$113.1 Million and EPS of US$2.57 for the First Quarter of 2015 Excluding special items, adjusted net income came in at US$106.0 million, or EPS of US$2.41 per share
Results Briefing Year ended 30 June 2013
 Ramsay Health Care Limited Results Briefing Year ended 30 June 2013 Christopher Rex, Managing Director 29 August 2013 AGENDA 1. Group Operational and Financial Highlights 2. Segment Operational and Financial
2009 Annual General Meeting
 2009 Annual General Meeting Managing Director s Address October 2009 Steve Gostlow Agenda Contents 1 Capital Structure 2 Company Profile 3 FY09 Key Highlights 4 FY10 Operational Update 5 Gorgon Update
Investor Relations Update January 25, 2018
 General Overview Investor Relations Update Accounting Changes On January 1, 2018, the company adopted two new Accounting Standard Updates: (ASUs): ASU 2014-9: Revenue from Contracts with Customers (the
PCT delivers strong profit result and launches One Queen Street
 NZX announcement 16 August 2018 PCT delivers strong profit result and launches One Queen Street Performance summary for the 12 months ended 30 June 2018 Delivering strong results Net profit after tax increased
Investor Update September 2017 PARTNER OF CHOICE EMPLOYER OF CHOICE INVESTMENT OF CHOICE
 Investor Update September 2017 PARTNER OF CHOICE EMPLOYER OF CHOICE INVESTMENT OF CHOICE 1 Forward Looking Statements In addition to historical information, this presentation contains forward-looking statements
BAA (SP) Limited Results for six months ended 30 June July 2011
 Limited Results for six months ended 30 June July 2011") BAA (SP) Limited Results for six months ended 30 June 2011 July 2011 Record Q2 Heathrow traffic Good overall service standards Strong financial results Successful dollar and sterling financings H1 2011
BAA (SP) Limited Results for six months ended 30 June 2011 July 2011 Record Q2 Heathrow traffic Good overall service standards Strong financial results Successful dollar and sterling financings H1 2011
State of the States October 2017 State & territory economic performance report. Executive Summary
 State of the States October 2017 State & territory economic performance report. Executive Summary NSW ON TOP; VICTORIA CLOSES IN How are Australia s states and territories performing? Each quarter CommSec
Finnair Q Result
 17 August 2016 CEO Pekka Vauramo CFO Pekka Vähähyyppä Finnair Q2 2016 Result 1 Highlights of the second quarter The seventh consecutive quarter of profit improvement Fukuoka & Guangzhou route openings
OPERATING AND FINANCIAL HIGHLIGHTS
 Copa Holdings Reports Financial Results for the Fourth Quarter of 2015 Excluding special items, adjusted net income came in at $31.7 million, or EPS of $0.73 per share Panama City, Panama --- February
Finnair Group Interim Report 1 January 30 September 2008
 Finnair Group Interim Report 1 January 30 September 2008 1 31/10/2008 Presentation name / Author Airline industry at a historical turning point Expensive fuel price in the beginning of 2008 has dramatical
Montie Brewer, President and CEO Joshua Koshy, Executive VP and CFO UBS Transport Conference
 Montie Brewer, President and CEO Joshua Koshy, Executive VP and CFO UBS Transport Conference 1 London, England September 17, 2007 Agenda Strongly positioned international airline Investment proposition
OPERATING AND FINANCIAL HIGHLIGHTS
 Copa Holdings Reports Financial Results for the Fourth Quarter of 2018 Excluding special items, adjusted net profit came in at $44.0 million, or Adjusted EPS of $1.04 Panama City, Panama --- February 13,
M2 Group Ltd 2014 Interim Results
 M2 Group Ltd 2014 Interim Results 24 February 2014 Geoff Horth, CEO Presentation Content Record Financial Performance Strong Organic Growth FY14 Priorities and Guidance Slide 2, 24 February 2014 Record
IAG results presentation. Quarter One th May 2018
 IAG results presentation Quarter One 2018 4 th May 2018 Highlights Willie Walsh, Chief Executive Officer Highlights Another strong quarter performance with an operating profit of 280m (5.6% margin, +2.3pts)
OPERATING AND FINANCIAL HIGHLIGHTS
 Copa Holdings Reports Net Income of US$32.0 Million and EPS of US$0.72 for the Second Quarter of 2012 Excluding special items, adjusted net income came in at $58.6 million, or EPS of $1.32 per share Panama
OTOC Limited (ASX:OTC) Investor Update Annual General Meeting 2012
 Investor Update Annual General Meeting 2012") OTOC Limited (ASX:OTC) Investor Update Annual General Meeting 2012 Disclaimer This Document should not be considered as an offer or invitation to subscribe for or purchase any securities in OTOC Limited
OTOC Limited (ASX:OTC) Investor Update Annual General Meeting 2012 Disclaimer This Document should not be considered as an offer or invitation to subscribe for or purchase any securities in OTOC Limited
Copa Holdings Reports Net Income of $57.7 million and EPS of $1.36 for the Third Quarter of 2018
 Copa Holdings Reports Net Income of $57.7 million and EPS of $1.36 for the Third Quarter of 2018 November 14, 2018 PANAMA CITY, Nov. 14, 2018 /PRNewswire/ -- Copa Holdings, S.A. (NYSE: CPA), today announced
QANTAS DELIVERS STRONG FIRST HALF RESULT DESPITE HIGHER FUEL BILL
 ASX and Media Release Sydney, 21 February 2019 QANTAS DELIVERS STRONG FIRST HALF RESULT DESPITE HIGHER FUEL BILL Underlying Profit Before Tax: $780 million (down $179 million) Statutory Profit Before Tax:
Sydney Airport delivers another year of strong performance and is well positioned for growth
 21 February 2018 Sydney Airport delivers another year of strong performance and is well positioned for growth Growth across all businesses with total revenue increasing 8.7% Record passenger numbers of
1 st Quarter Results FY
 1 st Quarter Results FY 2004-05 05 Q1 Highlights p Context 8Improving economic context 8Strong economic growth in Americas and Asia 8Modest economic recovery in Europe 8Soaring fuel prices 8IPE Brent up
Meeting the Management 2017 Structurally improving the financial profile. Michael Pontzen, CFO
 Meeting the Management 2017 Structurally improving the financial profile Michael Pontzen, CFO Safe harbor statement The information included in this presentation is being provided for informational purposes
Corporate Presentation 2012/13 Interim Results
 Corporate Presentation 2012/13 Interim Results 26 February 2013 0 Disclaimer The information contained in this presentation is intended solely for your personal reference. Such information is subject to
Financial Position (consolidated)
") May 14 th, 2015 Disclaimer This presentation is for informational purposes only, contains preliminary financial and other information about Korean Air Lines Co., Ltd. and is subject to updating, revision,
May 14 th, 2015 Disclaimer This presentation is for informational purposes only, contains preliminary financial and other information about Korean Air Lines Co., Ltd. and is subject to updating, revision,
Joshua Koshy, Executive Vice President & CFO. Changing the Game
 Joshua Koshy, Executive Vice President & CFO Changing the Game Changing the Game Canada s #1 domestic, trans-border and international airline Strong brand recognition Innovative revenue model driving customer
For personal use only
 Sydney Airport Holdings Limited ABN 85 075 295 760 AFSL 236875 Central Terrace Building 10 Arrivals Court Sydney International Airport New South Wales 2020 T 1800 181 895 or +61 2 9667 9871 F +61 2 9667
Adjusted net income of $115 million versus an adjusted net loss of $7 million in the second quarter of 2012, an improvement of $122 million
 Air Canada Reports Record Second Quarter 2013 Results Highest Adjusted Net Income, Operating Income and EBITDAR Results for Second Quarter in Air Canada s History Adjusted net income of $115 million versus
Press Release. Bilfinger 2017: Stable foundation laid for the future
 Press Release February 14, 2018 Bilfinger 2017: Stable foundation laid for the future Organic growth in orders received after three years of decline Trend reversal: Output volume better than expected Growth
For personal use only
 ASX and Media Release QANTAS DELIVERS RECORD FIRST HALF PROFIT, INVESTS IN AIRCRAFT AND TRAINING Sydney, 22 February 2018 Underlying Profit Before Tax: $976 million (up 15%) Record results for Qantas Domestic,
Nicco Parks & Resorts Ltd BSE Scrip Code:
 Nicco Parks & Resorts Ltd BSE Scrip Code: 526721 Other Leisure Facilities September 14, 2012 Equity Statistics Current Market Price Rs. 15.9 52 Week High / Low Rs. 24.4/15.2 Market Capitalisation Rs. crores
Investor Meeting Presentation. 4 June 2014
 Investor Meeting Presentation 4 June 2014 COMPANY OVERVIEW 1Q2014 RESULTS OVERVIEW OPERATION HIGHLIGHTS Q&A 2 Founded in 1963, listed on the Singapore Exchange in 1964 Three core businesses: - Property
AIR CANADA REPORTS THIRD QUARTER RESULTS
 AIR CANADA REPORTS THIRD QUARTER RESULTS THIRD QUARTER OVERVIEW Operating income of $112 million compared to operating income of $351 million in the third quarter of 2007. Fuel expense increased 49 per
1H2018 Financial Results
 Cedar Woods Properties Limited 1H2018 Financial Results 22 February 2018 Cedar Woods strategy Cedar Woods Presentation 2 To grow and develop our national project portfolio, diversified by: geography product
Cebu Air, Inc. 4 th Quarter and Full Year 2017 Results of Operations. cebupacificair.com
 Cebu Air, Inc. 4 th Quarter and Full Year 2017 Results of Operations cebupacificair.com Disclaimer The information provided in this presentation is provided only for your reference. Such information has