International Convention Badges
|
|
|
- Merry Baldwin
- 6 years ago
- Views:
Transcription
1 Images may not be the actual size. (Reduced the image sizes to save white space in the catalog) Images provided by Lion Verle Malik Created 07/24/2015.


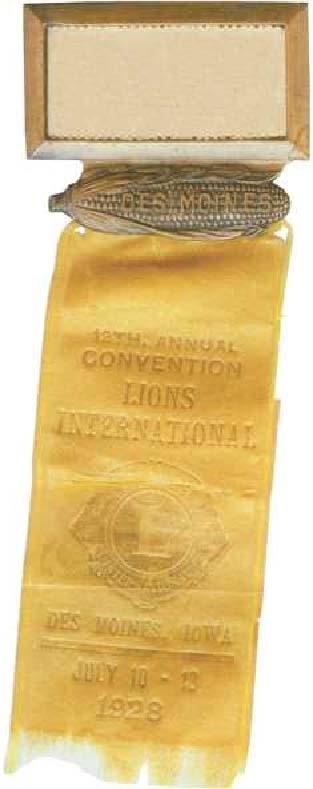
2 th Annual Convention June 26-29, 1923 Atlantic City, NJ 8th Annual Convention June 23-26, 1924 Omaha, NB 9th Annual Convention June 29-July 2, 1925 Cedar Point, OH Visitor Host Committee th Annual Convention July 21-24, 1926 San Francisco, CA th Annual Convention June 15-18, 1927 Miami, FL 12th Annual Convention July 10-13, 1928 Des Moines, IA 2


3 th Annual Convention June 18-21, 1929 Louisville, KY 14th Annual Convention July 15-18, 1930 Denver, CO 15th Annual Convention July 14-17, 1931 Toronto, Ontario, Canada th Annual Convention July 19-22, 1932 Los Angeles, CA. USA 17th Annual Convention July 11-14, 1933 St. Louis, MO 3
4 th Annual Convention July 17-20, 1934 Grand Rapids, Michigan, USA th Annual Convention July 23-25, 1935 Mexico City, Mexico 4

5 th Annual Convention July 21-24, 1936 Providence, RI th Annual Convention July 20-23,, 1937 Chicago, IL nd Annual Convention July19-22, 1938 Oakland, CA 23nd Annual Convention July 18-21, 1939 Pittsburgh, PA 5


6 th Annual Convention July 23-25, 1940 Havana, Cuba th Annual Convention July 22-25, 1941 New Orleans, LA 26th Annual Convention July 21-24, 1942 Toronto, Canada No Convention Held in th Annual Convention July 20-22, 1943 Cleveland, OH 28th Annual Convention August 1-3, 1944 Chicago, IL 1945 Annual Convention NONE HELD 6


7 th Annual Convention July 16-19, 1946 Philadelphia, PA 30th Annual Convention July 28-31, 1947 San Francisco, CA st Annual Convention July 26-29, 1948 New York, NY st Annual Convention July 18-21, 1949 New York, NY 33rd Annual Convention July 16-20, 1950 Chicago, IL th Annual Convention June 24-28, 1951 Atlantic City, NJ 35th Annual Convention June 25-28, 1952 Mexico City, Mexico 7

8 th Annual Convention July 8-11, 1953 Chicago, IL th Annual Convention July 7-10, 1954 New York, NY th Annual Convention June 22-25, 1955 Atlantic City, NJ 8

9 th Annual Convention June 22-25, 1956 Miami, FL th Annual Convention June 26-29, 1957 San Francisco, CA 9

10 st Annual Convention July 9-12, 1958 Chicago, IL nd Annual Convention June 30-July 3, 1959 New York, NY 10

11 th Annual Convention July 6-9, 1960 Chicago, IL st Annual Convention June 21-24, 1961 Atlantic City, NJ 11
12 th Annual Convention June 20-June 23, 1962 Nice, France th Annual Convention June 19-22, 1963 Miami, FL 12
13 th Annual Convention July 8-11, 1964 Toronto, Canada th Annual Convention July 7 10, 1965 Los Angeles, CA 13


14 th Annual Convention July 6 9, 1966 New York, NY th Annual Convention July 5-8, 1967 Chicago, IL 14
15 st Annual Convention June 26 29, 1968 Dallas, TX nd Annual Convention July 2 5, 1969 Tokyo, Japan rd Annual Convention July 1-4, 1970 Atlantic City, NJ th Annual Convention June 22 25, 1971 Las Vegas, NV 15


16 th Annual Convention June 28 July 1, 1972 Mexico City, Mexico th Annual Convention June 27 30, 1973 Miami, FL th Annual Convention July 3 6, 1974 San Francisco, CA th Annual Convention June 25 28, 1975 Dallas, TX 16


17 th Annual Convention June 23 26, 1976 Honolulu, HI th Annual Convention June 29 July 3, 1977 New Orleans, LA st Annual Convention June 21 24, 1978 Tokyo, Japan nd Annual Convention June 20 23, 1979 Montreal, Quebec, Canada 63rd Annual Convention July 2 5, 1980 Chicago, IL 17
18 th Annual Convention June 30-July 3, 1981 Phoenix, AZ th Annual Convention June 30-July 3, 1982 Atlanta, GA st Annual Convention June 26 29, 1983 Honolulu, HI 67th Annual Convention July 4 7, 1984 San Francisco, CA 18
19 th Annual Convention June 19 22, 1985 Dallas, TX th Annual Convention July 9 12, 1986 New Orleans, LA th Annual Convention June 19 22, 1985 Dallas, TX st Annual Convention June 28-July 2, 1988 Denver, CO 19
20 nd Annual Convention June 20 24, 1989 Miami, FL 73rd Annual Convention July 11 14, 1990 St. Louis, MO nd Annual Convention June 20 24, 1991 Brisbane, Australia th Annual Convention June 22 26, 1992 Brisbane, Australia 20

21 Leo th Annual Convention July 6 9, 1993 Minneapolis/St. Paul/Bloomington, MN th Annual Convention July 12-15, 1994 Phoenix, AZ th Annual Convention July 4-7, 1995 Seoul, Republic of Korea th Annual Convention July 9-12, 1996 Montreal, Quebec, Canada 21


22 th Annual Convention June 30-July 5, 1997 Philadelphia, PA 81st Annual Convention June 29-July 3, 1998 Birmingham, England 82st Annual Convention June 26-July 2, 1999 San Diego, CA 83rd Annual Convention June 19-23, 2000 San Diego, CA th Annual Convention July 2-6, 2001 Indianapolis, IN 85th Annual Convention July 8-12, 2002 Osaka, Japan 86th Annual Convention June 30-July 4, 2003 Denver, CO 87th Annual Convention July 5-9, 2004 Detroit, MI, USA/Windsor, Ontario, Canada th Annual Convention June 27-July 1, 2005 Hong Kong, China 89th Annual Convention June 30-July 4, 2006 Boston, Massachusetts, USA 90th Annual Convention July 2-6, 2007 Chicago, Illinois, USA A Special 50th event was held for Leo Clubs during this convention. All registered Leos received this pin. 22


23 st Annual Convention June 23-27, 2008 Bangkok, Thailand nd Annual Convention July 6-10, 2009 Minneapolis, MN, USA nd Annual Convention June 28-July 2, 2010 Sydney, Australia th Annual Convention July 4-8, 2011 Seattle, Washington, USA th Annual Convention June 22-26, 2012 Busan, Korea All registered Leos received this pin. 96th Annual Convention July 5-9, 2013 Hamburg, Germany All registered Leos received this pin th Annual Convention July 4-8, 2014 Toronto, Ontario, Canada th Annual Convention June 26-30, 2015 Honolulu, Hawaii, USA 23
Lower Income Journey to Work Market Share From American Community Survey
 Lower Income Journey to Work Market Share From American Community Survey 2006-2010 Table 1: Overall National Data Table 2: Car, Truck or Van Table 3: Transit Table 4: Metrics Table 1 Work Trip Market Share:
FBI Drug Demand Reduction Coordinators
 FBI Drug Demand Reduction Coordinators Alabama 2121 Building, Room 1400 Birmingham, AL 35203 (205) 252 7705 One St. Louis Centre One St. Louis Street Mobile, AL 36602 (334) 438 3674 Alaska 222 West Seventh
the linea bench series
 t h e l i n e a b e n c h s e r i e s the linea bench series The Linea Bench Series, designed by Barcelona-based Mario Ruiz, provides an alternative approach to conventional seating areas. While initially
 Snakes & Lattes is currently composed of three corporate owned and operated board game cafes in Toronto, ON. Over the last 7 years these have become renowned as Toronto's premiere board game cafe destinations.
World Class Airport For A World Class City
 World Class Airport For A World Class City Air Service Update October 2017 2017 Air Service Updates February 2017 Cleveland new destination, 2x weekly Raleigh-Durham new destination, 2x weekly March 2017
Rank Place State Native Hawaiian and Pacific Islander population (alone or in combination
 TABLE 2a: 100 Largest Places Ranked by Number of s (race alone or in *) Living in Hard-to- Census Rank Place State (alone or in 1 Honolulu (CDP) HI 64,196 11,130 17.3 2 New York City NY 14,981 8,211 54.8
World Class Airport For A World Class City
 World Class Airport For A World Class City Air Service Update December 2018 2018 Air Service Updates February 2018 Delta Air Lines Seattle new departure, seasonal, 2x weekly Delta Air Lines Boston new
Location, Location, Location. 19 th Annual NIC Conference NIC MAP Data & Analysis Service
 Location, Location, Location 19 th Annual NIC Conference NIC MAP Data & Analysis Service The Great Occupancy Decline 94% Occupancy Trends Majority Nursing Seniors Housing 93% 92% 91% 92.8% 91.0% 90% 89%
Norwegian's Free Airfare Promotion
 Norwegian's Free Airfare Promotion Start planning your next vacation with 200+ cruises to incredible destinations, including Alaska, Bahamas & Florida, Bermuda, Canada & New England, Caribbean, Mexican
World Class Airport For A World Class City
 World Class Airport For A World Class City Air Service Update April 2018 2018 Air Service Updates February 2018 Seattle new departure, seasonal, 2x weekly Boston new departure, seasonal, 2x weekly March
Census Affects Children in Poverty by Professors Donald Hernandez and Nancy Denton State University of New York, Albany
 Phone: (301) 457-9900 4700 Silver Hill Road, Suite 1250-3, Suitland, MD 20746 Fax: (301) 457-9901 Census Affects in Poverty by Professors Donald Hernandez and Nancy Denton State University of New York,
PUBLIC TRANSPORTATION INTRODUCTION
 PUBLIC TRANSPORTATION INTRODUCTION 1 OUTLINE Current Status and Recent Trends Significant Influences A Critical Assessment Arguments Supporting Public Transport Future Influences Ingredients for Future
Greater Orlando Aviation Authority Orlando International Airport Destinations by Airline December 2017
 Aer Lingus Dublin, Ireland 3 3 0 0 Aeromexico Mexico City, Mexico 19 4 19 4 0 Air Canada Halifax, Nova Scotia 2 2 Montreal/Dorval, Quebec 12 1 Ottawa, Ontario 5 3 1 Toronto, Ontario 20 1 Vancouver, British
Hector International Airport Fargo, North Dakota
 Hector International Airport Fargo, North Dakota Volume 072 Twelve Months Ended June 2007 November 2007 Airlines Serving Fargo Carried 830 Onboard Passengers Per Day for the Twelve Months Ended June 2007,
Hector International Airport Fargo, North Dakota
 Hector International Airport Fargo, North Dakota Volume 073 Twelve Months Ended September 2007 January 2008 Airlines Serving Fargo Carried 831 Onboard Passengers Per Day for the Twelve Months Ended September
STATE OF UTAH "BEST VALUE" COOPERATIVE CONTRACT CONTRACT NUMBER: AR2270 November 14, 2016
 Item: Contracted Airline Fares Purchasing Agent: Chad Hinds Phone #: (801) 538-1287 Email: chinds@utah.gov Vendor: 112932A Internet Homepage: Delta Air Lines, Inc. 1030 Delta Blvd. Atlanta, GA 30354 www.statetravel.utah.gov
World Class Airport For A World Class City
 World Class Airport For A World Class City Air Service Update April 2017 2017 Air Service Updates February 2017 Cleveland new destination, 2x weekly Raleigh-Durham new destination, 2x weekly March 2017
District Match Data Availability
 District Match Data Availability National & State Data Location Available National Data Australia Parliament, Provincial and Territory Assemblies Canada Parliament, Provincial Legislative Assemblies New
Access Across America: Transit 2014
 Access Across America: Transit 2014 Final Report CTS 14-11 Prepared by: Andrew Owen David Levinson Accessibility Observatory Department of Civil, Environmental, and Geo- Engineering University of Minnesota
INDIANA INTERSTATE AND INTRASTATE LOCAL REDUCED CITY-PAIR FARES
 The following section contains city-pair fares that are lower than walkup mileage-based fares. Although shown in only one direction, the fares in this section apply in both directions, unless otherwise
333 W. Campbell Road, Suite 440 Richardson, Texas Cruising for Charity with Randy Limbacher in Tahiti July 28, 2007
 333 W. Campbell Road, Suite 440 Richardson, Texas 75080 972.238.1998 800.952.1998 Cruising for Charity with Randy Limbacher in Tahiti July 28, 2007 Join me for this special annual event to raise money
ILLINOIS INTERSTATE AND INTRASTATE LOCAL REDUCED CITY-PAIR FARES
 The following section contains city-pair fares that are lower than walkup mileage-based fares. Although shown in only one direction, the fares in this section apply in both directions, unless otherwise
2018 Preferred Rate Hotel Program Rates
 Atlanta, GA The Ritz-Carlton, Atlanta 800-241-3333 $279 $298 $361 $372 The Ritz-Carlton, Buckhead 800-241-3333 $303 $321 $410 $384 The St. Regis Atlanta 404-832-8065 $294 $321 $444 W Midtown Atlanta -NEW-
Hector International Airport Fargo, North Dakota
 Hector International Airport Fargo, North Dakota Volume 081 Twelve Months Ended March 2008 July 2008 Airlines Serving Fargo Carried 838 Onboard Passengers Per Day for the Twelve Months Ended March 2008,
MANGO MARKET DEVELOPMENT INDEX REPORT
 MANGO MARKET DEVELOPMENT INDEX REPORT 2015-2016 UNDERSTANDING THE MARKET INDEX The Mango Market Development Index is designed to measure and compare mango sales volume relative to population by region
UNITED STATES OF AMERICA NORTH AMERICA TOP 10 DAILY PARKING RATES Parking Rates Median (US$) Chicago, IL.
 Chicago, IL.") C O L L I E R S I N T E R N A T I O N A L N O R T H A M E R I C A Parking Rates C B D P A R K I N G R A T E S U R V E Y 2 0 0 9 GLOBAL COMPARISON TOP 25 MONTHLY UNRESERVED PARKING RATES MEDIAN (US$) London
C O L L I E R S I N T E R N A T I O N A L N O R T H A M E R I C A Parking Rates C B D P A R K I N G R A T E S U R V E Y 2 0 0 9 GLOBAL COMPARISON TOP 25 MONTHLY UNRESERVED PARKING RATES MEDIAN (US$) London
2016 Air Service Updates
 Air Service Update May 2016 2016 Air Service Updates February 2016 Pittsburgh new destination, 2x weekly April 2016 Los Angeles new departure, 1x daily Atlanta new departure, 1x daily Jacksonville new
NORTH AMERICA CBD PARKING RATE SURVEY HIGHLIGHTS
 COLLIERS INTERNATIONAL l 2007 NORTH AMERICA CBD PARKING RATE SURVEY HIGHLIGHTS Parking Rates Creep Still Higher Colliers 7th annual North America Parking Rate Survey indicates the cost to park continues
Major Metropolitan Area Sales Tax Rates
 August 19, 2010 No. 239 FISCAL FACT Major Metropolitan Area Sales Tax Rates By Lawrence Summers Introduction General sales taxes levied by state, county and city governments in the United States vary greatly,
2019 Preferred Rate Hotel Program Rates
 Atlanta, GA The Ritz-Carlton, Atlanta 800-241-3333 $292 $303 $379 $390 The Whitley, A Luxury Collection,Atlanta Buckhead 404-348-5650 $299 $321 $410 $384 The St. Regis Atlanta 404-215-4666 $318 $348 $518
Monthly Employment Watch: Milwaukee and the Nation's Largest Cities
 Monthly Employment Watch: Milwaukee and the Nation's Largest Cities A monthly report on employment trends in the nation s largest cities Prepared by: The University of Wisconsin-Milwaukee Center for Economic
BLACK KNIGHT HPI REPORT
 CONTENTS 1 OVERVIEW 2 NATIONAL OVERVIEW 3 LARGEST STATES AND METROS 4 FEBRUARY S BIGGEST MOVERS 5 20 LARGEST STATES 6 40 LARGEST METROS 7 ADDITIONAL INFORMATION OVERVIEW Each month, the Data & Analytics
Metropolitan Votes and the 2012 U.S. Election: Population, GDP, Patents and Creative Class
 politan Votes and the 2012 U.S. Election: Population, GDP, Patents and Creative Class Author: Shawn Gilligan, Shawn.Gilligan@rotman.utoronto.ca Zara Matheson, Zara.Matheson@rotman.utoronto.ca Kevin Stolarick,
Mango Market Development Index
 Mango Market Development Index 2016-2017 Understanding the Market Index The Mango Market Development Index is designed to measure and compare mango volume sold at retail relative to population by region
1834 Newton 1835 South Boston 1836 Charlestown 1837 South Boston 1838 Salem 1839 South Boston 1840 South Boston 1841 East Boston 1842 Cambridge 1843
 1834 Newton 1835 South Boston 1836 Charlestown 1837 South Boston 1838 Salem 1839 South Boston 1840 South Boston 1841 East Boston 1842 Cambridge 1843 West Cambridge 1844 South Boston 1845 Cambridge 1846
ACI 2008 WORLDWIDE AIRPORT TRAFFIC STATISTICS
 WORLD AIRPORT RANKING BY TOTAL PASSENGERS TOTAL PASSENGERS 1 ATLANTA GA ATL 90 039 280 0.7 2 CHICAGO IL ORD 69 353 876 ( 9.0) 3 LONDON LHR 67 056 379 ( 1.5) 4 TOKYO HND 66 754 829 ( 0.2) 5 PARIS CDG 60
CONNECTICUT INTERSTATE AND INTRASTATE LOCAL REDUCED CITY-PAIR FARES
 PASSENGER TARIFF AND SALES MANUAL CONNECTICUT INTERSTATE AND INTRASTATE LOCAL REDUCED CITY-PAIR S The following section contains city-pair fares that are lower than walkup mileage-based fares. Although
Higher Education in America s Metropolitan Areas A Statistical Profile
 Higher Education in America s Metropolitan Areas A Statistical Profile MSA Study No.2 Higher Education in America s Metropolitan Areas A Statistical Profile CONTENTS Why Metro Areas? 1 Executive Summary
2016 Air Service Updates
 Air Service Update September 2016 2016 Air Service Updates February 2016 Pittsburgh new destination, 2x weekly April 2016 Los Angeles new departure, 1x daily Atlanta new departure, 1x daily Jacksonville
Monthly Employment Watch: Milwaukee and the Nation's Largest Cities
 Monthly Employment Watch: Milwaukee and the Nation's Largest Cities A monthly report on employment trends in the nation s largest cities Prepared by: The University of Wisconsin-Milwaukee Center for Economic
A CORPORATE OR MEDICAL USER OPPORTUNITY WELL-LOCATED OFF THE PA TURNPIKE AM Drive. Quakertown, PA INVESTMENT SUMMARY. Page 1
 A CORPORATE OR MEDICAL USER OPPORTUNITY WELL-LOCATED OFF THE PA TURNPIKE 1900 AM Drive Quakertown, PA INVESTMENT SUMMARY Page 1 EXECUTIVE SUMMARY On behalf of ownership, Avison Young is pleased to offer
Greater Orlando Aviation Authority Orlando International Airport Airlines by Destination December 2017
 s by Destination Aguadilla, PR JetBlue 7 2 Akron/Canton, OH Southwest 1 Spirit 6 1 Albany, NY JetBlue 7 Southwest 14 1 Aruba, Netherlands Antilles Southwest 7 Atlanta, GA Delta 112 1 3 Frontier s 7 Southwest
2016 Air Service Updates
 Air Service Update June 2016 2016 Air Service Updates February 2016 Pittsburgh new destination, 2x weekly April 2016 Los Angeles new departure, 1x daily Atlanta new departure, 1x daily Jacksonville new
Population Estimates for U.S. Cities Report 1: Fastest Growing Cities Based on Numeric Increase,
 ulation s for U.S. Cities Report 1: Fastest Growing Cities Based on Numeric Increase, 2015-2015 1 Phoenix AZ 32,113 2.0 1,582,904 1,615,017 167,393 11.6 2 Los Angeles CA 27,173 0.7 3,949,149 3,976,322
PORTLAND INTERNATIONAL AIRPORT
 PORTLAND INTERNATIONAL AIRPORT (PDX) OPERATIONS & CITIES SERVED 2018 (AS OF SEPTEMBER) SCHEDULED ARRIVALS 268 SCHEDULED DEPARTURES 268 NONSTOP CITIES (AIRPORTS) 57 DOMESTIC CITIES 51 INTERNATIONAL CITIES
2016 Air Service Updates
 2016 Air Service Updates February 2016 Pittsburgh new destination, 2x weekly April 2016 Los Angeles new departure, 1x daily Atlanta new departure, 1x daily Jacksonville new destination, 2x weekly Philadelphia
Greater Orlando Aviation Authority - Orlando International Airport Airlines by Destination July 2018
 s by Destination Aguadilla, PR JetBlue 14 -- -- Akron/Canton, OH Albany, NY Southwest 8-1 -- Albuquerque, NM Frontier s 3 -- 3 Southwest 2 -- -5 Amsterdam, Netherlands Delta 7 -- 7 Aruba, Netherlands Antilles
2019 Preferred Rate Hotel Program Rates
 ABA 2019 TWO EASY WAYS TO MAKE RESERVATIONS USING THE ABA PREFERRED RATE HOTEL PROGRAM: PROBLEM BOOKING THE ABA PREFERRED RATES? CONTACT ABA TRAVEL SERVICES AT travel.services@americanbar.org 1. Contact
TOP 100 Bus Fleets Agency 35 ft. and Over Artic under 35 ft. Total. 18 < metro magazine SEPTEMBER/OCTOBER 2018 metro-magazine.
 1 1 MTA New York City Transit/MTA Bus Co. 0 4,860 951 5,811 New York City 2 3 New Jersey Transit Corp. 418 2,879 85 3,382 Newark, N.J. 3 2 Los Angeles County Metropolitan Transportation Authority 50 1,882
Greater Orlando Aviation Authority Orlando International Airport Airlines by Destination April 2017
 s by Destination Aguadilla, PR JetBlue 7 Akron/Canton, OH Southwest 1 4 Spirit 7 7 Albany, NY JetBlue 7 Southwest 20 1 1 Albuquerque, NM Southwest 1 1 Aruba, Netherlands Antilles Southwest 7 Atlanta, GA
The FMR history file contains the following fields, all for 2-bedroom FMRs. It is in EXCEL format for easy use with database or spreadsheet programs.
 The FMR history file contains the following fields, all for 2-bedroom FMRs. It is in EXCEL format for easy use with database or spreadsheet programs. GENERAL NOTES 1. There are no Fiscal Year 1984 FMRs
Lesson1: Bivariate Relationships PRACTICE PROBLEMS
 Name: Unit 3 Regression and Correlation Lesson1: Bivariate Relationships PRACTICE PROBLEMS I can use appropriate vocabulary to describe the shape, strength, center, and spread of a scatterplot. Investigation
Passengers Boarded At The Top 50 U. S. Airports ( Updated April 2
 (Ranked By Passenger Enplanements in 2006) Airport Table 1-41: Passengers Boarded at the Top 50 U.S. Airportsa Atlanta, GA (Hartsfield-Jackson Atlanta International) Chicago, IL (Chicago O'Hare International)
OB-GYN Workload & Potential Shortages: The Coming U.S. Women s Health Crisis
 OB-GYN Workload & Potential Shortages: The Coming U.S. Women s Health Crisis JULY 2017 Introduction Obstetricians and Gynecologists (OB-GYNs) are a critical part of the health care provider community.
2018 Preferred Rate Hotel Program Rates
 BA 2018 TWO EASY WAYS TO MAKE RESERVATIONS USING THE ABA PREFERRED RATE HOTEL PROGRAM: PROBLEM BOOKING THE ABA PREFERRED RATES? CONTACT ABA TRAVEL SERVICES AT travel.services@americanbar.org 1. Contact
TOP 100. Transit Bus Fleets Agency 35 ft. Over Artic and 35 ft. Total +/- under 0 3, ,426 82
 L.A. Metro-No. 3 1 1 MTA New York City Transit New York City 2 2 New Jersey Transit Corp. Newark, N.J. 3 3 Metro Los Angeles 4 5 Toronto Transit Commission Toronto 5 10 Chicago Transit Authority Chicago
Agency 35 ft. Over Artic. Trolley 2012 Total and 35 ft. under. 1 1 MTA New York City Transit 0 3, ,344 New York City
 Capital Metro-No. 40 Courtesy Capital Metro 1 1 MTA New York City Transit 0 3,704 640 0 4,344 New York City 2 3 New Jersey Transit Corp. 47 2,263 85 0 2,395 Newark, N.J. 3 2 Metro 50 1,956 378 0 2,384
2012 Airfares CA Out-of-State City Pairs -
 2012 Airfares Out-of-State City Pairs - Contracted rates are from July 1, 2012 through June 30, 2013. Please note all fares are designated as () and ( ) in airline computer reservation systems. fares are
JUSTIN TIMBERLAKE ANNOUNCES EUROPEAN & U.K. DATES AND NEW NORTH AMERICAN LEG TO PREVIOUSLY SOLD OUT THE MAN OF THE WOODS TOUR
 JUSTIN TIMBERLAKE ANNOUNCES EUROPEAN & U.K. DATES AND NEW NORTH AMERICAN LEG TO PREVIOUSLY SOLD OUT THE MAN OF THE WOODS TOUR Over 450,000 Tickets Already Sold in North America Alone With Second Shows
GRND 3D 2D NXT GRND 3D 2D NXT GRND 3D 2D NXT AL
 750's 12 PACK SHIPMENTS Wine Shipping Rates 11/01/2018 6 PACK SHIPMENTS 4 PACK SHIPMENTS GRND 3D 2D NXT GRND 3D 2D NXT GRND 3D 2D NXT AL AK - - $156 - - - $114 - - - $94 - AZ $50 $99 $112 $141 $36 $70
Arizona - Phoenix Last Updated by Seyed 12 hours ago Tempe Mission Palms Hotel 60E. 5th St. Tempe, AZ Tel.
 www.iran.org COMPLETE LIST OF ILLEGAL POLLING PLACES SET UP BY THE ISLAMIC REPUBLIC OF IRAN IN THE UNITED STATES FOR THE JUNE 12, 2009 PRESIDENTIAL ELECTIONS 1 Source: Islamic Republic of Iran Interest
Non-stop Scheduled Passenger Service at Fargo as of October Top 20 Domestic O&D Passenger Markets at Fargo Twelve Months Ended June 2006
 0 5000 10000 15000 20000 25000 30000 35000 40000 45000 50000 Airport Traffic Quarterly Non-stop Scheduled Passenger Service at Fargo as of October 2006 Top 20 Domestic O&D Passenger Markets at Fargo Twelve
Parking Rates & Policies Survey. December 2013
 METER OVERVIEW RATE & POLICY PRESENTATION SURVEY / 1 Parking Rates & Policies Survey December 2013 METER OVERVIEW RATE & POLICY PRESENTATION SURVEY / 2 Parking rates and policies survey The purpose of
Greater Orlando Aviation Authority Orlando International Airport Airlines by Destination February 2018
 s by Destination Aguadilla, PR JetBlue 7 Akron/Canton, OH Southwest 1 Spirit 7 Albany, NY JetBlue 7 Southwest 18 5 3 Aruba, Netherlands Antilles Southwest 7 Atlanta, GA Delta 113 1 Frontier s 7 Southwest
Airports Council International
 Airports Council International HOW SECURITY CONTRIBUTES TO THE ECONOMIC COMPETITIVENESS OF THE AIR CARGO INDUSTRY 16APRIL 2014 Michael Rossell Director ICAO Relations ACI World 1 Mission ACI promotes the
LIST OF PAST PRESENTATIONS:
 LIST OF PAST PRESENTATIONS: December 14, 2018 - CPA Ontario Hamilton, Full Day Workshop November 28, 2018 - CPA Ontario Vaughan, Full Day Workshop November 19, 2018 Vancouver, BC CPA BC Full Day Workshop
Appendix D: Aggregation Error for New England Metro Areas and for Places
 Appendix D: for New England Metro Areas and for Places D-1 Appendix D: s Figure D-1: New England Metro Areas - Summary of Tract s (2000) Metro ID (msapma99) Metro Area Name Census NCDB 1120 Boston, MA-NH
Sioux Falls Regional Airport Sioux Falls, SD
 Sioux Falls Regional Airport Sioux Falls, SD Volume 16-4 T1 Data Through April 216 July 216 Sioux Falls Onboard Ticker YE Apr 16 YoY Apr-16 YoY Passengers 989,223 -.4% 79,34 1.8% Airport Traffic Monthly
Impact of Hurricane Irma on US Metropolitan Areas
 Impact of Hurricane Irma on US Metropolitan Areas Puerto Ricans in mainland Prepared for: Jorge Restrepo, CEO 2017 EurekaFacts LLC September 29, 2017 Climate refugees from Puerto Rico in US metropolitan
Agenda. Binswanger. Food Industry Trends. Food Industry Changes. Suggestions for the Economic Development Community. Conclusion
 May 2011 Agenda Binswanger Food Industry Trends Food Industry Changes Suggestions for the Economic Development Community Conclusion Global Coverage Corporate Headquarters Philadelphia, Pennsylvania 29
Monthly Employment Watch: Milwaukee and the Nation's Largest Cities
 Monthly Employment Watch: Milwaukee and the Nation's Largest Cities A monthly report on employment trends in the nation s largest cities Prepared by: The University of Wisconsin-Milwaukee Center for Economic
INDUSTRIAL REAL ESTATE INVESTMENT OPPORTUNITY GATEWAY BOULEVARD HEBRON, KENTUCKY
 INDUSTRIAL REAL ESTATE INVESTMENT OPPORTUNITY GATEWAY BOULEVARD HEBRON, KENTUCKY GROUNDBREAKING OPPORTUNITIES Dear Investors, Brokers and Developers, Corporex Companies is very pleased to present a Groundbreaking
Who Sprawls the Most?
 SPRAWL AMERICAN STYLE Who Sprawls the Most? Jackie Cutsinger Research Assistant, Center for Urban Studies Wayne State University Measuring Sprawl in Major Metros Regionally stratified, nationally representative
Charleston, WV 18 Juneau, AK Peoria, IL Jefferson City,
 2004 Ranking Diocese Catholics Diocesan Seminarians 2004 Ratio (Catholics / Seminarians) 2003 Ranking 1 Lincoln, NE 89431 35 2555 2 2 Yakima, WA 68561 20 3428 5 3 Savannah, GA 75987 22 3454 13 4 Cheyenne,
Beta Radiation in the United States Following the Fukushima Disaster. by Bobby1
 Beta Radiation in the United States Following the Fukushima Disaster by Bobby1 This is a statistical study of beta radiation in the United States following the Fukushima nuclear disaster. Its purpose is
Major US City Preparedness For an Oil Crisis Which Cities and Metro Areas are Best Prepared for $4 a Gallon Gas and Beyond?
 Major US City Preparedness For an Oil Crisis Which Cities and Metro Areas are Best Prepared for $4 a Gallon Gas and Beyond? March 4, 2008 By Warren Karlenzig President Common Current www.commoncurrent.com
The Returns to Single Family Rental Strategies
 The Returns to Single Family Rental Strategies Andrew Demers and Andrea L. Eisfeldt January 2014 Homeownership Rates 70.0% 65.0% 60.0% Home Ownership Rate 55.0% 50.0% 45.0% 40.0% 1890 1895 1900 1905 1910
Hotel InduSTRy Overview What Lies Ahead
 University of Massachusetts Amherst ScholarWorks@UMass Amherst Tourism Travel and Research Association: Advancing Tourism Research Globally 2013 Marketing Outlook Forum - Outlook for 2014 Hotel InduSTRy
Westshore Development Forum April 11, Hillsborough County Aviation Authority
 Westshore Development Forum April 11, 2017 Aviation in Florida Only state with four large hub airports $144 billion in annual economic activity or output Approximately 43.1 million visitors come to Florida
Dates are subject to change Please check with sponsoring organization This calendar is not representative of all events
 As of Dec 13, 2018 ACI-NA INDUSTRY CALENDAR 2019 Meetings Jan 6-10 AAAE 33 rd Annual Aviation Issues Conference Maui, HI Jan. 12-16 ASHRAE Winter Conference Atlanta, GA Jan. 15-16 ACI-NA Innovation Forum
U.S. Metropolitan Area Exports, 2015
 U.S. Metropolitan Area Exports, 2015 Jeffrey Hall Office of Trade and Economic Analysis Industry and Analysis Department of Commerce International Trade Administration September 2016 U.S. Metro Exports:
Certificate of Approval
 Certificate of Approval This is to certify that the Management System of: Earle M. Jorgensen Company 10650 South Alameda Street, Lynwood, CA, 90262, has been approved by LRQA to the following standards:
NICHOLAS BROWN Vice President, Development (516)
") CONSTRUCTION CONTACTS SOUTHERN NORTHERN D-ATLANTIC LEE JOHNSON (704) 362-6149 lbjohnson@kimcorealty.com NICHOLAS BROWN (516) 869-7266 nbrown@kimcorealty.com PAT CHRISTIE (516) 869-7130 pchristie@kimcorealty.com
CONSTRUCTION CONTACTS SOUTHERN NORTHERN D-ATLANTIC LEE JOHNSON (704) 362-6149 lbjohnson@kimcorealty.com NICHOLAS BROWN (516) 869-7266 nbrown@kimcorealty.com PAT CHRISTIE (516) 869-7130 pchristie@kimcorealty.com
Park-Related Total* Expenditure per Resident, by City
 Park-Related Total* per Resident, by City FY 2008 City Population Total Park per Resident Washington, D.C. 591,833 $153,324,830 $259 Seattle 598,541 $150,672,543 $252 Scottsdale 235,371 $50,429,049 $214
Monthly Employment Watch: Milwaukee and the Nation's Largest Cities
 Monthly Employment Watch: Milwaukee and the Nation's Largest Cities A monthly report on employment trends in the nation s largest cities Prepared by: The University of Wisconsin-Milwaukee Center for Economic
Monthly Employment Watch: Milwaukee and the Nation's Largest Cities
 Monthly Employment Watch: Milwaukee and the Nation's Largest Cities A monthly report on employment trends in the nation s largest cities Prepared by: The University of Wisconsin-Milwaukee Center for Economic
Zones metropolitaines: sources de croissance. Montreal, 7 Mai 2009
 Zones metropolitaines: sources de croissance Montreal, 7 Mai 2009 Concentration matters Urbanisation: Percentage yearly change in total population living in large urban TL3 regions in the whole country;
Dates are subject to change Please check with sponsoring organization This calendar is not representative of all events
 As of January 11, 2018 Dates are subject to change Please check with sponsoring organization ACI-NA INDUSTRY CALENDAR 2018 Meetings January 10 12 ACI-NA Risk Management Conference New Orleans, LA January
MARKETBEAT U.S. Office
 MARKETBEAT U.S. Office Q4 2018 U.S. OFFICE Employment Indicators Market Indicators (Overall) Office: Net Absorption/Asking Rent 4Q TRAILING AVERAGE Office: Overall Vacancy Q4 17 Q4 18 Total Nonfarm Employment
Annual Meeting full listing
 Annual Meeting full listing May 7-11, 2017 Baltimore, Md. Annual Meeting May 1-5, 2016 Seattle, Wash Annual Meeting May 3-7, 2015 Denver, Colo. Annual Meeting May 4-8, 2014 Orlando, Fla. Annual Meeting
An unforgettable experience for middle school students July 2016
 An unforgettable experience for middle school students What is ISCA? 11 31 July 2016 3 week exhilarating travel program to England: designed specifically for middle school students Cultural, historic &
Houston Economic Update. Presented by Patrick Jankowski Vice President, Research Greater Houston Partnership
 Houston Economic Update Presented by Patrick Jankowski Vice President, Research Greater Houston Partnership Houston Astros - Percent Regular Season Games Won Help from the bullpen this year Help from the
Fort Lauderdale August 8, 2017
 Fort Lauderdale August 8, 2017 8/10/2017 TAP Software Analytics Division Brian Finucane TAP Reports Jeff Eastman TAP Hotel Reports Jeanne Eastman TAP Data Source Jeff Eastman Cloud Database Numerous Data
GSO Sales Calendar Remaining for 2018
 GSO Sales Calendar Remaining for 2018 MONTH DATE GSO TRADESHOW / SALES MISSIONS/TRIPS LOCATION July/August July30-Agust-3 N Beykirch Midwest Sales Mission STL Maritz/Chicago August August 22-26 N Beykirch
ANDREW WATTERSON Vice President Planning and Revenue Management
 ANDREW WATTERSON Vice President Planning and Revenue Management Safe Harbor Statement The following information contains certain forward looking statements that reflect the Company s current views with
Hotel Industry Performance Overview Washington Lodging Convention
 Hotel Industry Performance Overview Washington Lodging Convention Valerie Woods Director of Business Development, Hotels vwoods@str.com Valerie_STR 2016 STR, Inc. All Rights Reserved. Any reprint, use
RANKING OF THE 100 MOST POPULOUS U.S. CITIES 12/7/ /31/2016
 OVERVIEW OF THE DATA The following information is based on incoming communication to the National Human Trafficking Hotline via phone, email, and online tip report from December 7, 2007 December 31, 2016
Social Media In Your New & Improved Phoenix Sky Harbor
 Social Media In Your New & Improved Phoenix Sky Harbor AZ Chapter of HSMAI September 19, 2013 It always begins & ends with: skyharbor.com Began Facebook page in October 2010 More than 27,000 people Like
MARKETBEAT U.S. Office
 MARKETBEAT U.S. Office Q3 2018 U.S. OFFICE Employment Indicators Market Indicators (Overall) Office: Net Absorption/Asking Rent 4Q TRAILING AVERAGE Office: Overall Vacancy Q3 17 Q3 18 Total Nonfarm Employment
Per capita carbon emissions from transportation and residential energy use, 2005
 Per capita carbon emissions from transportation and residential energy use, 2005 Metropolitan Area Carbon Footprint Honolulu, HI 1 1.356 Los Angeles-Long Beach-Santa Ana, CA 2 1.413 Portland-Vancouver-Beaverton,