Integrated Transportation and Capacity Building Plan
|
|
|
- Buck Brown
- 5 years ago
- Views:
Transcription


1 Anaheim Resort Transportation Integrated Transportation and Capacity Building Plan Imagine the Possibilities DRAFT FINAL REPORT June 2017
2 Draft Integrated Transportation & Capacity Building Plan Table of Contents 1.0 INTRODUCTION Background Study Approach and Methodology EXISTING CONDITIONS Anaheim Transportation Network / Anaheim Resort Transportation ATN Oversight and Management Administration and Operating Framework Service Characteristics Fare Structure Fleet ATN Service Evaluation Financial Performance Other Service Providers Private Coach, Shuttle and Limousine Service Providers Orange County Transportation Authority (OCTA) John Wayne Airport Metrolink and Amtrak MARKET ANALYSIS Key Destinations within ART s Service Area Anaheim Visitor Profile ART Passenger Profile Community Demographic Profile Travel Patterns Future Development Market Analysis Key Findings STAKEHOLDER CONSULTATION Project Steering Committee ART Board of Directors Stakeholder Interviews i
3 Draft Integrated Transportation & Capacity Building Plan 4.4 Outreach Summary GOVERNANCE Historical Context Framework for Assessing Institutional Arrangements Criteria for Assessing Alternative Institutional Arrangements Institutional Arrangements and the Scope of Transportation Services Looking to the Future and Potential New Services Opportunities for Expanding the Geographic Reach of ART Cost-Allocation Model Cost Allocation Funding Allocation Options Recommended Cost-Allocation Model Guiding Principles Markets Served The Product / Service Financial Sustainability PLANNED IMPROVEMENTS SERVICE STRATEGIES The Role of ART Partnering with OCTA and Metrolink The Role of Private Sector Providers ATN as Mobility Manager Service Delivery Phased Deployment Years Years Years Technology A Way Forward FINANCIAL PLAN ii
4 Draft Integrated Transportation & Capacity Building Plan APPENDICES Appendix A Public Involvement Plan Appendix B Select Presentation Material Appendix C (a) Stakeholder Interview Guide (b) Stakeholder Interview Notes Appendix D Cost-Allocation Model Appendix E Fact Book iii
, a local non-profit transportation management association and a service provider of the Anaheim Resort Transportation (ART) system retained the")
5 Draft Integrated Transportation & Capacity Building Plan 1.0 INTRODUCTION The Anaheim Transportation Network (ATN), a local non-profit transportation management association and a service provider of the Anaheim Resort Transportation (ART) system retained the IBI Group team in the summer of 2015 to undertake this Integrated Transportation and Capacity Building Plan ( Study ). The Study has been funded through a Transit Planning for Sustainable Communities Grant from Caltrans and the Anaheim Tourism Improvement District (ATID). The primary goal of this Study was to work with stakeholders to formulate a vision for preferred transportation operations in the existing and proposed service areas, to determine future transit needs and to develop financing and institutional structures that meet the needs of the business and commuting constituencies. The resulting goal was to develop a Plan that is fundable, cost- effective and sustainable in providing transit services to residents, employees, commuters and visitors, for the next 20 years. The Study has examined existing transit services provided by ATN in The Anaheim Resort and Platinum Triangle areas, proposed new areas, as well as integration with regional connectivity through the Anaheim Regional Transportation Intermodal Center (ARTIC) operations and the prospect of higher capacity transit services providing eastwest (ARTIC to Resort Area) connectivity as well as other future regional transportation enhancements. 1.1 Background The City of Anaheim is a major regional destination, attracting approximately 23 1 million visitors each year to its major attractions, including The Disneyland Resort, Downtown Disney, Anaheim Convention Center, Angels Stadium of Anaheim, and Honda Center. These destinations, along with the thousands of hotel rooms, ensure Anaheim enjoys high employment concentration in the entertainment and recreational areas of the city. The Platinum Triangle exemplifies Anaheim s forward-thinking urban planning efforts, which have been enhanced by numerous community engagement activities to ensure residents and businesses in Anaheim have a voice in the City s redevelopment plans. The City has been a regional leader in ensuring its land-use policies are matched with smart and effective transportation systems, including the establishment of the Anaheim Resort Transportation (ART) system, the Anaheim Regional Transportation Intermodal Center (ARTIC) and involvement in the planning efforts associated with the Harbor Corridor Enhancement Study which have been expended to include East-West Connector (formerly the Anaheim Rapid Connection [ARC]). 1 Source -- Visit Anaheim May 9, 2017, 2016 Anaheim Visitor information 1


6 Draft Integrated Transportation & Capacity Building Plan The City of Anaheim is engaged in a long-term transition in community development and land planning as it evolves into a primary focal point in the highly complex and Southern California metropolitan region. Founded in 1857, Anaheim has emerged in recent decades as California's tenth most populous city containing nearly 350,000 residents within 50 square miles. The city is home to large employers including Disneyland Resort, Kaiser Foundation Hospital, City of Anaheim, Northgate Gonzales Markets, CashCall Inc. Mortgage Division, Anaheim Regional Medical Center, among others in-and-around the Platinum Triangle development area. Anaheim is a world-class entertainment destination that draws millions of visitors annually to cultural, recreational and sporting events occurring frequently at the Anaheim Convention Center, Grove of Anaheim, Honda Center, Angels Stadium of Anaheim, the Shops at Anaheim GardenWalk, Center Street, and the Packing District, among others. The goal of this project is to bring about an enhanced passenger transportation system as part of Anaheim s short and long-range transportation solutions to strategically determine the most effective and efficient use of existing and future ART resources. Further, to identify enhancements needed to support economic development and land use objectives. This is a dynamic environment with several major projects in process that are significant to this study: The Anaheim Regional Transportation Intermodal Center (ARTIC) Project is a partnership between the City and OCTA that resulted in a new intermodal facility which opened in December ARTIC has become a gateway transportation hub to the area with service from Amtrak, Metrolink, OCTA, ART and other public and private transportation services. The proposed Anaheim Fixed-Guideway East-West Connector (formerly known as Anaheim Rapid Connection [ARC]) project intends to link the Platinum Triangle with The Anaheim Resort area and ARTIC with a high caliber system consistent with the long term vision for the City. The California High-Speed Rail Authority (CHSRA) is advancing high speed train service for intercity travel in California between major metropolitan centers of the San Francisco Bay Area and Sacramento in the north, through the Central Valley, to Los Angeles, Anaheim and San Diego in the south. It is envisioned that ARTIC will be one of the major gateways. 2


7 Draft Integrated Transportation & Capacity Building Plan Harbor Corridor - Harbor Boulevard is Orange County s busiest north/south transit corridor, carrying approximately eight percent of countywide bus ridership through some of the densest areas of the County. The Orange County Transportation Authority (OCTA) has initiated a study to analyze and develop options to improve Harbor Boulevard s transit systems from Westminster Boulevard in Santa Ana to Chapman Avenue in Fullerton. The Central Harbor Boulevard Transit Corridor Study will define the corridor, travel demand, and the mobility needs; develop goals and performance measures; and identify potential alternatives for improving the corridor. The final phase of the study will evaluate the alternatives against the goals and objectives. The findings and recommendations of the study will be incorporated in a final report and ultimately provide OCTA and the corridor cities of Santa Ana, Garden Grove, Anaheim and Fullerton, and OCTA with sufficient information to develop a strategy for improving the corridor. Eastern Gateway - The Eastern Gateway is a proposed Disneyland Resort parking structure, pedestrian bridge, pedestrian pathway, transit hub and security screening area on the east side of Harbor Boulevard at Disney Way. Initial plans were submitted to the City of Anaheim Planning Department in summer and fall The Anaheim City Council adopted a Go Local Transit Master Plan (Resolution No ) in December 2007 after extensive public review and comment. A major objective in development of the Plan was to define feeder routes to improve connectivity between Anaheim s two Metrolink stations (at the Anaheim Regional Transportation 3
8 Draft Integrated Transportation & Capacity Building Plan Intermodal Center (ARTIC) and the Anaheim Canyon station), and major employment/activity centers in Anaheim. Like the Transit Master Plan, the Anaheim City Council also adopted the Anaheim Canyon Station Master Site Plan (Resolution No ) in December The purpose of the Master Site Plan was to establish the overall design framework to guide the future expansion of the station and to better integrate it with the surrounding developments. The ATN was organized in 1995 by key members of the Anaheim business community joining together to better address the diverse and to a large extent, unique transportation problems. The Anaheim Resort Transportation (ART) service began operations in May The concept for ART was established through the Anaheim Resort Specific Plan EIR to consolidate various shuttles operated by resorts and attractions within The Anaheim Resort area. ART was established by the City of Anaheim and local business community to provide public transportation service for the residents, employees and guests of the City of Anaheim and the greater resort area, including the Cities of Anaheim, Garden Grove, and Orange. ART has grown considerably in the past decade and today operates 22 fixed bus routes. Most routes operate on a headway schedule ranging from five to 20 minutes. Remaining routes operate as a scheduled fixed route. With close to a four-fold increase since 2002, ART currently operates 80 total buses and in excess of one million annual revenue miles. Ridership currently exceeds nine million annual passengers. Service spans are flexible and are based on weekend and/or weekday service destinations operating hours, lodging establishments occupancy rates, parking capacity, special events schedules and projected daily demand for service. Service is tailored to peak (leisure travel) and off-peak (convention/business travel) seasons which also typically correspond to employment levels in The Anaheim Resort. Similarly, since 2002, ART s service area has expanded considerably including service to destinations in Costa Mesa, Buena Park, Orange and Santa Ana. One-seat connectivity through ARTIC and cooperative fare agreements with Metrolink and LOSSAN 2 Rail Authority, further expend ART s reach via regional and inter-city rail. ART operates wholly within the OCTA transit service area and that an underlying tenet of looking at the future of transit services within and around the City of Anaheim is ensuring the transparency of the two systems in the eyes of system users, while maintaining the unique identity of ART service. From the customer perspective, it would be ideal if ART and OCTA services were seamlessly integrated such that it was easy to locate and catch respective buses at well-defined stops without excessive wait or uncertainty of the arrival time(s). A single pre-paid transit card would automatically pay the correct fare for any ride on any bus within or around Anaheim. To achieve this objective, the study process must engage OCTA directly to identify viable opportunities to better integrate passenger transportation services particularly for system users. It is critical to understand where OCTA is going relative to future service planning and route restructuring. 2 Included in its mandate, OCTA staffs the LOSSAN Rail Corridor Agency, a joint powers authority that works to increase ridership, revenue, capacity, reliability, coordination and safety on the coastal rail line between San Diego, Los Angeles and San Luis Obispo. 4
9 Draft Integrated Transportation & Capacity Building Plan Although a strong partner with the City and ATN, OCTA is affected by a variety of challenges that potentially impact its ability to implement or carry out transit improvements in the project study area. These include budget reductions in recent years that triggered service reductions throughout the OCTA service area, including Anaheim and neighboring cities. Metrolink is an important resource and clearly part of Anaheim s transportation future. With service from both the Orange County Line at ARTIC and Inland Empire Line at Anaheim Canyon, the study area is well-positioned to benefit from further Metrolink service span and frequency improvements. Further, through an interagency transfer agreement, ATN has a mandate for the provision of first-last mile services from ARTIC. Complementing the technical elements of the study work program was the review of institutional concerns to offer a viable Integrated Transportation and Capacity Building Plan. Governance and funding were key issues requiring a strong stakeholder engagement process to identify and refine viable options for transit systems integration and sustainability - developing a consensus around governance and funding issues was a key part of the strategy for channeling available resources into an enhanced public transit system in the City of Anaheim, including The Anaheim Resort and Platinum Triangle areas. ART has been actively engaged in planning and implementing transit system improvements for decades. A variety of past plans and studies have documented various transit needs in The Anaheim Resort as the population ages and economic development stretches the transit system service area. Concurrently, the pressures of expectation on public transportation to help achieve community goals ranging from greenhouse gas reduction to sustainable communities, to decreased dependence on foreign oil are growing as well. The passage of Senate Bill 375 (SB 375) mandates reductions in vehicle miles traveled (VMT) and carbon emissions from transportation sources. The Integrated Transportation and Capacity Building Plan has considered the implications of this legislative requirement and incorporate project refinements based on potential changes to land use development patterns resulting from the Sustainable Communities Strategy (SCS) as prepared for Orange County. 1.2 Study Approach and Methodology The Integrated Transportation and Capacity Building Plan is intended to provide an understanding of the existing ART system and the market it serves. The resulting analysis set the foundation for plan outcomes in general and key elements for going forward, specifically. The latter includes: Existing Conditions (Section 2) Market Assessment (Section 3) Stakeholder Consultation/Outreach (Section 4) Governance (Section 5) 5
10 Draft Integrated Transportation & Capacity Building Plan Cost-Allocation Model (Section 6) Guiding Principles (Section 7) Planned Improvements Service Strategies (Section 8) Financial Plan (Section 9) 6
11 Draft Integrated Transportation & Capacity Building Plan 2.0 EXISTING CONDITIONS This chapter profiles the range of public transportation services serving local and regional transportation patterns in the greater Anaheim area, in general and the current operations including a service evaluation of the ART system, specifically. Public transportation services include local public transit services operated by ART, regional transit services provided by OCTA, Metrolink and Amtrak, and limousine, shuttle and coach services offered by dozens of private sector operators permitted by the California Public Utilities Commission (CPUC). In addition, ride-share services/ transportation network companies (TNCs) such as Uber and Lyft, as well as traditional taxi services operate in the region. 2.1 Anaheim Transportation Network / Anaheim Resort Transportation The Anaheim Transportation Network (ATN), a local non-profit 501c(4) transportation management association and a service provider of the Anaheim Resort Transportation (ART) system. ATN s mission is to enhance transportation options by delivering reliable and efficient transportation solutions. Our commitment to customers consists of integrity, customer service, can-do spirit, communication and partnerships. ATN provides transportation services to improve mobility and air quality throughout the cities of Anaheim, Garden Grove, Santa Ana, Buena Park, Costa Mesa and Orange, California by operating a fleet of transit buses along fixed routes to provide public transportation to local and regional event destinations, rail stations, retail establishments, etc., along a system of 22 fixed routes and with an active fleet of 80 alternative fuel buses ATN Oversight and Management ATN is governed by the 13-member Board of Directors comprised of representatives from hospitality establishments, Visit Anaheim, entertainment and sports destinations, and the City. The Board is the primary policy-making body for the provision of public transit services in the greater Anaheim Resort and surrounding areas. ATN provides a comprehensive transit service, known as the Anaheim Resort Transportation (ART) in the greater Anaheim Resort area, including cities of Anaheim, Orange, Buena Park, Santa Ana, Costa Mesa and Garden Grove. ART services connects some seventy-two of the areas hospitality and employment establishments with local destinations and attractions including: Disneyland Resort Disney California Adventure Downtown Disney District Anaheim Convention Center The Outlets at Orange Christ Cathedral ARTIC Honda Center 7
12 Draft Integrated Transportation & Capacity Building Plan The Packing District Anaheim GardenWalk Medieval Times Dinner Theater CtrCity Anaheim Anaheim Canyon Metrolink Train Station Angel Stadium Knott s Berry Farm Pirates Dinner Adventure MainPlace Shopping Center Costa Mesa destinations Institutional mechanisms exist to provide operational foundation for transportation services each is described below: 1. ART began operations in May The concept for ART was established through the Anaheim Resort Specific Plan EIR to consolidate various shuttles operated by resorts and attractions within the Anaheim Resort area. ART was established by the City of Anaheim and local business community to provide public transportation service for the residents, employees and visitors of the City of Anaheim and the greater Anaheim Resort Area, including the cities of Anaheim, Garden Grove, Santa Ana, Costa Mesa and Buena Park. 2. ATN administers the delivery of ART through a non-exclusive franchise agreement with the City of Anaheim. ART service operations are contracted to Transdev (effective November 2016). Franchise Ordinance # 5911 and Ordinance , were granted to the ATN in 2004 and 2011, respectively, with the goal to solidify operational and financial foundation for locally funded public transportation initiatives and services Administration and Operating Framework ATN administers ART through an Executive Director and support staff assigned directly to the ART service. The ART operational center located at 1354 South Anaheim Boulevard, Anaheim, CA. ATN s range of responsibilities include: Environmental compliance and adherence to the Specific Plans and EIRs requirements as called out by the Anaheim City Council; Obtaining and maintaining contractual service agreements with all lodging, retail and commercial establishments; General administration and quality control of the public transit services; Brand development marketing; Provision of all customer service functions; Service development and contractual responsibilities; Full financial accountability to local community and constituency; and 8
13 Draft Integrated Transportation & Capacity Building Plan Development and deployment of technology-forward and customer-centric solutions Service Characteristics ART services are comprised of twenty-two (22) interchangeable routes operating 365 days per year: i. Core ART minute headway schedule frequency; ii. iii. Fixed Routes Printed scheduled operations; and Downtown Circulator Service Connection of the area s parking facilities. Daily service begins 90 minutes before area attractions open and concludes 30 minutes after closing. For example, during the peak summer season, service typically runs from 6:00 am through midnight seven days a week. Disneyland Resort s East Esplanade area, also known as Main Transportation Center, provides assigned passenger priority pick-up and drop-off locations and connectivity along all ART routes. As shown in Exhibit 2-1, the core route network covers eight major alignments emanating from the Disneyland Main Transportation Center to destinations in Anaheim and, Garden Grove and Orange. Core routes focus on short-distance trips between Disneyland and area hotels, restaurants and venues, including Anaheim Convention Center, Anaheim GardenWalk on Disney Way, ARTIC, Angels Stadium, Honda Center, and CtrCity Anaheim Functionally, the ART system consists of a core route network and extended area network. Most resources are deployed on the core network designed with relatively short alignments, frequent schedules and longer operating hours. These routes focus on connections between Disneyland Resort and participating hotels and restaurants situated along key corridors including Harbor Boulevard, Katella Avenue between ARTIC and Walnut Street. 9

14 Draft Integrated Transportation & Capacity Building Plan Exhibit 2-1: ART Route Map 10
15 Draft Integrated Transportation & Capacity Building Plan The following provides a narrative on each of the routes: Harbor Boulevard Line (Disneyland Resort Main Transportation Center Stops 1 & 2) operate north-south on Harbor Boulevard between the Disneyland Main Transportation Center and the Target Center south of Chapman Avenue in Garden Grove. Key trip generators served include the Anaheim Convention Center and hotels along Harbor Boulevard; notably the Hilton Anaheim, Anaheim Marriott, Sheraton Park, Clarion Hotel, Courtyard by Marriott, Cortona, Days Inn Anaheim, Hyatt Place, Double Tree Guest Suites, Stanford Inn & Suites, and Red Lion. Buses operate every 20 minutes seven days per week. The line also connects to OCTA Route 43 on Harbor Boulevard Grand Plaza Line (Disneyland Resort Main Transportation Center Stops 3, 4 & 5) operate north-south on Harbor Boulevard between the Disneyland Main Transportation Center and the Anaheim Convention Center. Major hotels served include the Anaheim Marriott, Clarion, Cortona, Courtyard by Marriott, Hilton Anaheim, Hyatt Place, Red Lion, and Sheraton Park. Buses operate every 20 minutes seven days per week. The line also connects to OCTA Route 43 on Harbor Boulevard Hotel Circle Clementine Line (Disneyland Resort Main Transportation Center Stops 6, 7 & 8) cover a U -shaped alignment between the Disneyland Main Transportation Center and destinations mostly east of Harbor Boulevard on Disney Way, South Clementine Street, Katella Avenue, Anaheim Boulevard and South Manchester Avenue. Key destinations served include the Anaheim GardenWalk, Anaheim Resort RV Park and area hotels including America s Best Value Inn, Extended Stay Suites, Candlewood Suites, Howard Johnson, Islander Inn, La Quinta, Motel 6, Peacock Suites, Quality Inn & Suites, Ramada Inn, Residence Inn Maingate, and the WorldMark Anaheim. Buses operate every 20 minutes seven days per week. The line also connects to OCTA Route 50 on Katella Avenue Katella Line (Disneyland Resort Main Transportation Center Stop 9) covers an L -shaped alignment between the Disneyland Main Transportation Center and destinations to the immediate southwest of the resort along West Katella Avenue from Harbor Boulevard to Walnut Street. Key destinations served include the Anaheim Convention Center Arena and the following hotels: Anabella; Best Western Stovall s and Pavilions; Desert Palms Hotel & Suites; Red Lion; and Residence Inn Anaheim Resort. Buses operate every 20 minutes seven days per week. The line also connects to OCTA Route 50 on Katella Avenue CtrCity Packing District Line (Disneyland Resort Main Transportation Center Stop 10) follows a loop alignment between the Disneyland Main Transportation Center and CtrCity Anaheim via Convention Way, Harbor Boulevard, Broadway Avenue, Anaheim Boulevard and Ball Road. Key destinations served include the Toy Story Transportation Center, Anaheim GardenWalk, Harbor RV Park, Packing House, Muzeo Art Center, Walmart Neighborhood Market and major hotels 11
16 Draft Integrated Transportation & Capacity Building Plan including America's Best Value Inn, Econolodge, Knight's Inn, La Quinta, and Ramada Inn Maingate. Buses operate every 30 minutes seven days per week. The line also connects to OCTA Route 4t on Anaheim Boulevard Ball Road Line (Disneyland Resort Main Transportation Center Stop 11) operates an L -shaped alignment between the Disneyland Main Transportation Center and the Holiday Inn Suites on Walnut Street via South Harbor Boulevard and Ball Road. Other major hotels served include the Hotel Menage, Staybrindge Inn and Springhill Suites. The Line also connects to OCTA Route 46 on Ball Road at Cast Way. Buses operate every 20 minutes seven days per week. Manchester Line (Disneyland Resort Main Transportation Center Stop 12) follows a loop alignment between Disneyland Main Transportation Center and destinations along Disney Way, South Manchester Avenue, West Orangewood Avenue, Haster Street, West Katella Avenue and South Harbor Boulevard. Major hotels served include the Holiday Inn Anaheim Resort and Staybridge Suites. Buses operate every 20 minutes seven days per week. ARTIC Sports Complex Line (Disneyland Resort Main Transportation Center Stops 14 [via Orangewood Avenue] & 15 [via Katella Avenue]) operate a figure 8 loop alignment between Disneyland Main Transportation Center and key destinations in the Platinum Triangle including ARTIC (providing for Metrolink rail connectivity), Angel Stadium of Anaheim, Honda Center, Anaheim Convention Center, Stadium Crossings, National Grove of Anaheim and GardenWalk via Disney Way. Major hotels served include the Ayres Inn Orange, Embassy Suites Orange and Townplace Suites. Buses operate every 40 minutes seven days per week, with headway arrivals at ARTIC every 20 minutes. The Line also connects to OCTA Route 50 at ARTIC and along Katella Avenue and OCTA Route 57 on State College Boulevard. Toy Story Line (Disneyland Resort Main Transportation Center Stop 20) connects the Disneyland Main Transportation Center with Toy Story Transportation Center via Convention Way and Disney Way. Key destinations served include the Anaheim Convention Center Grand Plaza and Anaheim GardenWalk. Major hotels served include the Hilton Anaheim, Anaheim Marriott, Clarion, Cortona, Courtyard by Marriott, Days Inn Anaheim, Homewood Suites, Hyatt Place, and Sheraton Park. Buses operate daily a 5-minute headways. The Line also connects to OCTA Route 50 along Katella Avenue and Route 43 on Harbor Boulevard. Additionally, ART operates six routes to outlying areas including shopping and recreational destinations in Buena Park. Costa Mesa, Orange and Santa Ana, as well as the Anaheim Canyon Metrolink station. These services provide longer distance trips to selected destinations outside the immediate study area, and operate low frequency or intermittent schedules within a shorter span than the core network. Orange Line (Disneyland Resort Main Transportation Center Stop 16) operates a loop alignment between the Disneyland Main Transportation Center and the 12
17 Draft Integrated Transportation & Capacity Building Plan Outlets at Orange via South Harbor Boulevard, Chapman Avenue, The City Drive, and West Garden Grove Boulevard. Major hotels served include the Best Western Meridian and Holiday Inn Express. Buses operate daily on an hourly headway. The Line also connects to OCTA Routes 47 and 54 along Chapman Avenue; Route 56 along Garden Grove Boulevard and Route 43 on Harbor Boulevard Canyon Line (Disneyland Resort Main Transportation Center Stop 16) provide peak period commuter shuttle service between CtrCity Anaheim, Disneyland Main Transportation Center and the Anaheim Canyon Metrolink station. Several major employers are served including the City of Anaheim, St. Joseph Medical, Walt Disney Travel Company, etc. The weekday-only schedule is designed to meet four morning trains and three afternoon trains. The Line also connects to OCTA Route 38 along La Palma Avenue. Buena Park Line (Disneyland Resort Main Transportation Center Stop 18) operates between the Disneyland Main Transportation Center and destinations in Buena Park via I-5 and a one-way loop comprised of West La Palma Avenue, Beach Boulevard, Crescent Avenue, Brookhurst Street and Lincoln Avenue. Key destinations served include the Anaheim Convention Center Grand Plaza, Knott s Berry Farm, Medieval Times, Pirates Dinner Adventure, Bodies and Titanic on Beach Boulevard, Anaheim Plaza Shopping Center and Dad Miller Golf Course Major hotels served include the Anaheim Marriott, Clarion, Cortona, Courtyard by Marriott, Hilton Anaheim, Hyatt Place, Portofino Inn & Suites, Sheraton Park, and Springhill Suites. Buses operate daily from 9:00 am until noon, and from 4:00 pm until 9:00 pm on hourly headways. No service is provided on this route between noon and 4:00 pm. The Line also connects to OCTA Route 38 along La Palma Avenue and Route 39 on Beach Boulevard Santa Ana Line (Disneyland Resort Main Transportation Center Stop 19) operates between the Disneyland Main Transportation Center and the Mainplace Mall in downtown Santa Ana, Bowers Museum and downtown Santa Ana destinations via Katella Avenue, Main Street and the I-5 Freeway. Key destinations served include the Anaheim Convention Center, Angels Stadium of Anaheim, Bowers Museum and. Buses operate every two hours from 10:00 am until 11:00 pm. Service partially overlaps OCTA Route 83, which also connects the study area to Downtown Santa Ana. It is noted that Route 83 operates more frequently than Route 19. Costa Mesa Line (Disneyland Resort Main Transportation Center Stop 19) is ART s newest route running between the Disneyland Main Transportation Center and South Coast Plaza Mall, Segestrom Center for the Arts, The Lab and the Camp in Costa Mesa. Major hotels served include Ayres Inn, Avenue of the Arts, Best Western Plus Newport Mesa Inn, BLVD Hotel, Costa Mesa Marriott, Crowne Plaza, Hilton Costa Mesa, Holiday Inn Express, Ramada Inn & Suites, Residence Inn by Marriott, and the Westin South Coast Plaza. Buses operate on a fixed route schedule between Anaheim and Costa Mesa and along Bristol Street for mid- and late-day service. OCTA Route 57 also connects the study area along Bristol Street 13
18 Draft Integrated Transportation & Capacity Building Plan Fare Structure ART collects fares from all customers ages three and above using a combination of fare collection methods including prepaid paper and electronic passes, and cash. Prepaid single day and multiple consecutive day passes ranging from three to 30 days are offered on the ART website, through all participating stakeholders and at 13 ticketing vending kiosks located at ARTIC, Anaheim Convention Center Grand Plaza, Disneyland Resort Main Transportation center, etc. and at concierge locations at Anaheim GardenWalk, Visit Anaheim restaurant booth, Discount Tickets and tours and other selected distribution points. Electronic pass sales are available to customers with Apple and Android mobile devices who download the app free of charge. Onboard payment of cash for single one-way rides requires exact change. The present fare structure is shown in Exhibit 2-2. Exhibit 2-2 ART 2017 Fare Structure Pass Type Regular Age 10 and older Youth Age 3-9 Reduced Fare (65+ & Disabled) 1 Day $5.50 $2.00 $ Day $14.00 $3.00 $ Day $23.00 $5.00 $ Day $45.00 $ Day $55.00 $ Fleet ATN owns an active fleet of 80 buses. All buses are equipped with SPX Genfare fare boxes and Synchromatics AVL/GPS vehicle location system. All vehicles are compliant with the American with Disabilities Act (ADA) requirements. A list of the current ATN bus fleet is provided in Exhibit
19 Draft Integrated Transportation & Capacity Building Plan Exhibit 2-3: ATN Fleet Inventory Manufacturer Model Fuel Type In-Service Date Quantity Glaval Entourage CNG Dec El Dorado Starcraft LPG May NABI Low Floor 40 Bus LNG May El Dorado EZ Rider/Passport CNG May BYD K9 Electric March ATN Service Evaluation Summary operating statistics and key performance indicators for the six year period FY are provided in Exhibit 2-4. These data reflect a 55% year-over-year increase in service level in FY 2011, followed by moderate growth averaging 5% per year during the last five years. ART ridership more than doubled since FY 2010, to approximately nine million trips in FY Peak vehicles deployed increased by 26%; from 50 buses in FY 2010 to 63 in FY Exhibit 2-4: ART Operating Statistics and Key Performance Indicators, FY Annual Operating Statistics FY Total Operating Cost Fare Revenue Net Operating Cost Annual Ridership Passenger Miles Revenue Vehicle Hours Total Vehicle Hours 1 Revenue Vehicle Miles Total Vehicle Miles 2 Peak Vehicles Operating Days 2010 $7,433,676 $4,130,320 $3,303,356 4,131,027 8,568, , , , , $10,349,958 $4,441,032 $5,908,926 7,721,634 12,611, , ,253 1,211,584 1,373, $11,034,167 $4,502,577 $6,531,590 7,614,620 16,107, , ,918 1,226,543 1,409, $12,512,339 $4,909,466 $7,602,873 8,198,807 17,368, , ,260 1,309,316 1,496, $13,062,010 $6,381,318 $6,680,692 9,010,525 17,840, , ,492 1,466,777 1,681, $13,508,966 $6,313,693 $7,195,272 8,915,038 17,830, , ,530 1,469,329 2,145, Key Performance Indicators FY Total Cost per Passenger Fare Revenue per Passenger Net Cost per Passenger Farebox Recovery Net Cost per RVH Average Daily Ridership Annual Passengers per Vehicle Passengers per RVH Scheduled Service Speed 2010 $1.80 $1.00 $ % $ ,318 82, $1.34 $0.58 $ % $ , , $1.45 $0.59 $ % $ , , $1.53 $0.60 $ % $ , , $1.45 $0.71 $ % $ , , $1.52 $0.71 $ % $ , , Notes: 1 - FY 15 calculated as 1.08 x VRH 2 - FY 15 calculated as 1.46 x VRM System Speed Average Ride Length Key performance indicators suggest a favorable trend in ridership productivity. ART generated an average of 37.8 customer boardings per revenue hour in FY 2015, which is within a narrow range (36 40 per hour) observed since FY It is noteworthy that 15


.")
20 Draft Integrated Transportation & Capacity Building Plan ridership productivity did not decline even as overall ridership increased by nearly 116% in the six-year period, as shown in Exhibit 2-5. Average daily ridership increased sharply in FY 2011, and in the years since has grown about three percent annually to 24,425 boardings per day in FY Exhibit 2-5: ART Ridership and Productivity, FY Similarly, vehicle productivity has typically trended positively in the 6-year period as reflected by boardings per peak vehicle (as illustrated in Exhibit 2-6). Passenger miles traveled has remained commensurate with increases in ridership (as illustrated in Exhibit 2-7). Exhibit 2-6: Vehicle Productivity, FY
 2.2.1 Financial Performance Key performance indicators suggest a favorable trend in financial productivity.")

21 Draft Integrated Transportation & Capacity Building Plan Exhibit 2-7: Passenger Miles Traveled, FY Annual ridership by route is presented in Exhibit 2-8. Exhibit 2-8: Annual Ridership by Route (12 month period ending Nov. 30, 2015) Financial Performance Key performance indicators suggest a favorable trend in financial productivity. Total cost per passenger declined significantly in FY 2011 and in the five years since rose an average 2.3% annually to $1.52 per customer in FY Although total fare revenues (excluding 17


22 Draft Integrated Transportation & Capacity Building Plan the Route 20 passenger fare payment substitution) collected increased by 53% over six years, the average fare per customer declined from $1.00 in FY 2010 to $0.71 in FY Farebox recovery declined in FY 2011, but has been trending upward to 46.7% of total FY 2015 operating costs. Exhibit 2-9 presents financial productivity metrics as reflected by the net cost per revenue vehicle hour and the net cost per boarding. Exhibit 2-9: Financial Productivity, FY More recent financial performance focusing on revenue and capital funding is presented in Exhibit While the largest percentage of revenues (37%) are derived through the Route 20 passenger fare payment substitution, another one-third of operating revenues are derived through fares/ticket sales. The percentage distribution of revenues is illustrated in Exhibit
23 Draft Integrated Transportation & Capacity Building Plan Exhibit 2-10: ART Financial Summary Summary FY14 Budget FY14 Actual FY2015 FY2016 Service Statistics Revenue Hours 178, , , ,800 Revenue Miles 1,383,378 1,466,743 1,464,000 1,477,000 Passengers 7,911,000 9,010,525 9,109,000 9,109,000 Revenues Ticket Sales $ 4,494,592 $ 4,222,071 $ 4,348,733 $ 4,829,775 Hotel Assessment $ 1,702,000 $ 1,754,118 $ 1,795,758 $ 1,849,630 Route 20 Assessment $ 4,892,495 $ 5,863,446 $ 6,132,618 $ 6,255,270 Other $ 2,462,472 $ 2,433,368 $ 2,797,153 $ 2,536,065 Total Operating Revenues $ 13,551,559 $ 14,273,002 $ 15,074,261 $ 15,470,741 Total Operating Expenses Total Operating Expenses $12,308,446 $14,529,338 $14,691,010 $14,532,211 Operating Expense/Revenue Summary Net Operating Revenue $1,243,114 ($256,336) $383,250 $938,529 Annual Reserve $240,000 $240,000 $383,250 $435,966 Net Operating Revenue After Reserve $1,003,114 ($496,336) $0 $502,563 Accumulated Carryover $1,243,114 ($256,336) $126,914 $1,065,444 Capital Expenses Total Capital Expenses * $ - $ - $ 4,896,917 $ 1,538,392 Capital Funding ATN Capital Funding Local Funding Federal Funding (5307) $ 492,000 $ 550,000 $ 550,000 Capital Carryover $ 492,000 Total Capital Funding $ - $ 492,000 $ 1,042,000 $ 550,000 Capital Summary Overall Net $1,243,114 $ 492,000 ($3,728,003) $77,052 * Capital Expenses includes new assets (new building and LNG fueling station). Exhibit 2-11: Percentage Distribution of Revenues 19
24 Draft Integrated Transportation & Capacity Building Plan 2.3 Other Service Providers Private Coach, Shuttle and Limousine Service Providers The California Public Utilities Commission (CPUC) regulates the private passenger transportation industry in Orange County and elsewhere in the state. Currently there are 87 active passenger transportation licenses based in the study area cities (see Appendix table), and additionally 215 active licenses based in other cities within Orange County. In addition to the more than 300 active licenses, the CPUC database lists another 175 licenses that have either expired or been revoked or suspended, as well as 19 license applications that have been denied. These data reflect a highly competitive environment and a diversity of providers. Taxis, rideshare/tncs, shuttle and limousine services are readily available in the Disneyland Resort / Platinum Triangle area and the four cities underlying the study area, including Anaheim, Buena Park, Garden Grove and Orange. The most prominent providers include: Bon Voyage Transportation provides service to and from four airports (Los Angeles, Long Beach, John Wayne and Ontario) and two cruise ship terminals (Carnival, San Pedro. Destinations advertised include Disneyland Resort in Anaheim. Uses 8-10-passenger vans. Disneyland Resort Express is operated by Southern California Gray Line between Disneyland Resort (and Anaheim area hotels), and Orange County/John Wayne Airport (SNA) or Los Angeles International (LAX) Airport. Service operates every day; buses depart hourly or on the half hour, depending on the time of day. One-way adult fares are one-way adult fares are $16.50 and $23.00, respectively. JWA Shuttle Association is as cooperative organization of shuttle companies operating out of John Wayne Airport. Asserts representation of all Orange County Airport Shuttle Drivers. Also serves LAX and LGB airports. Offers Disneyland Shuttle and Anaheim Convention Center Shuttle services on website. Karmel Shuttle offers shuttle and car service to Disneyland Resort from SNA, LAX & LGB airports, and from Los Angeles area hotels. The one-way adult fare from SNA to Anaheim is $ Uses 9-passenger vans. Also offers tour packages; e.g., Disneyland Park 1-day, 1-park ticket plus roundtrip shuttle transfers - $ per Adult; $ per Child (age 3 to 9); $30.00 per child (age 2 and under); Disneyland Resort Park Hopper plus roundtrip shuttle transfers - $ per adult; $195 per child (age 3 to 9); $30.00 per infant (age 2 and under). PCA Transportation is operated by Parking Company of America, which has 1,400 employees based mostly in Los Angeles with additional contract operations in Arizona, Georgia, Kansas and Wisconsin. Asserts certified minority business status. PCA operates service between Disneyland Resort and area hotels, and 20
25 Draft Integrated Transportation & Capacity Building Plan is the Official Disneyland shuttle for Grove District Anaheim Resort. It also serves other parts of Orange County and Los Angeles, Riverside and San Diego. Prime Time Shuttle provides regional shuttle service to and from six airports (LAX, ONT, BUR, LGB, SNA & SAN); two cruise ship terminals (San Pedro, San Diego); Union Station for Amtrak and Metrolink connections; and Los Angeles Greyhound bus terminal. Destination cities advertised include Anaheim, Fullerton, Huntington Beach, Irvine and Santa Ana in Orange County; as well as Burbank, Glendora, Hollywood, Long Beach, Los Angeles, Ontario, Pomona, Rancho Cucamonga, Riverside, San Diego, Simi Valley, Thousand Oaks and West Covina in neighboring counties. Super Shuttle offers transportation from SNA and LAX airports to Anaheim and Buena Park. One-way adult fares are $11 and $17, respectively Yellow Cab is a full service taxi cab company in Orange County, providing taxi cab and airport shuttle service throughout Orange County. All taxi cabs and drivers are licensed through the Orange County Taxi Administration Program (OCTAP) Orange County Transportation Authority (OCTA) OCTA operates a countywide bus network throughout Orange County with connections to neighboring systems covering the greater Southern California region. It also provides Access complementary paratransit service for individuals who are unable to use the regular fixed-route bus service due to functional limitations caused by a disability as defined by federal regulations pursuant to the Americans with Disabilities Act (ADA). OCTA service within the Disneyland Resort and Platinum Triangle areas is provided by 11 local routes and a limited-stop bus rapid transit line on Harbor Boulevard. The area network is displayed in Exhibit 2-1. Most resources are deployed on a grid network of 11 local routes, including five running east-west on Lincoln Avenue (42/42A), Ball (46), Katella (50, 430), Chapman (54) and Garden Grove Boulevard (56); five running northsouth on Main Street (53), State College (57), Anaheim (47/47A), Harbor (543) and Euclid Boulevard (37); and one route looping around the Disneyland Resort (83). Level of service characteristics of these routes are summarized in Exhibit 2-2. Generally the OCTA and ART route network complement one another. ART primarily focuses on short-distance connections within the study area, and OCTA focuses on longer-distance trips as an integral part of the regional transit system. Ten of 12 OCTA routes are components of the local grid network that overlays the study area and neighboring cities in Orange County. These follow mostly linear alignments on major arterial streets. Two OCTA routes terminate in the study area. Route 83, which connects downtown Santa Ana and Newport Beach to the study area, terminates westbound trips using a one-way loop consisting of Katella Avenue, Walnut Street, Ball Road, and Harbor Boulevard. The route uses a combination of Hwy 57 and arterial streets to provide direct bus connections 21

26 Draft Integrated Transportation & Capacity Building Plan between Disney and Santa Ana in less than 30 minutes. Route 430 operates peak direction-only commuter shuttle service between ARTIC and the Disneyland Resort. Exhibit 2-1. OCTA Anaheim Resort Area Network 22
27 Draft Integrated Transportation & Capacity Building Plan Exhibit 2-2. OCTA Level of Service Characteristics in Study Area Route Corridor Key Service Service Service Frequency Destinations Day Span Peak Base Eve Night East West Routes Weekday 4:13 am 11:54 pm Seal Beach Orange Lincoln Village at Orange Saturday 5:40 am 9:14 pm Sunday 5:40 am 9:14 pm Orange Alamitos Ball Village at Orange Weekday 4:29 am 11:45 pm Saturday 6:30 am 8:20 pm Sunday 6:30 am 8:20 pm Long Beach Orange Katella 54 Garden Grove Orange Chapman 56 Garden Grove Orange Garden Grove Boulevard North South Routes 37/37A La Habra Fountain Valley Euclid Street 53 Anaheim Irvine Main Street Village at Orange Outlets at Orange; Orange Transportation Center; UCI Medical Center; Santiago Canyon College Orange Transportation Center; St. Joseph's Hospital Anaheim Plaza; Fountain Valley Regional Hospital; La Habra Civic Center ARTIC; Mainplace Mall; CHOC & St. Joseph s Hospital Weekday 4:00 am 1:39 am Saturday 4:00 am 1:43 am Sunday 4:00 am 1:43 am Weekday 4:48 am 11:41 pm Saturday 5:55 am 10:00 pm Sunday 6:58 am 9:03 pm Weekday 4:45 am 9:55 pm Saturday 6:56 am 7:58 pm Sunday 6:57 am 7:51 pm Weekday 4:26 am 11:16 pm Saturday 5:31 am 9:01 am Sunday 6:55 am 8:12 pm Weekday 4:31 am 1:36 am Saturday 5:44 am 10:21 pm Sunday 5:32 am 10:18 pm /47A Fullerton Newport Beach Anaheim Boulevard / Haster Street Fullerton Transit Center; Anaheim Civic Center; Outlets at Orange; UCI Medical Center; Orange Coast College Weekday 3:53 am 11:24 pm Saturday 4:50 am 10:51 pm Sunday 4:50 am 10:51 pm Brea Newport Beach State College Boulevard Brea Mall; Cal State Fullerton; Honda Center; Angels Stadium; Outlets at Orange; South Coast Plaza; Newport Center Weekday 3:55 am 2:13 am Saturday 3:57 am 2:19 am Sunday 3:57 am 1:51 am Fullerton Santa Ana Harbor Boulevard Other Local Routes 83 Anaheim Laguna Hills Katella, Walnut, Ball, Harbor (1 way loop) Disneyland; Anaheim Convention Center; Fullerton Transit Center; Kaiser Permanente Disneyland; Anaheim Convention Center; Disney Way; Downtown Santa Ana; Laguna Hills Transit Center Weekday 5:02 am 6:49 pm Saturday 6:50 am 7:54 pm Sunday 6:53 am 7:50 pm Weekday 4:50 am 12:20 am Saturday 5:39 am 11:53 pm Sunday 5:30 am 10:55 pm ARTIC Anaheim Resort Katella, Harbor, Ball, Disneyland Drive ARTIC; Angels Stadium; Honda Center; Disneyland Weekday Peak Direction Only 30 Saturday Sunday John Wayne Airport John Wayne Airport regulates ground transportation service providers accessing Airport property and passengers. A permit is required for commercial passenger pick-up at the airport, and permit enforcement is administered by the Orange County Sheriff's Department. Currently four permit types are available: Charter permit for private coach and limousine operators that serve customers with reservations made in advance (no flag service) and paying directly for rides. Courtesy Shuttle permit for hotels and businesses that offer courtesy shuttle services that do not require reservations and do not charge customers directly for rides. 23
28 Draft Integrated Transportation & Capacity Building Plan Door-To-Door permit for shuttle operators serving customers without reservations made in advance who pay directly for rides. Due to a moratorium, the Airport currently is not accepting applications for new Door-To-Door permits. Transportation Network Company (TNC) is a new permit category enacted recently by the California Public Utilities Commission to regulate the growing number of mobile access car services operating in California. Eight operators were notified initially by the Airport concerning availability of the TNC permit: Executive Ride LLC; Hop-Skip-Drive; Lyft; Ridelabs LLC; Shuddle; Sidecar; Uber; and Wingz Metrolink and Amtrak Metrolink is the regional commuter rail service provider for Orange County and neighboring counties including Los Angeles, San Bernardino and San Diego. The rail network consists of seven lines and 55 stations offering regional connections from the ARTIC Station and Anaheim Canyon Station in Anaheim. Two line serve the study area directly. Orange County Line operates 14 weekday trains and four Saturday trains between Oceanside and LA Union Station stopping at the ARTIC in Anaheim. Southbound trains serve seven intermediate stations in Orange, Santa Ana, Tustin, Irvine, Laguna Niguel/Mission Viejo, San Juan Capistrano and San Clemente. Limited service is provided south of Laguna Niguel/Mission Viejo. Northbound trains serve four intermediate stations in Fullerton, Buena Park, Norwalk/Santa Fe Springs and Commerce. Annual ridership of 138,000 boardings at ARTIC is estimated based on reported FY 2016 first quarter average weekday ridership of 510 boardings, and estimated 150 average Saturday boardings. Inland Empire Line operates eight weekday trains and two Saturday trains between Oceanside and San Bernardino stopping at Anaheim Canyon Station. 3 San Bernardino-bound trains serve four intermediate stations in West Corona, North Main Corona, Riverside La Sierrra and Downtown Riverside. Oceanside-bound trains serve seven intermediate stations in Orange, Santa Ana, Tustin, Irvine, Laguna Niguel/Mission Viejo, San Juan Capistrano and San Clemente. Limited service is provided south of Laguna Niguel/Mission Viejo. Annual ridership of 89,000 boardings at ARTIC is projected, based on reported FY 2016 first quarter average weekday ridership of 330 boardings, and estimated 100 average Saturday boardings. Amtrak operates intercity passenger rail service in California as part of a nationwide railway network. The study area is served by the Pacific Surfliner route, which runs between San Diego and Los Angeles and stops at the ARTIC in Anaheim. The daily schedule includes 11 trains departing in each direction from ARTIC Station. Southbound trains to San Diego Santa Fe Depot make intermediate stops in Santa Ana, Irvine, San 3 Anaheim Canyon Station is located 8.5 miles northeast of the Disneyland Main Transportation Center on East La Palma Avenue near Tustin Avenue and the 91 Riverside Freeway. 24
29 Draft Integrated Transportation & Capacity Building Plan Juan Capistrano, San Clemente, Oceanside, Solana Beach and San Diego. Northbound trains Los Angeles Union Station make an intermediate stop in Fullerton. Selected trains continue to San Luis Obispo. 25

; Visitor Profile origins, mode of travel getting to Anaheim as well as mode choice while in Anaheim; ART passenger profile demographics, rider origins, mode of travel, and length of stay; Community")
30 Draft Integrated Transportation & Capacity Building Plan 3.0 MARKET ANALYSIS This chapter provides for the identification of market characteristics in ART s service area. An understanding of such characteristics contribute to the formulation of service delivery strategies including insight into new areas where ART might be successful in attracting new demand for services. Key elements of the Market Analysis includes discussion of: Key Destinations the area s key trip generators (employment, education, retail/commercial, medical, recreation, tourism, etc.); Visitor Profile origins, mode of travel getting to Anaheim as well as mode choice while in Anaheim; ART passenger profile demographics, rider origins, mode of travel, and length of stay; Community demographic profile population and employment characteristics ; Travel Patterns journey to work origins and destinations; and Future Developments the dynamic development landscape in and around Anaheim. 3.1 Key Destinations within ART s Service Area This section provides a brief description of each key destination along with an overview of the Anaheim lodging industry. Approximately twenty million visitors visit the area including and surrounding The Anaheim Resort and the Platinum Triangle each year. The Disneyland Resort The Disneyland Resort consists of Disneyland Park, Disney s California Adventure, and Downtown Disney District. These destinations are the primary attractions within the ART service area, accounting for the majority of visitors and employees traveling to the area. The Disneyland Resort employs 23,000 employees, which is approximately 13 percent of the total employment in the City of Anaheim. The Shops at Anaheim GardenWalk Anaheim GardenWalk is a 460,000-square-foot outdoor dining, shopping and entertainment experience situated in the heart of the Anaheim Resort District just steps from the Disneyland Resort, Anaheim Convention Center and a short drive from Angel Stadium and Honda Center. GardenWalk is home to House of Blues Anaheim, Rumba Room Live, Grasslands Meat Market, Johnny Rockets, California Pizza Kitchen, Roy's Restaurant, P.F. Chang's, The Cheesecake Factory, Bubba Gump Shrimp Co., 26
31 Draft Integrated Transportation & Capacity Building Plan McCormick & Schmick's Grille, FiRE + ice Grill + Bar and more. Entertainment options include a fitness center, bowling and entertainment center, salon and spa, evening lounge, and movie theater. Anaheim Convention Center The Anaheim Convention Center, located across from the Disneyland Resort along Katella Avenue, is the largest convention center on the West Coast with over 1.6 million square feet of meeting and exhibit space. Convention attendance has remained steady at about 1.1 million attendees each year. Major conventions generate a significant amount of vehicular traffic, resulting in congestion along Katella Avenue and Harbor Boulevard throughout the duration of these events. Promoting the use of ART for trips within The Anaheim Resort and Platinum Triangle can help alleviate traffic congestion during these major events. Anaheim Lodging Industry According to Visit Anaheim s 2017 Hotel Stats, there are a total of 152 hotel properties consisting of nearly 21,100 rooms in the City of Anaheim, which accounted for 36 percent of total rooms in Orange County. The average hotel overnight rate for Anaheim in 2016 was $178 per night. The 2016 average occupancy rate for Anaheim was 83.08%, a significant increase from previous occupancy rate of 75.7%. The average length of stay in 2016 for Anaheim hotel/motel visitors was 3.7 nights. A majority of these lodging establishments are located within The Anaheim Resort with heavy concentrations along both Harbor Boulevard and Katella Avenue. The Anaheim lodging industry accounts for over five percent (or over 9,000 people) of the City s total employment New and upcoming hotels under development in Anaheim will add 13 hotels representing 3,288 rooms. New hotels in Garden Grove will add 5 hotels representing 1,572 rooms including the recently completed 603 room Great Wolf Lodge Southern California. Angel Stadium Angel Stadium, home to Major League Baseball s Los Angeles Angels of Anaheim, is a 45,000-seat facility that hosts other major sporting events, concerts, and other events. The stadium is located in the Platinum Triangle. Honda Center Events at Angel Stadium and Honda Center generate significant congestion along Katella Avenue before and after the events, creating travel delays along the main corridor between The Anaheim Resort and the Platinum Triangle. Honda Center is a 17,174-seat arena primarily used as a hockey arena for the National Hockey League s Anaheim Ducks. Concerts and other events are also held here. The arena is located approximately 3 miles from Disneyland Resort at the northeast corner of the Platinum Triangle. 27

32 Draft Integrated Transportation & Capacity Building Plan City National Grove of Anaheim City National Grove of Anaheim is an indoor venue located next to Angel Stadium and the Anaheim Amtrak/Metrolink Station. The venue holds nearly 1,700 people and hosts live music shows and comedy acts. ART should continue to focus on serving the dense concentration of major attractions and key destinations within The Anaheim Resort and the Platinum Triangle. 3.2 Anaheim Visitor Profile Visit Anaheim 2015 data indicates there were 22.5 million visitors to the City of Anaheim, 2.7 million (12%) of whom were international visitors. Anaheim visitors spent approximately $7.3 billion throughout Orange County in 2015, an increase of more than 8% from the previous year. Mode of Travel According to the Visit Anaheim (Anaheim/Orange County Visitor & Convention Bureau) 2010 Annual Visitor Profile report as presented in Exhibit 3-1, approximately 68 percent of Anaheim visitors arrived via private vehicle, 27 percent accessed the area through air travel, 1.8 percent using a rental vehicle, while the remaining 2.7 percent arrived using another form of transportation, which included rail and bus. 28


33 Draft Integrated Transportation & Capacity Building Plan Exhibit 3-1: Mode of Travel to Anaheim Exhibit 3-2 presents the overall mode split for Anaheim visitors traveling within the City of Anaheim: Exhibit 3-2: Mode of Travel within the City of Anaheim 29
34 Draft Integrated Transportation & Capacity Building Plan Nine percent of Anaheim visitors indicated they use Shuttle or Bus service as their primary mode of transportation while in Anaheim, while an additional nine percent indicated walking as their primary mode of travel. 3.3 ART Passenger Profile Based on findings from an ART administered on-board survey in 2011, this section provides a profile of the (then) ART rider. While the data may be dated, it provides an order of magnitude of the ART passenger profile. Passenger Demographics: As illustrated below, (Exhibit 3-3) approximately 58 percent of ART riders are adults. Additionally, 24 percent are children between the ages of 3-12 and 18 percent are teens. Exhibit 3-4 presents the breakdown of how many adult passengers ride with children, teens, or on their own. Exhibit 3-3: ART Passenger Type Exhibit 3-4: ART Riders Traveling with Children and/or Teens 30
35 Draft Integrated Transportation & Capacity Building Plan Rider Origins: As presented in Exhibit 3-5, Northern California residents represent the highest percentage of ART riders, accounting for approximately 14 percent. Residents from Arizona account for a similar share of ART ridership, with 13 percent. About 10 percent of passengers are residents of Southern California and 7 percent are from Central California. Exhibit 3-5: ART Rider Origins Mode of Travel: Exhibit 3-6 presents the mode of travel used to get to The Anaheim Resort. Driving was the most popular mode of travel for ART riders represented in the survey, accounting for nearly 50 percent. About 42 percent of visitors accessed Southern California/ Orange County via airplane. Only 5 percent of riders traveled by bus, and even fewer traveled using rail (3 percent). Exhibit 3-6: ART Rider Mode of Travel (to Anaheim) 31
36 Draft Integrated Transportation & Capacity Building Plan Based on survey responses, the typical ART passenger is an adult traveling with children who is in Anaheim for an overnight vacation or holiday. Only 5 percent of passengers traveled to The Anaheim Resort by bus, and even fewer traveled using rail (3 percent). The majority of ART passengers listed overnight vacation/holiday as their primary reason for visiting The Anaheim Resort (84 percent), indicating that most demand on ART routes originates at area hotels/resorts. 3.4 Community Demographic Profile In general, population and employment densities and growth forecasts are effective indicators of areas that are more likely to produce transit ridership. Data from the 2010 US Census, as well as population and employment projections provided by the Center for Demographic Research Orange County Projections (OCP 2010) and Southern California Association of Government (SCAG) were used to develop a community profile of the ART service area and surrounding areas. Population and employment densities for the City of Anaheim and its surrounding area is presented as data in Exhibit 3-7 and a corresponding map as presented in Exhibit 3-8. Anaheim is projected to have the largest increase in total population and employment from 2010 to Exhibit 3-7: Population and Employment Densities (2010 and 2035) Population Employment City Total Density (per acre) Total Density (per acre) Total Density (per acre) Total Density (per acre) Anaheim 336, , , , Buena Park 86, , , , Fullerton 139, , , , Garden Grove 176, , , , Orange 140, , , , Santa Ana 358, , , , ORANGE COUNTY TOTAL 3,164, ,573, ,513, ,845,

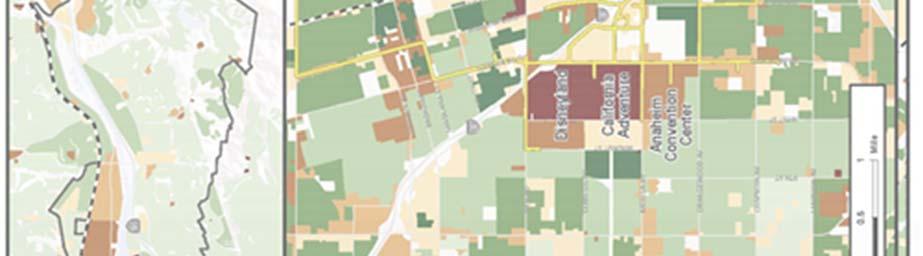
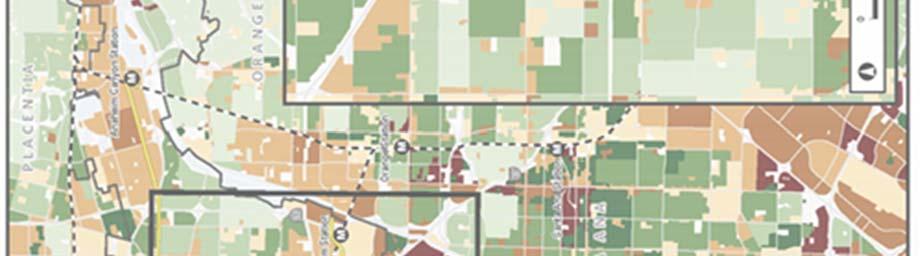
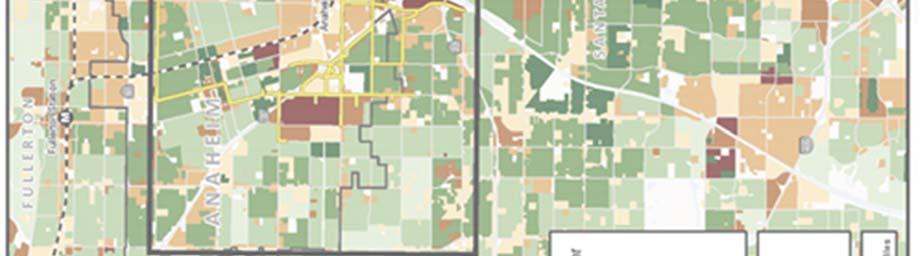
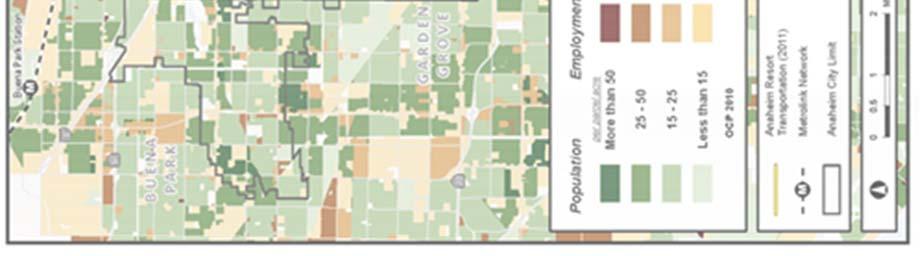
37 Draft Integrated Transportation & Capacity Building Plan Exhibit 3-8: Population and Employment Densities (OCP 2010) 33
38 Draft Integrated Transportation & Capacity Building Plan Population: Small pockets of concentrated population densities are present in Anaheim, primarily in Downtown Anaheim, and the area immediately to the north. More moderate population densities are present in West Anaheim and the Hill and Canyon area. Future growth forecasts indicate significant population growth in Downtown Anaheim and in the Platinum Triangle. Small pockets of dense residential development are also present just south of Anaheim in Garden Grove, and just north of Anaheim around the Fullerton Metrolink Station. Employment: Several major destinations are located within ART s service area including The Disneyland Resort, The Shops at Anaheim GardenWalk, Angel Stadium, and Honda Center. As such, this area is characterized primarily by high to moderate employment density. Disneyland Resort employs nearly 23,000 workers in the City of Anaheim. The Platinum Triangle and Anaheim Canyon areas also display moderate concentrations of employment. Significant increases in employment densities are projected near Metrolink stations at Anaheim (ARTIC), Anaheim Canyon, Fullerton, and Orange. The Platinum Triangle projects the most employment growth with over 40,000 employees projected at build-out of the commercial and office uses allowed by The Platinum Triangle Master Land Use Plan. ART serves the areas of Anaheim with the highest concentrations of employment. Significant employment and population growth is also projected within the ART service area, specifically in the Platinum Triangle. The population and employment demographics highlight areas within Anaheim and the cities surrounding it where a demand for transit is likely to occur in the present and in the future. Some of the areas that show a potential demand for transit may be served more efficiently by OCTA service. There are also plans to enhance bus service along strong corridors throughout Orange County as part of OCTA s Transit System Study (TSS) including Harbor Boulevard, Katella Avenue, and State College Boulevard. ART should continue to focus on serving riders (visitors, workers, and residents) traveling within The Anaheim Resort and the Platinum Triangle. Major Employers: City of Anaheim 2016/17estimates 4, Exhibit 3-9 shows the major employers in the City of Anaheim. Of the reported Anaheim labor force of 169,000, the Disneyland Resort, with 23,000 employees, accounts for over 22 percent of the total Anaheim workforce. The next largest employer is Kaiser Permanente, with 6,000 employees, or 3.5 percent of all Anaheim employees. 4 Prospects Inc. and the Orange County Business Journal 34
39 Draft Integrated Transportation & Capacity Building Plan Exhibit 3-9: Major Employers in the City of Anaheim Employer Employees Disneyland Resort 23,000 Kaiser Permanente 6,000 City of Anaheim 3,000 Northgate Gonzalez Markets 2,000 Hilton Anaheim 1,575 Angels Baseball 1,484 AHMC Anaheim Regional Medical Center 1,262 Anaheim Marriot Hotel 1,030 L-3 Communications 1,000 St. Joseph Heritage Healthcare 900 Time Warner Cable Business Class 900 West Anaheim Medical Center 821 Carrington Mortgage Services LLC Travel Patterns It is important to understand major travel movements within and outside of ART s service area in general, and where employees working within The Anaheim Resort and Platinum Triangle are beginning their daily commute trips, specifically. Determining when and where people travel helps to reveal major travel movements within and outside of ART s service area. Of particular interest to ART is where employees working within The Anaheim Resort and Platinum Triangle are beginning their daily commute trips. Census Journey to Work: Origins and Destinations: The US Census Bureau and Labor Department together created a database that compiled payroll records to identify worker origins and destinations. From this database, approximately 40,500 daily work trips (home to work) were identified for The Anaheim Resort and the Platinum Triangle combined (see Exhibit 3-10). Approximately 6,100 (15 percent) of trips to The Anaheim Resort and the Platinum Triangle originated within Anaheim. Los Angeles, Garden 35
40 Draft Integrated Transportation & Capacity Building Plan Grove, and Santa Ana each represented about 5 percent of trip origins destined for The Anaheim Resort and the Platinum Triangle. Only about 2,600 work trips originated within The Anaheim Resort and the Platinum Triangle. About 13 percent of these trips were destined to somewhere within Anaheim, and 9 percent to Los Angeles. Exhibit 3-10: Origins and Destinations for Employees working in The Anaheim Resort or Platinum Triangle Where do Employees Live? Where do Employees Work? Place/City Count Percent Place/City Count Percent Anaheim 6, % Anaheim % Los Angeles 2, % Los Angeles % Garden Grove 2, % Santa Ana % Santa Ana 1, % Irvine % Orange 1, % Orange % Fullerton 1, % Garden Grove % Long Beach 1, % Costa Mesa % Huntington Beach % Long Beach % Buena Park % Huntington Beach % Corona % Newport Beach % All Other Locations 21, % All Other Locations 1, % Total All Jobs 40, % Total All Jobs 2, % The Southern California Association of Governments (SCAG) 2017 Profile of the City of Anaheim report included journey to work for residents data (see Exhibit 3-11). Of note, 78 percent of residents drive alone to work. Four percent use public transit. Between 2000 and 2016, the greatest change occurred in the percentage of individuals who 36

41 Draft Integrated Transportation & Capacity Building Plan traveled to work by driving, increased by 5.6 percentage points. Other refers to bicycle, pedestrian, and home-based employment. Other represents 4 percent transportation mode choice. Exhibit 3-11: Journey to Work Transportation Mode Choice (2000, 2010, and 2016) Orange County Transportation Analysis Model (OCTAM): As part of the analysis of potential travel markets, 2035 trip origin and destination forecasts were generated through OCTA s OCTAM regional transportation model. While multiple data runs were generated, Exhibits 3-12 and 3-13 illustrate the concentration of Anaheim Resort Area (AM peak) inbound and (AM peak) outbound trips respectively. The 2035 travel forecasts echo current travel patterns as reflected by trip concentrations (trips generated per square mile) in the immediate and surrounding areas. 37
")
42 Draft Integrated Transportation & Capacity Building Plan Exhibit 3-12: Anaheim Resort Area Inbound Trips (AM peak) 38
43 Draft Integrated Transportation & Capacity Building Plan Exhibit 3-13: Anaheim Resort Area Outbound Trips (AM peak) 3.6 Future Development The City of Anaheim has the highest projected development density among the cities within Orange County, and has many large-scale transportation, residential, office, and tourist projects underway. Platinum Triangle : The Platinum Triangle Master Land Use Plan envisions an exciting future for the area surrounding Angel Stadium of Anaheim, The City National Grove of Anaheim and Honda Center. Amidst millions of square feet of new development opportunities for office, restaurant and residential projects, is an established destination featuring high-rise lofts, two championship sports teams, an array of dining and entertainment, plus immediate access to three freeways and a major transit center. The Platinum Triangle Master Land Use Plan was established in 2004 and subsequently amended in The Plan allows for up to 18,909 residential units, 4.9 million commercial square feet, 14.3 million office square feet and 1,500,000 institutional square 39
44 Draft Integrated Transportation & Capacity Building Plan feet. This includes development and entitled projects totaling 8,319 residential units, 2.3 million office square feet and 1.1 million commercial square feet. Completed projects include: Stadium Lofts 390 residential units and 10,659 commercial square feet Gateway Apartment Homes 352 residential units Shops at Stadium Towers 15,605 commercial square feet Park Viridian 320 residential units 1818 Platinum Triangle 265 residential units Anavia 250 residential units Vivere 92 residential units and 1,298 commercial square feet Avalon Anaheim Stadium 251 residential units and 11,807 commercial square feet Projects entitled for future development include: A-Town Metro 2,681 residential units and 229,800 commercial square feet A-Town Stadium 878 residential units Experience at Gene Autry Way 1,208 residential units, 50,000 commercial square feet and 100,000 office square feet Orangewood Condominiums 341 residential units Platinum Vista 327 residential units and 9,500 commercial square feet Platinum Gateway 320 residential units, 114,571 commercial square feet and 209,419 office square feet The Anaheim Regional Transportation Intermodal Center (ARTIC) serves as a hub for Orange County and the region, a landmark where freeways, major arterials, bus routes and Orange County s backbone rail transit system converge. The network of transit choices will continue to grow in the coming years as the number of Metrolink and Amtrak trains serving Anaheim and local and express bus routes increase. ARTIC services will include: Metrolink, Amtrak, OCTA buses, Anaheim Resort Transportation (ART) buses, shuttles, taxis, and tour and charter buses. ARTIC will also accommodate future plans for the East-West Connector (formerly the Anaheim Rapid Connection) and high-speed trains. ARTIC s mixed-use district location also supports dense development, with up to 4 million square feet of office/commercial/institutional development and 520 dwelling units. Based on City of Anaheim s Platinum Triangle: Development Status 2/21/2017 report, recently completed and future developments in the area are illustrated in Exhibit 3-14 and described in Exhibit

45 Draft Integrated Transportation & Capacity Building Plan Exhibit 3-14: Platinum Triangle : Development Status 2/21/ Map 41
46 Draft Integrated Transportation & Capacity Building Plan Project Exhibit 3-15: Platinum Triangle : Development Status 2/21/ Description Approved (not under construction) UnderConstruction Completed Dwelling Units Commercial Square Feet Office Square Feet Dwelling Units Commercial Square Feet Office Square Feet Dwelling Units Commercial Square Feet Office Square Feet Total 2, ,600 77,000 1, ,714 39, Stadium Lofts , Gateway Apartment Homes 3. Shops at Stadium Towers 4. Park Viridian Jefferson Platinum Triangle I & II Platinum Triangle 7. Anavia Anaheim Apartment Communities 9. Avalon Anaheim Stadium 10. A Town Metro 1,346 50, LT Platinum Center ,000 77, Jefferson Stadium Park 1,079 14, The George Platinum Vista , , Katella Grand Gateway Apartment Homes Phase II , The Canyon: Major planned developments in the Anaheim Canyon area include: The Kaiser Permanente Hospital Campus at 3400 East La Palma Avenue is a planned hospital campus to be constructed in three phases. Phase 1, which opened in 2009, includes 118,500 square feet of medical office space. Phase 2 consists of a 7-story parking structure, central utility plant, 260-bed hospital, and an 180,000 square foot Professional Office Building occupied in September Phase 3 consists of two additional medical office buildings, a 100-bed expansion of the hospital, and a 6-story parking structure with completion expected by The Crossing on East La Palma Avenue is a TOD consisting of 312 condo units and 39 live/work units. Pacificenter is located near the Anaheim Metrolink Canyon Station on the corner of Tustin Avenue and East La Palma Avenue. This development is a mixed-use project that includes plans to intensify the existing office/retail center to complement the expansion of the train station. 42

47 Draft Integrated Transportation & Capacity Building Plan Mountain Park will be developed in Gypsum Canyon, south of SR-91, east and west of SR-241. The development will result in 2,500 new homes, a fire station, an elementary school, and various community facilities. The Anaheim Resort : The Anaheim Resort includes Disneyland, the Anaheim Convention Center, The Shops at Anaheim GardenWalk, and a significant number of lodging establishments. Much of Anaheim s projected development density will occur in the resort area. Based on City of Anaheim s The Anaheim Resort : Development Status - Updated 5/10/2017 report, recently completed and future developments in the area are illustrated in Exhibit 3-16 and described in Exhibit Exhibit 3-16: The Anaheim Resort : Development Status - Updated 5/10/ Map 43
48 Draft Integrated Transportation & Capacity Building Plan Exhibit 3-17: The Anaheim Resort : Development Status - Updated 5/10/ Description NO. PROJECT DESCRIPTION LOCATION STATUS 1 Springhill Suites Marriott 120 room hotel 1160 West Ball Road Completed April Proposed Hotel 75 room hotel 1100 West Ball Road Conceptual Development Review application submitted 3 Staybridge Suites 126 room hotel 1050 West Ball Road Completed April Disney Harbor Cast Member Parking Lot 1,363 space employee parking lot 333 West Ball Road Completed August Disney Luxury Hotel 700 room luxury hotel with two restaurants and retail. 6 Disney Star Wars Themed Land Approximate 14 acre land within the existing Disneyland theme park 1401 Disneyland Drive 1313 South Harbor Boulevard Operating Covenant Agreement approved by City Council in July 2016; pending application of a Final Site Plan Anticipated Occupancy: 2021 Under Construction Anticipated Occupancy: Courtyard by Marriott 221 room hotel 1415 South Manchester Avenue 8 Holiday Inn Express 96 room hotel 1411 South Manchester Avenue Completed August 2015 Completed February Hilton Garden Inn/Home2 Suites by Hilton 210 room hotel with accessory retail space 1441 South Manchester Avenue Conceptual Development Review application submitted Anticipated Occupancy: Panera Bread Restaurant with outdoor patio in conjunction with an existing hotel 11 Disneyland Resort Eastern Gateway Parking structure, transportation hub, and bridge. 12 Park Vue Inn To demolish an 86 room hotel and 6,000 sq. ft. restaurant and construct a 180 room hotel, 10,654 sq. ft. restaurant/retail area 13 Grand Legacy at the Park Hotel remodel, including addition of 13 rooms 1480 South Harbor Boulevard 333 West Disney Way 1570 South Harbor Boulevard 1650 South Harbor Boulevard Completed December 2015 Application submitted Approved by Planning Commission in December 2015 Completed December Element Hotel 174 room hotel 200 West Alro Way Approved by Planning Commission January 2016 Under Construction Anticipated Occupancy: Country Inn and Suites 174 room hotel 1640 South Clementine Street Completed December Luxury Hotel 580 room hotel with meeting rooms, restaurants, retail and spa 1700 South Harbor Boulevard Approved by City Council in July 2016 Anticipated Occupancy:
49 Draft Integrated Transportation & Capacity Building Plan 17 GardenWalk Resort Hotel 400 room hotel 300 West Disney Way Plans to be submitted no later than June 30, 2019, per terms of Economic Assistance and Development Agreement 18 GardenWalk Westgate Timeshare 392 room timeshare hotel 500 West Disney Way Approved by Planning Director in July 2014; in plan check 19 GardenWalk JW Marriott 466 room hotel with meeting rooms, restaurant and spa 20 Cambria Suites 350 room hotel with 15,000 square feet of restaurant space 1775 South Clementine Street 1721 South Manchester Avenue Approved by Planning Commission in January 2016; in plan check Anticipated Occupancy: 2020 Approved by Planning Commission November 2016 Under Construction Anticipated Occupancy: The Anabella Hotel Redevelop 22 Anaheim t Convention Center Expansion 634 room luxury hotel with meeting rooms, restaurants and retail 1030 West Katella Avenue Approved by City Council in July 2016 Anticipated Occupancy: ,000 square foot expansion 800 West Katella Avenue Approved by Planning Commission in Sept Under construction Phase I (parking structure) completed Oct Phase II (meeting space) September Residence Inn Marriott 294 room hotel 640 West Katella Avenue Completed August Springhill Suites Marriott 172 room hotel, including CVS Pharmacy, Coffee Bean and Tea Leaf 1801 South Harbor Boulevard Completed February Hyatt House 252 room hotel, including Walgreen s Pharmacy 1800 South Harbor Boulevard Completed September Hampton Inn & Suites 178 room hotel 100 West Katella Avenue Application submitted Anticipated occupancy: Anaheim Convention Center Grand Plaza 28 Disney Toy Story Parking Lot Expansion 100,000 square feet of outdoor programmable convention center space Expansion of a temporary parking lot Terminus of Convention Center Way South Harbor Boulevard Completed in January 2013 Application submitted 29 Hyatt Place 178 room hotel 2035 South Harbor Boulevard 30 Homewood Suites 215 room hotel 2010 South Harbor Boulevard Completed in December 2014 Completed in November
50 Draft Integrated Transportation & Capacity Building Plan 3.7 Market Analysis Key Findings Key findings from the ART Market Analysis include: The Anaheim Resort is the focal point of the service area. Defined primarily by theme parks, major event attractions and destinations along Harbor Avenue and Katella Avenue, The Anaheim Resort is the key market area for ART service. Major destinations such as The Disneyland Resort, the Anaheim Convention Center, and The Shop at Anaheim GardenWalk are located within The Anaheim Resort. The majority of Anaheim hotels are also located within The Anaheim Resort, accommodating overnight Anaheim and Orange County visitors. Future growth within the existing ART service area will provide significant potential for demand. Major development is projected for the City of Anaheim in The Anaheim Resort and the Platinum Triangle. Implementation of the East-West Connector will provide a fast and direct connection between The Anaheim Resort and the Platinum Triangle. ARTIC will also compliment on-going plans for development within the City of Anaheim, encouraging more transit focused growth. Based on previous surveys and visitor profile data, nine percent of Anaheim visitors indicated they used bus or shuttle service as their primary mode of transportation while in Anaheim, and an additional nine percent indicated walking as their primary mode. There is a potential to increase overall ridership on the ART system by capturing visitors and employees who currently use vehicles to travel within The Anaheim Resort and the Platinum Triangle. Shifting short visitor and employee trips within The Anaheim Resort and the Platinum Triangle areas from private vehicles to transit will further support the City of Anaheim s economic development and environmental goals. Three percent of ART riders currently access the system via rail (ART On-Board Survey, 2011). This percentage is expected to increase with future High Speed Rail (HSR) and Metrolink Service Expansion Program (MSEP). The majority of visitors to Anaheim come from Southern California and accessed The Anaheim Resort via private vehicle on a day trip. Although these visitors have access to a vehicle throughout the day, there is potential for this market segment to use transit to travel within the service area. For instance, these visitors can use ART to connect from a sporting event to Disneyland Resort. Anaheim is the most popular city for accommodations among both Anaheim visitors and Orange County visitors. In general multi-day, overnight visitors spend significantly more than day visitors on a typical trip to Anaheim. The average day visitor to Anaheim spends approximately $64 per day while hotel guests spend approximately $151 per day and stay in Anaheim an average of 3.7 nights for a total of $553 spent per visitor over the length of a stay. 46
51 Draft Integrated Transportation & Capacity Building Plan The Anaheim Resort and the Platinum Triangle generate a significant number of work trips. There are nearly 40,000 daily work trips to The Anaheim Resort and the Platinum Triangle. About 15 percent of these trips originate within Anaheim. Disneyland Resort alone employs 31,000 employees, accounting for 18 percent of the workforce in the City of Anaheim. 47
 during the initial stages of the study. The Plan provided for the blueprint and guiding document for informing and engaging study stakeholders.")


52 Draft Integrated Transportation & Capacity Building Plan 4 STAKEHOLDER CONSULTATION Stakeholder outreach activities were conducted throughout the study based on the Public Involvement Plan (Appendix A) during the initial stages of the study. The Plan provided for the blueprint and guiding document for informing and engaging study stakeholders. The Plan supported public outreach and participation in the study by agencies, organizations, elected officials, residents, guests/visitors, businesses, and other stakeholders. The goal of the Plan was to provide meaningful opportunities for notification and involvement during the study. Successful execution of the Plan helped ART establish and maintain the trust, support and confidence of the public and other stakeholders throughout the study. The stakeholder outreach process focused on presenting information and collecting input from key stakeholders. A project Fact Sheet, prepared early in the study process, is presented at right. Key constituencies of the outreach included: Project Steering Committee; ART Board of Directors meetings including a number of meetings with an Executive Committee of the Board; and Stakeholder interviews. Early in the study process ART hosted a Mixer a forum of invited guests to introduce the study ART 2035 A plan to guide the future of ART services and present an ART sponsored project video. Each of the groups involved in the outreach effort made significant contributions to the study s outcome. The role and involvement of each group is summarized below. 48
53 Draft Integrated Transportation & Capacity Building Plan 4.1 Project Steering Committee Established at the beginning of the project, the steering committee consisted of the ART Executive Director and Curt Pringle and Associates. Three steering committee meetings were held. The committee was briefed and provided policy direction and feedback on major study components such as the governance alternatives and cost-allocation models. Input from the steering committee helped in positioning ART in going forward, again regarding governance and financial sustainability. 4.2 ART Board of Directors Multiple presentations were made to the ART Board at their regularly scheduled monthly meetings. Copies of select presentation material is provided in Appendix B. The presentations took place at key study stages including: market and service evaluation findings; governance alternatives; outreach findings/outcomes; cost-allocation models; service and administrative conceptual alternatives; and final study outcomes. Further, strategic development meetings were also held with the convening of meetings with select members of the Board (Executive Committee) to inform and solicit feedback specifically on governance alternatives and cost-allocation models. 4.3 Stakeholder Interviews Key stakeholders were identified and interviewed to provide insight into: (a) How do we best position ART (in a dynamic operating environment) to complement regional transportation services (current and future)? And (b) How might ART enhance the travel/mobility needs of guests, residents and employees? A copy of the Stakeholder Interview Guide and detailed meeting notes are provided in Appendix C. Stakeholder interviews took place with several dozen agencies/organizations including: Visit Anaheim Visit Anaheim Customer Advisory Board (Visit Anaheim) City of Garden Grove City of Orange City of Anaheim OCTA California High Speed Rail Authority John Wayne Airport Anaheim Angels Disneyland Resort Lennar West Anaheim Community Representative Southern California Regional Rail Authority (Metrolink) 49
54 Draft Integrated Transportation & Capacity Building Plan Common themes from the interviews included: General Operate a service that is easily understood need for a simple and easy to use guest transportation service Focus on the customer/guest experience Continue to focus and build upon the current market Opportunities for collaborative arrangements that might include discounted theme park tickets and joint marketing opportunities (packaging opportunities with the wholesale market of the hospitality industry) Branding or identity need for consistency and common messaging, too many wraps o Potential branding might include: The ART of Shopping, The ART of Dining, The ART of Entertainment Perception that dining and entertainment venues are not easy to access Technology Easy, mulit-modal intuitive app Dynamic information at kiosk Real-time customer information Infotainment Cashless fare payment Operations/Service Delivery First/last mile connections Complementary, not duplicative services (OCTA, East-West Connector, etc.) Service to other regional destinations (i.e., the beach, JWA) Integrated delivery framework broker other services (i.e., TNCs, ride-share, microtransit) On-demand and high frequency services An Uber-like bus with dynamic routing Route restructuring providing for a one-seat ride to alternate destinations. The Future Significant new development hospitality l, retail and residential o Building on the successes of The Anaheim Resort area, opportunities in Buena Park, Garden Grove and Costa Mesa o o Residential target a younger and more affluent market Employment hotels are employers, I think we need to include this fact 50
55 Draft Integrated Transportation & Capacity Building Plan Need to best understand future demand and new and emerging technologies Opportunity for one-stop/turn-key solutions one-call, one-click, brokering/mobility management o o Part of vacation planning Luggage concierge Integrated fare strategies We operate a 20 th century form of transportation and need to transition to the 21 st century 4.4 Outreach Summary The outreach process highlighted the need for ART to continue to focus on the customercentric experiences to capitalize on current and emerging technologies, to operate public transit service that is accessible and easy to use by individuals not familiar with the destination, and to develop a sustainable funding model for short- and long-term operations. The outreach process was significant in influencing study outcomes and the final Capacity Building Plan. 51
56 Draft Integrated Transportation & Capacity Building Plan 5.0 GOVERNANCE ATN, through the foundation created by the City of Anaheim s environmental mitigation process and in partnership with its entertainment and hospitality industries, has created an institutional structure to finance and operate local public transportation services, thereby providing customers with convenient access to the destinations and venues located in the city and nearby communities. This transit program has evolved over nearly 20 years in order to meet the growing demand on the transportation network through the growth of tourism industry, population and residential growth. The objective of this chapter is to identify potential institutional arrangements that could be adopted in order to deliver an expanded program of public transportation services to all demographic sectors of the traveling public, alike - visitors, convention attendees, employees and local residents. To this end, this chapter begins with a review of the history of the current arrangements for providing local transit services in Anaheim. This is followed by a discussion of four criteria for use by policymakers when evaluating alternative institutional options for an expanded transportation program. Next is a discussion of the relationship of any new public transit program to be developed and the organizational mechanisms that would be needed for their implementation. This is followed by an overview of possible alternative governance models is presented for consideration. Finally, within the context of governance, a discussion of opportunities for expanding the geographic reach of ART, is presented. 5.1 Historical Context Creation of the Anaheim Transportation Network The Anaheim Transportation Network (ATN) was created in 1995 to provide various public transportation services to the City of Anaheim, including managing a transportation demand management programs for large employers. This action was taken in part as a response to a trip reduction ordinance enacted by the South Coast Air Quality Management District. In addition, ATN was given a role in implementing certain mitigation monitoring measures called out in the Anaheim, Disneyland Resort, Hotel Circle and Platinum Triangle Resort Specific plans, which were designed to mitigate traffic congestion and air quality impacts of current and future developments. ATN responded to this obligation by purchasing and operating a fleet of clean air vehicles to serve the transportation needs of the city s commercial and recreational development areas. ATN was originally established as a public-private partnership and incorporated by the City and local business interests as a not-for-profit private 501(c)(4) corporation. 5 In 2002, 5 The IRS guidelines definition -- To be operated exclusively to promote social welfare, an organization must operate primarily to further the common good and general welfare of the people of the community (such as by bringing about civic betterment and social improvements). See Welfare-Organizations for additional information. 52
57 Draft Integrated Transportation & Capacity Building Plan at the City s request, ATN began operating the Anaheim Resort Transportation (ART) service. The relationship between ATN and the City regarding this service was formalized in 2004 at the time the City awarded a nonexclusive franchise agreement to ATN for operating the ART service in Anaheim. (This agreement was subsequently renewed in 2011, 2013, and 2014.) In 2006, the Federal Transit Administration (FTA) issued to ATN a National Transit Database ID number, thus making the organization eligible to receive federal funding for capital purchases. ATN eventually took advantage of this designation in 2010, when the FTA awarded the organization a $3.8 million grant toward the purchase of 20 new compressed natural gas (CNG) buses. By 2015, the ART service had doubled in size and ridership since its inception in Perhaps the most comprehensive explanation of the purpose of ATN, and its operating subsidiary ART, is found in the 2006 amendments to the organization s articles of incorporation where it is stated: The specific purpose of this corporation is to organize the collective actions of the public and private sectors to address the unique transportation and air quality issues of local employers, major event centers, and visitor-and convention-related businesses located throughout certain portions of the City of Anaheim, California known as the Anaheim Resort Area ( ARA ) and Stadium Business Center ( SBC ); to facilitate a forum for the corporation s members and other interested persons to work together to develop workable transportation solutions; and to provide leadership to maximize access, enhance mobility, and assist with regulatory compliance, including environmental mitigation measures, all for the benefit of the corporation s members and the public who are visitors to, or are employed within, the ARA, and the SBC. 6 The Anaheim Transportation Network (ATN) provides a menu of transportation services for the general public in the Orange County region. These programs include Anaheim Resort Transportation (ART), a network of 20 numbered routes that serve popular destinations within the Anaheim Resort Area. Our goal is to provide transportation programs and services to foster a positive environment for everyone who lives, works or visits the greater Anaheim area.the Anaheim Transportation Network (ATN) provides a menu of transportation services for the general public in the Orange County region. These programs include Anaheim Resort Transportation (ART), a network of 20 numbered routes that serve popular destinations within the Anaheim Resort Area. Our goal is to provide transportation programs and services to foster a positive environment for everyone who lives, works or visits the greater Anaheim area.the Anaheim Transportation Network (ATN) provides a menu of transportation services for the general public in the Orange County region. These programs include Anaheim Resort Transportation (ART), a network of 20 numbered routes that serve popular destinations within the Anaheim Resort Area. Our goal is to provide transportation programs and services to foster a positive environment for everyone who lives, works or visits the greater Anaheim area.the Anaheim Transportation Network (ATN) provides a menu of transportation services for the general public in the Orange County region. These programs include Anaheim Resort Transportation (ART), a network of 20 numbered 6 Anaheim Transportation Network, Resolution No , November 15,
58 Draft Integrated Transportation & Capacity Building Plan routes that serve popular destinations within the Anaheim Resort Area. Our goal is to provide transportation programs and services to foster a positive environment for everyone who lives, works or visits the greater Anaheim area. An additional public, in conjunction with a non-profit, feature of the ATN/ART operating environment is demonstrated by the funding sources developed for the support of ART services. Anaheim Tourism Improvement District In 2010, the City of Anaheim created the Anaheim Tourism Improvement District (ATID). The ATID is an assessment district; therefore, under California law all revenue derived from any fees imposed by the district are to be used exclusively for activities that benefit payees of the assessment. Assessment revenue is generated from a 2 percent fee levied on hotel/motel room rentals by all existing and future guest facilities located within the ATID. The management plan for the ATID describes the purpose of the district as follows: The purpose of forming the ATID as a Tourism Improvement District is to provide revenues to cover the costs of activities, improvements, services and programs that will benefit the Assessed Facilities and the tourism and convention industry in the City of Anaheim ("City"). The activities, improvements, services and programs to be provided and paid for by the ATID shall confer a special benefit to all Assessed Facilities. 7 The ordinance specifies that 75 percent of the assessment revenue be used to support the Visit Anaheim, and 25 percent is allocated to support transportation activities, including ATN/ART and any additional transportation programs/services, deemed important by the ATID Transportation Committee. Among the other important projects for which ATID funds are set aside was the Anaheim Rapid Connection (ARC) project that was recently transitioned to OCTA for further study, evaluation and consideration. Funds allocated to ARC, can now be allocated by ATID to other transportation projects for The Anaheim Resort. Transportation programs, improvements, and activities funded by ATID fee revenues include: Planning, design, construction and operation of transit improvements, including the "ARC," the inter city dedicated mass transit system linking the regional rail station to the various Assessed Facilities and collector points throughout the City; Transportation expenses, such as Anaheim Transportation Network for Assessed Facilities; Alternative transportation methods for Assessed Facilities; Pedestrian walkways and related improvements; 7 Anaheim Tourism Improvement District of 2010 Management Plan, Established under Anaheim City Ordinance 6174 Section , page 7. 54
59 Draft Integrated Transportation & Capacity Building Plan Other programs or activities which facilitate transportation to and within the Anaheim Resort Area and thus benefit the Assessed Facilities; and Debt service on and costs related to bonds, notes or certificates of participation issued by the City for any of the improvements set forth above. 8 At the end of any fiscal year, should there be any unexpended funds, they are rolled over into the next fiscal year to be expended for the authorized program purposes. In addition to the program expenditures, the funds may be used for administrative support costs, including the cost of administrating the ATID and related expenses. The ordinance establishing the ATID created a transportation committee to oversee the expenditure of fee revenues designated for transportation purposes. The three-member committee consists of one person appointed by the city manager, a representative of the largest fee payee, and a representative of a fee-paying establishment who is also a member of ATN s board of directors. Funding ATN/ART ATN s current funding opportunities are limited primarily to locally generated fees, fare revenues, and capital grants. A schedule of ATN revenue sources obtained from its Fiscal Year budget is listed below. Hotel & Retail Assessments Assessment Route 20 Pass/Ticket Sales Group Sales Ticket Vending Machine Leases Advertising Sales Rail Feeder Route Reimbursements Grant Funded Services (OCTA Measure M -- Project V & S) Transportation Demand Management Federal Apportionments ATID Service & Special Project Allocations Annual Memberships Tax Credits The majority of local revenue (about 65%) is derived from the Route 20 Assessment and from ticket sales (bus fares). In order to increase its services, as well as to maintain the existing level of services, the restructuring study suggests that the ATN Board of Directors investigate and evaluate new potential funding sources, including state and federal sources. 8 Anaheim Tourism Improvement District of 2010 Management Plan, Established under Anaheim City Ordinance 6174 Section , pages 7 and 8. 55
60 Draft Integrated Transportation & Capacity Building Plan 5.2 Framework for Assessing Institutional Arrangements Important goals for this study include working with stakeholders to determine future transportation needs, formulating an ideal menu of transportation services for the existing and proposed service areas, and developing an institutional structure capable of delivering services that meet the expectations of transit patrons and the sponsoring businesses. Therefore, the study s objective is to develop an organizational plan that is fundable, costeffective, and sustainable for providing transportation services to both residents and visitors for the next 20 years. Critical issues that must be addressed in order to achieve the study project s goals and objectives include evaluating new markets to be served and also transit service delivery alternatives. This memorandum addresses the institutional issues that may arise when assessing service delivery alternatives. This is accomplished in two ways. First, a framework is suggested for use in assessing alternative institutional arrangements for delivering transit services. Second, alternative service delivery options are proposed for consideration by ATN. 5.3 Criteria for Assessing Alternative Institutional Arrangements 1. Funding It goes without saying that adequate funding is the essential component for any successful transit program. Funds, however, are usually accompanied by terms and conditions that restrain their use. Under some conditions, funds may be allocated only for capital expenditures, sometimes funds may be restricted to maintenance and operations, and at other times funds may be used for either capital outlays or operations. Moreover, each category of funds will have its own criteria governing the expenditures. Typically, locally generated funds are the most flexible, especially local measure funds such as OCTA s Measure M. This is the case because the terms and conditions are imposed locally and consequently modification of these conditions is usually easier than amending state or federal laws or regulations. Measure M funds are used, when made available by OCTA, on specific community-based transportation services for a defined period of time. Another local funding source, which is used by ATN, is local assessment funding. With assessment programs, the specific conditions governing their use of revenue may also potentially be modified at the local level. Fare revenue collected from ART riders is also a local source, the use of which is not governed by externally imposed conditions. An additional local source of funding, the Transportation Development Act (TDA), a state authorized local sales tax program dedicated to transit, is a primary funding source for the Orange County Transportation Authority (OCTA). This tax generated $146.4 million in Orange County during Fiscal Year All funds collected in the county, except the funds generated in the city of Laguna Beach, are pooled into a single account for OCTA s 9 Source -- Table 21B, Annual Report State Board of Equalization. 56
61 Draft Integrated Transportation & Capacity Building Plan transit operations. (Laguna Beach was granted an exemption at the time OCTA was created.) Cap and Trade 10 : ATN is planning to look at this potential funding/revenue source. The California Air Resources Board Cap-and-Trade program provides for two transit programs: (1) Transit and Intercity Rail Capital Program; and (2) Low Carbon Transit Operations Program. The former providing for 10% of cap and trade auction proceeds (amounting to approximately $200M annually) and the Governor s Budget proposes to add almost $900 million more ($800 million from Greenhouse Gas Reduction Fund appropriations, and approximately $90 million from Public Transportation Account loan repayments). The Low Carbon transit Operations Program makes available 5% of cap and trade auction proceeds - $75M annually, for operating and capital assistance for transit agencies to reduce greenhouse gas emission and improve mobility, with a priority on serving disadvantaged communities. 2. Representation The composition of ATN s governing board is critical for conferring legitimacy to the policy decisions taken by the Board of Directors. To a degree, the type of transit service to be provided and the mix of funding sources available may influence or determine future board composition. If future service is expected to be a traditional public transit type service, obtaining funds from a variety of tax sources and removed from the tax base and constituency, the board should probably be broader based and representative all facets of the tax base and community. However, if in the future the transit service provided is a specialized service and funded from fees, i.e. de facto taxes, and other charges on land or businesses benefiting from the service, it is likely that the governing board should include among its membership representatives of the entities paying fees to the service. ATN s current governance structure reflects an agency governed by the constituency directly assessed for the services rendered and the organizations benefiting from the service. Should this study result in a different mix of services beyond the current arrangement, and increased service levels for those services currently extending beyond the City of Anaheim, a more diversified structure of representation on the board may be appropriate. 3. Management Structure The management structure of an agency should ideally be compatible with its arrangement for managing the delivery of services. This organizational structure would be in part determined by the amount of risk an organization desires to assume. For example, ATN could decide to assume the risks involved with being an operator of service that 10 Cap-and-trade is a market based regulation that is designed to reduce greenhouse gases (GHGs) from multiple sources. Cap-and-trade sets a firm limit or cap on GHGs and minimize the compliance costs of achieving AB 32 goals. The cap will decline approximately 3 percent each year which began in Trading creates incentives to reduce GHGs below allowable levels through investments in clean technologies. With a carbon market, a price on carbon is established for GHGs. Market forces spur technological innovation and investments in clean energy. 57
62 Draft Integrated Transportation & Capacity Building Plan entails vehicle ownership and management of drivers and mechanics. In that case, a complex organizational structure will be necessary, including an extensive human resources program. Traditionally, ATN has instead opted for contracting with a provider to operate and maintain the ART service and vehicles. If ATN, for example, determines to be a service broker or offer new services, such as concierge services, a new organizational structure would be recommended. 4. Adaptability Whatever organizational arrangement is selected for providing transportation services in the future, it should be adaptable to changing circumstances and opportunities. The structure of program funding, board representation, and management systems should be capable of responding to changes in consumer demand, the emergence of new services, technological improvements, and environmental requirements. This ability to adapt to market and consumer expectation is an important indicator of a successful institution. These four evaluation criteria may be viewed as a starting point for determining an optimum leadership and administrative arrangement. Of course, additional criteria may be identified during the course of this project in order to respond to the unique characteristics of ATN and its service community. 5.4 Institutional Arrangements and the Scope of Transportation Services Evaluating alternative institutional arrangements requires imagining the kind of transportation services that the market will demand in the near- and long-term future. Today, ATN/ART serves markets consisting of visitors to the destinations, business travelers, employees, and local residents. Segments of the market are shared with OCTA, a countywide, legislatively chartered transit operator. In addition, private shuttle and limousine services, regulated by the California Public Utilities Commission, operate in the local community. In recent times, new demand-responsive services offered by Uber and Lyft have become important alternative transportation service providers. ATN/ART, operating under a franchise granted by the City of Anaheim, provides services within the city and through contractual arrangements to Orange County s destinations in Buena Park, Santa Ana, Orange, Garden Grove and Costa Mesa. Today, ATN offers focused public transit services in a self-defined geographical area. There will always be a need for these services, but technology is opening up possibilities for new services. For example, ATN could expand its menu of services into being a mobility manager that provides personalized logistic services. Examples of this would be handling services outside of traditional public transit sphere to encompass passenger needs for their entire trip, brokering trips for individuals to ensure they obtain the most appropriate and cost-effective services, and offering first and last mile services. The continuing success of ATN/ART may depend on developing strategies for new services that can be delivered by a nimble, well-managed institution. As this study progresses and the menu of new services is defined, the choices made will influence the organizational design of ATN/ART. 58
63 Draft Integrated Transportation & Capacity Building Plan Although this report summarizes alternative institutional arrangements in the table below, endeavoring to define other possible services that ATN would like to provide to both residents and guests should be the first step in addressing ATN s future role. 5.5 Looking to the Future and Potential New Services Five models are described in the following table. As can be expected, each model has both advantages and disadvantages. Further, it may be necessary to create a model different from the five listed. However, as a general principle, the institutional model selected will require the role of ATN vis-à-vis the Orange County Transportation Authority to be carefully defined in order to avoid local conflict. The debate will likely revolve around the issue of markets to be served. The demographic market with its many unique requirements, in which ATN is well positioned, is more demanding than the conventional fixed-route service with its morning and evening commute peaks. As noted above, to serve and retain this demographic, it is important to identify the additional transportationrelated services that ATN envisions itself providing in the future before addressing the issue of developing further as a service delivery institution. Alternate governance models are presented in Exhibit
64 Draft Integrated Transportation & Capacity Building Plan Governance Model Exhibit 5-1. Alternative Governance Models Description How Created Opportunities Funding Constraints Private Nonprofit 501(c)(4) Current organizational model. Franchise agreement with City of Anaheim. Organized for the purpose of providing transportation services in Anaheim. Under IRS rules enjoys tax-exempt status and is permitted to lobby. As a general rule, donations (for example, membership fees) are not deductible. Some exceptions may apply. Tax advisor should be consulted. Formed as a Transportation Management Association specifically to facilitate transportation in Anaheim with a distinct focus on the creation of a cleanfuel shuttle system to serve the transportation needs of the Anaheim Resort. Also established in support of the Anaheim Resort Specific Plan to mitigate traffic congestion and air quality impacts. The City of Anaheim adopted an ordinance granting a nonexclusive franchise agreement with ATN. Public- Private Partnerships. Access to some federal funds. Operations restricted to service and environmental standards of franchise agreement. Requires approval of Anaheim City Council for amendments. Provide public transit services within constraints of a mutual benefit nonprofit organization. Joint Powers Agreements/Joint Powers Agency (JPA) Agreements between two or more existing local governments to create a new transit agency by jointly exercising the powers they each have to build or operate transit. A Local entities. Public agency funding opportunities. Standalone entity to develop policies and procedures. Limited to enabling powers of each jurisdiction. A JPA cannot create and maintain its own revenue stream (i.e., no taxing authority). 60
65 Draft Integrated Transportation & Capacity Building Plan Governance Model Description How Created Opportunities Funding Constraints JPA is legally a separate entity and can do whatever its constituent members are legislatively enabled to do. A JPA is set by Section 6502 of the California Government Code. Requires enabling state legislation to add additional powers. Municipal Transit System Single local government operator (city bus system) as one part of its municipal functions. Single local government. Public agency funding opportunities. Receives assistance from city government resources. City can use land-based financial strategies to increase funding opportunities (e.g., facilities districts and developer fees). Limited to service area of municipality unless have agreements with other jurisdictions to expand service. City management and council priorities can override transit initiatives. Transit Authority or District Such an organization can include representation from government and other parties including counties, municipalities, educational institutions, and private transit providers. Governmental units are guaranteed board positions; other Special act of state legislature. A transit authority or district is a fully stateenabled organization with the ability to locate and further develop dedicated funding sources (taxes, bonds) as well as develop its own policy. Community and political resistance to another government entity with taxing authority. Could be a competitor to local agencies for certain funding. 61
66 Draft Integrated Transportation & Capacity Building Plan Governance Model Description How Created Opportunities Funding Constraints stakeholders may be limited to ex officio positions. Private Nonprofit 501(c)(3) Exempt from federal income tax if its activities serve a specific purpose approved by the IRS. Under IRS rules, the organization may not lobby. Generally governed by a board of directors who are chosen to represent the area served by the agency, including local government officials in addition to private citizens. Set up by a government or a private sector entity as a 501(c)(3) corporation. Considerable freedom to make its own decisions without governmental interference and can more easily adapt services to market demands. Tailors funding decisions to needs of applicable groups, which could increase chances of award. Eligible for some public grant funds. To obtain grants ( 5307, , etc.), the agency must be willing to tailor services to the needs of applicable groups. Services could be limited to specific grant funding terms and conditions. 62
67 Draft Integrated Transportation & Capacity Building Plan 5.6 Opportunities for Expanding the Geographic Reach of ART In an analysis of the options available to the City of Anaheim to regulate the operations of passenger carriers within the City, it has been stated that Cities have broad authority to issue franchises for the privilege of providing vital public services to their citizens, including services utilizing public streets. The Anaheim city charter takes advantage of this grant of authority by establishing a process for executing franchises agreements between the city and the providers of basic services. ATN/ART is the beneficiary of Anaheim s authority. The Provision of Transit Services by Private Carriers Passenger stage corporations, such as an intercity bus service, provide fixed route service for an individual fare between an origin and destination. The statues governing passenger stage corporations places the California Public Utilities Commission (PUC) in a strong regulatory position. However, state law prohibits the PUC from regulating a passenger stage carrier where up to 98 percent of the total route miles are operated within a city. Anaheim has taken advantage of this provision by granting a non-exclusive franchise to an operator to provide the ATN/ART. A charter party carrier provides service on a prearrange basis, with the service being arranged by an individual or an agent. Dedicated shuttles to an airport, for example, provided by the operator of a hotel are exempt from the charter party provision. The charter party provisions do not apply to such service within a city or to public transit services. This is the basic institutional framework in which ATN/ART operates. Options for Expanding ATN/ART Services The ATN/ART stakeholders recognize that one-seat transportation opportunities to visit Orange County s destinations should be considered for implementation. Although it is unclear, the degree of flexibility that ART may have to break through the 98 percent criterion, it is useful to consider some institutional options that may prove to be workable and allow ART to expand its service area. Three alternatives are suggested for consideration. i. Contracting with ART It is not unusual for local governments in California to contract among themselves to share the benefits and costs of a specific service. Therefore, could a city adjacent to Anaheim contract with ATN/ART to provide services to provide public transportation services from Anaheim within its jurisdiction? We know that passenger stage corporations and charter party carriers are generally regulated by the PUC. Under these circumstances, ART may be redefined as one of the two classes of carriers because it providing transportation service outside of Anaheim. It is unclear how the PUC would react to this strategy and how it would affect ART s privileged relationship with Anaheim. This strategy may convert the ART into one of the two service organizations. ART may lose the advantage that it currently enjoys if it is converted to service delivery options overseen by the PUC. 63
68 Draft Integrated Transportation & Capacity Building Plan ii. Creation of Franchising Opportunity An alternative strategy is for a city adjacent to Anaheim to grant a non-exclusive franchise to ART for the operation of service within the city. The city would have to create a funding source, perhaps similar to Anaheim s. This is very different from the above option. The ART service would be operating under the provision allowing a city to provide service under a non-exclusive franchise agreement with an operator. There appears to be no prohibition for a city granting a franchise to an organization operating under a similar franchise granted by the adjacent city. Under this arrangement, ART, having been granted a franchise in an adjacent community, could operate service in both. Each city would pay for the miles and/or hours of service provided by ART in their respective communities. To the user, the service between the two communities would be seamless. The city would likely want to participate in the governance of the de facto integrated service. This must be dealt with carefully. If Anaheim and the adjacent city establish a joint governing board, that may give the appearance of a single operation. The PUC might rule that ART is a Passenger Stage Operator, introducing a regulatory regime that both communities would find unacceptable. iii. Legislative Option The last option would be to seek a legislative remedy (State legislation) to the constraints that ATN/ART find objectionable. Pursuance of such an option would require the role of ATN vis-à-vis the Orange County Transportation Authority (OCTA) to be carefully defined in order to avoid local conflict and the role of OCTA as the County Transportation Commission (CTC). Further, consideration of the markets to be served would need to be addressed. 64
69 Draft Integrated Transportation & Capacity Building Plan 6.0 Cost-Allocation Model As previously discussed, ART services are partially funded by an assessment of a charge ($.48 per night) on a per room basis assessed to mandated (mitigation requirement) hotel properties. The current hotel assessment accounts for an approximately $1.8m contribution to ART s total operating budget of $14.5m. The assessment charge was recently raised to $.55 per room per night for approximately $2.3m of the $15M operating budget. This chapter presents potential methods and a recommended approach for determining a pro-rata share (or fair share) financial contribution to assist with the costs of the ART transportation program. Initially, pro-rata share participation will apply to those entities who are required to do so as a mitigation measure. The approved cost-allocation model may be applied to other existing developments as well as future tenants, developers or program partners. It is important to develop a sustainable, fair and equitable method for allocating ART operating expenses among individual developments. 6.1 Cost Allocation The development of cost allocation options was undertaken within the following cost allocation principles or elements that were considered in the development of the options: Net cost funding model - deducts the value of all revenues generated by the ART transit system from the total capital, operating and administrative costs before calculating the annual payments for the funding partners. Total cost calculation to ensure sustainability through inclusion of: o o o Contract operating expenses Program management and allocated administrative expenses Marketing expenses Fair share distribution of net ART costs Fully scalable to allow for the possible future addition of funding partners, and for changes in the baseline data used to calculate annual partner allocations. 6.2 Funding Allocation Options Within a framework of the above noted funding allocation principles, two funding allocation options were initially developed for consideration: Option 1 Business Valuation; and Option 2 Trip Generation. Option 1 Business Valuation Cost distribution based on relative value of partners investments in properties. 65
70 Draft Integrated Transportation & Capacity Building Plan Equitable to the extent that ART transit services are an asset to conducting business in the Platinum Triangle and surrounding service area. ART costs are allocated in proportion to the business value or financial magnitude. Fair share basis is progressive ability/capacity of each development to absorb ART expenses as business overhead. Valuation measured using readily available third-party data. For example, City of Anaheim property tax assessment values. Pros & Cons Pros Option 1 Business Valuation Cons Equitable - costs are allocated in proportion to the business value or financial magnitude. Valuation measured using readily available third-party data. Assessed value may not reflect trips generated ART ridership or utilization. May be a deterrent for other potential partners. Relatively simple calculation. Easily scalable. For illustrative purposes, the following presents an example of the distribution of costs based on an assessed value. Anaheim Resort Transportation Transit Funding Allocation Formula Option 1 - Business Valuation Input Assumptions Year 1 Total Capital & Operating Cost $14,600,000 Year 1 Operating Revenue $1,000,000 Year 1 Net Total Cost $13,600,000 Property Assessed Valuation Percent of Assessed Valuation Annual Payment Year 1 Explanation Site A $10 6.7% $906,667 Property tax or business valuation Site B $ % $1,813,333 " Site C $ % $2,720,000 " Site D $ % $3,626,667 " Site E $ % $4,533,333 " Total Property Valuation $ % $13,600,000 FOR ILLUSTRATIVE PURPOSES 66
71 Draft Integrated Transportation & Capacity Building Plan Option 1 Business Valuation Formula Mechanics Step Action 1 2 Calculate projected net cost of ART service (Total cost minus fares and other revenues) Determine business valuation (assessment) values or other business valuation metric for each property 3 Calculate percentage of total valuation attributable to each property 4 Multiply percentages by the net cost of ART service to determine annual payment required of each funding partner Option 2 Trip Generation Cost distribution based on the daily number of vehicle trips precipitated by the properties. Equitable to the extent that ART services are intended as a congestion mitigation tool and ART costs are distributed in proportion to volume of traffic and potential congestion added to the Resort Area. Fair share basis is progressive contribution to mitigating adverse traffic impacts caused by developed properties. Metrics include trip generation rates published in the Institute of Transportation Engineers (ITE) Common Trip Generation Rates Trip Generation Manual, 9 th Edition. Pros & Cons o Rates are based on studies made to determine how many vehicles enter and exit a site devoted to a particular land use. Option 2 Trip Generation Pros Most closely tied to ART s intended objectives as a congestion mitigation tool. Equitable - costs are distributed in proportion to volume of traffic and potential congestion added to the Anaheim Resort Area. Cons Most laborious calculation. 67
72 Draft Integrated Transportation & Capacity Building Plan Fair share basis is progressive contribution to mitigating adverse traffic impacts caused by developed properties. Reflects range of land uses/development types. Easily scalable. For illustrative purposes, the following presents an example of the distribution of costs based on daily trip generation. Anaheim Resort Transportation Transit Funding Allocation Option 2 - Location based on Daily Trip Generation Year 1 Total Operating Cost Year 1 Operating Revenue Year 1 Net Total Cost Input Assumptions $14,600,000 $1,000,000 $13,600,000 Property / Development Type Rooms Event Space Square Footage Retail Square Footage Restaurant Seating Capacity Recreation / Entertainment (acres) Residential - Multiple Dwelling Unit ( >20 units/acre) Total Lodging - Hotel 1, , Lodging - Resort Hotel 2, , Site C , Site D , Site E , ,000 Total Development Units 3, ,000 1, ,000 Development unit of measurement Room 1,000 sq. ft. Seat Acre Dwelling Unit Trip generation rate * Resort Hotel only* Average Daily Trips Generated 46, ,940 50,000 30, ,480 Percent of Total Trips 34.0% 0.4% 6.6% 36.9% 22.1% 100% Distribution of Daily Trips Generated Site A 15, ,965 Site B 30, , ,931 Site C , ,896 Site D , ,528 Site E ,980 50,000 30,000 83,160 Total 46, ,940 50,000 30, ,480 Percentage of Daily Trips Generated Site A 11.32% 0.03% 0.44% 0.00% 0.00% 11.78% Site B 22.64% 0.05% 0.88% 0.00% 0.00% 23.57% Site C 0.00% 0.08% 1.32% 0.00% 0.00% 1.40% Site D 0.00% 0.11% 1.76% 0.00% 0.00% 1.87% Site E 0.00% 0.13% 2.20% 36.91% 22.14% 61.38% Total 33.95% 0.40% 6.60% 36.91% 22.14% % Annual Payment (Year 1) Site A $1,539,219 $3,614 $59,829 $0 $0 $1,602,661 Site B $3,078,437 $7,228 $119,658 $0 $0 $3,205,322 Site C $0 $10,841 $179,486 $0 $0 $190,328 Site D $0 $14,455 $239,315 $0 $0 $253,770 Site E $0 $18,069 $299,144 $5,019,191 $3,011,515 $8,347,919 Total $4,617,656 $54,207 $897,431 $5,019,191 $3,011,515 $13,600,000 Note * - Trip generation rates - sources (a) San Diego Municipal Land Development Code - Trip Generation Manual rev. May 2003; Table 1, pp 3-6.; and (b) Institute of Transportation Engineers (ITE) - Common Trip Generation Rates (Trip Generation Manual, 9th Edition) 68
73 Draft Integrated Transportation & Capacity Building Plan Option 2 Trip Generation Formula Mechanics Step 1 2 Action Calculate projected net cost of ART service (Total cost minus fares and other revenues) Calculate daily vehicle trips generated by each property using trip generation rates applied to the total numbers of hotel rooms, retail square footage, restaurant seats, or the number of residential units associated with each property. 3 Calculate percentage of total daily vehicle trips generated by each property 4 Multiply percentages by the net cost of shuttle service to determine annual payment required of each funding partner 6.3 Recommended Cost-Allocation Model Based on multiple working sessions with the Board, a sub-committee/executive Committee of the Board and the Project Steering Committee, there was unanimous consensus to advance the trip generation model. Agreement that the trip generation model best reflected the diversity of property development types and its utility in assessing monetary contributions to future developments resulted in the delivery of a fully populated, working cost-allocation model. Appendix D presents a visual of the populated model 69
74 Draft Integrated Transportation & Capacity Building Plan 7.0 Guiding Principles Setting the foundation for service strategies and recommendations for this Integrated Transportation and Capacity Building Plan, a framework of guiding principles was established. These principles reflect outcomes from the stakeholder consultation/ outreach efforts, market assessment, and service evaluation. Further, these principle build on the successes of ART in advancing service enhancements including grants for new service implementation. 7.1 Markets Served ART shall continue to concentrate on serving the participating hospitality properties, parking facilities, transportation hubs, and entertainment areas within The Anaheim Resort and Platinum Triangle areas as well as CtrCity Anaheim. The target audiences for this market are the visitors, residents, commuters and employees. In an effort to leverage other regional destinations, secondary markets include discretionary travel to and from neighboring cities and regional destinations including John Wayne Airport and the beach. 7.2 The Product / Service ART shall continue to deliver efficient and effective service to improve the overall customer experience. Recognizing the dynamic development and operating environment (including growth in The Anaheim Resort and the Platinum Triangle areas), ART should respond and adjust services accordingly. ART should provide a safe, easy-to-use, direct, and accessible service between lodging establishments, parking facilities, transportation hubs and major attractions of Orange County, CA. The agency should use technology such as Automatic Passenger Counter (APCs), Automatic Vehicle Locator (AVL), and scheduling to increase operational efficiency. Technology can also be used to enhance the customer experience by providing customers with real time bus arrival information through the use of Google Transit or smart phone applications. ART service should continue to complement current and future OCTA services and serve infrastructure improvements such as the East-West Connector, higher capacity services on Harbor Boulevard (Harbor Corridor Study) and ARTIC. 7.3 Financial Sustainability ART shall embrace the application of the recommended cost-allocation model (Chapter 6) for the fair-share distribution of net ART costs. ART will continue to generate revenue through ticket sales, advertising, and assessment fees through a highly effective network of routes together with a highly cost efficient operation of service. ATN should also secure long-term funding sources at a level that will support ART's operational and capital requirements. ATN can do this by developing 70
75 Draft Integrated Transportation & Capacity Building Plan and supporting a governance structure that could consider a wider range of funding sources. ATN current funding opportunities are limited to the locally generated fees and farebox recovery. Public funding that is available to the traditional public funding sources is not available to the ATN, outside of the 5307 formula funds. Therefore, in order to increase its services, as well as maintain existing level of services, ATN needs to investigate and strategically make decisions, under the governance umbrella, to look at other potential funding sources. 71
76 Draft Integrated Transportation & Capacity Building Plan 8.0 PLANNED IMPROVEMENTS SERVICE STRATEGIES The ART Integrated Transportation & Capacity Building Plan ART 2035 incorporates the analysis of the existing market conditions, service performance, and stakeholder feedback to develop a 20-year strategic vision for ART transit operations and service delivery. The recommendations are designed to promote cost effective, efficient service delivery while enhancing the customer experience. The plan is presented in three phases: nearterm ( ); route realignment to reflect the Eastern Gateway Project ( ); and post Harbor Blvd. and East-West Connector ( ). Working within the framework of ATN s mission and previously discussed guiding principles, underlining elements of the planned improvements to expand the scope and breadth of ART passenger transportation services, include: Focus core ART services in The Anaheim Resort area Mission Statement ATN s mission is to enhance transportation options by delivering reliable and efficient transportation solutions. Our commitment to customers consists of integrity, customer service, can-do spirit, communication and partnerships Collaborate with permitted transportation operators to deliver first-mile/last-mile services for Platinum Triangle employees commuting via rail and OCTA Provide high frequency daytime circulation within the Platinum Triangle 8.1 The Role of ART Reshape, with marginal expansion of the services provided directly by ART. Reallocate resources to improve service frequency on core routes operating within the study area to better serve short-distance trips in-and-around the resort area between venues, accommodations, restaurants and other destinations. Riding ART should be more closely associated with the Disneyesque experience -- not quite the monorail, but more than a bus service. ART and OCTA services should be clearly differentiated by purpose, function and design to avoid wasteful service duplication and institutional competition. Rebranding ART should be considered consistent with the service redesign and infrastructure upgrades. Future service objectives include: Simplify the core route network with fewer routes operating high frequency (10 minutes or better) schedules, minimal use of route variants. Provide a rubber-tire precursor of the East-West Connector (OC Streetcar) that will connect ARTIC to the Anaheim Convention Center via Katella Avenue, Clementine Street, Disney Way, and Harbor Boulevard. This will provide an early start establishing support travel patterns and promoting favorable land use choices in the corridor. The corridor also is served by OCTA Route 430, which provides six morning trips from ARTIC to Disneyland and five return trips in the evening, and Route 50 local in service 72
77 Draft Integrated Transportation & Capacity Building Plan along Katella Avenue. ATN should collaborate with OCTA to develop a coordinated service plan in the East-West Connector corridor. As travel demand/ridership warrants, increasing the frequency on ART routes operating low frequency (30 minutes or less), longer distance routes to regional shopping centers; including ART Lines 16 Orange, 18 Buena Park, 19 Santa Ana, and 22 Costa Mesa, and increase one-seat ride options between the study area and regional shopping centers such as the Outlets at Orange, Westfield Main Place in Santa Ana, and South Coast Plaza in Costa Mesa. o o o o Line 16 Orange provides hourly service between Disneyland Resort Main Transportation Center and the Outlets at Orange. Line 18 Buena Park provides hourly service during morning and evening hours between Disneyland Resort Main Transportation Center and selected destinations in Buena Park. Buses operate daily from 9:00 am until noon, and from 4:00 pm until 9:00 pm on hourly headways. No service is provided on this route between noon and 4:00 pm. The alignment follows I-5 and a one-way loop comprised of West La Palma Avenue, Beach Boulevard, Crescent Avenue, Brookhurst Street and Lincoln Avenue. Line 19 Santa Ana operates every two hours between Disneyland Resort Main Transportation Center and the Westfield Mainplace Mall in downtown Santa Ana. The alignment cuts across the OCTA local grid network via east-west on Katella Avenue, and north-south on Main Street and the I-5 Freeway. Line 22 Costa Mesa operates a limited schedule during evening hours between Disneyland Resort Main Transportation Center and South Coast Plaza in Costa Mesa. Buses operate a limited schedule focusing on the evening hours. ATN should work with permitted transportation service providers to improve market-based service between the study area and South Coast Plaza. ART, in collaboration with the City Costa Mesa was successful in an OCTA Project V grant application to increase the frequency (every 15 minutes) and expand the hours of service to existing Route 22. The service has various stops in Costa Mesa including the Sheraton park Hotel, Grand Plaza, Hilton Costa Mesa, Crowne Plaza, South Coast Plaza, and in Anaheim at ARTIC and Disneyland. Phase out onboard fare collection in favor of prepayment and off-board fare payment methods as may be feasible for ART to enhance customer convenience, reduce dwell times at bus stops, and eliminate the expense of daily revenue collection and processing. Capital investments should accompany the service plan. Future infrastructure objectives include: 73
78 Draft Integrated Transportation & Capacity Building Plan Transition ART s fleet to all zero-emission buses with next-generation design attributes e.g., low floor accessible; branded exterior design; larger doors and windows; perimeter seating; GPS, onboard video and audible messaging. Elevate the guest waiting experience at ART bus stops to the standards of the Resort brand. Examples of enhancements include expanded waiting areas, customized shelters, real-time bus arrival information, and interactive LED screens offering venue information, directions, and promotional messaging. 8.2 Partnering with OCTA and Metrolink Recognizing that OCTA and Metrolink are the public transit providers in the region, ATN should increase collaboration with these agencies to improve public transit lines in the study area. ATN s efforts could focus on the following service strategies: Encourage transit network improvements within the study area and connecting to key destinations including major employers, regional malls and Metrolink stations. Improve transit connectivity between the Anaheim Canyon Metrolink Station the study area including the Platinum Triangle and Disneyland Resort. 11 ART Line 17 / 21 operates limited peak period commuter shuttle service between Disneyland Resort Main Transportation Center and the Anaheim Canyon station that meets four morning and three afternoon trains. Develop a short-term plan to improve existing services along the planned Anaheim East-West Connector (streetcar) alignment. The plan would address the need to improve baseline bus services prior to converting to streetcar service in 2020 or thereafter. 8.3 The Role of Private Sector Providers Motor coach, shuttle, limousine and network-based demand responsive services permitted under California Public Utilities Commission (CPUC) regulation are plentiful in Orange County. Currently there are 87 active passenger transportation licenses based in the study area cities, and additionally 215 active licenses based in other Orange County cities; for a total of more than 300 active licenses. Additionally, the CPUC database lists 175 licenses that have either recently expired, been revoked or suspended; as well as 19 license applications that were denied. These data reflect a highly competitive environment and a diversity of providers that potentially could be benefit ATN s efforts to improve mobility options for Platinum Triangle area employees as well as resort guests. Possible market niches include: First mile-last mile services for Platinum Triangle commuters. Prevailing land uses in the Platinum Triangle present challenging conditions for employees looking for alternatives to commuting to work alone in a personal vehicle. Innovative new services are needed to address the distance between jobs in the Platinum Triangle and major transit nodes such as ARTIC, Anaheim Canyon Metrolink, 11 OCTA is reducing or eliminating rail feeder services. OCTA s Canyon service has been cut and Route 430 will be eliminated in October


79 Draft Integrated Transportation & Capacity Building Plan major OCTA bus lines and Disney s Main Transportation Center. ATN should consider service modes and technologies as may be applicable to study area conditions, and potential develop partnerships with private sector transportation providers to leverage the implementation of sustainable first mile/last mile services. Access to regional airports - John Wayne, LAX and other Southern California airports as determined by market conditions. Local shuttles between Anaheim and nearby cities in Orange County including Buena Park, Costa Mesa, Huntington Beach, Newport Beach and Santa Ana to access to entertainment and retail destinations. ATN is well positioned to provide financial incentives (e.g., revenue guarantee agreements) to CPUC-permitted carriers to provide market-driven services in the study area. Given the market supply of private sector-based transportation providers, ATN likely could stimulate competitive interest in providing particular services. 8.4 ATN as Mobility Manager In addition to its continuing role overseeing ART direct-operated services and efforts to leverage transit improvements and private sector transportation service initiatives in the study area, it is suggested that ATN further diversify as appropriate to market conditions to participate in commuter ridesharing, and pedestrian improvements within the study area. Examples of new initiatives include: Commuter Ridesharing. Carpooling and vanpooling are among the most costeffective commuter transportation alternatives, and recent variations such as UberPool, Lyft Line, and Sidecar Shared Ride potentially are applicable to workers based both in the Platinum Triangle and Disney Resort areas. Resort Guest Logistics. ATN should consider ways to improve concierge services available to guests with activities such as expedited registrations, luggage handling, ticket packages, transportation, and other services. Specifically, luggage handling or concierge services presents an opportunity for additional study and the prospect of developing a deployment plan. o Luggage handling or concierge services range from providing (a full service) door-to-door luggage shipping to and from a customer s destination (i.e., from home to hotel room) to partial handling such as Disney s Magical Express (motorcoach service from the airport to Disney Resort hotels) at Orlando International Airport. In this latter example, Magical Express provides complementary luggage delivery service - luggage is retrieved at the airport by Magical Express staff and delivered within 3 hours of a guest s arrival at select Disney Resort hotels. 75
80 Draft Integrated Transportation & Capacity Building Plan 8.5 Service Delivery Phased Deployment The plan is presented in three phases: near-term ( ); route realignment to reflect the Eastern Gateway Project ( ); and post Harbor Blvd. and East-West Connector ( ) Years Building on the future service objectives (previously presented in Section 8.1 The Role of ART), the following are service delivery enhancements for the years 2017/2018: 1. Project V initiatives OCTA s Community-Based Transit/Circulator Program (Project V) is a competitive program under Measure M2 that provides funding to develop and implement local bus transit services, such as community-based circulators, shuttles, and bus trolleys that complement regional bus and rail services and meet local needs in areas not adequately served by regional transit. ART, in collaboration with the Cities of Anaheim and Costa Mesa was successful in two Project V grant applications: a) Anaheim ARTIC-CtrCity Local Community Circulator. Providing for a one-seat ride connecting ARTIC to Downtown Anaheim. This service will provide connections at ARTIC, Medical Centers, Anaheim City Hall, St. Joseph Heritage Medical, L3- Interstate Electronics Corporation, Disney Travel, Disney College Internship Program, Anaheim Packing House, Platinum Triangle, Senior Centers, and stadium crossing. The service will operate Monday through Friday during commute hours and occasionally on Fridays and Saturdays to serve evening events. The routing is presented in Exhibit


81 Draft Integrated Transportation & Capacity Building Plan Exhibit 8-1: ARTIC CtrCity Anaheim Connector 77

82 Draft Integrated Transportation & Capacity Building Plan b) Costa Mesa Inter-City Service (Rt.22). To increase the frequency (every 15 minutes) and expand the hours of service to existing Route 22. This route connects the City of Costa Mesa to the City of Anaheim Resort Area. The service has various stops in Costa Mesa including the Sheraton park Hotel, Grand Plaza, Hilton Costa Mesa, Crowne Plaza, South Coast Plaza, and in Anaheim at ARTIC and Disneyland. The routing is illustrated in Exhibit 8-2. Exhibit 8-2: Costa Mesa Inter-City Service (Route 22) 78

83 Draft Integrated Transportation & Capacity Building Plan 2. Provision of rubber-tire precursor to East-West Connector Providing for an early start precursor to the proposed East-West Connector service on Katella Avenue/Harbor Blvd. (Exhibit 8-2) to establish travel patterns and promote favorable land use choices in the corridor. Exhibit 8-3: East-West Connector Alignment 3. Anaheim CtrCity Microtransit Anaheim Transportation Network (ATN) and the City of Anaheim s Community Development Department share an interest in creating a microtransit service for CtrCity Anaheim. This objective is consistent with the growing awareness that access to, and individual mobility within the CtrCity area are keys to Anaheim s continued economic prosperity. Further, current and future developments create untenable parking challenges, traffic congestion and an adverse effect on air quality. Sustainable mobility solutions will assist in addressing these challenges. 79

84 Draft Integrated Transportation & Capacity Building Plan Microtransit refers to mostly technology-oriented companies participating in the provision of local passenger transportation services. Microtransit is significant because it represents the first indication of private sector interest in providing transit service since the late 1950s. The industry is still emerging as most microtransit services have been operating for less than five years. It is experiencing rapid growth in communities where offering a full range of transportation services, including conventional fixed route transit, taxicabs and other ride hailing services, car sharing, bike sharing, car and vanpooling, pedestrian facilities and parking. CtrCity is roughly delineated by a 0.5-mile diameter circle centering on the intersection of S Clementine Street and Center Street Promenade. The area is walkable with sidewalks, intersection crosswalks and traffic controls, and pedestrian amenities. Current trip generators in CtrCity include: Central Library City Hall complex Downtown Community Center Farmers Park Muzeo Museum and Cultural Center Packing District Rinks Anaheim Ice Arena Senior Center Town Square Shopping Center Brewery District / Leisuretown Completed under separate cover the Anaheim CtrCity Microtransit Conceptual Plan included preliminary ridership estimates for the implementation of a CtrCity microtransit service. Within a prescribed level of service, estimates suggest initial ridership of 8 to 10 riders per hour within the first twelve months of operation and 12 to 15 riders per hour within twenty-four months of operation. The first year of operation may result in approximately 57,600 trips. To advance an Anaheim CtrCity Microtransit pilot or demonstration service, ATN should consider conducting detailed service planning and prepare a procurement document for a third-party operating company. 80
85 Draft Integrated Transportation & Capacity Building Plan Years Restructuring to reflect Eastern Gateway Project The Eastern Gateway is a proposed Disneyland Resort parking structure, pedestrian bridge, pedestrian pathway, transit hub and security screening area on the east side of Harbor Boulevard at Disney Way. Initial plans were submitted to the city of Anaheim Planning Department in summer and fall ART routes will be restructured to reflect the opening of the Eastern Gateway s transit hub. 2. Build/Expand Supplemental Services An Integrated Delivery Framework ART is looking to provide service to additional regional destinations, offering one-seat rides for greater convenience. Additional destinations served by demand-responsive service and partnerships with the private sector will enhance transportation options. ART will consider first/last mile connections and partnerships with other transit services to improve convenience for the traveling public. ART is currently advancing the building of supplemental services and is targeting to have a Request for Qualifications (RFQ) available by late summer The RFQ process is intended to gauge interest of microtransit, rideshare/tncs and other demand-response service providers in partnering for the provision of demand-response supplemental transit/mobility services. In authoring the RFQ document, it is envisioned to include specifics regarding expectations of prospective partners; preliminary service and operational planning addressing anticipated areas of service, levels of service, operating parameters, technology platforms and applications; etc. 81
86 Draft Integrated Transportation & Capacity Building Plan In its role as a Mobility Manager, it is intended that ART/ATN would broker the supplemental transit/mobility services Years Post Harbor Blvd. and East-West Connector With the implementation of highcapacity services on Harbor Blvd. and the East-West Connector (Katella Ave.), the following are recommended changes to the ART route structure. The post Harbor Blvd. and East-West Connector route structure is illustrated in Exhibit


87 Draft Integrated Transportation & Capacity Building Plan Exhibit 8-4: ART Route Structure Post Harbor Blvd. and East-West Connector ART Route Changes a) To be Replaced with Harbor Blvd. & East-West Connector Services o Routes 1 & 2 Harbor Blvd. o Routes 3, 4 & 5 Grand Plaza Line (via Harbor Blvd. & Convention Way) o Route 15 ARTIC Sports Complex 83
 RV Park served by realignment of Rt. 10 o Route 10 Anaheim Blvd.")
88 Draft Integrated Transportation & Capacity Building Plan b) Modify / Realignment o Route 6 Eliminate portion on Anaheim Blvd. (north of Disney Way) RV Park served by realignment of Rt. 10 o Route 10 Anaheim Blvd. realignment 84


89 Draft Integrated Transportation & Capacity Building Plan o Route 12 Eliminate portion on Katella between Clementine & Harbor. New north on Clementine, west of Disney Way o Route 14 Eliminate east of State College (to ARTIC) 85
 Alternate Delivery Scheme TNCs / Microstransit o Route 19 Extension of Canyon Line (60 min. frequency) o Route 19 Santa Ana Line (120 min.")
90 Draft Integrated Transportation & Capacity Building Plan o Route 16 Short-turn at Garden Grove Blvd. & City Dr. and eliminate Harbor Blvd. leg. c) Alternate Delivery Scheme TNCs / Microstransit o Route 19 Extension of Canyon Line (60 min. frequency) o Route 19 Santa Ana Line (120 min. frequency) o Route 22 Costa Mesa/South Coast Plaza (Project V increased frequency) d) Unchanged o Routes 7 & 8 Hotel Circle - Serves outside of ¾ mile of East-West Connector stops o Route 9 Katella (W. of Harbor) One-seat ride to Resort o Route 17 AM/PM service 6-year funding agreement (OCTA) to 2021/22 o Route 18 Buena Park Line (via W. La Palma Ave.) A summary of pre and post Harbor Blvd. and East-West Connector route restructuring is presented in Exhibit
91 Draft Integrated Transportation & Capacity Building Plan Exhibit 8-5: ART Route Restructuring Pre and Post Harbor Blvd. and East-West Connector Frequency (# of min.) Pre Harbor/East West Connector Post Harbor/East West Connector Alignment 1 & 2 20 Harbor Blvd. Line Discontinue Grand Plaza Line via Harbor Blvd. & Convention Way 3, 4 & 5 20 Discontinue Simplify. Rebrand. Consolidate. Increase frequency. 6, 7 & 8 20 Hotel Circle Clemintine Line (via Clementine St.) [6 to RV Park] Rts. 7 & 8 Remain unchanged. Serves sites outside 1/4 mile of ARC stops. Rt. 6 Eliminate portion on Anaheim Blvd. (north of Disney Way) RV Park will be served by realignment of Rt Katella Line Unchanged. One seat ride to Resort Downtown Packing District Line (via Harbor Blvd. & Anaheim Blvd.) Anaheim Blvd. realignment Downtown & Packing House south to Disney Way, west to (relocated) Disney Transportation Center. Eliminate Harbor Blvd. (Express bus/streetcar alignment) Ball Road Line Unchanged. One seat ride to Resort Manchester Ave. (via Disney Way) Realignment Eliminate portion on Katella between Clementine & Harbor. New: North on Clementine, West on Disney Way to Transportation Center. 14 & ARTIC Sports Complex Line (E/W Katella & Chapman) Rt. 14 Unchanged. One seat ride to Resort. Rt.15 Discontinue (East West Connector ARTIC to Resort) Orange Line (via Chapman Ave.) Harbor, City Dr., Garden Grove Blvd. Short turn bus at Best Western (Garden Grove Blvd. & City Dr.) HI Express served by Harbor Blvd.) Eliminate Harbor Blvd. leg of Rt Canyon Line (via E. La Palma) Maintain AM & PM Peak service. [6 year funding agreement (OCTA) to 2021/22] Buena Park Line (via W.LaPalma Ave.) Maintain Cresent Ave./Lincoln Ave. alignment. Explore franchise agreement with Buena Park Extension of Canyon Line Review/monitor ridership. TNCs on demand service Santa Ana Line (via I 5 & Main St.) Review/monitor ridership. TNCs on demand service Toy Story Maintain (permits to 2024). Drop off at current Transportation Center (not relocating to new Disney Transportation Center) 22 Costa Mesa/South Coast Plaza Line. Project V increased frequency Alternate delivery scheme. Coordinate with SC Plaza. Opportunity for TNC in Provision of demand response service requiring (night before) advance reservation. new ARTIC/CtrCity Anaheim Circulator Project V 2017 implementation On going monitoring of ridership. Determination of sustainability. 87
92 Draft Integrated Transportation & Capacity Building Plan 8.6 Technology A Way Forward The ATN ridership comprised of both commuters and discretionary travelers, is growing and more connected than ever to their mobile devices. Throughout the duration of this study, several technology enhancements had been discussed. Since November 2015, ATN had been developing a vision for the implementation of Mobility on Demand transportation concepts to enhance the customer experience. In March 2017 ATN secured full funding from the Anaheim Tourism Improvement District (ATID) Transportation Committee for the procurement of a real-time passenger information system. ATN is advancing the first phase of a Mobility on Demand system to include InfoTainment systems and the installation of real-time passenger signs. InfoTainment video display system on board all ART buses to provide transportation and destination related information (via on-board WiFi). ibeacon technology is included with the installation to track ridership and, at a later date, push content. The InfoTainment system will also generate advertising revenue. Real-time signage installation to begin in early Installations will include signs at 25 ART bus stop locations and at the Anaheim Convention Center Grand Plaza. Initial information will include real-time bus arrivals. Future functionality may include multi-modal trip planning options. The above noted two initiatives (first phase of Mobility on Demand elements) is envisioned as a foundation for all future mobile and on-demand real-time passenger applications for ART, including: Third party applications that may include the ability of users to search for and purchase rides from local transit agencies (ART, OCTA, Metrolink, etc.), multiple on-demand providers (Lyft, Uber, taxi) and private transportation providers (Megabus, SuperShuttle, etc.) On demand and service deviations / e-hailing Real-time transit information and trip planning Mobile ticketing Future functionality and interoperability (that may include Wallet, luggage concierge, links with on-line booking engines to allow trip planning on a pre-arrival basis, etc.) Year 2035 Horizon - Autonomous Vehicles: A vehicle that is capable of sensing its environment and navigating without human input (also called self-driving, driverless or robotic). The Victoria Transport Policy Institute s Autonomous Vehicle Implementation Predictions: Implications for Transport Planning report explores the impacts that autonomous vehicles are likely to have on travel demands and transportation planning. It discusses autonomous vehicle benefits and costs, predicts their likely development and implementation based on 88

93 Draft Integrated Transportation & Capacity Building Plan -0 mexperience with previous vehicle technologies, and explores how they will affect planning decisions such as optimal road, parking and public transit supply. The analysis indicates that some benefits, such as independent mobility for affluent nondrivers, may begin in the 2020s or 2030s, but most impacts, including reduced traffic and parking congestion (and therefore road and parking facility supply requirements), independent mobility for low-income people (and therefore reduced need to subsidize transit), increased safety, energy conservation and pollution reductions, will only be significant when autonomous vehicles become common and affordable, probably in the 2040s to 2060s, and some benefits may require prohibiting human-driven vehicles on certain roadways, which could take longer. Notwithstanding the predictions of several decades out for the nation s roads to be fully autonomous, examples of current testing of autonomous transit (and shuttle) buses are common throughout the nation (as well as Europe and Asia). There is an opportunity for ART to position itself as a future test site for autonomous vehicles that might include select ART routes, microtransit applications (in Anaheim CtrCity, for example) and/or as an adjunct to supplemental rideshare/e-hailing services. 89
94 Draft Integrated Transportation & Capacity Building Plan 9.0 FINANCIAL PLAN Exhibit 9-1, ART Financial Summary, summarizes the financial projections for This financial summary builds on a previously prepared summary prepared by ART staff which had provided for projections to FY2024. Figures presented in Exhibit 9-1 extrapolates to FY2027. Based on the preferred operating scenario and assumed East-West Connector and Harbor Boulevard higher capacity transit services (in year 2025), financial projections provides order of magnitude and reflect ART operating costs, generated revenues, capital costs, and funding. Financial projections were based on projected service levels. Service levels are projected to be relatively stable from decreasing by nearly 18.3 percent when East-West Connector and Harbor Boulevard higher capacity transit services begins and the ART service network is reconfigured. Marginal increases in ridership reflect the future deployment of complementary microtransit and the brokering rideshare services. ART revenues combined with an annual operating reserve may be bolstered in future years with the implementation of the cost-allocation model applied to future developments. ART s capital program is largely funded through federal grant funds. Although shown on an annualized basis, the capital program can be streamed to coincide with the availability of grant funds and available local match. In addition, as with the operating funding, ART s capital program should be coordinated with and provisions made in conjunction with the development of the East-West Connector service. Direct Operating Costs: Line items contributing to direct operating costs include bus leasing, bus maintenance, fuel supplies and transportation expenses. Generated Operating Revenue: The majority of ART revenues are generated through hotel and retail assessment fees, route assessment fees, ticket sales, and advertising. Again, revenues were provided by ART and projected annually for ten years until fiscal year Capital Cost: Capital costs consisted of vehicle replacement and expansion, associated technology and equipment upgrades, and new operating/maintenance facility costs. 90
95 Draft Integrated Transportation & Capacity Building Plan Exhibit 9-1: ART Financial Summary East West Connector Service Launches (& Harbor Blvd.) Summary FY2017 Year 1 FY2018 Year 2 FY2019 Year 3 FY2020 Year 4 FY2021 Year 5 FY2022 Year 6 FY2023 Year 7 FY2024 Year 8 FY2025 Year 9 FY2026 Year 10 FY2027 Service Statistics Revenue Hours 245, , , , , , , , , , ,800 Revenue Miles 1,477,000 1,477,000 1,477,000 1,477,000 1,477,000 1,477,000 1,477,000 1,477,000 1,167,000 1,167,000 1,167,000 Passengers 9,109,000 9,109,000 9,200,090 9,292,090 9,385,010 9,478,860 9,573,650 9,669,390 8,093,280 8,174,210 8,255,955 Revenues Ticket Sales $ 4,974,668 $ 5,123,908 $ 5,262,604 $ 5,262,604 $ 5,262,604 $ 5,262,604 $ 5,262,604 $ 5,262,604 $ 5,262,604 $ 5,262,604 $ 5,262,604 Hotel Assessment $ 1,901,703 $ 2,005,849 $ 2,005,849 $ 2,005,849 $ 2,005,849 $ 2,005,849 $ 2,005,849 $ 2,005,849 $ 2,005,849 $ 2,005,849 $ 2,005,849 Route 20 Passenger Fare Payment Substitution $ 6,442,928 $ 6,636,216 $ 6,768,940 $ 6,768,940 $ 6,768,940 $ 6,768,940 $ 6,768,940 $ 6,768,940 $ 6,768,940 $ 6,768,940 $ 6,768,940 Other (including additional development assessment) $ 2,596,160 $ 2,658,058 $ 2,755,213 $ 2,820,881 $ 2,888,518 $ 2,958,185 $ 3,265,106 $ 3,765,429 $ 3,765,429 $ 3,765,429 $ 3,765,429 Total Operating Revenues $ 15,915,460 $ 16,424,032 $ 16,792,607 $ 16,858,274 $ 16,925,912 $ 16,995,578 $ 17,302,499 $ 17,802,822 $ 17,802,822 $ 17,802,822 $ 17,802,822 Total Operating Expenses Total Operating Expenses $14,842,778 $15,184,063 $15,554,349 $15,952,269 $16,376,761 $16,827,026 $17,302,499 $17,802,822 $15,554,349 $15,952,269 $16,376,761 Operating Expense/Revenue Summary Net Operating Revenue $1,072,683 $1,239,969 $1,238,258 $906,005 $549,151 $168,553 $0 $0 $2,248,473 $1,850,553 $1,426,062 Annual Reserve $445,283 $455,522 $466,630 $0 $0 $168,553 $0 $0 $466,630 $478,568 $491,303 Net Operating Revenue After Reserve $627,399 $784,447 $771,627 $906,005 $549,151 $0 $0 $0 $1,781,843 $1,371,985 $934,759 Accumulated Carryover $2,138,127 $3,378,096 $4,616,353 $5,522,358 $6,071,509 $6,240,062 $6,240,062 $2,138,127 $4,386,600 $6,237,153 $7,663,215 Capital Expenses Total Capital Expenses $ 17,505 $ $ $ 2,493,708 $ 19,702 $ 20,293 $ 7,741,571 $ $ Capital Funding ATN Capital Funding Local Funding Federal Funding (5307) $ 550,000 $ 550,000 $ 550,000 $ 550,000 $ 550,000 $ 550,000 $ 550,000 $ 550,000 $ 550,000 $ 550,000 $ 550,000 Capital Carryover $ 550,000 $ 1,100,000 $ 550,000 $ 1,100,000 $ 550,000 $ 1,100,000 $ 550,000 $ 1,100,000 Total Capital Funding $ 1,100,000 $ 1,650,000 $ 550,000 $ 1,100,000 $ 1,650,000 $ 550,000 $ 1,100,000 $ 1,650,000 $ 550,000 $ 1,100,000 $ 1,650,000 Capital Summary Overall Net $3,220,622 $5,028,096 $5,166,353 $4,128,650 $7,701,807 $6,769,769 ($401,509) $3,788,127 $4,936,600 $7,337,153 $9,313,215 91
96 Integrated Transportation & Capacity Building Plan Appendix A: Public Involvement Plan


97 ANAHEIM RESORT TRANSPORTATION INTEGRATED TRANSPORTATION AND CAPACITY BUILDING PLAN PUBLIC INVOLVEMENT PLAN Submitted By: IBI Group & Arellano Associates DRAFT FOR DISCUSSION JULY 2015
98 ANAHEIM RESORT TRANSPORTATION Integrated Transportation and Capacity Building Plan PUBLIC INVOLVEMENT PLAN TABLE OF CONTENTS Public Involvement Management Team... 2 Internal & External Communication Processes... 2 Overview - Public Involvement Plan... 3 Public Involvement Plan/Study Initiation and Administration... 4 Stakeholder List... 4 Collateral Material Development... 6 Survey Intercepts... 6 Social Media... 7 Stakeholder Meetings... 8 Stakeholder Meetings One-on-One... 9 ATN Board Updates The IBI Group with support from Arellano Associates (IBI team or IBI) proposes the following Public Involvement Plan (Plan) to support the preparation of the Anaheim Resort Transportation s Integrated Transportation and Capacity Building Plan (Study). This document addresses the requirements of the Public Involvement Plan referenced in the scope of work. IBI will proceed with direction from the Anaheim Resort Transportation (ART) to inform and engage stakeholders about the Study. This Plan is a written explanation of the outreach activities planned from June 2015 through May 2016 (approximately 12 months). This Plan will be the blueprint and guiding document for informing and engaging Study stakeholders. The Plan supports public outreach and participation in the Study by agencies, organizations, elected officials, residents, guests/visitors, businesses, and other stakeholders. The goal of the Plan is to provide meaningful opportunities for notification and involvement during the Study. Successful execution of the Plan will help ART establish and maintain the trust, support and confidence of the public and other stakeholders throughout the Study. This Plan document presents a discussion on the approach, the rationale, deliverables and initial thoughts on target markets and/or participants. The latter will be refined throughout the study process with input from the ART project management team. IBI GROUP A PROFESSIONAL PRACTICE 1 DRAFT FOR DISCUSSION
99 ANAHEIM RESORT TRANSPORTATION Integrated Transportation and Capacity Building Plan PUBLIC INVOLVEMENT PLAN Public Involvement Management Team The following chart provides contact information for the Study team implementing the public outreach task items. Name Title Agency Phone Diana Kotler Steve Schibuola Steve Wilks Executive Director Principal-in- Charge Project Manager ART (714) IBI Group (949) IBI Group (949) Laura Muna- Landa Public Outreach Manager Arellano Associates LMuna- (909) Maria Yanez- Forgash Outreach Coordinator Arellano Associates MYanez- (909) Tom van der List Project Support Arellano Associates (909) Internal & External Communication Processes Internal communication between ART and the IBI team is designed to follow established protocols of each entity. Informal communication among all parties is encouraged. However, such communication will be made with the knowledge of those in charge of the formal lines of communication. Primary points of contact will be Steve Wilks and Laura Muna-Landa for the IBI team and Diana Kotler for ART. Discussion regarding decisions as to direction, attendees / participants or other items of consequence shall be followed-up with written/ confirmation. External communication also will follow established protocol. While the Study outreach team will likely receive communication from the public, any responses outside of approved messages will be cleared with ART in advance. ART will be the point of contact for all collateral communications materials. IBI GROUP A PROFESSIONAL PRACTICE 2 DRAFT FOR DISCUSSION
100 ANAHEIM RESORT TRANSPORTATION Integrated Transportation and Capacity Building Plan PUBLIC INVOLVEMENT PLAN Overview - Public Involvement Plan Activity Schedule/ Date Participants Comments Finalize Public Involvement Plan July 2015 IBI/ART Project Management team Recognize Plan will be a live document Stakeholder List July 2015 IBI team / ART staff AA will build the stakeholder list based on provided lists from ART Preparation of Collateral Materials August 2015 IBI team AA will draft fact sheet. E-blast meeting notices prior to meetings Survey Intercepts August or December 2015 IBI team TBD exploring prospect of administering late August (2015) or December (2015) busy tourist/visitor times Social Media Begin August 2015 IBI team AA will start in August and implement for duration of the project Stakeholder Meetings Kick-Off Stakeholder Mtg. Stakeholder Planning Mtgs. One-on-One Mtgs. August 2015 Fall IBI team / ART staff IBI team / ART staff meeting with key stakeholders in each of the areas identified including major uses/businesses, key stakeholders in the vicinity. Those with considerable knowledge of area will be invited to participate. Key stakeholders (identified by IBI team / ART) Introduce the project to key stakeholders Three meetings in the following areas to engage stakeholders: - The Anaheim Resort Area - Platinum Triangle and ARTIC - City of Anaheim-Downtown Area Select number of one-on-one mtgs to include 1 : OCTA 1 To be an iterative process. IBI GROUP A PROFESSIONAL PRACTICE 3 DRAFT FOR DISCUSSION
101 ANAHEIM RESORT TRANSPORTATION Integrated Transportation and Capacity Building Plan PUBLIC INVOLVEMENT PLAN Activity Schedule/ Date Participants Comments Individual Board members Developers (possibly C J Segerstrom & Sons (South Coast), Simon Property Group, Lab Holding (Center Street & Packing District), Westfield, DJM Capital Partners (HB), LT Global Investments, Brookfield, etc.) Others? ATN Board of Directors working sessions & project updates Ongoing IBI Group / ART staff ATN Board of Directors will be provided project updates at regular intervals (board meetings); as needed working sessions will be scheduled. Public Involvement Plan/Study Initiation and Administration Subsequent to the project kick-off meeting on June 10, 2015, the IBI team will participate with ART in a subsequent meeting to discuss the specifics of the Public Involvement Plan in general and initial thoughts on key stakeholders specifically. This Plan will outline specific tasks, the purpose of these tasks in relation to the Study, and deliverables associated with each task. The IBI team will work closely with ART to provide a forum for regular updates about upcoming meetings and the status of public involvement and communication efforts. Team meetings are recommended prior to the Community Meetings to review the team approach and messaging. Timing July 2015 Deliverable - Public Involvement Plan Stakeholder List Approach The IBI outreach team will develop and maintain a stakeholder contact list building upon existing lists provided by ART which will serve as the official stakeholder list for the Study. IBI GROUP A PROFESSIONAL PRACTICE 4 DRAFT FOR DISCUSSION
102 ANAHEIM RESORT TRANSPORTATION Integrated Transportation and Capacity Building Plan PUBLIC INVOLVEMENT PLAN Information collected will include addresses for direct mailing and addresses for blasts. The following types of information will be collected for all contacts when feasible: ID number Salutation Last name First name Suffix Title Organization Department Address City, Zip Phone Mobile Phone Fax Record Source Date of Entry Category Sub Category Notes Meeting Attendance Contacts will include but not be restricted to: ATN board members Local/regional transportation leaders from the City of Anaheim and other impacted Cities including their public works and transit staff The Visit Anaheim staff (formerly OCVCB) The Anaheim/Orange County Lodging and Hotel Association The Orange County Transportation Authority (OCTA) Metrolink Amtrak Major business owners Developers Associations (Downtown Anaheim Association) Retail centers (GardenWalk) Event centers (Disneyland, Angels, Ducks and the Honda Center) Elected officials and key City commissions City/School District representatives Key property owners Neighborhood groups (Anaheim Neighborhood Association) News media Contact information for all public inquiries on the Study will be added to the stakeholder contact list. IBI outreach team will work with ART to obtain any lists of contacts from prior outreach meetings or activities. The IBI outreach team will use these existing list(s) as a base for stakeholder contacts and add contacts from identified areas in close proximity to existing route alignments and potential route alignments. This list will also be used to send meeting notices for public meetings. Rationale A comprehensive and reliable stakeholder database will be critical in ensuring proper outreach to the community. Whenever possible, the database will include full contact information; however, sometimes limited contact information such as address may only be available. The IBI Outreach Team will use a combination of e-blasts, public counter placements and web postings to provide the greatest depth of outreach possible in the community. Timing - Draft Stakeholder List to be submitted in July. IBI GROUP A PROFESSIONAL PRACTICE 5 DRAFT FOR DISCUSSION
103 ANAHEIM RESORT TRANSPORTATION Integrated Transportation and Capacity Building Plan PUBLIC INVOLVEMENT PLAN Deliverables - Prepare draft stakeholder list and provide to team for review; ongoing updates Collateral Material Development Approach The IBI Outreach team will develop collateral materials to support the outreach process. A Study fact sheet that provides a Study overview will be developed. An e-blast template for use in electronic notification to all stakeholders will also be designed. Rationale - IBI will work to ensure that all collateral materials are designed to with a common look and feel so that community members come to recognize official publications of the Study. The consistent design in addition to building Study familiarity also demonstrates a commitment by ART to share Study information as the community will identify and look for materials with a recognizable design. The use of a Study fact sheet is an important tool in providing accurate and easy-to-understand Study information for consumption by the community. The fact sheet can be utilized as a leavebehind piece for public meeting and survey intercepts. The Study fact sheet and other appropriate collateral materials will also be produced and placed at relevant public counters. Timing Draft fact sheet by August. Other collaterals materials (i.e. meeting notice e-blast) will be timed prior to the start of community meetings (at least four weeks prior). Survey Intercepts Deliverables Development of Study fact sheet, meeting notice E-Blast template Approach The IBI Outreach team will organize and conduct five survey intercepts at highvolume areas such as ARTIC, Downtown Anaheim, Disney employee parking area and other identified areas to set-up an interactive station to obtain input on the Study from relevant stakeholders. This approach of conducting surveys via mobile workshops allows us to share Study information. Places where people already congregate in the community are ideal venues to meet and talk with residents. Our team will likely staff a booth at a local event, and talk and meet the residents where they are. Our mobile outreach approach allows for meeting the community in their own neighborhoods and at venues or activities that already actively draw attendance such as Disney employee parking lot or Anaheim Packing House. We will work with local community organizations to schedule these pop up outreach events. To conduct these surveys, the IBI outreach team will utilize MetroQuest, an online engagement software. The software allows for participants to participate in-person and remotely in surveys by ranking issues and utilizing prioritization exercises and mapping exercises that allow for geo-coded comments. The program also provides for scenario-building planning exercises that educate the IBI GROUP A PROFESSIONAL PRACTICE 6 DRAFT FOR DISCUSSION
104 ANAHEIM RESORT TRANSPORTATION Integrated Transportation and Capacity Building Plan PUBLIC INVOLVEMENT PLAN user on the trade-offs of choices while showing in real-time the results of those choices as well as collecting demographic data and developing user profiles. It is designed to be flexible and allows for dynamic public engagement using a variety of creative tabs that are designed to engage stakeholders. This software can be linked in Study e-blasts to engage the public without regarding in-person meeting attendance. Rationale Survey intercepts provide an excellent opportunity to gather detailed input from key stakeholders typically representing a wide cross section of Study interest without regarding attendance at a public meeting. Conducting outreach activities in the community at highvolume activity venues where guests/visitors/public gather increases the exposure and opportunity to share Study information and solicit valuable input. Mobile events provide forums to present and obtain input from community members that may not otherwise participate in traditional meetings. Engaging questions and exercises are developed by the outreach team with input from the Study team to ensure issues or questions are discussed and a variety of feedback obtained from the survey intercept. Timing TBD exploring prospect of administering late August (2015) or December (2015) busy tourist/visitor times. To be discussed with ART Project Management team. Deliverables Develop online engagement survey; schedule, conduct and summarize survey intercept results. MetroQuest is an online community engagement platform for planning projects. It s a powerful, flexible and costeffective way to collect informed input from the public and stakeholders. MetroQuest software enables the public to learn about the project and provide meaningful feedback using a variety of fun and visual screens. It s easy to mix and match screens to accomplish the engagement goals for each phase of the project from identifying and ranking priorities, to rating scenarios or strategies, to adding comments on maps and much more. To ensure the broadest participation, individuals can access MetroQuest on the web or mobile devices, at touchscreen kiosks and during town-hall style workshops. Social Media Approach The IBI outreach team will prepare an appropriately scaled social media program using Facebook to establish an online presence that increases public awareness and participation. The IBI Outreach Team will also facilitate the posting and linkage of the online survey to the ART website and Facebook page. Rationale Developing an online presence through social media (Facebook) provides another opportunity to reach and engage the public. While estimates vary on type and availability of internet access, it is estimated that at least 75% of Orange County residents have access to the internet via computer, laptop or smart phone. While not all internet users will take advantage of IBI GROUP A PROFESSIONAL PRACTICE 7 DRAFT FOR DISCUSSION
105 ANAHEIM RESORT TRANSPORTATION Integrated Transportation and Capacity Building Plan PUBLIC INVOLVEMENT PLAN access to Study documents, the posting of relevant Study information conveys ART s intent to keep the community informed. Through social media, there is an additional opportunity to reach a segment of population that may not engage in a project through attendance at community meetings. Additionally, the public is increasingly getting information and staying informed via online tools like Facebook. Timing Social media launch prior to start of community outreach Summer 2015 Deliverables - Provide coordination for postings to ART website; establish and maintain a Study Facebook page (over Study duration through May 2016) Stakeholder Meetings Approach 1. Kick-Off Meeting with Stakeholders One initial meeting with key stakeholders to introduce the study and work plan and to solicit input on study approach, current operating environment, development and growth landscape, future developments, potential markets served, etc. 2. Stakeholder Planning Meetings Three meetings will be held to educate, inform and take input on the Study in the following areas: i. The Anaheim Resort Area ii. Platinum Triangle and ARTIC iii. City of Anaheim-Downtown Area The IBI team will develop meeting parameters and provide guidance to conduct a series of stakeholder planning meetings for public involvement. The focus of these parameters will be to provide uniformity in presenting information, facilitating dialogue, garnering input and fostering consensus. The IBI team will provide the following outreach logistics and support activities in anticipation of, and during, the Stakeholder Planning Meetings: Provide structure and order for the agreed upon meeting format Staff and provide and assistance with small group exercises Review of meeting guidelines with all attendees Moderate public comment Manage event logistics and facility details (including equipment if applicable) Noticing of the meetings per approach previously described IBI GROUP A PROFESSIONAL PRACTICE 8 DRAFT FOR DISCUSSION
106 ANAHEIM RESORT TRANSPORTATION Integrated Transportation and Capacity Building Plan PUBLIC INVOLVEMENT PLAN Meeting set-up and clean-up, photography, provide and manage refreshments Preparation of brief summary reports after each meeting All comments from community will be captured and responded to by the IBI team. Rationale Many components impact the effectiveness of community meetings. Holding the public meetings on both weekdays and weekends in the evening and daytime will provide the community with ample opportunities to learn about the Study and provide input. The robust noticing will serve to inform the community about the meetings. IBI recommends the format be both informative and interactive. This approach can be achieved by structuring the meetings to include a Study presentation and then allowing ample time for engaging in dialogue as well as enabling community members to pose questions to Study staff and consultants. The IBI team in conjunction with ART will determine the appropriate format for the meetings. Timing Stakeholder meetings as follows: 1. Kick-Off Meeting with Stakeholders August/Sept Stakeholder Planning Meetings October 2015 Deliverables Meeting development, logistical and meeting support; facilitation and staffing of stakeholder meetings. STAKEHOLDER MEETINGS ONE-ON-ONE In addition to the Focus Group/Stakeholder Planning Meetings (discussed above), the IBI team will conduct a select number of one-on-one meetings at strategic times throughout the study process. Specific individuals or agencies to be consulted will be determined in consort with the Project Management team and may include: OCTA Individual Board members Developers (possibly C J Segerstrom & Sons [South Coast], Simon Property Group, Lab Holding [Center Street & Packing District)], Westfield, DJM Capital Partners [HB], LT Global Investments, Brookfield, etc.) Others? ATN BOARD UPDATES The IBI team recognizes the important role of the ATN board in the development of this Study. Board members represent a variety of stakeholders types and will have valuable input to share that will help shape the development of the Study. Working with ART staff, the IBI team will IBI GROUP A PROFESSIONAL PRACTICE 9 DRAFT FOR DISCUSSION
107 ANAHEIM RESORT TRANSPORTATION Integrated Transportation and Capacity Building Plan PUBLIC INVOLVEMENT PLAN provide relevant updates to the board on Study development progress and schedule working sessions as needed at key intervals when more in-depth discussions are warranted. IBI GROUP A PROFESSIONAL PRACTICE 10 DRAFT FOR DISCUSSION
108 Integrated Transportation & Capacity Building Plan Appendix B: Select Presentation Material

109 ART 2035 IMAGINE POSSIBILTIES Anaheim Resort Transportation

110 ART 2035 Imagine Possibilities Strategic Planning for the 21 st Century Assessment of Current Conditions Identify Needs & Opportunities Develop Steps to Pursue & Implement Identify funding/revenue stream & participation structure Need to reflect: Impact of forecasted population growth, development & tourism Diverse priorities of local & regional transportation stakeholders 2


111 Power of Imagination Part of the Disney Experience! Recurring Theme Throughout Work Plan Guest Experience hip & convenient Operations & Service Delivery Access to regional attractions & jobs Vehicles (Zero Emission Vehicles) Technology enhanced customer experience 3


112 Service Design & Evaluation ARC express connections between major activity centers: Angel Stadium, Honda Center, Anaheim GardenWalk, Resort, Convention Center, etc. Opportunity for ART to focus on: Local collector needs Job access Other regional destinations/attractions To complement & enhance local and regional transportation investments and plans ART as primary way to connect to ARC system 4


113 Other Transportation-Related Functions Paradigm Shift: Begins with trip planning - Guest recognition as having arrived at destination at earliest point of contact & continuing for duration of visit Enhance website & tablet/phone APP enhance passenger information part of trip planning and/or convenient access to job sites One-stop reception process full slate of convenience options mobility management - hospitality & valet services not only separate guests from their luggage but also any questions & uncertainties Luggage Concierge: Electronic tagging, tracking, security & delivery confirmation 5
114 ART 2035 The Plan Future of transportation in and around Anaheim A vision ART The Power of Imagination Alternatives Unconstrained - Clean slate Constraints geography, demand & need, population growth, future development. Constrained Operations political, financial, governance & operational. 3 transit operating models, analysis & preferred. Fundable Cost-Effective Sustainable 6

115 Implementation Phasing Plan Governance Institutional/Governance alternatives Local consensus from governing boards, bodies; Projects funding & resources; Obtain capital equipment, change contracts, etc. Operations & Financials Major trip attractors & generators Service types, routes, area of service Ridership & revenue projections Interface with ARC Impacts related to SB375 Operating & capital budget 7

116 Need for a Compelling Shared Vision & Operational Solutions Let s Discuss Strategic alignment of business goals & local investments Clarity of focus on guest needs & creating public value Engage stakeholders actively, identifying commonalities and differences in roles & jurisdictional elements Build common understanding of partners mutual benefit -- Look for consensus Practical solutions for working relationships within high quality customer service Creative service delivery scenarios reflecting range of service types & markets Build a strong business case & value proposition Direct financial impacts Perceived value of transit to project partners, guests (and public/employees) 8
117 ART 2035 Imagine Possibilities Outreach Update Anaheim Resort Transportation

118 Stakeholder Engagement Update Completed: Development of Project Introduction Video Creation of Project Fact Sheet Project Mixer on September 29, 2015 E-Blast Project Update on October 12, 2015 Identification of Key Project Stakeholders 17 of 28 Stakeholder Interviews Completed Next Steps: Continue Stakeholder One-on-One Interviews January/February Update to Stakeholders via E-Blast - Spring ART 2035 Imagine Possibilities 2
119 Stakeholder Engagement Update Expanded List of Stakeholder One-on-One Interviews: Visit Anaheim Amtrak Brookfield Homes Visit Anaheim Customer Advisory Board BW Stovall s Hotels of Anaheim Orange County Concierge Association City of Anaheim Various Staff Metrolink California High Speed Rail Authority John Wayne Airport Anaheim Arena Management Honda Center/Anaheim Ducks Lennar Maguire Properties Westfield Main Place Lab Holdings Anaheim Packing House City of Buena Park Anaheim Angels St. Joseph Heritage Healthcare City of Garden Grove Disneyland Resort at The Walt Disney Company West Anaheim Community Representative City of Orange Travel Costa Mesa Genesee Group OCTA Knott s Berry Farm/Cedar Rapids ART 2035 Imagine Possibilities 3


120 What We Heard Common Themes: Operate a service that is easily understood need for simple and easy to use guest transportation Focus on the customer / guest experience Continue to focus and build upon the current market ART 2035 Imagine Possibilities 4

121 What We Heard Branding / Identity Collaborative arrangements: Discounted tickets (Disney dollars) Joint marketing opportunities Identity Need for consistency too many wraps Adherence to advertising policy common messaging Perception dining/entertainment venues not easy to access The ART of Shopping, The ART of Dining, The ART of Entertainment ART 2035 Imagine Possibilities 5


122 What We Heard Technology Easy, intuitive app Dynamic info at kiosk Real-time information Wi-Fi Infotainment cashless fare payment ART 2035 Imagine Possibilities 6


 On-demand and high frequency service An Uber")

123 Operations / Service Delivery First / Last Mile Connections Complementary not duplicative services (ARC, OCTA) Other destinations? Beach? JWA? Integrated delivery framework broker other services (i.e., TNCs, ride-share, etc.) On-demand and high frequency service An Uber bus with dynamic routing Route restructuring one-seat ride to alternate destinations ART 2035 Imagine Possibilities 7


124 The Future Significant new development hotel, retail & residential Building on successes in Resort Area opportunities in Buena Park, Garden Grove & Costa Mesa Residential younger & more affluent Need to best understand future demand and new & emerging technologies Opportunity for one-stop/turn-key solutions: One Call One Click Brokering/mobility management Part of vacation planning Luggage concierge viewed favorably Integrated fare strategies We operate a 20 th century form of transportation and need to transition to the 21 st century ART 2035 Imagine Possibilities 8
125 ART 2035 Imagine Possibilities Governance Anaheim Resort Transportation
126 Governance Options Creation of the Anaheim Transportation Network ATN is a California non-profit 501(c)4 Corporation, formed on September 28, Purpose is to organize the collective actions of the public and private sectors to address the unique transportation and air quality issues of local employers, major event centers, and visitor-and convention-related businesses located throughout certain portions of the City of Anaheim, known as the Anaheim Resort Area and Stadium Business Center. ATN Began operating ART in City formalized relationship with ATN by awarding nonexclusive franchise agreement in Agreement was extended in 2011, 2013, and ART 2035 Imagine Possibilities 1
127 Governance Options Current Funding of ATN/ART FY 16 Budget Public and private sources Anaheim Tourism Improvement District Hotel Assessment - $2.0M Assessment Route 20 (Disney employee shuttle) - $5.4M Ticket Sales - $4.8M Contracts - $120K Advertising - $750K FTA 5307 Apportionment - $775K Other - $1.8M Total - $15.6M 65% of revenue from Ticket Sales and Route 20 Assessment. ART 2035 Imagine Possibilities 2
128 Governance Options Framework for Assessing Institutional Arrangements Funding Representation Management Structure Adaptability Imagining the kind of transportation services that the market will demand in the near- and long-term future. ART 2035 Imagine Possibilities 3
129 Governance Options Looking to the Future and Potential New Services Five models Funding Opportunities and Constraints Define the role of ATN vis-à-vis the Orange County Transportation Authority to be carefully defined in order to avoid local conflict ART 2035 Imagine Possibilities 4
130 Governance Options Looking to the Future and Potential New Services Private Nonprofit 501(c)(4) Joint Powers Agreements/Joint Powers Agency (JPA) Municipal Transit System Transit Authority or District Private Nonprofit 501(c)(3) ART 2035 Imagine Possibilities 5
131 Governance Option #1 Governance Model Description How Created Funding Opportunities Constraints Private Nonprofit 501(c)(4) Current organizational model. Franchise agreement with City of Anaheim. Organized for the purpose of providing visitor oriented transportation services in Anaheim. Under IRS rules enjoys tax-exempt status and is permitted to lobby. As a general rule, donations (for example, membership fees) are not deductible. Some exceptions may apply. Tax advisor should be consulted. Formed as a Transportation Management Association specifically to facilitate transportation in Anaheim with a distinct focus on the creation of a clean-fuel shuttle system to serve the transportation needs of the Anaheim Resort. Also established in support of the Anaheim Resort Specific Plan to mitigate traffic congestion and air quality impacts. The City of Anaheim adopted an ordinance granting a nonexclusive franchise agreement with ATN. Partnerships between public and private entities. Access to some federal funds. Formation by the Anaheim Tourism Improvement District to help fund ART. Operations restricted to service and environmental standards of franchise agreement. Requires approval of Anaheim City Council for amendments. Not a public agency, so constraints on public funding opportunities. ART 2035 Imagine Possibilities 6
132 Governance Option #2 Governance Model Description How Created Funding Opportunities Constraints Joint Powers Agreements / Joint Powers Agency (JPA) Agreements between two or more existing local governments to create a new transit agency by jointly exercising the powers they each have to build or operate transit. A JPA is legally a separate entity and can do whatever its constituent members are legislatively enabled to do. A JPA is set by Section 6502 of the California Government Code. Local entities. Public agency funding opportunities. Stand-alone entity to develop policies and procedures. Limited to enabling powers of each jurisdiction. A JPA cannot create and maintain its own revenue stream (i.e., no taxing authority). Requires enabling state legislation to add additional powers. ART 2035 Imagine Possibilities 7
133 Governance Option #3 Governance Model Description How Created Funding Opportunities Constraints Municipal Transit System Single local government operator (city bus system) as one part of its municipal functions. Single local government. Public agency funding opportunities. Receives assistance from city government resources. City can use land based financial strategies to increase funding opportunities (e.g., facilities districts and developer fees). Limited to service area of municipality unless have agreements with other jurisdictions to expand service. City management and council priorities can override transit initiatives. ART 2035 Imagine Possibilities 8
134 Governance Option #4 Governance Model Description How Created Funding Opportunities Constraints Transit Authority or District Such an organization can include representation from government and other parties including counties, municipalities, educational institutions, and private transit providers. Governmental units are guaranteed board positions; other stakeholders may be limited to ex officio positions. Special act of state legislature. A transit authority or district is a fully state enabled organization with the ability to locate and further develop dedicated funding sources (taxes, bonds) as well as develop its own policy. Community and political resistance to another government entity with taxing authority. Could be a competitor to local agencies for certain funding. ART 2035 Imagine Possibilities 9
135 Governance Option #5 Governance Model Description How Created Funding Opportunities Constraints Private Nonprofit 501(c)(3) Exempt from federal income tax if its activities serve a specific purpose approved by the IRS. Under IRS rules, the organization may not lobby. Generally governed by a board of directors who are chosen to represent the area served by the agency, including local government officials in addition to private citizens. Set up by a government or a private sector entity as a 501(c)(3) corporation. Considerable freedom to make its own decisions without governmental interference and can more easily adapt services to market demands. Tailors funding decisions to needs of applicable groups, which could increase chances of award. Eligible for some public grant funds. To obtain grants ( 5307, , etc.), the agency must be willing to tailor services to the needs of applicable groups. Services could be limited to specific grant funding terms and conditions. ART 2035 Imagine Possibilities 10


136 ART 2035 Imagine Possibilities California Air Resources Board s Cap-and-Trade Program Anaheim Resort Transportation
137 California Air Resources Board s Cap-and-Trade Program Two transit programs: 1) Transit and Intercity Rail Capital Program 2) Low Carbon Transit Operations Program 1) Transit and Intercity Rail Capital Program 10% of cap and trade auction proceeds - $200M annually Competitive Grant Round 2, due April 5, 2016, approximately $440 million (through FY 17-18), and the Governor s Budget proposes to add almost $900 million more ($800 million from Greenhouse Gas Reduction Fund appropriations, and approximately $90 million from Public Transportation Account loan repayments). Purpose - projects that make important climate investments in California s transportation system, or projects that modernize and integrate the state s transit and rail systems to increase ridership and reduce greenhouse gas emissions which lead to climate change. Eligible applicants - public agencies that operate existing or planned intercity rail, commuter passenger rail, urban rail transit, bus, ferry, or vanpool services. Applicants may also partner with other transit operators to provide better integrated service across two or more providers. ART 2035 Imagine Possibilities 11

138 1) Transit and Intercity Rail Capital Program Selected Projects -- Round 1 -- June 2015 ART 2035 Imagine Possibilities 12
139 2) Low Carbon Transit Operations Program 5% of cap and trade auction proceeds - $75M annually State Controller s Office releases list of eligible transit operators for a portion of the funding. City of Laguna Beach OCTA OCTA Metrolink Total Orange County FY $4.1M Operating and capital assistance for transit agencies to reduce greenhouse gas emission and improve mobility, with a priority on serving disadvantaged communities. New or expanded bus or rail services, expanded intermodal transit facilities, and may include equipment acquisition, fueling, maintenance and other costs to operate those services or facilities, with each project reducing greenhouse gas emissions. For agencies whose service area includes disadvantaged communities, at least 50 percent of the total moneys received shall be expended on projects that will benefit disadvantaged communities. ART 2035 Imagine Possibilities 13
140 ART 2035 Imagine Possibilities Cost Allocation Model May 2017 Anaheim Transportation Network/ Anaheim Resort Transportation
141 Funding Cost-Allocation Model Delivered fully populated, working model Funding Allocation Principals Net cost funding model o Operating Costs Revenues Total cost calculation to ensure sustainability through inclusion of: Fully loaded operating expenses. Program management and allocated administrative expenses. Marketing expenses. Fair share distribution of net costs. Fully scalable to allow for possible future addition of funding partners, and for changes in the baseline data used to calculate annual partner allocations. Cost Allocation Trip Generation Cost distribution based on the daily number of vehicle trips precipitated by the properties. Equitable to the extent that ART services are intended as a congestion mitigation tool and ART costs are distributed in proportion to volume of traffic and potential congestion added in the Resort Area. Fair share basis is progressive contribution to mitigating adverse traffic impacts caused by developed properties. Metrics include trip generation rates published in Trip Generation Manuals ART 2035 Imagine Possibilities 2
142 Cost Allocation Development Type Data Input ART Cost Allocation Property / Development Type - Based on Daily Trip Generation Input Assumptions Condensed Version for Presentation Purposes Year 1 Total Operating Cost $14,842,780 [majority of hotel properties "hidden"] Reserve $0 Operating Cost + Reserve $14,842,780 Year 1 Operating Revenues $12,941,075 Surcharge (Zone/Distance Based) $46,800 Fixed Assessment $0 Year 1 Net Total Cost $1,854,905 Surplus Property / Development Type # of Rooms Retail Square Footage Restaurant Seating Capacity Recreation / Entertainment (seats x # events) Arena/Stadium Parking (# of spaces x # events) Residential - Multiple Dwelling Unit ( >20 units/acre) Total Honda Center 633,450 Angel Stadium 1,062,500 City National Grove 425,000 GardenWalk 161,000 3,250 Convention Center LT Global , Lennar A-Town 400 Jefferson Stadium Park 9,800 1,079 Marriott, Anaheim 1,030 Anabella Hotel 358 Portofino Hotel 190 Quality Inn Anaheim Maingate 52 Site A Total Development Units 11, ,800 3, ,000 1,695,950 2,079 Development unit of measurement Room 1,000 sq. ft. Seat Seat # of Spaces Dwelling Unit Trip generation rate * Resort Hotel only* 8 Average Daily Trips Generated 114,910 7,229 11, ,088 1, ,742 Percent of Total Trips 81.6% 5.1% 8.1% 0.6% 3.6% 0.9% 100% For illustrative purposes ART 2035 Imagine Possibilities 3
143 Cost Allocation Distribution of Daily Trips Generated (# and %) Distribution of Daily Trips Generated SURCHARGE (distance based) Honda Center , % 1,900 Angel Stadium , % 3,188 City National Grove % 850 GardenWalk 0 5,796 11, ,171 Convention Center LT Global 3,000 1, % 4,452 Lennar A-Town % 248 Jefferson Stadium Park % 1, PLATINUM TRIANGLE ,660 11,660 Marriott, Anaheim 10, ,300 Anabella Hotel 3, ,580 Portofino Hotel 1, ,900 Quality Inn Anaheim Maingate Site A Total 114,910 7,229 11, ,088 1, ,741 Percentage of Daily Trips Generated Honda Center 0.00% 0.00% 0.00% 0.00% 1.35% 0.00% 1.35% Angel Stadium 0.00% 0.00% 0.00% 0.00% 2.26% 0.00% 2.26% City National Grove 0.00% 0.00% 0.00% 0.60% 0.00% 0.00% 0.60% GardenWalk 0.00% 4.12% 8.08% 0.00% 0.00% 0.00% 12.20% Convention Center 0.00% 0.00% 0.00% 0.00% 0.00% 0.00% 0.00% 0.00% 0.00% 0.00% 0.00% 0.00% 0.00% 0.00% LT Global 2.13% 0.77% 0.00% 0.00% 0.00% 0.26% 3.16% Lennar A-Town 0.00% 0.00% 0.00% 0.00% 0.00% 0.18% 0.18% Jefferson Stadium Park 0.00% 0.25% 0.00% 0.00% 0.00% 0.48% 0.73% 0.00% 0.00% 0.00% 0.00% 0.00% 0.00% 0.00% PLATINUM TRIANGLE 0.00% 0.00% 0.00% 0.00% 0.00% 0.00% 6.16% 0.00% 0.00% 0.00% 0.00% 0.00% 0.00% 0.00% 0.00% Marriott, Anaheim 7.32% 0.00% 0.00% 0.00% 0.00% 0.00% 7.32% Anabella Hotel 2.54% 0.00% 0.00% 0.00% 0.00% 0.00% 2.54% Portofino Hotel 1.35% 0.00% 0.00% 0.00% 0.00% 0.00% 1.35% Quality Inn Anaheim Maingate 0.37% 0.00% 0.00% 0.00% 0.00% 0.00% 0.37% 0.00% 0.00% 0.00% 0.00% 0.00% 0.00% Site A 0.00% 0.00% 0.00% 0.00% 0.00% 0.00% 0.00% Total 81.65% 5.14% 8.08% 0.60% 3.62% 0.92% % For illustrative purposes ART 2035 Imagine Possibilities 4
144 Cost Allocation Annual Payment Annual Payment (Year 1) ZONE SURCHARGE Honda Center $0 $0 $0 $0 $25,046 $0 $7,627 $32,673 Angel Stadium $0 $0 $0 $0 $42,010 $0 $12,794 $54,804 City National Grove $0 $0 $0 $11,203 $0 $0 $3,412 $14,614 GardenWalk $0 $76,389 $149,918 $0 $0 $0 $0 $226,307 Convention Center $0 $0 $0 $0 $0 $0 $0 $0 $0 $0 $0 $0 $0 $0 $0 $0 LT Global $39,539 $14,234 $0 $0 $0 $4,903 $17,869 $76,545 Lennar A-Town $0 $0 $0 $0 $0 $3,269 $995 $4,264 Jefferson Stadium Park $0 $4,650 $0 $0 $0 $8,817 $4,101 $17,568 PLATINUM TRIANGLE $0 $0 $0 $0 $0 $0 $46,799 $0 $0 $0 $0 $0 $0 $0 Marriott, Anaheim $135,750 $0 $0 $0 $0 $0 $135,750 Anabella Hotel $47,183 $0 $0 $0 $0 $0 $47,183 Portofino Hotel $25,041 $0 $0 $0 $0 $0 $25,041 Quality Inn Anaheim Maingate $6,853 $0 $0 $0 $0 $0 $6,853 $0 $0 $0 $0 $0 $0 Site A $0 $0 $0 $0 $0 $0 $0 Total $1,514,468 $95,273 $149,918 $11,203 $67,056 $16,988 $1,901,704 For illustrative purposes ART 2035 Imagine Possibilities 5
145 ART 2035 Imagine Possibilities THANK YOU May 2017 Anaheim Transportation Network/ Anaheim Resort Transportation

146 ART 2035 Imagine Possibilities Strategic Direction An Eye on the Future September 2016 Anaheim Transportation Network/ Anaheim Resort Transportation
147 AGENDA A. The Product i. Guiding Principals & Opportunities The Changing Development Landscape - Eastern Gateway Project & Platinum Triangle ii. ART Operations - Opportunities Route Restructuring - Looking to the Future Post Harbor Blvd. & East/West Connector services iii. Enhanced Administrative/Technology/Ancillary Opportunities Mobility Management & beyond Supplemental TNCs / microtransit Technology Enhanced customer amenities & service delivery B. Sustainable Financial Model iv. Cost Allocation Model (alternate scenarios) Framework for allocating net operating costs ART 2035 Imagine Possibilities 2
148 Guiding Principles & Opportunities Focus on the customer guest experience o Continue to focus & build upon the current market Rebranding / Identity: ART of Shopping, ART of Dining o Marketing / Communications strategy Incorporate TNCs and microtransit - delivery framework Resort Guest Logistics improve concierge services - luggage handling, ticket packages, transportation, etc. Regional Destinations: Beach access, JWA, Fullerton, etc. High Frequency Service core services Modernization of Fleet & Infrastructure - Capital Investment Strategy ART 2035 Imagine Possibilities 3
149 Opportunities an eye to the future Cutting Edge Use of Technology: WiFi Real-time customer info. Infotainment Cashless fare payment Beacon technology Autonomous / Driverless vehicles Holograms ART 2035 Imagine Possibilities 4
150 ART Operations / Service Delivery Phased Deployment 2017 Project V initiatives: 1. ARTIC / CtrCity Anaheim Circulator o One-seat ride ARTIC to Downtown Anaheim o Mon.-Fri. AM/PM peak & Fri. & Sat. evening 2. Costa Mesa Inter-City Service (Rt 22) o Increase service frequency o Expanded hours of service Provide rubber-tire precursor to East/West Connector provide for early start establishing support travel patterns & promoting favorable land use choices in corridor. ART 2035 Imagine Possibilities 5
151 ART Operations / Service Delivery Phased Deployment 2018 Route Realignment to reflect Eastern Gateway Project Build / expand supplemental services additional regional destinations less frequent service, one-seat ride, demandresponse services Integrated delivery framework First/last mile connections - broker other services (i.e., TNCs, microtransit) An Uber bus with dynamic routing ART 2035 Imagine Possibilities 6
152 Post Harbor Blvd. & East/West Connector 2025/26 To be Replaced with Harbor Blvd. & East/West Connector Services o Routes 1 & 2 Harbor Blvd. o Routes 3, 4 & 5 Grand Plaza Line (via Harbor Blvd. & Convention Way) o Route 15 ARTIC Sports Complex Modify / Realignment: o Route 6 Eliminate portion on Anaheim Blvd. (north of Disney Way) RV Park served by realignment of Rt. 10 o Route 10 Anaheim Blvd. realignment o Route 12 Eliminate portion on Katella between Clementine & Harbor. New north on Clementine, west of Disney Way o Route 14 Eliminate east of State College (to ARTIC) o Route 16 Short-turn at Garden Grove Blvd. & City Dr. Eliminate Harbor Blvd. leg. ART 2035 Imagine Possibilities 7

 o Route 19 Santa Ana Line (120 min.")
 o Routes 7 & 8 Hotel Circle - Serves outside of")
 One-seat ride to Resort o Route 17 AM/PM service 6-year")
153 Post Harbor Blvd. & East/West Connector Services Alternate Delivery Scheme TNCs / Microstransit: o Route 19 Extension of Canyon Line (60 min. frequency) o Route 19 Santa Ana Line (120 min. frequency) o Route 22 Costa Mesa/South Coast Plaza Unchanged: (Project V increased frequency) o Routes 7 & 8 Hotel Circle - Serves outside of ¾ mile of East/West Connector stops o Route 9 Katella (W. of Harbor) One-seat ride to Resort o Route 17 AM/PM service 6-year funding agreement (OCTA) to 2021/22 o Route 18 Buena Park Line (via W. La Palma Ave.) ART 2035 Imagine Possibilities 8
 Net Loss: 971k trips (33.")
154 Post Harbor Blvd. & East/West Connector Services Impact on Ridership: Current: 2.9m trips (excluding Route 20) Post Harbor Blvd. and East/West Connector services: (discontinued routes & restructuring) Net Loss: 971k trips (33.8%) ART 2035 Imagine Possibilities 9
155 Funding Allocation Options Funding Allocation Principals Net cost funding model - deducts the value of all revenues generated by the ART system from the total operating and administrative costs before calculating the annual payments for the funding partners. Total cost calculation to ensure sustainability through inclusion of: Fully loaded operating expenses. Program management and allocated administrative expenses. Marketing expenses. Fair share distribution of net ART costs. Fully scalable to allow for the possible future addition of funding partners, and for changes in the baseline data used to calculate annual partner allocations. ART 2035 Imagine Possibilities 10
156 Funding Allocation Trip Generation Cost distribution based on the daily number of vehicle trips precipitated by the properties. Equitable to the extent that ART services are intended as a congestion mitigation tool and ART costs are distributed in proportion to volume of traffic and potential congestion added in the Resort Area. Fair share basis is progressive contribution to mitigating adverse traffic impacts caused by developed properties. Metrics include trip generation rates published in Trip Generation Manuals o Rates are based on studies made to determine how many vehicles enter and exit a site devoted to a particular land use. ART 2035 Imagine Possibilities 11
157 Funding Allocation Trip Generation [example] Anaheim Transportation Network / Anaheim Resort Transportation Transit Funding Allocation Year 1 Total Operating Cost $14,500,000 Location based on Daily Trip Generation Year 1 Operating Revenue $12,000,000 Year 1 Net Total Cost $2,500,000 Input Assumptions Property / Development Type Rooms Event Space Square Footage Retail Square Footage Restaurant Seating Capacity Recreation / Entertainment (acres) Total Lodging - Hotel 17, Lodging - Resort Hotel 2, Site C ,000 3,700 0 Site D ,500 0 Site E , Site F Total Development Units 19, ,000 15, Development unit of measurement Room 1,000 sq. ft. Seat Acre Trip generation rate * Resort Hotel only* Average Daily Trips Generated 216,200 20,880 41,040 19, ,320 Percent of Total Trips 72.7% 7.0% 13.8% 6.5% 100% Distribution of Daily Trips Generated Site A 189, ,861 Site B 26, ,339 Site C 0 11,880 9, ,870 Site D , ,050 Site E 0 9, ,000 Site F ,200 19,200 Total 216,200 20,880 41,040 19, ,320 Percentage of Daily Trips Generated Site A 63.86% 0.00% 0.00% 0.00% 63.86% Site B 8.86% 0.00% 0.00% 0.00% 8.86% Site C 0.00% 4.00% 3.36% 0.00% 7.36% Site D 0.00% 0.00% 10.44% 0.00% 10.44% Site E 0.00% 3.03% 0.00% 0.00% 3.03% Site F 0.00% 0.00% 0.00% 6.46% 6.46% Total 72.72% 7.02% 13.80% 6.46% % Annual Payment (Year 1) Site A $1,596,436 $0 $0 $0 $1,596,436 Site B $221,471 $0 $0 $0 $221,471 Site C $0 $99,892 $84,000 $0 $183,893 Site D $0 $0 $261,082 $0 $261,082 Site E $0 $75,676 $0 $0 $75,676 Site F $0 $0 $0 $161,442 $161,442 Total $1,817,907 $175,568 $345,083 $161,442 $2,500,000 FOR ILLUSTRATIVE PURPOSES ART 2035 Imagine Possibilities 12
158 Discussion / Next Steps Populate Funding Allocation Model Complete Financial Plan and Capital Investment Strategy Reshaping of service network preparation of final service plan Preparation of Final Report Preparation of Project Fact Sheet Presentation at ATN General Meeting ART 2035 Imagine Possibilities 13

159 Anaheim CtrCity Microtransit Conceptual Plan April 2017


160 CtrCity & Microtransit ATN & City of Anaheim shared interest in microtransit for CtrCity Key to Anaheim s continued economic prosperity Sustainable mobility solutions to address untenable parking challenges, congestion & air quality Technology-oriented companies participation in local passenger transportation services CtrCity Microtransit Conceptual Plan 2
")


 CtrCity")
161 Current Transit Services - Connectivity OCTA (x3 routes) ART Rt. 10 NEW ART Rt. 23 CtrCity/ARTIC (OCTA Project V) Polly the Trolley (introduced in 2015, since been terminated/ under the weather ) CtrCity Microtransit Conceptual Plan 3
 to electric carts, vans, small")

 often based on demandsupply conditions (i.e., surge pricing), and paid using mobile app.")
162 Microtransit State of the Industry Generally - defining characteristics include: A customized vehicle fleet ranging from individuallyowned driven cars (driven by independent contractors) to electric carts, vans, small and large buses May be equipped with Wi-Fi, USB outlets, tablets. Drivers may provide value-added concierge services. Customer access through mobile app, e-hailing. Use of crowd-sourcing or big data analysis to assess demand and form new routes - adjust routes and stops in real time by aggregating demand. Fares (where applicable) often based on demandsupply conditions (i.e., surge pricing), and paid using mobile app. CtrCity Microtransit Conceptual Plan 4
163 Demand / Ridership Estimates 3 Approaches: Trip Generation Rates 22,000+ trips generated Microstransit mode share (.5 to 1% = 110 to 220 trips/day) Parking Lot Utilization Packing House Surface Lots CtrCity Parking Structures Sunday exceeds 140% - mid-day ranges from10% to 60% - mid-day Mid-Week reaching 120% - evening daytime reaching 80-% to 90% evening declines below 60% Saturday exceeding 140% less than 40% Empirical (& anecdotal) Research 7 to 20 trips/hr. Influenced by community characteristics, parking availability & pricing, public policy considerations, shuttle operating characteristics, etc. Anaheim CtrCity Microtransit within 12 months: riders/hr. - 4,800 trips/mth. within 24 months: riders/hr. - 7,200 trips/mth. CtrCity Microtransit Conceptual Plan 5
 = 72 Friday 10:00am to 11:00pm 10 min. 11 rev. hrs. (x 2 vehicles) = 22 Saturday 10:00am to 11:00pm 10 min.")
164 CtrCity Conceptual Plan Alternate Delivery Concepts Direct Hailing purely demand responsive High Frequency Fixed-Route Shuttles Hybrid Flex Route A PREFERRED APPROACH Fixed-Route & e-hail Trip Request Days of Week Hours of Operation Frequency Revenue Hours Mon.-Thurs. 10:00am to 7:00pm 10 min. 36 rev. hrs.(x 2 vehicles) = 72 Friday 10:00am to 11:00pm 10 min. 11 rev. hrs. (x 2 vehicles) = 22 Saturday 10:00am to 11:00pm 10 min. 13 rev. hrs. (x 2 vehicles) = 26 Sunday 10:00am to 7:00pm 10 min. 9 rev. hrs. (x 2 vehicles) = 18 CtrCity Microtransit Conceptual Plan 6
 Cost per hour = $27. Cost per trip = $3.")
165 Preliminary Cost Estimates TFR or Downtowner services Operating Cost: $3k - $4k/month per vehicle Capital Cost: $$4k/month per vehicle Revenue - through sponsorships & advertising CtrCity Microtransit Concept 7,200 annual revenue hours Approx. 57,600 annual trips = $192,000 (inclusive of operating, capital & technology costs) Cost per hour = $27. Cost per trip = $3.33 Transit Agency Cost Comparison = $482,400 (Operating & capital costs. Not include e-hail technology) Cost per hour = $67. Cost per trip = $8.37 CtrCity Microtransit Conceptual Plan 7
166 ART 2035 Imagine Possibilities Strategic Direction An Eye on the Future May 2017 Anaheim Transportation Network/ Anaheim Resort Transportation
167 SUMMARY A. The Product i. Guiding Principals & Opportunities The Changing Development Landscape - Eastern Gateway Project & Platinum Triangle ii. ART Operations - Opportunities Route Restructuring - Looking to the Future Post Harbor Blvd. & East- West Connector services iii. Enhanced Administrative/Technology/Ancillary Opportunities Mobility Management & beyond Supplemental TNCs / microtransit Technology Enhanced customer amenities & service delivery B. Sustainable Financial Model iv. Cost Allocation Model Framework for allocating net operating costs ART 2035 Imagine Possibilities 2


168 Guiding Principles & Opportunities Focus on the customer guest experience o Continue to focus & build upon the current market Rebranding / Identity: ART of Shopping, ART of Dining o Marketing / Communications strategy Incorporate TNCs and microtransit - delivery framework Resort Guest Logistics improve concierge services - luggage handling, ticket packages, transportation, etc. Regional Destinations: Beach access, JWA, Fullerton, etc. High Frequency Service core services Modernization of Fleet & Infrastructure - Capital Investment Strategy ART 2035 Imagine Possibilities 3


169 Opportunities an eye to the future Cutting Edge Use of Technology: WiFi Real-time customer info. Infotainment Cashless fare payment Beacon technology Autonomous / Driverless vehicles Integrated data management ART 2035 Imagine Possibilities 4

 o Increase service frequency o Expanded hours")

170 ART Operations / Service Delivery Phased Deployment 2017 Project V initiatives: 1. ARTIC / CtrCity Anaheim Circulator o One-seat ride ARTIC to Downtown Anaheim o Mon.-Fri. AM/PM peak & Fri. & Sat. evening 2. Costa Mesa Inter-City Service (Rt 22) o Increase service frequency o Expanded hours of service Provide rubber-tire precursor to East-West Connector provide for early start establishing support travel patterns & promoting favorable land use choices in corridor. ART 2035 Imagine Possibilities 5
 An Uber bus with dynamic routing ART 2035 Imagine Possibilities 6")
171 ART Operations / Service Delivery Phased Deployment Route Realignment to reflect Eastern Gateway Project Build / expand supplemental services additional regional destinations less frequent service, one-seat ride, demandresponse services Integrated delivery framework First/last mile connections - broker other services (i.e., TNCs, microtransit) An Uber bus with dynamic routing ART 2035 Imagine Possibilities 6
 o Route 19 & 22 Unchanged o")
172 Post Harbor Blvd. & East-West Connector 2025/26 To be Replaced with Harbor Blvd. & East-West Connector Services o Routes 1 thru 5 & 15 Modify / Realignment o Routes 6, 10, 12, 14, 16 Alternate Delivery Scheme (TNCs / Microstransit) o Route 19 & 22 Unchanged o Routes 7, 8, 9, 17, 18 Impact on Ridership: Net Loss: 971k trips (33.8%) ART 2035 Imagine Possibilities 7
173 Funding Cost-Allocation Model Delivered fully populated, working model Funding Allocation Principals Net cost funding model o Operating Costs Revenues Total cost calculation to ensure sustainability through inclusion of: Fully loaded operating expenses. Program management and allocated administrative expenses. Marketing expenses. Fair share distribution of net costs. Fully scalable to allow for possible future addition of funding partners, and for changes in the baseline data used to calculate annual partner allocations. Cost Allocation Trip Generation Cost distribution based on the daily number of vehicle trips precipitated by the properties. Equitable to the extent that ART services are intended as a congestion mitigation tool and ART costs are distributed in proportion to volume of traffic and potential congestion added in the Resort Area. Fair share basis is progressive contribution to mitigating adverse traffic impacts caused by developed properties. Metrics include trip generation rates published in Trip Generation Manuals ART 2035 Imagine Possibilities 8
174 Funding Allocation Trip Generation [example] Anaheim Transportation Network / Anaheim Resort Transportation Transit Funding Allocation Year 1 Total Operating Cost $14,500,000 Location based on Daily Trip Generation Year 1 Operating Revenue $12,000,000 Year 1 Net Total Cost $2,500,000 Input Assumptions Property / Development Type Rooms Event Space Square Footage Retail Square Footage Restaurant Seating Capacity Recreation / Entertainment (acres) Total Lodging - Hotel 17, Lodging - Resort Hotel 2, Site C ,000 3,700 0 Site D ,500 0 Site E , Site F Total Development Units 19, ,000 15, Development unit of measurement Room 1,000 sq. ft. Seat Acre Trip generation rate * Resort Hotel only* Average Daily Trips Generated 216,200 20,880 41,040 19, ,320 Percent of Total Trips 72.7% 7.0% 13.8% 6.5% 100% Distribution of Daily Trips Generated Site A 189, ,861 Site B 26, ,339 Site C 0 11,880 9, ,870 Site D , ,050 Site E 0 9, ,000 Site F ,200 19,200 Total 216,200 20,880 41,040 19, ,320 Percentage of Daily Trips Generated Site A 63.86% 0.00% 0.00% 0.00% 63.86% Site B 8.86% 0.00% 0.00% 0.00% 8.86% Site C 0.00% 4.00% 3.36% 0.00% 7.36% Site D 0.00% 0.00% 10.44% 0.00% 10.44% Site E 0.00% 3.03% 0.00% 0.00% 3.03% Site F 0.00% 0.00% 0.00% 6.46% 6.46% Total 72.72% 7.02% 13.80% 6.46% % Annual Payment (Year 1) Site A $1,596,436 $0 $0 $0 $1,596,436 Site B $221,471 $0 $0 $0 $221,471 Site C $0 $99,892 $84,000 $0 $183,893 Site D $0 $0 $261,082 $0 $261,082 Site E $0 $75,676 $0 $0 $75,676 Site F $0 $0 $0 $161,442 $161,442 Total $1,817,907 $175,568 $345,083 $161,442 $2,500,000 FOR ILLUSTRATIVE PURPOSES ART 2035 Imagine Possibilities 9
175 ART 2035 Imagine Possibilities THANK YOU May 2017 Anaheim Transportation Network/ Anaheim Resort Transportation
176 Integrated Transportation & Capacity Building Plan Appendix C: a) Stakeholder Interview Guide b) Stakeholder Interview Notes
177 IBI GROUP Von Karman Avenue Suite 110 Irvine CA USA tel fax ibigroup.com Memorandum To File Date November 9, 2015 From Steve Wilks Project No cc Subject Steno Stakeholder Consultation Interview Guide ART - Integrated Transportation & Capacity Building Plan ART 2035 Imagine Possibilities The Anaheim Resort Transportation (ART) Integrated Transportation & Capacity Building Plan is focused on identifying near-term and long-term improvements to the ART service network, both within the Anaheim Resort area and between the Anaheim Resort and other major destinations within Orange County. A key element of the work plan includes consultation with a broad range of stakeholder constituencies. The project management team has prepared a Stakeholder One-on-One Meeting Matrix that includes: representatives of the entertainment and theme park industries; the hospitality industry; convention and tourism (including concierge services); cities; developers; retailers; major employers; and other transportation providers (and agencies) including Metrolink, OCTA, Amtrak, JWA, private/for-hire, etc. Given the eclectic nature of the stakeholder population, there is not a standard interview format or series of questions. The following presents a range of questions or discussion points presented for the identified audience. Each stakeholder meeting will commence with project staff providing an overview of ART: governance, operations, service delivery, markets (and destinations) served, etc. Key questions (high level) all interviews: 1) How do we best position ART (in a dynamic operating environment) to complement regional transportation services (current and future)? 2) How might ART enhance the travel/mobility needs of guests, residents and employees? 3) If we were to meet 3 to 5 years from now what would the regional transit/transportation landscape look like? 10 to 20 years from now? ART specifically?
178 ART Stakeholder Interview Guide 2 The following presents audience specific questions (recognize need to amend/modify to reflect participants, incorporate questions from other constituencies, and additional questions resulting from responses) John Wayne Airport Future plans expansion? Traveler trip volumes? Role/responsibility for ground transportation? Regulations? Data/surveys? Arrivals/departures traveler s use of ground transport? (pickup/drop off, taxis vehicles for hire, ride share services, shuttles & highway coach services, car rentals, other ground transport) Thoughts on ancillary elements (i.e., Luggage concierge services? Technology for customer/guest information? Branding? Vehicles?) City of Anaheim General Plan future development residential, commercial, retail, entertainment/hospitality, etc.? Development permits issued? Pending? Thoughts on what governance/organizational options to support growth and development of ATN/ART to facilitate future access to public (and private) funding sources? Sustainability? Opinion of ART service? Market segments served? (Who are the customers?) o Area of service? Hours of service? Safe, clean & comfortable? Affordable? Punctual/on-time? Convenient? Etc. Other regional destinations? HB? JWA? Carson (NFL)? Thoughts on ancillary elements (i.e., Luggage concierge services? Technology for customer/guest information? Branding? Vehicles?) Representatives of the entertainment and theme park industries Overview of their mandate/functionalities? Target markets (demographics)? Guest volumes? Trends? Current challenges? Parking? Future plans? Opinion of ART service? Market segments served? (Who are the customers?)
179 ART Stakeholder Interview Guide 3 o Area of service? Hours of service? Safe, clean & comfortable? Affordable? Punctual/on-time? Convenient? Etc. Employee access? Parking? Use of alternate modes? Other regional destinations? HB? JWA? Carson (NFL)? Thoughts on extending guest stays? Multiple site visits? Opportunities to enhance the guest experience? Thoughts on ancillary elements (i.e., Luggage concierge services? Technology for customer/guest information? Branding? Vehicles?) Additional Disney specific Questions: Star Wars expansion? (understand limited info in public domain) Parking with specific reference to additional garages, Toy Story Lot, etc.? Thoughts on integrated pricing structure? Build on discussion of employee access (above). Hospitality industry Overview of their mandate/functionalities? Target markets (demographics)? Room occupancy rates? Trends? (STR data) Current challenges? Parking? Guest access? Future plans? Opinion of ART service? Market segments served? (Who are the customers?) o Area of service? Hours of service? Safe, clean & comfortable? Affordable? Punctual/on-time? Convenient? Etc. Thoughts on extending guest stays? Opportunities to enhance the guest experience? Other regional destinations? HB? JWA? Carson (NFL)? Thoughts on ancillary elements (i.e., Luggage concierge services? Technology for customer/guest information? Branding? Vehicles?) Convention and tourism (including concierge services) Overview of their mandate/functionalities? Target markets (demographics)?
180 ART Stakeholder Interview Guide 4 Current challenges? Parking? Guest access? Guests needs for ground transport? Future plans? Thoughts on extending guest stays? Opportunities to enhance the guest experience? Opinion of ART service? o Area of service? Hours of service? Safe, clean & comfortable? Affordable? Punctual/on-time? Convenient? Etc. Other regional destinations? Thoughts on ancillary elements (i.e., Luggage concierge services? Technology for customer/guest information? Branding? Vehicles?) Developers / Role of parking and transport/mobility options in major private investments (typically geared to enhanced land-use & economic growth)? Developments underway? Pending? Site-specific elements? Demographics served? Development plan/roll-out? Transport opportunities for choice riders/discretionary travel? Cities General plan future development residential, commercial, retail, entertainment/hospitality, etc.? Development permits issued? Pending? Transport opportunities for choice riders/discretionary travel? Other regional destinations served? Retailers Role of parking and transport/mobility options in major private investments? Transport opportunities for choice riders/discretionary travel? Employee access? Current challenges? Parking? Seasonal fluctuations? Access to Resort Area guest volumes? Major Employers Overview of their mandate/functionalities? Future plans? Expansion?
181 ART Stakeholder Interview Guide 5 Number of employees? Shifts? Current challenges? Parking? Employee access? Any TDM strategies in place? o Potential role for transit? (And ART specifically?) Other transportation providers bus & rail including Metrolink, OCTA, Amtrak, private/forhire, etc. Overview of their mandate/functionalities? Target markets served? Commuter? Captive vs. choice? Discretionary? Current challenges? Future plans? Opinion of ART service? o Area of service? Hours of service? Safe, clean & comfortable? Affordable? Punctual/on-time? Convenient? Etc. Opportunities for ART to complement delivery framework?
182 MEMO TO: Notes to File DATE: December 7, 2015 FROM: Laura Muna-Landa, Arellano Associates FILE NO: I2: SUBJECT: Anaheim Resort Transportation Transportation Integration and Capacity Building Plan PRESENT: John Woodhead, Executive Director, Community Development City of Anaheim Brad Hobson, Deputy Executive Director, Community Development City of Anaheim Natalie Meeks, Director, Public Works City of Anaheim Linda Johnson, Senior Principal Planner, Public Works City of Anaheim Steve Wilks, IBI Group Laura Muna-Landa, Arellano Associates DISTRIBUTION: File Item Discussed Action
183 Minutes of Meeting ART - Transportation Integration & Capacity Building Plan Page 2 of 4 1. Study Overview and City of Anaheim Interests Discussed overall study and stakeholder planning meetings focusing on resort and Downtown area Provided information about project schedule and timing for next phase Discussion ensued regarding ridership type currently visitors only but could expand to include residential OCTA provides some funding to ART, but doesn t allow them to compete against OCTA. OCTA believes ATN/ART is the City If ART is going to be circulator providing service from train stations, then need some funding to drive Metrolink ridership. ART and Metrolink growth go together. ART could provide last mile connection. Need outreach to figure out where people want to go (talk to hotel, concierge association, Visit Anaheim) See ARC having distinct stations and do not want ART servicing same area. Need to meet with Disney to see how they see area being service. View ART as servicing outlining areas (hotels, etc.). See the services as complimentary and not duplicative. Would like to see joint marketing of ARTIC, ARC, ART to explain how all work together. This will provide for cohesiveness for the traveler between all services. Offer a pass that allows visitor to ride all systems; partner with conventions. System needs to be easy use not visit multiple websites to plan a system. City believes that OCTA needs to take lead on creating a single ticket component system (OCTA buses, Metrolink, ATN, etc. create a consolidated ticketing) key to addressing issues for next five years. ATN would be a player in the consolidated tickets, but not take lead (City thinks OCTA views ATN as a competitor). ATN could coordinate with Visit Anaheim, etc. on sales of consolidated ticket. City staff has used ART and doesn t find it particularly easy; the kiosk in the transportation center is hard to read and hard to use. This is a something that needs to be improved on. Need technology (app), real time information (i.e. next bus is in 7 minutes). Referenced Anaheim App as an example. Other issues, no matter where you are going on ART, have to go back to Disneyland. The buses look a bit out of date; need to be better branded. Also two-fixed schedules run to CrtCity CRTCITYANAHEIM.com the branding/wrap needs to be considered and modeled like this. Make ART fun. Make it easy to use. The continuous ART loop for the visitor is confusing having to pass through multiple points to get where they want to go. Consider a figure 8 loop so that all routes do not lead back to Disney. ART should be making more money with advertising advertising should say fun, I go to fun places.
184 Minutes of Meeting ART - Transportation Integration & Capacity Building Plan 2. Additional Outreach Potential Markets Page 3 of 4 ART provides services for Disney employees, but recognize that OCTA and Disney partner on bus passes, but certainly see opportunity for ART to provide more employee transportation services; could expand to Downtown and provide service to residents as well Should focus on employees in immediately core but advertise/promote routes to outside areas (if route going to Knott s Berry Farm, why couldn t ART provide service to residents along route) Referenced Go Local program and the need to provide access for employees to employee centers Need to recognize change in travel patterns (Disney building Toy Story parking structure) and what new opportunities might exist. Consider first/last mile connections. More joint marketing on print from home tickets (referenced Angels ticket and corresponding Angel Express service on ticket) Opportunities for complimentary services with other providers that work together. Need to explore if folks would pay more for on-demand service to go to the beach, etc. Franchise agreement is with taxi service, Uber/Lyft are not regulated and hard to evaluate. ART is limited to destinations of no more than 2% of routes outside City (add something, must give up something else), but could change. Exceeding 2% would not allow ART to partner with City (and by extension OCTA, Caltrans). Without franchise relationship then financing is limited. Other regional destinations that ART should consider: add to beach (currently market to San Clemente); Does South Coast route serve Segestrom Center for stage productions? Consider a special event van operated by ART for service. City needs to brand resort, Platinum Triangle and sports as a single designation; look at service for entire area. Focus on on-demand systems (Uber), gets us away from the goal to reduce vehicles. Market systems of moving large groups of people on a single vehicle needs to be the focus. Need on-demand (high frequency service) as the response. Review franchise agreement for details (ATN and City)
185 Minutes of Meeting ART - Transportation Integration & Capacity Building Plan 3. Development Opportunities in City Page 4 of 4 In Anaheim Resort, looking at full build out; more hotels (4-diamond hotels) New Disney park Star Wars Synergy of Packing House OCTA Study of Harbor corridor is big Big focus area is the Anaheim Canyon and future development of area East Anaheim (Canyon) not a big focus area for OCTA and senior center is there and needs service In Transit Master Plan, hoping for future service in area Regular fixed route, fixed schedule is a need for resort Community Development staff shared for marketing 4-diamond hotels, research said that 1) amenities are needed, 2) nearby Downtown with activity and 3) easy to get around. Still need #3.
186 MEMO TO: Notes to File DATE: December 8, 2015 FROM: Laura Muna-Landa FILE NO: I2: SUBJECT: PRESENT: Anaheim Resort Transportation Transportation Integration and Capacity Building Plan Art Leahy, CEO Metrolink Steve Wilks, IBI Group Laura Muna-Landa, Arellano Associates DISTRIBUTION: Item Discussed Action 1. Best Positioning for ART to Complement Regional Transportation Services Personal experience did not know how to use/find ART when at a recent conference. Believes there needs to be better connectivity and marketing. ART is not clearly marked to know that you can jump on it and go somewhere. Believes HST or even ARC station would be a game changer for area. Seems likes ART could provide connections to entertainment following an Angels game, etc. Take people where they want to go and provide a later night service. 2. Enhancing Travel/Mobility Needs of Users Discussion ensued regarding service to employees. Could happen because access to Orange County from Inland Empire is more challenging. Perhaps an ART bus that brings employees from Anaheim Canyon station into Anaheim Resort could work. In terms of complimenting OCTA service, need to better understand the travel patterns of employees and identify the gaps. OCTA riders are transit dependent (average income is $20,000); ridership of ART is not. Look at methods to make ARTIC a fun place to drive up ridership (special events, etc) this would bode well for ART Talk to Ken Pratt at Metro (Director of Union Station Property Management); Art to provide contact information.
187 Minutes of Meeting ART - Transportation Integration & Capacity Building Plan 3. Future of ART services Page 2 of 2 Discussed limitations of ART at John Wayne Airport and possibility of brokered services at the airport. Metrolink, OCTA, etc. are not in conflict with Ubers, but rather they can work together for connections. 4. Metrolink Mandates/Target Markets Almost all Metrolink riders have cars and have household incomes of $90K per year, but think it could provide and does provide service for Disney visitors; ART could provide connections (last mile) to service this audience.
188 MEMO TO: Notes to File DATE: November 12, 2015 FROM: Laura Muna-Landa, Arellano Associates FILE NO: I2: SUBJECT: Anaheim Resort Transportation Transportation Integration and Capacity Building Plan PRESENT: Scott Hagen, Deputy Airport Director, Operations John Wayne Airport Robert Holden, Manager, Landside Operations John Wayne Airport Steve Wilks, IBI Group Laura Muna-Landa, Arellano Associates DISTRIBUTION: File Item Discussed Action 1. Study Overview and John Wayne Airport Interests Discussed overall study and stakeholder planning meetings as well as recent expansions (South Coast Plaza and Knott s Berry Farm/Soak City) Discussed JWA s current transit services; OCTA has a stop at JWA (staff believes it is mostly used by employees) JWA keeps a neutral position on transit service providers (requires operating permit); if customers want it, we try to accommodate it Taxi exclusive contract expires later this year Limousine/service vehicles (hotel)/super Shuttle pay $2.25 per visit to JWA (tracked through transponder service; only charge for pick ups, not drop offs); can make data of trip volumes available Any sense of customer make up by service (business vs. tourists)? JWA staff indicated not really interested in if its business travel vs. recreational traveler, etc., just serve the customer. Certain services are predominantly inclined toward a particular type of customer (taxi = business; shuttle = tourists). Discussion ensued regarding passenger survey (intercept survey about 400); 50% arrive via personal car (drop or park) Shuttles, taxis, TNC s (Transportation Network Companies), etc. provide service. Disney has exclusive for their service (no other companies have asked to provide a similar service) Steve to request trip volume data Steve to request passenger survey (from Courtney Wiercioch Deputy Airport Director for Public Affairs)
189 Minutes of Meeting ART - Transportation Integration & Capacity Building Plan 2. Future of ART Page 2 of 2 Steve introduced the discussion of luggage concierge. Are there any issues with implementing luggage concierge? No, plenty of airlines and cruises provide this service (Aloha Airlines used to provide this service) Discussion ensued regarding airport growth. Scott Hagen referenced the Settlement Agreement (runs through 2035). There are six restrictions in the Settlement Agreement: (1) term of the agreement; (2) curfew; (3) the annual passenger limit, referred to as the "Million Annual Passenger Cap" or "MAP Cap"; (4) the number of Class A Average Daily Departures (ADDs) allocated for passenger service; (5) the number of Class A Average Daily Departures (ADDs) allocated for all-cargo service; and (6) the number of passenger loading bridges. Settlement Agreement caps JWA passenger cap at 10.5/10.6 MAP (good for next 5-6 years); same agreement has 11.8 MAP number in Curfew for JWA is 11pm to 7am. What are plans for long-term growth (future 2035)? Scott explained that JWA could max out at 16 MAP. LAX and ONT are viewed as competitors, but difficult to measure their impact on airport. Scott indicated that he thought perhaps slight increase in airfare may make package deals (like ART) more attractive Scott does not see the need for additional service like ART, but it may be competitive if enhanced or unique. Need to price competitively and luggage capacity is important. Scott emphasized JWA s role is to provide equal access to ground transportation. Courtney Wiercioch can provide more details if needed.
190 MEMO TO: Notes to File DATE: October 15, 2015 FROM: Laura Muna-Landa, Arellano Associates FILE NO: I2: SUBJECT: Anaheim Resort Transportation Transportation Integration and Capacity Building Plan PRESENT: Jay Burress, Visit Anaheim Diana Kotler, Anaheim Resort Transportation Todd Priest, Curt Pringle and Associates Steve Wilks, IBI Group Laura Muna-Landa, Arellano Associates DISTRIBUTION: File Item Discussed Action 1. Study Overview and Visit Anaheim Interests Discussed overall study and stakeholder planning meetings focusing on resort and Downtown areas For Platinum Triangle area will utilize focus group meetings, and one-on-one meetings Diana Kotler inquired if it would make sense to provide a presentation to the Visit Anaheim board. Jay Burress thought that some board members would be interested. Jay recommended that the hospitality industry (travel agent group) should be consulted Discussion ensued regarding future meeting with Visit Anaheim staff and the need for data (trip and vacation planning). Jay recommended that team speak with Business Intelligence department. Should also meet with Customer Advisory Board Diana to follow up with Jay regarding presentation Steve Wilks to obtain data on length of conventioneer stays
191 Minutes of Meeting ART - Transportation Integration & Capacity Building Plan 2. Additional Outreach Page 2 of 2 Team inquired about Jay s thoughts on further outreach. Jay thought the team should explore beach area connections Walt Disney Travel Company reconsidering connections to JWA and LAX (complaint issues with current providers) and we should explore this potential opportunity Could provide connections to airports (would require funding restructuring). Discussion ensued regarding a new type of flyaway with regular and frequent headways to and from ARTIC. 3. Guest Experience and Ridership Currently ART is 100% visitor, looking to mix that up with more residents As part of study exploring if it makes sense for ART to provide service to airports Discussion ensued regarding the impacts of Federal funding on ART (restrictions on services and routes that ART can provide) Discussion of impacts of future street car on ART; first/last mile connection will still exist in spite of ARC s presence Uber/Lyft need to be considered as potential competitors a growing market Steve inquired what opportunities might exist to include ART in the vacation planning process? For WDTC, not a problem; for convention business, need to change mindset; Diana indicated that she would like an ART pass to be included in convention package. o o o Jay indicated that team should talk to groups that are planning their own conventions (individualized planning) Discussion ensued regarding conventioneers. NAMM convention attendees have changed over the years; used to stay put, now moving out and using ART to explore area. Steve indicated that opportunity may exist to have multiple vehicle types to serve needs Jay asked how residents would find out about ART shuttle; Steve indicated that this would be part of the process in marketing/development Jay expressed that some ART buses look to bureaucratic and too many wraps; need to be consistent and stricter on advertising policy Jay sees future of ART being easy to ride, easy to see, and easy to use
192 MEMO TO: Notes to File DATE: November 30, 2015 FROM: Laura Muna-Landa, Arellano Associates FILE NO: I2: SUBJECT: Anaheim Resort Transportation Transportation Integration and Capacity Building Plan PRESENT: John O Brien, Vice President Residential Services - Brookfield Properties Laura Muna-Landa, Arellano Associates DISTRIBUTION: File Item Discussed Action 1. Study Overview and Mr. O Brien s Thoughts on ART Future Discussed overall study and stakeholder planning meetings. Brookfield Residential recently completed or will wrap up soon two residential projects in Downtown Anaheim. ART does not appear to be wildly known should be marketed to community and could see it co-existing alongside OCTA (different audiences with different needs/interests) ART should have real time information on activities and event (even advertising) on the buses (referenced elevators in hotels that provide event information and other details in a very short amount of time) Wi-Fi would be a nice service Regional transportation in Orange County from South County to North County would happen, along with introduction with high-speed rail (20+ years); transit for residents (light-rail and BRT) options would be good. See both horizons taking a long time. Bus service gets unfair rap and folks don t like to use it.
193 Minutes of Meeting ART - Transportation Integration & Capacity Building Plan 2. Specific Growth Markets Page 2 of 2 Colony Park is 670 single family and townhomes (ownership) is wrapping up, substantial park of Downtown (has raised income level) The Domain is 100 single-family homes (ownership) almost completed. Mixed of demographics. Interested in ownership. Interested in future opportunities in region, but not far enough along to discuss. The Domain community folks would walk to Packing House (across the street); Colony Park residents would walk or ride bikes. These developments have the demographics that would ride ART to other destinations. Majority of ownership is under the age of 50 (80%). No other nearby developments. Brookfield developments encourage walk ability (seek high walk score). Forsale markets demand 2-car garage. 3. Future of ART Technology and related advancements specifically access and ease is important for transit. Sees having an app as critical (showing real time information on arrivals).
194 MEMO TO: Notes to File DATE: December 9, 2015 FROM: Laura Muna-Landa FILE NO: I2: SUBJECT: PRESENT: Anaheim Resort Transportation Transportation Integration and Capacity Building Plan Michelle Boehm, Southern California Director California High Speed Rail Authority Diana Kotler, Executive Director Anaheim Resort Transportation Laura Muna-Landa, Arellano Associates DISTRIBUTION: Item Discussed Action 1. Best Positioning of ART Future is about connections and transit services working together. We operate a 20 th century form of transportation and need to transition to 21 st century. ART and other services need to be on-demand and multi-model. Transit needs to be all things and things we haven t thought of because of emerging and future technologies. Need to think of future demand and new technology (driverless cars) could have broad ramifications for land use. If we don t need to build houses with garages, etc. for cars, then we have more real estate and can deploy it better (i.e. highest and best use of the land that is a sea of parking around Angels Stadium). Uber is doing transportation plan for Super Bowl in Santa Clara this is an example of huge transformation. No one thought Uber would have been in this position just a few years ago. People want to live in cities and more are moving there. We are in a metropolitan century. Want to live differently than before. Less preference for single-family housing (7,000 square foot or smaller lots will be the norm). Millennials will pick where they want to live and then get a job. It s all about the on-demand lifestyle and transportation needs to change to address that (first/last mile, bike share are key components). Integrated, electronic fares need to be part of this (referenced Sweden as having this technology). Someone needs to take the lead in creating the single-ticket system for multimodal this will be the tipping point in transforming transportation technology. Still need fixed route, because it does provide a service (connects counties and regions)
195 Minutes of Meeting ART - Transportation Integration & Capacity Building Plan Page 2 of 3 2. Enhancing Travel Needs Create an on-demand circulator to solve the first/last mile issues (an Uber bus with dynamic routing). Enhanced customer service is key. It is all about the customer service. Our best brands have great customer service. Make sure we meet the needs (good Wi-Fi, on demand, ease of payment component, ticketing on phones). Tech in hand system the Uberization of payment and service. No need to own ticketing system. Uber doesn t even own cars. Should have customer service representatives that provide excellent customer service. 3. Future of Regional Transit On-demand, first/last mile, high-frequency urban corridors with well-timed connections are all key to the future of regional transit. On time and convenient must be at the forefront of a successful regional transit system. Need to think through the timing of connecting services. Amenities such as remote purchasing of products and services (referenced Starbucks as an example) Make sure amenities are appropriate to the audience.
196 Minutes of Meeting ART - Transportation Integration & Capacity Building Plan Page 3 of 3 4. HST Markets, Challenges, Future Plans, Opinions of ART Phase 1 (San Francisco to Anaheim); with ARTIC as the terminus is moving ahead. Due Business Plan coming out in May 2016 may update the schedule. Many agree that transportation system needs an overhaul, but few want it in their backyard. Needs to respect the character of the community. A block-byblock balancing act. Need more advocacy on messaging the overall positive impacts on people s lives (fast, seamless, cheap). Transportation providers must come together and promote a shared message (positive) to increase the profile of transportation throughout the country. Everyone plans a piece to support the overall message. Work together and end the territorial approach. Transportation makes things possible should be the message. 21 st century needs to be about services touting each other (bus supports train, etc.) Need to be about increasing the size of the pot. Enough room and opportunity to grow the pot. The service that serves an area should the cheapest and best for the area. Access to transportation is critical for people moving from poverty; need to provide this type of equality. Multi-modal system helps us address climate change issues.
197 MEMO TO: Notes to File DATE: December 15, 2015 FROM: Laura Muna-Landa FILE NO: I2: SUBJECT: Anaheim Resort Transportation Transportation Integration and Capacity Building Plan PRESENT: Mindy Abel, Visit Anaheim Senior Vice President Marketing and Development (promotion, marketing of Anaheim, carry brand message at trade shows and tourism, convention and tourism promotion, work with destination development) DISTRIBUTION: Item Discussed Action 1. Positioning of ART ARTIC has been a great enhancement, but need broader awareness of ART outside of resort area (residents and Orange County); should market beyond resort area. Greater visibility needed beyond ARTIC and Platinum Triangle and future expanded developments in the resort. Great to get visitors to Downtown Anaheim too (e.g. Packing House) and ART will be critical to making that happen. Perception is that there is nowhere to go beyond Disney. Visit Anaheim is constantly marketing to visitors that there is more than Disneyland Resort (Downtown Anaheim, Old Town Orange, Downtown Fullerton and rest of Orange County). Perception is that dining/entertainment options are not easy to access. People think of D.C., Las Vegas, San Diego, NYC as having many options. 2. ART Enhancing the Travel/Mobility Needs Definitely an option to provide travel options for employees coming into resort. As Platinum Triangle is built out see more employees coming into resort area. Service for employees should be further examined and considered if the interest exists. Not sure about Anaheim residents need for ART, but knows OCTA is in demand, perhaps enough interest/demand to go around Offering Wi-Fi and more luxurious services would separate ART from OCTA. Training of ART staff has been phenomenal great service. If residence experienced this, they might be more inclined to use it.
198 Minutes of Meeting ART - Transportation Integration & Capacity Building Plan Page 2 of 2 3. Future of Regional Transit/Transportation Landscape See changes because of increase in population; especially if Platinum Triangle is built out. Garden Walk hotels, building of third gate and Downtown Disney all this growth in population and things/options of places to go will force the need for more transit options. 4. Overview of Mandates/Functionalities Focus on convention markets, but market Anaheim at visitor destination and promote Southern California (Visit California); individual tourism and group sales. Anaheim draws most visitors from international markets, Arizona, Nevada, all of California, Pacific Rim (Australia, New Zealand, Japan), mid-atlantic, and mid-west. 5. Future Plans Tackling international markets; build out of area developments and increasing local tourism. Stay in Anaheim, centrally located to everything in Southern California is a message that is being promoted and will continue to be promoted. ART service needs to stay true to the message and not grow too quickly. Do not want to see the value and experience for the resort guest diluted. Still definitely expand to neighboring markets (South Coast, Downtown Anaheim, etc.). Could see ART service provided within Anaheim, Downtown Anaheim, maybe Fullerton, Garden Grove, not sure about beach destinations (not sure of demand); need to explore demand and make sure it makes sense. 6. Greatest Challenges Lots of competition; safety is important (terrorism and personal safety); fears of economic cycles and a downtown forcing change in planning.
199 MEMO TO: Notes to File DATE: November 16, 2015 FROM: Laura Muna-Landa, Arellano Associates FILE NO: I2: SUBJECT: Anaheim Resort Transportation Transportation Integration and Capacity Building Plan PRESENT: Nathan Zug, Community Presence Magnolia Baptist Church Laura Muna-Landa, Arellano Associates DISTRIBUTION: File Item Discussed Action 1. Study Overview and Nathan Zug s Thoughts on ART Future Discussed overall study and stakeholder planning meetings. Nathan Zug provided a brief overview of his interest in West Anaheim (long time resident, pastor, community presence, wants to see his community grow and improve) Nathan shared an overview of West Anaheim. See Beach Boulevard as a link in the next ten years to areas frequented by resort; especially future hotels that are in the process/planned to be refurbished (Beach Boulevard Specific Plan). Nathan feels the following will happen: o o o o Beach/Ball is strategically placed to take travelers that go to both Disneyland and Knott s Berry Farm; Need for west end and future development; Beach Boulevard between La Palma and Katella (ART route 11 should be extended west to Beach Boulevard. Market for longer stays and connecting with West Anaheim area.
200 Minutes of Meeting ART - Transportation Integration & Capacity Building Plan 2. Specific Growth Markets Page 2 of 2 Offer custom charters for buses for large groups that have specific destinations (i.e. day trips); include Wi-Fi If there was good, quality pubic transit, people would take it and leave cars, especially students. Considers good transit to include: comfortable, clean, professionally run/trained staff, well-managed, clean (no drugs, homeless), flexible for both short/long rides, short wait time, less complicated for transfer, connections need to work, loop that has frequency of West Anaheim in mind 3. Future of ART Would like to see both development and transit coordinated together; build with transit in mind Consider development when building transit Development explosion on West Anaheim is ripe Believes base foundation exists for use of transit and more to come Well-thought out planning needed (maybe route for students this is a need) Believe TNCs (Uber, Lyft) are increasing in use. Maybe middle ground between taxi and bus could be the future for ART Need to figure out and address last mile gap Coordinate development on West Anaheim with Disney
201 MEMO TO: Notes to File DATE: November 30, 2015 FROM: Laura Muna-Landa FILE NO: I2: SUBJECT: PRESENT: Anaheim Resort Transportation Transportation Integration and Capacity Building Plan Scott Stiles, City Manager City of Garden Grove Dan Candelaria, City Engineer City of Garden Grove Karl Hill, Planning Services Manager City of Garden Grove Greg Blogdett, Senior Project Manager, Economic Development Division, City of Garden Grove Laura Muna-Landa, Arellano Associates DISTRIBUTION: Item Discussed Action 1. Best Positioning for ART to Complement Regional Transportation Services Laura Muna-Landa began the discussion by explaining the study and ART s role in the region Greg Blogdett shared his concerns with ART s previous service to Garden Grove (on-time service was poor and service was terminated; hotels now provide service). Suggested we meet with Orange County Concierge Association to discuss their interests and needs Believes opportunity exists to connect Anaheim to Huntington Beach (create opportunities for connections to beach travel) Aware that OCTA is look at BRT line for Fullerton to Huntington Beach along Harbor Boulevard 2. Enhancing Travel/Mobility Needs of Users Focus on stops on a regular loop with frequent, regular service. Need to look at OCTA gaps and examine ridership types.
202 Minutes of Meeting ART - Transportation Integration & Capacity Building Plan 3. Future of ART services Page 2 of 2 Short term no changes anticipated; years could have other options, but community would be opposed to BRT or light rail because it takes away lanes. System similar to BRT with cars in lanes could work. Political issues will stall the effort. Need some sort of connectivity that the public can accept. Frustrations with traffic, so commuters are definitely look for choices/options Go Local was a good idea but fell short. Would like to see Orange County connect to Metro s Gold Line at the County line. Housing in Orange County is expensive so it may force alternatives to multiple cars Does not consider Uber or Lyft to be a real force in Garden Grove (believe this because the City doesn t license the vehicles). 4. Future Development Plans Grey Wolf is a 600 room development. Guests to water park must also stay at hotel (no day passes) Interest in hotels along Harbor Boulevard (2-3 sites along Harbor in discussion) City believes it could add 1,000 hotel rooms within 10 years. Other developments: Brookhurst retail development of 80,000 square feet and Galleria (stalled mixed use project partnering with The Lab/Anaheim Packing House) will be 60,000 square feet of development. 5. Other Information Area south of SR-22 is a congested developing area (Brookhurst and Westminster) called Little Saigon. Staff believes that visitors split their time with Disney Resorts and Little Saigon area (described as area with good restaurants and things to see) Gaming buses travel to reservations (from Garden Grove) and would like to explore options to keep that traffic. No other transit services provided in Garden Grove aside from OCTA.
203 MEMO TO: Notes to File DATE: November 30, 2015 FROM: Laura Muna-Landa FILE NO: I2: SUBJECT: PRESENT: Anaheim Resort Transportation Transportation Integration and Capacity Building Plan James Vanderpool, City Manager City of Buena Park Laura Muna-Landa, Arellano Associates DISTRIBUTION: Item Discussed Action 1. Best Positioning for ART to Complement Regional Transportation Services Views ART as more of a visitor benefit, residents probably won t use ART; perhaps only at high peak times; most hotels in Buena Park offer shuttle services. Believes OCTA sees ART as a competitor Buena Park hotels are creating a taxing district (each hotel pays into the district) to pay for joint marketing and looking to provide a transportation service for visitors. Mr. Vanderpool believes that new district could use ART or OCTA. City currently funds joint marketing at $400,000 per year. With new taxing district, hotels will pay in an additional $1.2 - $1.4 million per year. 2. Enhancing Travel/Mobility Needs of Users Mostly see visitors using ART, as employees in region would use OCTA bus. Enhancements would need to be in flexibility, services, frequency and quality of service provided. 3. Future of ART services Short term do not see a lot of change; future sees city and region becoming more urban and therefore more changes would be needed. Visitors coming from urban areas expect mass transit. The Orange County region needs to adapt. Do not see light rail happening in Orange County, but certainly BRT could work.
204 Minutes of Meeting ART - Transportation Integration & Capacity Building Plan 4. Future Development Plans Page 2 of 2 The Source, an urban retail shopping complex with 425,000 square feet of retail, Hilton Hotel, 57,000 square feet of office. Hilton is being developed through the Federal job creation program. Timelines for The Source opening office/retail = July 2016; hotel = December 2016; residential = TBD Other hotel developments including Aloft (boutique hotel in entitlement phase) and a third hotel in discussions. Residential 700 multi-family units under construction = 250 units at Orangethorpe, 75 units (low income), 100 units at Orangethorpe and I-5 and 250 units at Artesia and I-5. The City is becoming very urban. Commercial 3 hotels with a total of 600 rooms. The Source will also include up to 1,000 residential units in addition to above residential. Office in general is still soft except for The Source Downtown Buena Park (Buena Park Mall) will see a big box retailer and more residential 5. Other Information Only transit service in Buena Park is senior service (dial a ride) and OCTA Buena Park visitors come from Central Valley, Northern California and Phoenix Recommends we speak with Visit Buena Park Executive Director Sara Copping at scopping@buenapark.com or
205 MEMO TO: Notes to File DATE: November 12, 2015 FROM: Laura Muna-Landa, Arellano Associates FILE NO: I2: SUBJECT: Anaheim Resort Transportation Transportation Integration and Capacity Building Plan PRESENT: Charles Harris, Senior Vice President of Marketing Visit Anaheim Christina Dawson, Vice President of Operations Visit Anaheim Pepe Avila, Director of Tourism Development Visit Anaheim Steve Wilks, IBI Group Laura Muna-Landa, Arellano Associates DISTRIBUTION: File Item Discussed Action
206 Minutes of Meeting ART - Transportation Integration & Capacity Building Plan Page 2 of 3 1. Study Overview and Visit Anaheim Thoughts on ART Future Discussed overall study and stakeholder planning meetings including services provided by OCTA, shuttles, TNCs, etc.) Discussion ensued regarding the ideal ART service including opportunities for expansion, etc. o o o o o o o o o o o Charles Harris said focus should be on creating turn-key solutions for travel (not rental cars only); easier we can make it for international travelers, the better (make it easier for travelers is the focus) Pepe Avila said that promoting ART, especially to international markets is important. ART serves Anaheim, but when it starts to add value such as service to South Coast Plaza that will make the difference in people buying day tickets. Pepe would like to see extension to beach areas. Christina Dawson cited the Auto Show and travelers to this event (take Metrolink but leaving ARTIC and connecting last mile is hard); NAMM show is an example of how it can work. Charles indicated that travelers need frequency of service (headways). ART and ARTIC are seen as related; opportunities but need education on difference between two. Adding ARC will further complicated the picture. Pepe said that ART could connect to nightlife in Fullerton (a need for conventioneers); need to promote the ART of shopping, the ART of dining, the ART of entertainment to show the opportunities. Charles feels that perception is key. Southern California is congested; the more that we can make it easier through ART to get around, then it will improve travel options and the need for ART. Christina reminded that we need to keep in mind TNCs (transportation networks cars) they are here to stay, ART should serve to further end destinations (South Coast, beach, The Lab). Pepe stated enhancements are key need Wi-Fi in ART shuttles, real time customer information is important Charles added that reliable and on-time performance is key (and will differentiate ART from other transit). Christina felt that the packaging of the system (including ART) is key. Charles feels that service and frequency is key for ART; concierge service would possibly lend support by Disney Laura Muna-Landa to schedule separate meeting with Mindy Abel of Visit Anaheim
207 Minutes of Meeting ART - Transportation Integration & Capacity Building Plan 2. Specific Growth Markets Page 3 of 3 Charles provided his thoughts on partnerships: hotels will only allow partnerships if they are getting a cut of the cost; need to survey members on what fares should be; movement of guests needs to be considered mostly Disney and beach focus; a Huntington Beach shuttle for Disney guests might be the right mix because it is good for families (Newport Beach is higher end and Laguna Beach is eclectic). Future is moving toward higher-end travel stays (Grey Wolf is $300 a night). Perhaps a family will stay a few days at Disney and then day trip or two to Grey Wolf. Discussion ensued about Huntington Beach, Newport Beach and Laguna Beach and other four-star properties. Huntington Beach is an initial market, with Laguna Beach and Newport Beach for future, higher end destinations. Need substantive surveys to determine demand. Pepe sees convention center growth, third gate at Disney resulting in significant growth. Pepe shared thoughts on ARC (street car) will take lane on Katella and not sure this makes sense. Christina sees lots of travelers coming from LAX and therefore do need to solely focus on JWA. LAX is expanding and JWA will likely have growth too. Pepe said that Disney Express is reducing buses with growth of JWA, see need for seamless experience with ART. Charles referenced San Francisco, San Diego and Phoenix (Visit Anaheim survey) as growing markets, but there is no recognition of ART. Wonders if ART branding is too focused or limited. Discussion ensued on whether this was an issue seen by all Visit Anaheim staff. Christina thought it may not be a big issue since everyone wants to partner because what Anaheim is only confusion is ART/ARTIC and what is the difference. 3. Future of ART Eight years from now, ART is/offers/has: Wi-Fi, added value, seamless, going to the beach, see Anaheim Resort as a campus Discussion ensued regarding workforce (huge traffic coming in and out of resort daily); supported by ART on high-volume event days. Not sure need to support more, because OCTA provides service (let OCTA bring workers in and out of resort area)
208 Integrated Transportation & Capacity Building Plan Appendix D: Cost-Allocation Model
209 Anaheim Resort Transportation Transit Funding Allocation Property / Development Type - Based on Daily Trip Generation Input Assumptions Year 1 Total Operating Cost Reserve Operating Cost + Reserve $14,842,780 $0 $14,842,780 Year 1 Operating Revenues $12,941,075 Surcharge (Zone/Distance Based) $46,800 Fixed Assessment Year 1 Net Total Cost $0 $1,854,905 Surplus Mandated Yes / No Property / Development Type # of Rooms Retail Square Footage Restaurant Seating Capacity Recreation / Entertainment (seats x # events) Arena/Stadium Parking (# of spaces x # events) Residential - Multiple Dwelling Unit ( >20 units/acre) Honda Center 633,450 Angel Stadium 1,062,500 City National Grove 425,000 GardenWalk 161,000 3,250 Convention Center LT Global , Lennar A-Town 400 Jefferson Stadium Park 9,800 1,079 SURCHARGE (distance based) Total No Hilton Anaheim 1,572 Yes Marriott, Anaheim 1,030 No Sheraton Park Hotel 490 Yes Anabella Hotel 358 No Howard Johnson Plaza Hotel 316 No Red Lion Anaheim LLC 310 No B.W. Stovall's Inn 289 No Clarion Hotel/QualityHotel 284 Yes Holiday Inn Anaheim Resort 264 Yes Hyatt House 262 No Holiday Inn & Suites 255 Yes DoubleTree Guest Suites 251 No Hotel Menage 243 Yes WorldMark 241 No Motel No Embassy Suites Anaheim Orange 230 No Embassy Suites North 222 Yes Courtyard by Marriot 221 Yes Homewood Suites ACC 215 Yes Residence Inn Anaheim Maingate 200 Yes Portofino Hotel 190 Yes Hyatt Place 178 Yes Spring Hill Suites 172 Yes Courtyard Anaheim at Disney 150 Yes Staybridge Suites 143 No Best Western PLUS Meridian 140 Yes Peacock Suites Resort 139 Yes Towne Place Suites by Marriott 139 Yes Dolphin's Cove Resort 136 Yes Ayres Hotel 133 Yes LaQuinta Inn and Suites 129 Yes Cortona Inn & Suites 127 Yes Extended Stay 124 Yes Spring Hill Suites Anaheim 120 No Stanford Inn & Suites 108 No B.W. Raffles Inn 107 Yes Ramada Plaza 105 Yes Holiday Inn Express Hotel 100 No B.W. Pavilions' 99 No Ramada Maingate North 90 No Days Inn Anaheim Maingate 64 No Quality Inn Anaheim Maingate 52 No Anaheim RV Park 40 No Harbor RV Park 40 No Ayres Inn Orange (ALO Hotel) 38 No Astoria Inn and Suites 33 No Islander Inn & Suites 33 No Americas Best Value Inn 31 No Knights Inn 26 Yes Residence Inn ACC 292 Yes Country Inn & Suites 174 Yes Candlewood Suites Anaheim 150 Yes Holiday Inn Express AR 96 Site A Site B Site C Total Development Units 11, ,800 3, ,000 1,695,950 2,079 Development unit of measurement Room 1,000 sq. ft. Seat Seat # of Spaces Dwelling Unit Trip generation rate * Resort Hotel only* 8 Average Daily Trips Generated 114,910 7,229 11, ,088 1, ,742 Percent of Total Trips 81.6% 5.1% 8.1% 0.6% 3.6% 0.9% 100%
210 Distribution of Daily Trips Generated SURCHARGE (distance based) Honda Center , % 1,900 Angel Stadium , % 3,188 City National Grove % 850 GardenWalk 0 5,796 11, ,171 Convention Center LT Global 3,000 1, % 4,452 Lennar A-Town % 248 Jefferson Stadium Park % 1, PLATINUM TRIANGLE ,660 11,660 Hilton Anaheim 15, ,720 Marriott, Anaheim 10, ,300 Sheraton Park Hotel 4, ,900 Anabella Hotel 3, ,580 Howard Johnson Plaza Hotel 3, ,160 Red Lion Anaheim LLC 3, ,100 B.W. Stovall's Inn 2, ,890 Clarion Hotel/QualityHotel 2, ,840 Holiday Inn Anaheim Resort 2, ,640 Hyatt House 2, ,620 Holiday Inn & Suites 2, ,550 DoubleTree Guest Suites 2, ,510 Hotel Menage 2, ,430 WorldMark 2, ,410 Motel 6 2, ,400 Embassy Suites Anaheim Orange 2, ,300 Embassy Suites North 2, ,220 Courtyard by Marriot 2, ,210 Homewood Suites ACC 2, ,150 Residence Inn Anaheim Maingate 2, ,000 Portofino Hotel 1, ,900 Hyatt Place 1, ,780 Spring Hill Suites 1, ,720 Courtyard Anaheim at Disney 1, ,500 Staybridge Suites 1, ,430 Best Western PLUS Meridian 1, ,400 Peacock Suites Resort 1, ,390 Towne Place Suites by Marriott 1, ,390 Dolphin's Cove Resort 1, ,360 Ayres Hotel 1, ,330 LaQuinta Inn and Suites 1, ,290 Cortona Inn & Suites 1, ,270 Extended Stay 1, ,240 Spring Hill Suites Anaheim 1, ,200 Stanford Inn & Suites 1, ,080 B.W. Raffles Inn 1, ,070 Ramada Plaza 1, ,050 Holiday Inn Express Hotel 1, ,000 B.W. Pavilions' Ramada Maingate North Days Inn Anaheim Maingate Quality Inn Anaheim Maingate Anaheim RV Park Harbor RV Park Ayres Inn Orange (ALO Hotel) Astoria Inn and Suites Islander Inn & Suites Americas Best Value Inn Knights Inn Residence Inn ACC 2, ,920 Country Inn & Suites 1, ,740 Candlewood Suites Anaheim 1, ,500 Holiday Inn Express AR Site A Site B Site C Total 114,910 7,229 11, ,088 1, ,741
211 Percentage of Daily Trips Generated Honda Center 0.00% 0.00% 0.00% 0.00% 1.35% 0.00% 1.35% Angel Stadium 0.00% 0.00% 0.00% 0.00% 2.26% 0.00% 2.26% City National Grove 0.00% 0.00% 0.00% 0.60% 0.00% 0.00% 0.60% GardenWalk 0.00% 4.12% 8.08% 0.00% 0.00% 0.00% 12.20% Convention Center 0.00% 0.00% 0.00% 0.00% 0.00% 0.00% 0.00% 0.00% 0.00% 0.00% 0.00% 0.00% 0.00% 0.00% LT Global 2.13% 0.77% 0.00% 0.00% 0.00% 0.26% 3.16% Lennar A-Town 0.00% 0.00% 0.00% 0.00% 0.00% 0.18% 0.18% Jefferson Stadium Park 0.00% 0.25% 0.00% 0.00% 0.00% 0.48% 0.73% 0.00% 0.00% 0.00% 0.00% 0.00% 0.00% 0.00% PLATINUM TRIANGLE 0.00% 0.00% 0.00% 0.00% 0.00% 0.00% 6.16% 0.00% 0.00% 0.00% 0.00% 0.00% 0.00% 0.00% 0.00% Hilton Anaheim 11.17% 0.00% 0.00% 0.00% 0.00% 0.00% 11.17% Marriott, Anaheim 7.32% 0.00% 0.00% 0.00% 0.00% 0.00% 7.32% Sheraton Park Hotel 3.48% 0.00% 0.00% 0.00% 0.00% 0.00% 3.48% Anabella Hotel 2.54% 0.00% 0.00% 0.00% 0.00% 0.00% 2.54% Howard Johnson Plaza Hotel 2.25% 0.00% 0.00% 0.00% 0.00% 0.00% 2.25% Red Lion Anaheim LLC 2.20% 0.00% 0.00% 0.00% 0.00% 0.00% 2.20% B.W. Stovall's Inn 2.05% 0.00% 0.00% 0.00% 0.00% 0.00% 2.05% Clarion Hotel/QualityHotel 2.02% 0.00% 0.00% 0.00% 0.00% 0.00% 2.02% Holiday Inn Anaheim Resort 1.88% 0.00% 0.00% 0.00% 0.00% 0.00% 1.88% Hyatt House 1.86% 0.00% 0.00% 0.00% 0.00% 0.00% 1.86% Holiday Inn & Suites 1.81% 0.00% 0.00% 0.00% 0.00% 0.00% 1.81% DoubleTree Guest Suites 1.78% 0.00% 0.00% 0.00% 0.00% 0.00% 1.78% Hotel Menage 1.73% 0.00% 0.00% 0.00% 0.00% 0.00% 1.73% WorldMark 1.71% 0.00% 0.00% 0.00% 0.00% 0.00% 1.71% Motel % 0.00% 0.00% 0.00% 0.00% 0.00% 1.71% Embassy Suites Anaheim Orange 1.63% 0.00% 0.00% 0.00% 0.00% 0.00% 1.63% Embassy Suites North 1.58% 0.00% 0.00% 0.00% 0.00% 0.00% 1.58% Courtyard by Marriot 1.57% 0.00% 0.00% 0.00% 0.00% 0.00% 1.57% Homewood Suites ACC 1.53% 0.00% 0.00% 0.00% 0.00% 0.00% 1.53% Residence Inn Anaheim Maingate 1.42% 0.00% 0.00% 0.00% 0.00% 0.00% 1.42% Portofino Hotel 1.35% 0.00% 0.00% 0.00% 0.00% 0.00% 1.35% Hyatt Place 1.26% 0.00% 0.00% 0.00% 0.00% 0.00% 1.26% Spring Hill Suites 1.22% 0.00% 0.00% 0.00% 0.00% 0.00% 1.22% Courtyard Anaheim at Disney 1.07% 0.00% 0.00% 0.00% 0.00% 0.00% 1.07% Staybridge Suites 1.02% 0.00% 0.00% 0.00% 0.00% 0.00% 1.02% Best Western PLUS Meridian 0.99% 0.00% 0.00% 0.00% 0.00% 0.00% 0.99% Peacock Suites Resort 0.99% 0.00% 0.00% 0.00% 0.00% 0.00% 0.99% Towne Place Suites by Marriott 0.99% 0.00% 0.00% 0.00% 0.00% 0.00% 0.99% Dolphin's Cove Resort 0.97% 0.00% 0.00% 0.00% 0.00% 0.00% 0.97% Ayres Hotel 0.95% 0.00% 0.00% 0.00% 0.00% 0.00% 0.95% LaQuinta Inn and Suites 0.92% 0.00% 0.00% 0.00% 0.00% 0.00% 0.92% Cortona Inn & Suites 0.90% 0.00% 0.00% 0.00% 0.00% 0.00% 0.90% Extended Stay 0.88% 0.00% 0.00% 0.00% 0.00% 0.00% 0.88% Spring Hill Suites Anaheim 0.85% 0.00% 0.00% 0.00% 0.00% 0.00% 0.85% Stanford Inn & Suites 0.77% 0.00% 0.00% 0.00% 0.00% 0.00% 0.77% B.W. Raffles Inn 0.76% 0.00% 0.00% 0.00% 0.00% 0.00% 0.76% Ramada Plaza 0.75% 0.00% 0.00% 0.00% 0.00% 0.00% 0.75% Holiday Inn Express Hotel 0.71% 0.00% 0.00% 0.00% 0.00% 0.00% 0.71% B.W. Pavilions' 0.70% 0.00% 0.00% 0.00% 0.00% 0.00% 0.70% Ramada Maingate North 0.64% 0.00% 0.00% 0.00% 0.00% 0.00% 0.64% Days Inn Anaheim Maingate 0.45% 0.00% 0.00% 0.00% 0.00% 0.00% 0.45% Quality Inn Anaheim Maingate 0.37% 0.00% 0.00% 0.00% 0.00% 0.00% 0.37% Anaheim RV Park 0.28% 0.00% 0.00% 0.00% 0.00% 0.00% 0.28% Harbor RV Park 0.28% 0.00% 0.00% 0.00% 0.00% 0.00% 0.28% Ayres Inn Orange (ALO Hotel) 0.27% 0.00% 0.00% 0.00% 0.00% 0.00% 0.27% Astoria Inn and Suites 0.23% 0.00% 0.00% 0.00% 0.00% 0.00% 0.23% Islander Inn & Suites 0.23% 0.00% 0.00% 0.00% 0.00% 0.00% 0.23% Americas Best Value Inn 0.22% 0.00% 0.00% 0.00% 0.00% 0.00% 0.22% Knights Inn 0.18% 0.00% 0.00% 0.00% 0.00% 0.00% 0.18% Residence Inn ACC 2.07% 0.00% 0.00% 0.00% 0.00% 0.00% 2.07% Country Inn & Suites 1.24% 0.00% 0.00% 0.00% 0.00% 0.00% 1.24% Candlewood Suites Anaheim 1.07% 0.00% 0.00% 0.00% 0.00% 0.00% 1.07% Holiday Inn Express AR 0.68% 0.00% 0.00% 0.00% 0.00% 0.00% 0.68% 0.00% 0.00% 0.00% 0.00% 0.00% 0.00% 0.00% 0.00% 0.00% 0.00% 0.00% 0.00% Site A 0.00% 0.00% 0.00% 0.00% 0.00% 0.00% 0.00% Site B 0.00% 0.00% 0.00% 0.00% 0.00% 0.00% 0.00% Site C 0.00% 0.00% 0.00% 0.00% 0.00% 0.00% 0.00% Total 81.65% 5.14% 8.08% 0.60% 3.62% 0.92% %
212 Annual Payment (Year 1) ZONE SURCHARGE Honda Center $0 $0 $0 $0 $25,046 $0 $7,627 $32,673 Angel Stadium $0 $0 $0 $0 $42,010 $0 $12,794 $54,804 City National Grove $0 $0 $0 $11,203 $0 $0 $3,412 $14,614 GardenWalk $0 $76,389 $149,918 $0 $0 $0 $0 $226,307 Convention Center $0 $0 $0 $0 $0 $0 $0 $0 $0 $0 $0 $0 $0 $0 $0 $0 LT Global $39,539 $14,234 $0 $0 $0 $4,903 $17,869 $76,545 Lennar A-Town $0 $0 $0 $0 $0 $3,269 $995 $4,264 Jefferson Stadium Park $0 $4,650 $0 $0 $0 $8,817 $4,101 $17,568 PLATINUM TRIANGLE $0 $0 $0 $0 $0 $0 $46,799 $0 $0 $0 $0 $0 $0 $0 $0.37 Hilton Anaheim $207,183 $0 $0 $0 $0 $0 $207,183 Marriott, Anaheim $135,750 $0 $0 $0 $0 $0 $135,750 Sheraton Park Hotel $64,580 $0 $0 $0 $0 $0 $64,580 Anabella Hotel $47,183 $0 $0 $0 $0 $0 $47,183 Howard Johnson Plaza Hotel $41,648 $0 $0 $0 $0 $0 $41,648 Red Lion Anaheim LLC $40,857 $0 $0 $0 $0 $0 $40,857 B.W. Stovall's Inn $38,089 $0 $0 $0 $0 $0 $38,089 Clarion Hotel/QualityHotel $37,430 $0 $0 $0 $0 $0 $37,430 Holiday Inn Anaheim Resort $34,794 $0 $0 $0 $0 $0 $34,794 Hyatt House $34,531 $0 $0 $0 $0 $0 $34,531 Holiday Inn & Suites $33,608 $0 $0 $0 $0 $0 $33,608 DoubleTree Guest Suites $33,081 $0 $0 $0 $0 $0 $33,081 Hotel Menage $32,026 $0 $0 $0 $0 $0 $32,026 WorldMark $31,763 $0 $0 $0 $0 $0 $31,763 Motel 6 $31,631 $0 $0 $0 $0 $0 $31,631 Embassy Suites Anaheim Orange $30,313 $0 $0 $0 $0 $0 $30,313 Embassy Suites North $29,259 $0 $0 $0 $0 $0 $29,259 Courtyard by Marriot $29,127 $0 $0 $0 $0 $0 $29,127 Homewood Suites ACC $28,336 $0 $0 $0 $0 $0 $28,336 Residence Inn Anaheim Maingate $26,359 $0 $0 $0 $0 $0 $26,359 Portofino Hotel $25,041 $0 $0 $0 $0 $0 $25,041 Hyatt Place $23,460 $0 $0 $0 $0 $0 $23,460 Spring Hill Suites $22,669 $0 $0 $0 $0 $0 $22,669 Courtyard Anaheim at Disney $19,769 $0 $0 $0 $0 $0 $19,769 Staybridge Suites $18,847 $0 $0 $0 $0 $0 $18,847 Best Western PLUS Meridian $18,451 $0 $0 $0 $0 $0 $18,451 Peacock Suites Resort $18,320 $0 $0 $0 $0 $0 $18,320 Towne Place Suites by Marriott $18,320 $0 $0 $0 $0 $0 $18,320 Dolphin's Cove Resort $17,924 $0 $0 $0 $0 $0 $17,924 Ayres Hotel $17,529 $0 $0 $0 $0 $0 $17,529 LaQuinta Inn and Suites $17,002 $0 $0 $0 $0 $0 $17,002 Cortona Inn & Suites $16,738 $0 $0 $0 $0 $0 $16,738 Extended Stay $16,343 $0 $0 $0 $0 $0 $16,343 Spring Hill Suites Anaheim $15,816 $0 $0 $0 $0 $0 $15,816 Stanford Inn & Suites $14,234 $0 $0 $0 $0 $0 $14,234 B.W. Raffles Inn $14,102 $0 $0 $0 $0 $0 $14,102 Ramada Plaza $13,839 $0 $0 $0 $0 $0 $13,839 Holiday Inn Express Hotel $13,180 $0 $0 $0 $0 $0 $13,180 B.W. Pavilions' $13,048 $0 $0 $0 $0 $0 $13,048 Ramada Maingate North $11,862 $0 $0 $0 $0 $0 $11,862 Days Inn Anaheim Maingate $8,435 $0 $0 $0 $0 $0 $8,435 Quality Inn Anaheim Maingate $6,853 $0 $0 $0 $0 $0 $6,853 Anaheim RV Park $5,272 $0 $0 $0 $0 $0 $5,272 Harbor RV Park $5,272 $0 $0 $0 $0 $0 $5,272 Ayres Inn Orange (ALO Hotel) $5,008 $0 $0 $0 $0 $0 $5,008 Astoria Inn and Suites $4,349 $0 $0 $0 $0 $0 $4,349 Islander Inn & Suites $4,349 $0 $0 $0 $0 $0 $4,349 Americas Best Value Inn $4,086 $0 $0 $0 $0 $0 $4,086 Knights Inn $3,427 $0 $0 $0 $0 $0 $3,427 Residence Inn ACC $38,484 $0 $0 $0 $0 $0 $38,484 Country Inn & Suites $22,933 $0 $0 $0 $0 $0 $22,933 Candlewood Suites Anaheim $19,769 $0 $0 $0 $0 $0 $19,769 Holiday Inn Express AR $12,652 $0 $0 $0 $0 $0 $12,652 $0 $0 $0 $0 $0 $0 $0 $0 $0 $0 $0 $0 $0 $0 $0 $0 $0 $0 Site A $0 $0 $0 $0 $0 $0 $0 Site B $0 $0 $0 $0 $0 $0 $0 Site C $0 $0 $0 $0 $0 $0 $0 Total $1,514,468 $95,273 $149,918 $11,203 $67,056 $16,988 $1,901,704
213 Supplemental Data: Facility / Development # of Parking # of Annual Capacity or Spaces Events Sq.Ft. Comments Honda Center 4, ,340 [guests] Parking: 4,223 x 150 events = 633,450 Angel Stadium 12, ,050 [guests] Parking: 12,500 x 85 events = 1,062,500 GardenWalk 3,200 n/a 460,000 sq.ft. - total 35% retail = 161,000 sq.ft. City National Grove 250 1,700 [guests] Seats: 1,700 x 250 events = 425,000 Convention Center 1,350 - new structure m sq.ft. 1m.+ annual attendance Platinum Triangle (select developments) LT Global plan calls for 600 condos & apartments, 300 hotel rooms, 60,000 square feet of office space and a 460,000- sq.ft. retail center. Lennar - A-Town: 1,400-1,746 condos & apartments and 50,000 sq.ft. office & retail. Phase 1: 400 apartment units. Jefferson Stadium Park: 1,079 residential units & 9,800 sq.ft. commercial space
214 Integrated Transportation & Capacity Building Plan Appendix E: Fact Book


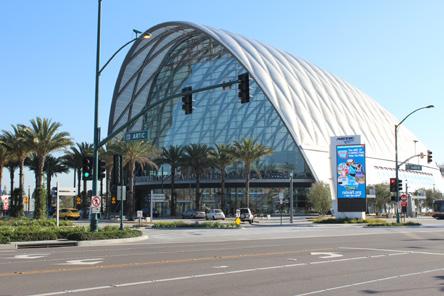
215 Anaheim Resort Transportation AN EYE ON THE FUTURE


216 IMAGINE POSSIBILITIES The Anaheim Resort Transportation (ART) has developed Imagine Possibilities, a short-term and long-term plan to guide the future vision for ART services. Innovative ideas with an eye on the future were provided by ART s informed and knowledgeable stakeholders: board of directors, local government and community leaders, regional transportation providers, operators of major destinations and business leaders in housing, retail and commercial development. With significant growth, employment and development planned throughout the region, ART and its project partners are leading the charge to connect the traveling public.


217 Conveniently Moving Passengers Since 2002 ART was formed as a local non-profit Transportation Management Association by the City of Anaheim and local businesses. Service begins Memorial Day weekend, with 8 fixed-routes in the Anaheim Resort Orange County population hits 3 million Service expanded to the City of Costa Mesa and South Coast Plaza ARTIC opens Disney California Adventure opens Service expanded to the cities of Orange and Garden Grove Service to Anaheim train station at Anaheim Stadium begins Service expanded to the Anaheim Canyon, and the Cities of Santa Ana and Buena Park Million Annual Riders Million Annual Riders 20 Buses 80 Clean-Fuel Buses


218 MOVING INTO THE FUTURE is moving ahead with Imagine Possibilities by identifying and creating a path forward with partnerships to provide a cost effective and financially sustainable future public transportation service model. ART is reinventing itself by identifying and anticipating the future transit needs of the traveling public. Moving people efficiently and reliably was the hallmark for great transportation service in the past; now it is about that plus providing passengers mobility options and convenience at the touch of a button. ART is looking into options to enhance services through technological innovations that move passengers quicker and with more options, informing the passengers of destination opportunities and provide convenient options such as real-time on-demand service, cashless payment choices and a concept for concierge services as part of public transit offerings.


219 REIMAGINED ANAHEIM Some of the most significant and expansive developments in the region are taking place right here in Anaheim. With an estimated $6 billion in investment planned in the Anaheim Resort, Platinum Triangle around Anaheim Stadium the need to enhance ART is an important part of meeting the growing demands of a rapidly expanding region. Additional world-class entertainment venues, luxury hotels and other lodging establishments, a 200,000 square foot expansion to the Anaheim Convention Center and new homes, shopping, dining, offices and hotels at the Platinum Triangle are transforming the opportunities for additional and enhanced public transit services provided by ART.


220 Eastern Gateway Project The Disneyland Resort Eastern Gateway Project is the construction of a seven-level, 6,901-space parking structure with a pedestrian bridge over Harbor Boulevard and a transportation facility to replace most of the existing transit hub on the west side of Harbor Boulevard. The Eastern Gateway Project will result in the realignment of all ART routes to accommodate the relocation of ART passenger drop-off and pick-up points at this state-of-the-art transportation facility. CTYCENTER CityCenter Downtown Anaheim has undergone a tremendous transformation in the past few years with the extensive development including the opening of the reimagined Anaheim Packing House, a 42,000 square feet gourmet food hall and local community gathering space. Bringing CtyCenter closer to The Anaheim Resort are the new CtyCenter buses operated by ART on a 30-minute headway schedule.


221 Platinum Triangle Just east of The Anaheim Resort, a $2.34 billion investment for an 820 acre planned development is underway in The Platinum Triangle, including Angel Stadium, Honda Center, City National Grove of Anaheim and ARTIC. This area, once home to warehouses and other industrial uses is experiencing an exciting rebirth with new projects creating a thriving place to live, work and play. Under construction is A Town Metro, a mix of condominiums, apartments, shopping, dining and park space. Just next door is Jefferson Stadium Park, a $364 million apartment development geared toward professionals and sports fans seeking niche amenities associated with an urban setting. And in the planning stages, is LT Platinum Center with over 500,000 square feet of retail and office, plus 340 condominiums and apartments and a 220-room hotel. For illustrative purposes only


222 RESPONDING TO OPPORTUNITIES is not only responding to the changing landscape of the region, but also anticipating and planning ahead. This table shows the various planned projects for the region and how ART is addressing the needs and planning ahead to keep the traveling public moving more conveniently and faster than ever before. Near Term 2017 CtrCity Costa Mesa Inter-City Service Harbor Corridor Study A one-seat ride from ARTIC to CtyCenter. A one-seat ride from Costa Mesa to the Disneyland Resort. Through ART services, provide an early start of establishing support for travel patterns and promoting favorable land use choices in the corridor.


223 Near Future 2018 Eastern Gateway Project Realignment Build and Expand Supplemental Services Integrated Delivery Framework ART will be realigning routes to reflect the new Eastern Gateway Project Transportation Facility. The new transportation hub will provide access for the entire Disneyland Resort. ART is looking to provide service to additional regional destinations, offering one-seat rides for greater convenience. Additional destinations served by demand-responsive service and partnerships with the private sector will enhance transportation options. ART will consider first/last mile connections and partnerships with other transit services to improve convenience for the traveling public and Beyond Route Restructuring: select routes to be eliminated or realigned to reflect higher capacity transit services in the Harbor Corridor and east-west connections from ARTIC to The Anaheim Resort.


224 Connecting Convenience with Fun in the 21st Century Responding to customer needs is important in the 21st century. As rider expectations evolve, ART must endeavor to meet their needs with a growing emphasis on technology and real-time information. It will be critical for ART to proactively introduce new technologies to its service to enhance the customer experience. Introducing new and innovative technologies that provide convenience and comfort will allow ART to stay ahead of the curve and anticipate rather than react to customer needs. ART is looking to implement the following technologies in two main categories: mobility management and technology enhancements.


225 Mobility Management Luggage Concierge seamless movement of passenger luggage from beginning to end, creating multi-modal opportunities with customer service Demand Response Trip Assistance in the event that ART reaches capacity, ART could outsource trips to third party operators/providers (taxis, private transport companies, etc.) Technology Enhancements Wi-Fi on board Wi-Fi services for customers Real-time customer information up-to-the-minute travel information to let passengers know arrival times for upcoming ART buses InfoTainment on board broadcast content to inform the customer Cashless fare payment the use of mobile ticketing and apps to process payment for tickets Beacon and geo-fencing technology these location-aware technologies would enhance the communication with dispatch centers to provide pin-point pick ups and other details regarding access to transit Autonomous vehicles also known as driver-less cars, self-driving cars, or robotic cars could potentially provide another level of service to the traveling public
About This Report GAUGE INDICATOR. Red. Orange. Green. Gold
 ATTACHMENT A About This Report The Orange County Transportation Authority (OCTA) operates a countywide network of local, community, rail connector, and express bus routes serving over 6, bus stops. OCTA
Date: 11/6/15. Total Passengers
 Total San Diego Metropolitan Transit System POLICY 42 PERFORMANCE MONITORING REPORT Page 1 of 6 OBJECTIVE Develop a Customer-Focused and Competitive System The following measures of productivity and service
THE 2012 NAMM SHOW OFFICIAL HOTEL LIST Book hotel rooms online for fastest acknowledgment
 OFFICIAL HOTEL LIST Book hotel rooms online for fastest acknowledgment Anaheim/Orange County Hotels are NON-SMOKING = Shuttle service to Anaheim Convention Center (Complimentary) ART service to Anaheim
FY Transit Needs Assessment. Ventura County Transportation Commission
 FY 18-19 Transit Needs Assessment Ventura County Transportation Commission Contents List of Figures and Appendices.. 2 Appendices... 1 Chapter 1: Introduction What is the Ventura County Transportation
APPENDIX B COMMUTER BUS FAREBOX POLICY PEER REVIEW
 APPENDIX B COMMUTER BUS FAREBOX POLICY PEER REVIEW APPENDIX B COMMUTER BUS FAREBOX POLICY PEER REVIEW The following pages are excerpts from a DRAFT-version Fare Analysis report conducted by Nelson\Nygaard
APPENDIX B. Arlington Transit Peer Review Technical Memorandum
 APPENDIX B Arlington Transit Peer Review Technical Memorandum Arlington County Appendix B December 2010 Table of Contents 1.0 OVERVIEW OF PEER ANALYSIS PROCESS... 2 1.1 National Transit Database...2 1.2
PUBLIC TRANSIT IN KENOSHA, RACINE, AND MILWAUKEE COUNTIES
 PUBLIC TRANSIT IN KENOSHA, RACINE, AND MILWAUKEE COUNTIES #118404v1 Regional Transit Authority June 19, 2006 1 Presentation Overview Existing Public Transit Transit System Peer Comparison Recent Transit
ORANGE COUNTY TRANSPORTATION AUTHORITY. Go Local Fixed-Guideway Program History and Project Update. PowerPoint 3
 ORANGE COUNTY TRANSPORTATION AUTHORITY Go Local Fixed-Guideway Program History and Project Update PowerPoint 3 Santa Ana-Garden Grove Fixed Guideway Project OCTA Board of Directors September 26, 2011 Project
Att. A, AI 46, 11/9/17
 Total s San Diego Metropolitan Transit System POLICY 42 PERFORMANCE MONITORING REPORT Page 1 of 6 Date: 11/8/17 OBJECTIVE Develop a Customer-Focused and Competitive System The following measures of productivity
Metrolink Service Expansion Program
 Rail and Facilities Program Update Metrolink Service Expansion Program Fullerton Turnback Facility 23.90 Laguna Niguel Turnback Facility 28.20 New Control Points & Signals Anaheim Layover Facility 18.30
Airport Round- Trip Transfer (SNA to Buena Park)
") Airport Round- Trip Transfer (SNA to Buena Park) Airport Code Hotel Name Hotel Address City SNA Residence Inn Los Alamitos 4931 Katella Ave Los Alamitos SNA Best Western - Anaheim Hills 5710 E La Palma
Airport Round- Trip Transfer (SNA to Buena Park) Airport Code Hotel Name Hotel Address City SNA Residence Inn Los Alamitos 4931 Katella Ave Los Alamitos SNA Best Western - Anaheim Hills 5710 E La Palma
ORANGE COUNTY TRANSPORTATION AUTHORITY. Transit System Study Pilot Project Implementation Plans. Attachment A
 ORANGE COUNTY TRANSPORTATION AUTHORITY Transit System Study Pilot Project Implementation Plans Attachment A ATTACHMENT A 1 Transit System Study Pilot Projects Implementation Plan Report May 25, 2012 Background
STADIUM LANDING E. Howell Avenue, Anaheim, CA. ±550 SF - ±8,600 SF Multi-Tenant Units For Lease
 STADIUM LANDING 2020-2120 E. Howell Avenue, Anaheim, CA ±550 SF - ±8,600 SF Multi-Tenant Units For Lease SITE PLAN HOWELL AVENUE 2100 East Howell Avenue 2120 East Howell Avenue C 111 112 113 B 416-417
Chapter 3. Burke & Company
 Chapter 3 Burke & Company 3. WRTA RIDERSHIP AND RIDERSHIP TRENDS 3.1 Service Overview The Worcester Regional Transit Authority (WRTA) provides transit service to over half a million people. The service
Anaheim Resort. Hotel Stay Impact
 Anaheim Resort What: 1,100-acre district including Disneyland Resort theme parks, Anaheim Convention Center, hotels, restaurants and shops Annual visitors: more than 25 million Employees: more than 30,000
Norwalk H.S. Norwalk Green Line Station. Lakewood Green Line Station NORWALK. Bellflower H.S. Studebaker Rd. Cerritos College. Gahr H.S.
 Blvd Blvd Blvd EXISTING NETWORK Transit Hills Blue Metro Cabrillo 92 7 76 2 8 82 74 7 6 7 72 Poly 2 2 2 Mall 7s 3 4 4 46 8 s 3 Green Medical 2 2 76 92 73 7 9 9 94 Wilson 3 92 72 2 72 72 73 73 Norwalk Gahr
Establishes a fare structure for Tacoma Link light rail, to be implemented in September 2014.
 RESOLUTION NO. R2013-24 Establish a Fare Structure and Fare Level for Tacoma Link MEETING: DATE: TYPE OF ACTION: STAFF CONTACT: PHONE: Board 09/26/2013 Final Action Ric Ilgenfritz, Executive Director,
VCTC Transit Ridership and Performance Measures Quarterly Report
 VCTC Transit Ridership and Performance Measures Quarterly Report Overview Quarter 2 Fiscal Year 2018-2019 This report provides performance measures for VCTC Intercity Bus Service covering the FY 2018-19
SAMTRANS TITLE VI STANDARDS AND POLICIES
 SAMTRANS TITLE VI STANDARDS AND POLICIES Adopted March 13, 2013 Federal Title VI requirements of the Civil Rights Act of 1964 were recently updated by the Federal Transit Administration (FTA) and now require
STADIUM LANDING E. Howell Avenue, Anaheim, CA. ±550 SF - ±8,600 SF Mul -Tenant Units For Lease
 STADIUM LANDING 2020-2120 E. Howell Avenue, Anaheim, CA ±550 SF - ±8,600 SF Mul -Tenant Units For Lease Building Address Unit SF Office SF AVAILABILITIES Warehouse SF GL Doors Asking Base Rent - Gross
Peer Performance Measurement February 2019 Prepared by the Division of Planning & Market Development
 2017 Regional Peer Review Peer Performance Measurement February 2019 Prepared by the Division of Planning & Market Development CONTENTS EXECUTIVE SUMMARY... 3 SNAPSHOT... 5 PEER SELECTION... 6 NOTES/METHODOLOGY...
Existing Services, Ridership, and Standards Report. June 2018
 Existing Services, Ridership, and Standards Report June 2018 Prepared for: Prepared by: Contents Overview of Existing Conditions... 1 Fixed Route Service... 1 Mobility Bus... 34 Market Analysis... 41 Identification/Description
2013 PeerMark Compensation Survey Property La Jolla Beach
 Performs guest check in and check out. Makes reservations or adjustments to existing reservations. Informs guests of special events, in-house groups, occupancy, and other situations affecting front desk
VCTC Intercity Five-Year Service Plan
 VENTURA COUNTY SHORT RANGE TRANSIT PLAN VCTC Intercity Five-Year Service Plan June 2015 Table of Contents Page 1 Executive Summary...1-1 Introduction... 1-1 Plan Development... 1-1 2 Service Evaluation...2-1
General Issues Committee Item Transit Operating Budget Ten Year Local Transit Strategy
 General Issues Committee Item 4.1 2017 Transit Operating Budget Ten Year Local Transit Strategy January 27, 2017 Presentation Outline 2017 Operating Budget Overview Ten Year Local Transit Strategy 2 2017
1 (1) 2 (2) 3 (4) 4 (3) 5 (5) 6 (6) 7 (7) 9 (9) 10 (13) 11 (10) 12 (11) 12 (11) 14 (14)
 2 (2) 3 (4) 4 (3) 5 (5) 6 (6) 7 (7) 9 (9) 10 (13) 11 (10) 12 (11) 12 (11) 14 (14)") 16 ORANGE COUNTY BUSINESS JOURNAL Local breaking news: www.ocbj.com MAY 29, 2017 owner 1 Hilton Anaheim 2 (2) Anaheim Marriott 3 (4) Disney's Grand Californian & Spa 4 (3) Disneyland 5 (5) Hyatt Regency
16 ORANGE COUNTY BUSINESS JOURNAL Local breaking news: www.ocbj.com MAY 29, 2017 owner 1 Hilton Anaheim 2 (2) Anaheim Marriott 3 (4) Disney's Grand Californian & Spa 4 (3) Disneyland 5 (5) Hyatt Regency
ATTACHMENT A.7. Transit Division Performance Measurements Report Fiscal Year Fourth Quarter
 TTCHMENT.7 Transit Division Performance Measurements Report Fiscal Year 2012-13 Fourth Quarter Introduction The Orange County Transportation uthority (OCT) operates a countywide network of local, community,
RACINE COUNTY PUBLIC TRANSIT PLAN:
 RACINE COUNTY PUBLIC TRANSIT PLAN: 2013-2017 Recommended Transit Service Improvement Plan NEWSLETTER 3 SEPTEMBER 2013 This newsletter describes the final recommended public transit plan for the City of
Metro. Board Report. File #: , File Type: Informational Report Agenda Number: 25
 Metro Board Report Los Angeles County Metropolitan Transportation Authority One Gateway Plaza 3rd Floor Board Room Los Angeles, CA File #: 2016-0249, File Type: Informational Report Agenda Number: 25 SYSTEM
COMMUNICATIONS DEPARTMENT (Lisa Belsanti, Director) (Joshua Schare, Public Information Officer)
 (Joshua Schare, Public Information Officer)") CITY COUNCIL UNFINISHED BUSINESS AUGUST 21, 2017 SUBJECT: INITIATED BY: SUNSET STRIP ENTERTAINMENT SHUTTLE - PILOT PROGRAM HUMAN SERVICES & RENT STABILIZATION DEPARTMENT (Elizabeth Savage, Director) 'fj1f'..
CITY COUNCIL UNFINISHED BUSINESS AUGUST 21, 2017 SUBJECT: INITIATED BY: SUNSET STRIP ENTERTAINMENT SHUTTLE - PILOT PROGRAM HUMAN SERVICES & RENT STABILIZATION DEPARTMENT (Elizabeth Savage, Director) 'fj1f'..
ORANGE COUNTY TRANSPORTATION AUTHORITY
 ORANGE COUNTY TRANSPORTATION AUTHORITY Traffic Light Synchronization Program Project Results for Brookhurst Street, El Toro Road, and Katella Avenue Attachment A ATTACHMENT A Brookhurst Street Corridor
2245 W VALLEY BOULEVARD COLTON, CA
 W VALLEY BOULEVARD COLTON, CA Co-Listing with O Gorman Pacific Realty Colliers International 2855 E Guasti Road Suite 401 Ontario, CA 91761 United States colliers.com Riverside Avenue OFFERING MEMORANDUM
TRANSPORTATION SERVICE Actual
 PERFORMANCE REPORT-THIRD QUARTER VISION TO DELIVER REGIONAL MULTI-MODAL TRANSPORTATION SERVICES AND INFRASTRUCTURE IMPROVEMENTS THAT SIGNIFICANTLY AND CONTINUALLY INCREASE TRANSIT MARKET SHARE. MISSION
LOS ANGELES COUNTY CONGESTION REDUCTION DEMONSTRATION INITIATIVE
 One Gateway Plaza Los Angeles, CA 90012-2952 213-922.2000 Tel metro.net 35 REGULAR BOARD MEETING JULY 24, 2008 SUBJECT: ACTION: LOS ANGELES COUNTY CONGESTION REDUCTION DEMONSTRATION INITIATIVE AMEND THE
Community Meeting LGB Ground Transportation Study
 Community Meeting LGB Ground Transportation Study FEBRUARY 1, 2017 DISCUSSION OVERVIEW LGB management goals Study background and methodology LGB passenger survey results Regulatory environment Best practice
8 CROSS-BOUNDARY AGREEMENT WITH BRAMPTON TRANSIT
 8 CROSS-BOUNDARY AGREEMENT WITH BRAMPTON TRANSIT The Transportation Services Committee recommends the adoption of the recommendations contained in the following report dated May 27, 2010, from the Commissioner
WESTERN EL DORADO COUNTY SHORT AND LONG-RANGE TRANSIT PLAN Executive Summary
 WESTERN EL DORADO COUNTY SHORT AND LONG-RANGE TRANSIT PLAN Executive Summary Prepared for the El Dorado County Transportation Commission Prepared by The El Dorado County Transportation Commission (EDCTC)
Airport Planning Area
 PLANNING AREA POLICIES l AIRPORT Airport Planning Area LOCATION AND CONTEXT The Airport Planning Area ( Airport area ) is a key part of Boise s economy and transportation network; it features a multi-purpose
DEMOGRAPHICS AND EXISTING SERVICE
 EXECUTIVE SUMMARY The Central Corridor light-rail transit (LRT) project will open in 2014 and operate between downtown Minneapolis and downtown St. Paul, serving the University of Minnesota and University
(This page intentionally left blank.)
") Executive Summary (This page intentionally left blank.) Executive Summary INTRODUCTION The Cache Valley Transit District (CVTD) contracted with the team of Transportation Consultants, Inc. () and Fehr
Executive Summary (This page intentionally left blank.) Executive Summary INTRODUCTION The Cache Valley Transit District (CVTD) contracted with the team of Transportation Consultants, Inc. () and Fehr
2015 Independence Day Travel Overview U.S. Intercity Bus Industry
 2015 Independence Day Travel Overview U.S. Intercity Bus Industry Chaddick Institute for Metropolitan Development, DePaul University June 25, 2015 This Intercity Bus Briefing summarizes the Chaddick Institute
Project Deliverable 4.1.3d Individual City Report - City of La Verne
 Pomona Valley ITS Project Project Deliverable 4.1.3d Individual City Report - City of La Verne Prepared by: April 19, 2002 099017000.1 Copyright 2002, Kimley-Horn and Associates, Inc TABLE OF CONTENTS
Orange County Transportation Authority Fare Integration Project A Regional Approach
 Orange County Transportation Authority Fare Integration Project A Regional Approach APTA Fare Collection Workshop and TransITech Conference March 2012 Agenda Review our Regional Efforts Describe the Southern
59,230 Sq. Ft. on 3.03 Acre Land Site
 FOR SALE High Image Corporate HQ/R&D Building 9,230 Sq. Ft. on 3.03 Acre Land Site 1642 Millikan Ave., CA PROPERTY FEATURES High Image, with Extensive Two-Story Glassline +20,000 SF Two-Story Corporate
Title VI Service Equity Analysis
 Pierce Transit Title VI Service Equity Analysis Pursuant to FTA Circular 4702.1B September 2013 Service Change February 2013 Page intentionally left blank PIERCE TRANSIT TITLE VI SERVICE EQUITY ANALYSIS
NORTHERN NAPA VALLEY TRANSIT STUDY
 NORTHERN NAPA VALLEY TRANSIT STUDY Draft Final Recommendations Report Submitted by: June 5, 2007 TABLE OF CONTENTS Executive Summary... i ES-1 Project Objectives and Approach... i ES-2 Current Service
DISTRICT EXPRESS LANES ANNUAL REPORT FISCAL YEAR 2017 JULY 1, 2016 JUNE 30, FloridaExpressLanes.com
 DISTRICT EXPRESS LANES ANNUAL REPORT FISCAL YEAR 2017 JULY 1, 2016 JUNE 30, 2017 FloridaExpressLanes.com This page intentionally left blank. TABLE OF CONTENTS List of Figures... ii List of Tables.... ii
MUSKEGON AREA TRANSIT SYSTEM PROPOSAL FOR FARE AND SERVICE ADJUSTMENTS TO BE PHASED IN BEGINNING JANUARY 1, 2018
 MUSKEGON AREA TRANSIT SYSTEM PROPOSAL FOR FARE AND SERVICE ADJUSTMENTS TO BE PHASED IN BEGINNING JANUARY 1, 2018 The Muskegon Area Transit System is proposing a series of System Adjustments to be implemented
All Door Boarding Title VI Service Fare Analysis. Appendix P.3
 All Door Boarding Title VI Service Fare Analysis Appendix P.3 Metro Board Report Los Angeles County Metropolitan Transportation Authority One Gateway Plaza 3rd Floor Board Room Los Angeles,
New System. New Routes. New Way. May 20, 2014
 Route Optimization I N I T I A T I V E New System. New Routes. New Way. May 20, 2014 1 Welcome Blueprint for Transportation Excellence (BTE) 20 year strategic plan Blueprint 2020 JTA s five-year plan for
Gold Coast. Rapid Transit. Chapter twelve Social impact. Chapter content
 Gold Coast Rapid Transit Chapter twelve Social impact Chapter content Social impact assessment process...235 Existing community profile...237 Consultation...238 Social impacts and mitigation strategies...239
Thank you for participating in the financial results for fiscal 2014.
 Thank you for participating in the financial results for fiscal 2014. ANA HOLDINGS strongly believes that safety is the most important principle of our air transportation business. The expansion of slots
PREFACE. Service frequency; Hours of service; Service coverage; Passenger loading; Reliability, and Transit vs. auto travel time.
 PREFACE The Florida Department of Transportation (FDOT) has embarked upon a statewide evaluation of transit system performance. The outcome of this evaluation is a benchmark of transit performance that
Community Transit Solutions for the Suburbs CTAA Expo June 2014
 Community Transit Solutions for the Suburbs CTAA Expo June 2014 New Suburban Challenges Lower density development patterns Where is the funding to compete with urban and suburban commuter needs? Increased
SAN LUIS OBISPO TRANSIT + SAN LUIS OBISPO RTA JOINT SHORT RANGE TRANSIT PLANS: SERVICE STRATEGIES. Presented by: Gordon Shaw, PE, AICP; Principal
 SAN LUIS OBISPO TRANSIT + SAN LUIS OBISPO RTA JOINT SHORT RANGE TRANSIT PLANS: SERVICE STRATEGIES Presented by: Gordon Shaw, PE, AICP; Principal Project Status Review of existing services and setting complete
MONTEREY REGIONAL AIRPORT MASTER PLAN TOPICAL QUESTIONS FROM THE PLANNING ADVISORY COMMITTEE AND TOPICAL RESPONSES
 MONTEREY REGIONAL AIRPORT MASTER PLAN TOPICAL QUESTIONS FROM THE PLANNING ADVISORY COMMITTEE AND TOPICAL RESPONSES Recurring topics emerged in some of the comments and questions raised by members of the
CHAIR S RECEPTION. Thursday, June 20, :00 p.m. Pool North Tower Hyatt Regency Orange County Garden Grove, California
 PACIFIC FISHERY MANAGEMENT COUNCIL CHAIR S RECEPTION Thursday, June 20, 2013 6:00 p.m. Pool North Tower Hyatt Regency Orange County Garden Grove, California TO BE RETAINED BY OPERATORS OF HOTELS MOTELS,
Evaluating Lodging Opportunities
 Evaluating Lodging Opportunities This section explores market opportunities for new lodging accommodations in the downtown area. It will help you understand travel and visitation trends, existing competition,
St. Johns County Transit Development Plan Update
 St. Johns County Transit Development Plan Update 2012-2021 Demographic Information Population 190,000 people in 2010 51% increase from 2000 Employment 64% over age 16 in labor force St. Augustine, Ponte
Word Count: 3,565 Number of Tables: 4 Number of Figures: 6 Number of Photographs: 0. Word Limit: 7,500 Tables/Figures Word Count = 2,250
 Katherine F. Turnbull, Ken Buckeye, Nick Thompson 1 Corresponding Author Katherine F. Turnbull Executive Associate Director Texas Transportation Institute Texas A&M University System 3135 TAMU College
2 YORK REGION TRANSIT MOBILITY PLUS 2004 SYSTEM PERFORMANCE REVIEW
 2 YORK REGION TRANSIT MOBILITY PLUS 2004 SYSTEM PERFORMANCE REVIEW The Joint Transit Committee and Rapid Transit Public/Private Partnership Steering Committee recommends the adoption of the recommendation
CHAPTER 5: Operations Plan
 CHAPTER 5: Operations Plan Report Prepared by: Contents 5 OPERATIONS PLAN... 5-1 5.1 Proposed Service Changes... 5-2 5.1.1 Fiscal Year 2017... 5-2 5.1.2 Fiscal Year 2018... 5-6 5.1.3 Fiscal Year 2019...
Why we re here: For educational purposes only
 Transportation 2050 Why we re here: For educational purposes only Transportation 2050 Bus Elements PUBLIC TRANSIT DEPARTMENT City of Phoenix Citizens Committee on the Future of Phoenix Transportation (CCFPT)
A. CONCLUSIONS OF THE FGEIS
 Chapter 11: Traffic and Parking A. CONCLUSIONS OF THE FGEIS The FGEIS found that the Approved Plan will generate a substantial volume of vehicular and pedestrian activity, including an estimated 1,300
Quarterly Report Transit Bureau, Local Transit Operations. First Quarter, Fiscal Year 2015 (July 2014 September 2014) ART & STAR
 ART & STAR") Quarterly Report Transit Bureau, Local Transit Operations First Quarter, Fiscal Year 2015 (July 2014 September 2014) ART & STAR A Arlington Transit ART 1) Introduction The purpose of ART is to provide
Quarterly Report Transit Bureau, Local Transit Operations First Quarter, Fiscal Year 2015 (July 2014 September 2014) ART & STAR A Arlington Transit ART 1) Introduction The purpose of ART is to provide
Ozaukee County Transit Development Plan
 Ozaukee County Transit Development Plan Record of Public Comments and Recommended Transit Service Plan June 5, 2018 Kevin Muhs Deputy Director #242846 Status of the Transit Development Plan Existing Conditions
Pinellas Suncoast Transit Authority Community Bus Plan
 Pinellas Suncoast Transit Authority Community Bus Plan FINAL REPORT JANUARY 2014 Prepared by: TABLE OF CONTENTS Executive Summary... 2 Community Bus Plan Introduction... 22 Previous Studies... 25 Market
Title VI Service Equity Analysis
 Pierce Transit Title VI Service Equity Analysis Pursuant to FTA Circular 4702.1B NE Tacoma Service May 2016 Pierce Transit Transit Development Dept. PIERCE TRANSIT TITLE VI SERVICE EQUITY ANALYSIS TABLE
AMERICA S LEADING AIRPORT SHUTTLE SERVICE
 AMERICA S LEADING AIRPORT SHUTTLE SERVICE SuperShuttle pioneered the shared ride concept 25 years ago, and today it is the largest, most recognized airport shuttle business in the country, providing rides
List of Figures... 4 List of Maps... 6 Introduction... 7 Data Sources... 8
 SERVICE EVALUATION APRIL 2014 Table of Contents List of Figures... 4 List of Maps... 6 Introduction... 7 Data Sources... 8 Service Overview and Service Fundamentals System Overview... 9 Service Area...
SRTA Year End Fixed Route Ridership Analysis: FY 2018
 SRTA Year End Fixed Route Ridership Analysis: FY 2018 2018 Contents Introduction... 1 A. Key Terms Used in this Report... 1 Key Findings... 2 A. Ridership... 2 B. Fare Payment... 4 Performance Analysis
Bristol Virginia Transit
 Bristol Virginia Transit 1 Transit Overview Bristol Virginia Transit (BVT) is a Federally Funded and certified urban area transit system. BVT began operation in its current form in 1982. In Fiscal Year
2018 Service Changes Ada County
 2018 Service Changes Ada County System Benefits 15 minute headways on State Street during peak hours o 30 minutes on Saturdays 30 minute headways on Emerald all day on weekdays More frequent and direct
Greater Portland Transit District
 Greater Portland Transit District TO: FROM: Freeport Town Council Greg Jordan - Metro General Manager DATE: September 10, 2014 SUBJECT: Metro Request to Pursue Grant Funding for Trial Express Bus Service
FY Year End Performance Report
 Overall Ridership Big Blue Bus carried 18,748,869 passengers in FY2014-2015, a 0.3% reduction from the year prior. This negligible reduction in ridership represents the beginnings of a reversal from a
DRAFT Service Implementation Plan
 2017 Service Implementation Plan October 2016 SECTION NAME 2017 Service Implementation Plan October 2016 2017 SERVICE IMPLEMENTATION PLAN TABLE OF CONTENTS Table of Contents... I List of Tables... III
Creating Sustainable Communities Through Public Transportation
 Creating Sustainable Communities Through Public Transportation 21 st Transportation Committee January 16, 2008 Keith T. Parker Chief Executive Officer Charlotte Area Transit System (CATS) Charlotte Mecklenburg
These elements are designed to make service more convenient, connected, and memorable.
 Transit is most attractive when it is frequent enough that people don t need to consult a timetable, and can instead just go to a stop and know that the train or bus will arrive shortly. Nearly all major
Mount Pleasant (42, 43) and Connecticut Avenue (L1, L2) Lines Service Evaluation Study Open House Welcome! wmata.com/bus
 and Connecticut Avenue (L1, L2) Lines Service Evaluation Study Open House Welcome! wmata.com/bus") Mount Pleasant (42, 43) and Connecticut Avenue (L1, L2) Lines Service Evaluation Study Open House Welcome! Study Overview and Timeline Phase 1: Collect and Analyze Data Project Kickoff, September 2017
Mount Pleasant (42, 43) and Connecticut Avenue (L1, L2) Lines Service Evaluation Study Open House Welcome! Study Overview and Timeline Phase 1: Collect and Analyze Data Project Kickoff, September 2017
Executive Summary. Introduction. Community Assessment
 Executive Summary Introduction The Red Rose Transit Authority (RRTA) Transit Development Plan provides an evaluation of existing RRTA fixed route services, with the outcome being practical recommendations
Appendix L Technical Memorandum Aesthetics
 Technical Memorandum Aesthetics 1.0 AESTHETICS This section provides a discussion of the aesthetic resources in the vicinity of ARTIC. Aesthetics pertain to the elements that make a certain view pleasing
Joint Base Lewis - McChord Leisure Travel Services (LTS) Price List - Hotels
 Price List - Hotels") Joint Base Lewis - McChord Leisure Travel Services (LTS) Price List - Hotels Lewis Main: 2272 Liggett Avenue (Inside Bowl Arena Lanes) McChord: 737 Joe Jackson Blvd. (Inside Sounders Lanes) Ph: (253) 967-3085
Joint Base Lewis - McChord Leisure Travel Services (LTS) Price List - Hotels Lewis Main: 2272 Liggett Avenue (Inside Bowl Arena Lanes) McChord: 737 Joe Jackson Blvd. (Inside Sounders Lanes) Ph: (253) 967-3085
Trade School Space Ready for Occupancy
 Trade School Space Ready for Occupancy For More Information Contact: Sima Shidfar, MSIE Tel: (714) 543-3289 sima@twsrealty.com Santa Ana Medical Arts Complex 1125 E. 17 th Street, Santa Ana, California
2008 Oceanside to Annapolis
 Guidelines Equipment Advice Rules 2008 Oceanside to Annapolis GEAR 2008 Page 1 To RAAM Racers and Crew, Preparations for RAAM 2008 are well under way. It s going to be another great race this year! We
Passenger Facility Charge (PFC) Program: Eligibility of Ground Access Projects Meeting
 Program: Eligibility of Ground Access Projects Meeting") This document is scheduled to be published in the Federal Register on 05/03/2016 and available online at http://federalregister.gov/a/2016-10334, and on FDsys.gov [ 4910-13] DEPARTMENT OF TRANSPORTATION
This document is scheduled to be published in the Federal Register on 05/03/2016 and available online at http://federalregister.gov/a/2016-10334, and on FDsys.gov [ 4910-13] DEPARTMENT OF TRANSPORTATION
Capital Programs Update
 Capital Programs Update Capital Programs Summary 2 Grade Separations - Overview Seven grade separation projects planned on the BNSF Orangethorpe corridor Cost: from $65 to $117 million Current Status:
Summary of Proposed NH 120 Service
 Proposed NH 120 Bus Route Moody Building Etna Road Summary of Proposed NH 120 Service The Upper Valley Lake Sunapee Regional Planning Commission (UVLSRPC) working together with a Steering Committee comprised
Joint Base Lewis - McChord Leisure Travel Services (LTS) Price List - Hotels
 Price List - Hotels") Joint Base Lewis - McChord Leisure Travel Services (LTS) Price List - Hotels Lewis Main: 2272 Liggett Avenue (Inside Bowling Alley) McChord: 737 Joe Jackson Blvd (Inside Sounders Lanes) Ph: (253) 967-3085
Joint Base Lewis - McChord Leisure Travel Services (LTS) Price List - Hotels Lewis Main: 2272 Liggett Avenue (Inside Bowling Alley) McChord: 737 Joe Jackson Blvd (Inside Sounders Lanes) Ph: (253) 967-3085
GENERAL HOTELS CORPORATION. Delivering Comprehensive Hotel Management & Development For Over Fifty Years.
 GENERAL HOTELS CORPORATION Delivering Comprehensive Hotel Management & Development For Over Fifty Years. BOUT HC Comprehensive Hotel Management, Development & Consulting Headquartered in Indianapolis,
Prior to reviewing the various performances of Red Apple Transit, it is important to point out some key terminology, including:
 CHAPTER IV INTRODUCTION Chapter IV presents an overview of operations and financial information for Red Apple Transit. Information on the current system ridership is also presented. This information was
TRANSPORTATION PROGRAMS
 High Speed Transit Corridor Studies Rail/Freight Session 2011 ITE/MSA Spring Conference Black Canyon Conference Center Phoenix, Arizona March 9, 2011 The Maricopa Association of Governments (MAG) is the
Interstate 90 and Mercer Island Mobility Study APRIL Commissioned by. Prepared by
 Interstate 90 and Mercer Island Mobility Study APRIL 2017 Commissioned by Prepared by Interstate 90 and Mercer Island Mobility Study Commissioned by: Sound Transit Prepared by: April 2017 Contents Section
FORECASTING FUTURE ACTIVITY
 EXECUTIVE SUMMARY The Eagle County Regional Airport (EGE) is known as a gateway into the heart of the Colorado Rocky Mountains, providing access to some of the nation s top ski resort towns (Vail, Beaver
TransAction Overview. Introduction. Vision. NVTA Jurisdictions
 Introduction Vision NVTA Jurisdictions In the 21 st century, Northern Virginia will develop and sustain a multimodal transportation system that enhances quality of life and supports economic growth. Investments
Table of Contents. List of Tables
 Table of Contents 1. Introduction... 1 2. Service Recommendations... 1 A. Extend Service on Fort Belvoir to New Post Exchange/Commissary Complex... 1 B. Improve Service Frequencies on Sunday from Current
Implementation Guidelines and Performance Measures Special Transportation for Seniors and People with Disabilities (Paratransit) Program
 Program") FY 2019-20 FINAL December 2018 Implementation Guidelines and Performance Measures Special Transportation for Seniors and People with Disabilities (Paratransit) Program Implementation Guidelines These guidelines
FY 2019-20 FINAL December 2018 Implementation Guidelines and Performance Measures Special Transportation for Seniors and People with Disabilities (Paratransit) Program Implementation Guidelines These guidelines
Like many transit service providers, the Port Authority of Allegheny County (Port Authority) uses a set of service level guidelines to determine
 uses a set of service level guidelines to determine") Transit service consists of two fundamental elements: frequency (how often service operates) and service span (how long service runs during the day). Combined, these two factors measure how much service
Transit service consists of two fundamental elements: frequency (how often service operates) and service span (how long service runs during the day). Combined, these two factors measure how much service
Central Oregon Intergovernmental Council
 Central Oregon Intergovernmental Council Regional Transit Master Plan (RTMP) Technical Advisory Committee March 8, 2013 Agenda Introductions (5 min) Project Update (5 min) Updated Demand Estimates (5 min)
EL PASO COUNTY REGIONAL TRANSIT INSTITUTIONAL OPTIONS ASSESSMENT STUDY
 EL PASO COUNTY REGIONAL TRANSIT INSTITUTIONAL OPTIONS ASSESSMENT STUDY Sponsored by: El Paso County Funding Support: Texas Department of Transportation Technical Assistance to the County: Texas A&M Transportation
Overview of the Southern Nevada Convention and Meeting Segment
 Executive Summary Applied Analysis was retained by the Las Vegas Convention and Visitors Authority (the LVCVA ) to review and analyze the economic impacts associated with its various operations and southern