ORANGE COUNTY TRANSPORTATION AUTHORITY. Transit System Study Pilot Project Implementation Plans. Attachment A
|
|
|
- Mark Dixon
- 6 years ago
- Views:
Transcription
1 ORANGE COUNTY TRANSPORTATION AUTHORITY Transit System Study Pilot Project Implementation Plans Attachment A
2 ATTACHMENT A 1 Transit System Study Pilot Projects Implementation Plan Report May 25, 2012 Background New Service Concepts for Orange County Following the completion of the Transit System Study in December 2011, a group of potential pilot projects was selected to allow for evaluation of faster and more cost-effective services. The following recommendations from the TSS were advanced as potential pilot projects: Limited stop service on Harbor Blvd Intercounty Express on SR-22 Intracounty Express on SR-73 Route 70/90 Service Connection Improvement Same-day taxi service and station-based vans in limited zones Analysis of Alternatives For each pilot project concept several alternatives were evaluated to consider different routing and operating options. Order of magnitude estimates for operating cost, ridership, and revenue for each of the proposed pilot project alternatives were developed to assist in identifying a package of specific pilot project alternatives to implement within funding constraints. Following the identification of the most viable pilot alternatives additional refinement will occur to develop more precise implementation plans. Recommended pilot projects were selected based on screening using OCTA Board of Directors approved Guiding Principles which outlined key overall system goals. A full explanation of each alternative evaluated is provided in the appendix. Guiding Principles Implementation plans will be prepared for each proposed project. Each plan will include purpose and need, markets served, costs, projected revenues and ridership, start date based on resource availability, Title VI analysis (see below), and quantifiable metrics. Each implementation plan will include a proposed sunset date if goals (measured by quantifiable metrics) are not achieved.
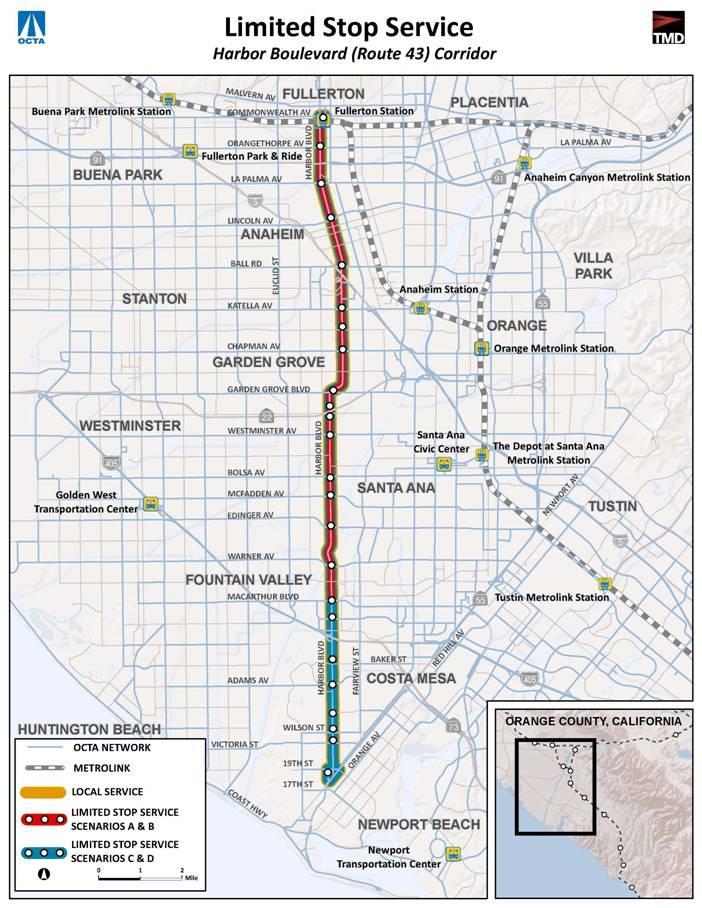
3 2 Each implementation plan will be constrained to the amount of Congestion Mitigation Air Quality (CMAQ) and other funds available for that service. To the extent possible, toll credits will be used to reduce federal matching fund requirements. A proposed project should contribute to an overall increase in the OCTA farebox recovery. Projects that generate new federal Section 5307 revenue for OCTA will be given a high priority for implementation purposes. New station vans proposed by local agencies, potentially funded with competitive Measure M2 funds, will be considered as part of the current Project S call for projects. Station van concepts proposed by OCTA will be considered for CMAQ or other funding sources. Recommended Pilot Projects Limited Stop Service on Harbor Boulevard Purpose and Need Purpose and Needs Route 43 operates local bus service on Harbor Boulevard from Costa Mesa to Fullerton and is the second busiest route in the OCTA system with over 13,000 weekday boardings 1.As discussed in the TSS Market Assessment, Route 43 operates through the core market area along a key linear network corridor with development patterns supportive of transit ridership generation. Additional future development along the corridor will strengthen the demand for transit service. Corridors with sufficient density and a mix of activity centers are strong candidates for transit investment. Offering more frequent service with faster travel times will increase the attractiveness of service to all market segments, both inducing additional use by existing riders and encouraging new riders to begin using the service. Harbor Boulevard represents a dominate north-south network spine in the OCTA network. Route 43 s highly productive service performance of over 50 passengers per revenue vehicle hour, the second most productive route in the system, illustrates the strength of the market for transit along the corridor. 2 Given existing high performance, additional service investment is warranted. While current local service operates every 15 minutes, a historic precedent for higher service frequencies along the corridor existed prior to recent service reductions. Providing a high quality transit service with higher frequencies and with faster travel times supports development of sustainable communities and proves mobility options for residents and employees. The existing strong performance of Route 43 suggests that service investments will generate additional ridership and revenue, and improve the travel experience for a full 7% of current OCTA riders by 1 OCTA On-Board Ride Check Reports used in Transit System Study 2 OCTA On-Board Ride Check Reports
4 3 providing additional trip options, less passenger waiting time, and faster overall travel times. The high financial effectiveness of Route 43, over 40% of the costs of service provision are recovered through fare revenue, indicates that investments in the route would support OCTA s system-wide farebox recovery. 3 Markets Served Existing riders on Harbor Blvd, improve retention and induce additional trips Existing riders on parallel lines making network based trips New riders including workers and residents Corridor companies Alternatives Considered A selection of alternatives was considered based two different alignments and four possible service levels. Alignment 1: Limited stop bus service from Fullerton Transportation Center to Costa Mesa (Triangle Square) via Harbor, with supporting Local service from Fullerton Transportation Center to Newport Beach. Alignment 2: Limited stop service from Fullerton Transportation Center to MacArthur via Harbor, with supporting Local service from Fullerton Transportation Center to Newport Beach. Service Level 1: Maintain existing local service at 15 minute frequency, add limited stop overlay with 10 minute all day frequency. Span: 4AM to 1AM. Service Level 2: Maintain existing local service at 15 minute frequency, add peak only limited stop overlay with 10 minute frequency. Span: 6AM to 9AM, 3PM to 6PM. Service Level 3: As part of phased approach, adjust local frequency to 20 minutes, add limited stop overlay with 10 minute peak frequency and 15 minute off-peak frequency. Span: 5AM to 6PM. Service Level 4: As part of phased approach, adjust local frequency to 30 minutes, add limited stop overlay with 10 minute frequency. Span: 4AM to 1AM. Recommended Alternative The new service would operate weekdays at a ten minute peak and 15 minute off-peak frequency between Fullerton Transportation Center and MacArthur Blvd. The existing local bus service would be reduced to a 20 minute frequency along the entire route (cities of Fullerton to Costa Mesa). 3 OCTA On-Board Ride Check Reports
5 4
6 5 Cost and Revenue This service would use the local fare. Limited Stop Service on Harbor Boulevard YEAR 1 YEAR 2 YEAR 3 YEAR 4 Cost Operating Cost $1,848,000 $1,879,000 $1,952,000 $2,003,000 Marketing & Survey Costs $100,000 $100,000 $0 $0 Capital Costs $200,000 $0 $0 $0 Total Cost $2,148,000 $1,979,000 $1,952,000 $2,003,000 Revenue Fare Revenue $753,000 $941,000 $941,000 $941,000 Capital Revenue (5307) $0 $0 $150,000 $150,000 Total Revenue $753,000 $941,000 $1,091,000 $1,091,000 Ridership Projection At the end of the first year of service ridership is projected to be an additional 845,000 boardings on the corridor. Resource Requirement Operation of this pilot project would require an additional 12 peak vehicles. Marketing Plan Marketing and outreach will play a key role in evaluating the outcomes of limited stop service implementation on Harbor Boulevard. Information Gathering: The initial stage of the process will consist of information gathering. First, the marketing team should work to build a clear understanding of the market along the corridor including identification of major employers and a review of significant origindestination patterns. Before Survey: A detailed survey should be conducted of existing ridership along the corridor to capture travel patterns, demographic profiles, and perceptions of existing service. Develop Brand Differentiation: Following the information gathering stage, a brand differentiation for the limited stop service should be created. Highlight Stops: Stops for the limited stop service may benefit from a specific marker that increases visibility and communicates the improved service levels to the customer, ideally visible from a distance.
7 6 Introductory Marketing: As limited stop service is set to begin an introductory marketing effort should occur on several levels including in-vehicle ads, outreach materials to employers, and digital information sharing. After Survey: Following implementation, the before survey should be administered again. Comparison of the results between the before and after surveys will aid in the evaluation of the pilot project, especially the changes in customer travel behavior and perceptions of the service. Continuing Marketing: During the pilot period, the marketing efforts should also be conducted with a pilot approach. The limited stop service does not represent a fully finished enhanced transit product. Therefore, marketing capacity should be reserved to allow for additional promotion of the eventual finished product. Future Investment Phase I: The initial phase includes vehicle and stop branding to differentiate the limited-stop service product. During the initial phase operation of the limited stop service can be fine tuned. Fine tune running times and schedules to capitalize on recently implemented corridor signal optimization. Phase II: After limited stop service has become more established stop infrastructure improvements could occur including investments to improve shelters, real time information, and off-vehicle fare payment. Also during this phase upgrades to specific stops may occur including sidewalk reconfiguration and improvement, selected repaving, and relocation of specific stops to optimize operational efficiency. Phase III: The final phase could include major street infrastructure improvements including possible bus bypass lanes, bus bulbs, and general street improvements to improve the flow of both transit and general traffic. As limited stop service begins to transition to BRT service bus signal priority should be implemented to further improve travel times for transit customers. Project Schedule Before customer survey in Fall 2012 June 2013 Start Date After customer survey in Spring 2014
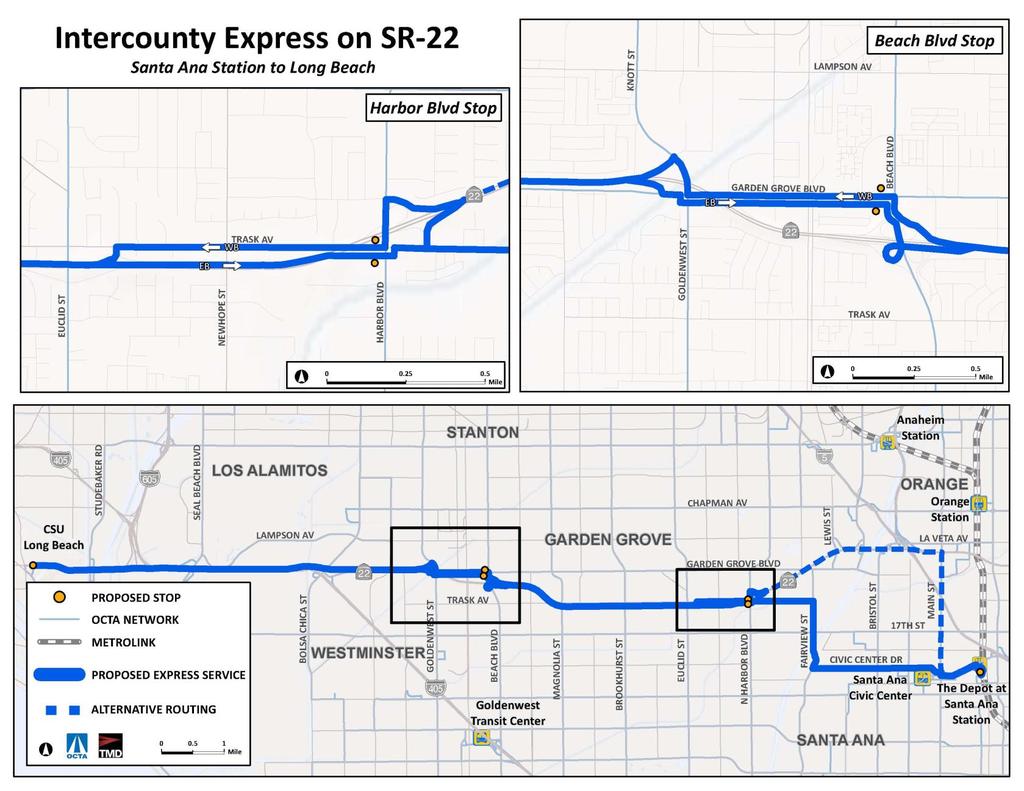
8 7 Intercounty Express on SR-22 Purpose and Need State Route 22 (SR-22) provides east-west connectivity across Orange County between Long Beach and Orange, carrying traffic volumes of approximately 200,000 vehicles each day. While OCTA routes 50 and 60 provide local bus service parallel to SR-22, a transit-based alternative to private vehicle travel along the SR-22 corridor currently does not exist. Existing local bus service is not time competitive with private vehicle travel on SR-22 for longer distance trips. Implementation of express bus service on SR-22 would provide a more time competitive alternative travel option during peak periods. A SR-22 express with several intermediate stops at intersections with key arterial corridors will boost network effectiveness, providing better connectivity and faster travel times. The express service would provide an east-west network complement to the north-south role Metrolink provides. In addition, faster travel into Long Beach offers Orange County residents and employees better access to Los Angeles County via connections with other transit providers. A pilot express route would demonstrate the viability of further transit investment on the corridor and development of a fast, all day east-west network connection. Markets Served Reviewing existing customer travel patterns, including existing transfer activity at proposed express stops, will be key to identifying potential customers for the pilot service. Existing riders on Route 60 traveling to/from Long Beach or Santa Ana, or who may transfer to Routes 29,43,57, or 53. Existing riders on Route 60 with travel to/from Long Beach or Santa Ana and transfer from Routes 29, 43, 57, or 53. New riders traveling to/from Long Beach or Santa Ana New riders making an east-west connection between Route 29, 43, 57, or 53. Alternatives Considered Five distinct service level alternatives were evaluated on a common alignment. Service Level 1: 3 roundtrips in each peak period for a total of 6 daily roundtrips. Span: 6AM to 9AM, 3PM to 6PM. Service Level 2: 6 roundtrips in each peak period for a total of 12 daily roundtrips and approximately 30 minute peak frequency. Span: 6AM to 9AM, 3PM to 6PM. Service Level 3: Peak service at 30 minute frequency and midday service at 60 minute frequency for a total of 18 daily roundtrips. Span: 6AM to 6PM. Service Level 4: Peak and midday service at 30 minute frequency for a total of 24 daily roundtrips. Span: 6AM to 6PM.
9 8 Service Level 5: Peak service at 15 minute frequency and midday service at 30 minute frequency for a total of 36 daily roundtrips. Span: 6AM to 6PM. Recommended Alternative The route would connect the Depot at Santa Ana to the City of Long Beach (7 th Street and Channel Drive) via SR-22. There would be intermediate stops at Harbor Boulevard and Beach Boulevard. Bi-directional service would be provided weekdays every 30 minutes during the AM and PM peak periods.
10 9
11 10 Cost & Revenue This pilot will have an Intercounty fare as it provides service to Los Angeles County. This route would bring in new Section 5307 Fixed-Guideway funding if high-occupancy vehicle lanes remain an eligible facility. Cost Intercounty Express on SR 22 YEAR 1 YEAR 2 YEAR 3 YEAR 4 Operating Cost $539,000 $548,000 $569,000 $584,000 Marketing & Survey Costs $50,000 $50,000 $0 $0 Capital Costs $5,000 $0 $0 $0 Total Cost $594,000 $598,000 $569,000 $584,000 Revenue Fare Revenue $155,000 $194,000 $194,000 $194,000 Capital Revenue (5307) $0 $0 $349,000 $349,000 Total Revenue $155,000 $194,000 $543,000 $543,000 Ridership Projection At the end of the first year of service ridership is projected to be 52,000 annual boardings. Resource Requirement Operation of this pilot project would require 4 peak vehicles. Marketing Plan The key role for marketing on the SR-22 express will be raising the awareness of the service product. As a result of budget constraints, the pilot project on SR-22 represents a scaled back version of the original TSS proposal and thus the marketing approach should reflect this adjustment so as not to oversell the product offered. Introductory Network Marketing: Given the importance of network connections to the operation of the express service on SR-22, network level marketing on connecting routes will be key. Interior bus cards promoting the service should be placed on at least Routes 60, 43, and 29. The advertisements should advise riders of the travel time advantage of the service compared to existing travel on Route 60. Additionally, printed marketing should be deployed at the proposed stops for the express service advising riders of the additional new travel option. Destination Outreach: Efforts should be made to build awareness of the express service among likely destinations in Long Beach and Santa Ana. Marketing staff can provide marketing materials to key employers and other destinations.
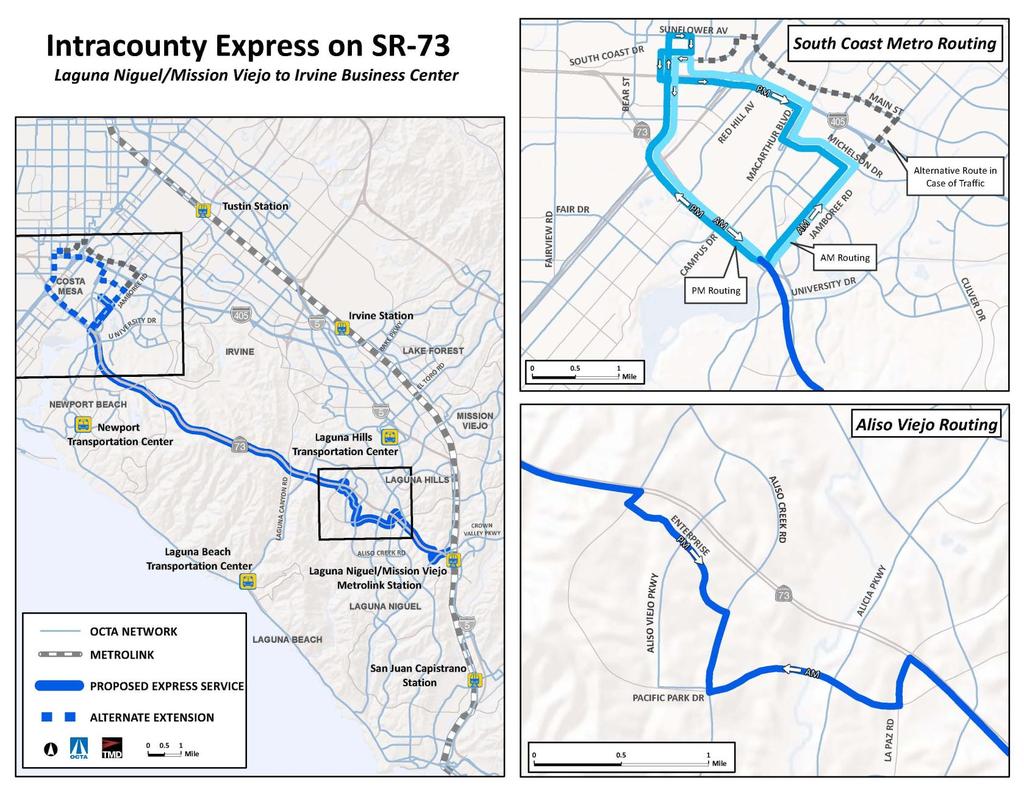
12 11 Project Schedule Defer implementation until after new HOV-to-HOV connection from SR-22 to I-405 is completed Confirm Fixed-Guideway Funding Projected January 2014 start date Intracounty Express on SR-73 Purpose and Need State Route 73 is a toll road that runs between Costa Mesa and San Juan Capistrano, interchanging with Interstate 405 in the north and Interstate 5 in the south. SR-73 provides additional connectivity from South Orange County s residential growth to jobs located in the central and northern parts of the county. The predominate development patterns in Laguna Niguel, Laguna Hills, Mission Viejo, and Aliso Viejo areas surrounding SR-73 are largely auto-centric, creating a travel market with expectations for direct, fast transportation. Despite strong travel patterns connecting origins along the corridor to the Irvine Business Complex, a direct, competitive transit service does not currently exist on the SR-73 corridor. A park-and-ride based express bus service would offer a competitive travel alternative along the corridor connecting residential areas in the south to concentrations of employment in the Irvine and Costa Mesa areas. A direct, focused express service would prove more competitive than the existing transit options which necessitate multiple trip segments and out of direction movements. Effective express bus service into Irvine will promote sustainable community initiatives currently planned in Orange County by providing employees and residents a viable transit option for their main commute, establishing the opportunity for further transit-based travel during the day. Additionally, the express service can provide a first/last mile connection to/from the Laguna Niguel/Mission Viejo Metrolink station. Markets Served Employees along the planned route including significant concentrations of employees in the IBC and South Coast Plaza employment areas. Alternatives Considered Two alignments alternatives were considered, both with common south portions of the route. Two difference service level alternatives were also considered with each alignment alternative. Alignment 1: IBC Only o Northbound approach IBC on SR-73 exit Macarthur Blvd, turn right on Jamboree Rd, left on Michelson Dr, and left on MacArthur Blvd to SR-73 to start deadhead trip. o PM Peak: Deadhead trip approach IBC on SR-73 exit MacArthur Blvd, right turn on Michelson Dr, right on Jamboree Rd, and left on MacArthur Blvd to SR-73 to start southbound trip. Alignment 2: IBC/South Coast Metro
13 12 o o AM Peak: Northbound peak direction exit Macarthur Blvd, turn right on Jamboree Rd, left on Michelson Dr, and right on MacArthur Blvd to northbound I-405. From I-405 exit Anton Blvd and make one stop before starting southbound. Southbound non-peak from Anton Blvd turn left on Bristol St and continue to SR-73 for deadhead trip. PM Peak: Northbound non-peak direction exit SR-73 at Bristol St and travel north to right turn on Sunflower Ave, right on Avenue of the Arts, and right onto Anton Blvd and make one stop before starting southbound. Southbound peak direction from Anton Blvd turn left on Bristol St, take southbound I-405, exit MacArthur Blvd, turn left on Michelson Dr, right on Jamboree Rd, left on MacArthur Blvd to SR-73. Alternative alignment to avoid traffic on I- 405 using Main St to Sunflower to Anton Blvd. Service Level 1: 2 peak period trips. Span: 6AM to 8AM, 3PM to 5PM. Service Level2: 6 peak period trips for an approximate 30 minute peak direction frequency. Span: 6AM to 9AM, 3PM to 6PM. Recommended Alternative This route would provide peak-direction service from the Laguna Niguel/Mission Metrolink Station to the Irvine Business Complex and South Coast Metro employment centers. There would also be an intermediate stop in the Aliso Viejo Town Center area. This service would have two peak-direction trips in the AM & PM.
14 13
15 14 Cost & Revenue This service would use the local fare. Intracounty Express on SR 73 YEAR 1 YEAR 2 YEAR 3 YEAR 4 Cost Operating Cost $107,000 $109,000 $113,000 $116,000 Marketing & Survey Costs $25,000 $0 $0 $0 Capital Costs $5,000 $0 $0 $0 Total Cost $137,000 $109,000 $113,000 $116,000 Revenue Fare Revenue $22,000 $28,000 $28,000 $28,000 Capital Revenue (5307) $0 $0 $38,000 $38,000 Total Revenue $22,000 $28,000 $66,000 $66,000 Ridership Projection At the end of the first year of service ridership is projected to be approximately 20,000 annual boardings. Resource Requirement Operation of this pilot project would require 2 peak vehicles. Marketing Plan The express service on SR-73 will be heavily commute-oriented and the marketing approach should match. Building awareness of the service will largely be accomplished through direct outreach to destinations on the route. Marketing staff should directly contact employers along the route and offer marketing materials. The materials provided should include information the employer can pass directly onto employees including posters, new schedules/maps, and digital formats to post on company websites. Marketing efforts should capitalize on OCTA s existing website and other internet-based information sharing platforms. Additional marketing efforts can include outreach to existing riders of Route 490 and Metrolink riders traveling to the IBC area. In addition, conducting a survey will aid in the evaluation of the pilot project, especially in understanding customer travel behavior and perceptions of the service. Project Schedule Work with City to determine PNR location in Aliso Viejo October 2013 start date
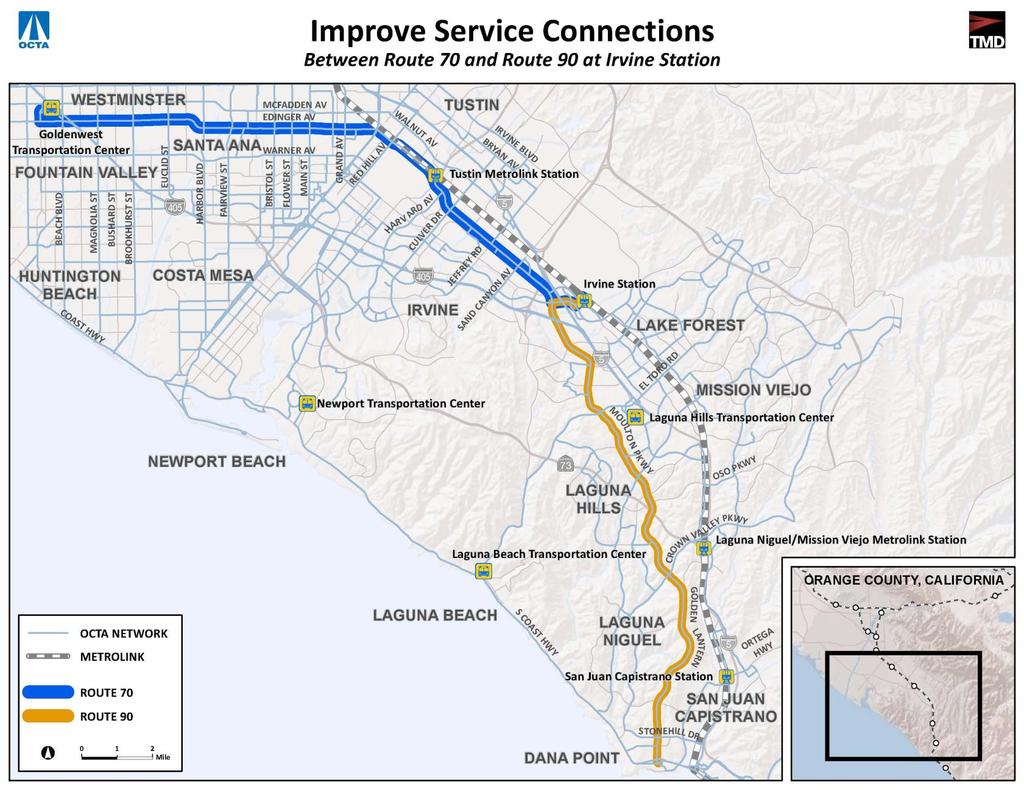
16 15 Route 70/90 Service Connection Improvement Purpose and Need Route 70 operates from Sunset Beach to Tustin via Edinger Avenue, connecting the core transit market areas of Santa Ana, Fountain Valley, and Westminster with the emerging core areas of Tustin and Irvine. Route 90 connects Tustin to Dana Point via Irvine Center/Moulton/Golden Lantern, providing important connections with Tustin and Irvine. While routes 70 and 90 currently connect at Tustin station, stop-bystop ridership analysis suggests a relocation of the transfer point further south would improve the travel experience for a significant number of riders. Existing ridership patterns suggest many riders who transfer between the routes have either recently boarded heading north or will alight soon after transferring heading south. Shifting the transfer point south to Irvine station would provide more one seat trips for customers connecting to and from the core market area. Additionally, reorienting the transfer point recognizes the intention to expand the role of transit in the Tustin and Irvine areas and will provide better connectivity to the core network for both residents and employees traveling between the two areas. Markets Served Existing riders on Routes 70 and 90 who currently transfer between the two routes. Alternatives Considered Two alignment alternatives were considered for the adjusted transfer point, while service levels remained unchanged from existing. Alignment 1 Irvine Station: Shift transfer point from Tustin Station to Irvine Station. o Route 70: from Tustin Station operate on Irvine Center Dr to Alton Pkwy to Ada to Irvine Station. o Route 90: North on Irvine Center to Alton Pkwy to Ada to Irvine Station. o Option to deviate into Irvine Spectrum via Spectrum. Alignment 2 Irvine Center & Bunsen: Shift transfer point from Tustin Station to Irvine Center Dr & Research Dr/Bunsen. o Route 70: from Tustin Station operate on Irvine Center Dr to left on Research Dr to right on Bunsen, layover here. o Route 90: Operate on Irvine Center to right on Research Dr to right on Bunsen, layover here.
17 16
18 17 Recommended Alternative The route was split into 70 and 90 with a connection at Tustin Station. Ridership analysis and customer comments have indicated that the Irvine Spectrum area would be a better location for this connection to occur. In this change, Route 70 will be extended to Irvine Station and Route 90 will also end there. This will provide a better connection to Irvine Valley College and to Metrolink service at Irvine Station. Cost & Revenue This change can be made within the existing resources and budget. This service will continue to use the local fare. Ridership Projection The ridership impact of the shift of the transfer point for Routes 70/90 is estimated to be neutral. Resource Requirement Operation of this pilot project would not require additional vehicles. Marketing Plan Marketing the improved service connections between Routes 70 and 90 should focus more on education efforts for existing riders. Deploying printed materials on both routes and at impact stop locations will assist in raising customer awareness. Additionally, just prior to and immediately after the service change having staff on hand at both the new and old transfer points may assist in alleviating any customer confusion. Project Schedule October 2012 Start Date
19 18 Station Van Connections and Same Day Taxi Areas Purpose and Need Purpose and Needs As identified in the TSS Market Assessment findings, communities with low population and employment densities and a lack of major activity centers hinder the potential for successful, cost-effective regular transit services. The challenge is compounded by auto-centric node based development patterns which encourages automobile use over transit and other sustainable modes. In these communities traditional fixed-route transit does not provide a competitive or efficient travel option. The TSS Service Evaluation identified several poor performing local routes operating in environments not conducive to regular transit. The TSS recommended two cost-effective alternative service options, station/transit center based vanpools and same day taxi zones. By demonstrating the effectiveness of substituting lower cost service for more expensive fixed-route service in low performance areas, while still providing network connectivity in areas lacking sufficient residential origins or employment destinations to justify fixed route service, OCTA can work to better match service intensity to the demand for transit services. Markets Served Taxi: Riders on existing local routes Station Van: Employees currently traveling from a station or transit center to a place of employment with in the proposed zones Alternative to Discontinued Service A key element of the TSS was the replacement of underperforming service with lower cost service options, balancing service accessibility with financial effectiveness considerations. In order to realize the operating cost savings from the service substitution the existing underperforming services must be eliminated concurrently with the implementation of the lower cost replacements. A group of routes in the Rancho Santa Margarita, Aliso Viejo, Laguna Niguel, and Mission Viejo areas were selected as pilots to demonstrate the service substitution concept. The pilots may be implemented separately on a route by route basis or in groups. Potential Implementation Areas The following routes were identified as candidates for complete or partial replacement. For each route a replacement zones was developed to indicate the operational boundaries of the proposed pilot replacement services. Route 82: Eliminate service south to Saddleback College, The Shops at Mission Viejo, and the Laguna Niguel/Mission Viejo Metrolink station. Route would now serve Foothill Ranch Towne Center to Santa Margarita/Plano Trabuco via Santa Margarita.
20 19 Route 85: Eliminate service south of Alicia Pkwy & Crown Valley Pkwy to Dana Point. Route would now serve Portola Plaza to Alicia Pkwy & Crown Valley Pkwy via Marguerite and Crown Valley Pkwy. Route 87: Eliminate Service Route 187: Eliminate Service Route 490: Eliminate Service Description of Station Van Program The station vanpools will provide a tailored connection from key hubs and selected Metrolink stations to destinations where fixed route service is not viable. The proposed station vanpool is similar to regular ridesharing vanpools where the vans are driven by volunteer program participants with two differences: a) the vanpool originates and/or ends at a transit center or Metrolink Station; and b) the vanpool may allow for on-demand or occasional use. Station vans provide a more efficient, direct, and competitive method of serving dispersed, low intensity activity centers. Description of Same-Day Taxi Program The subsidized taxi replacement service will provide a set level of OCTA-funded subsidy per trip for customers traveling via private taxi services within a defined zone. As part of the arrangement OCTA would subsidize a portion of the customer s taxi trip, up to $5.00 per trip. The same day taxi program initiated as a cost savings strategy for ACCESS service has proven very successful, this pilot project proposes the targeted expansion of the program to the general public. Recommended Programs As part of the pilot projects, OCTA is developing a program for station vans which would be offered to riders of existing OCTA StationLink bus routes. In order to meet the productivity measures of the Guiding Principles, these routes would need to be eliminated or restructured when the new station vans were implemented. Offering the same-day taxi service prior to eliminating bus service also does not meet the productivity requirements in the Guiding Principles. This concept will should be further developed should any bus service reductions be necessary in the future. OCTA should continue to analyze any operational or policy issues prior to implementing this replacement service.
21 20 Cost & Revenue In order to realize the operating cost savings from the service substitution the existing underperforming services must be eliminated concurrently with the implementation of the lower cost replacements. Cost Station Van YEAR 1 YEAR 2 YEAR 3 YEAR 4 Operating Cost $120,000 $122,000 $127,000 $130,000 Marketing & Survey Costs $25,000 $25,000 $25,000 $0 Capital Costs $0 $0 $0 $0 Total Cost $145,000 $147,000 $152,000 $130,000 Revenue Fare Revenue TBD TBD TBD TBD Capital Revenue (5307) $0 $0 $12,000 $12,000 Total Revenue TBD TBD TBD TBD Marketing Plan Marketing efforts for both the station vans and same day taxi areas should be conducted in a highly focused manner to tailor the message to a specific market. For station vans direct marketing to employers in the proposed zones will best target the audience, including providing posters and digital format data to post on company websites. Marketing in same day taxi areas should focus solely on informing existing riders of the alternative service option available, and not marketing the service to new riders.
22 21 Key Performance Measure and Sunset Provisions With a renewed focus on service performance stemming from the Transit System Study, performance monitoring for the pilot projects will be key to ensuring successful implementation and evaluation. Key performance indicator targets and milestone dates will provide OCTA staff critical evaluation metrics for the pilot projects, while the sunset date ensures that underperforming service does not continue operation past the pilot phase. To ensure a consistent approach, all pilot projects will be held to the same key performance indicator targets, performance target milestone dates, and target sunset dates. By the end of the pilot period all service should positively contribute to overall system performance. Key Performance Indicator Targets Throughout the pilot period, each service s performance should be evaluated based on key performance indicators. Close monitoring of performance will provide greater opportunity to fine tune services during the implementation phase, evaluate performance, and provide key lessons learned at the conclusion of the pilot period. The ultimate target for each key performance indicator is meeting or exceeding the systemwide average. New services, including the pilot projects, should positively contribute to overall systemwide performance. As a point of reference existing system averages, as of January 2012, are provided below. Key Performance Indicator Targets Performance Indicator Existing Fixed Route Averages Boardings per revenue vehicle hour (Local) 34.4 (Local) Boardings per trip (Intracounty Express) 21.5 (Express) Boardings per trip (Intercounty Express) 15.1 (Express) Farebox recovery ratio 22.3% Subsidy per boarding $ 2.94 Performance Indicator Targets Composite Score A composite of the performance indicators will be employed to evaluate the overall performance of each pilot project. For each performance indicator a score will be assigned based on the percentage of the systemwide average it achieves, a score above 100% is permissible given higher than average performance. Following the scoring of each performance indicator an average composite score of all key indicators will be calculated. This average then becomes the overall score on which to evaluate the pilot project. The limited-stop service will be evaluated using the net change along the Harbor Blvd corridor. Performance Target Milestone Dates Immediate obtainment of the performance targets by a new service is not expected, rather the expectation of meeting the standard targets will be phased over the pilot period. Performance target milestone dates allow for the pilot service to gradually achieve the specified performance targets.
23 22 Six months: 50% average composite score One year: 75% average composite score Two years: 100% average composite score Target Sunset Dates A two tier approach for sunset dates is proposed with an initial review at the end of the first year and a final review at the end of two years. At the end of the two year pilot period the service must meet the key performance indicator targets. Throughout the pilot period OCTA staff will review service performance at least once per quarter using the key performance indicators. Year One Review At the end of the first year of the pilot project, OCTA staff should prepare a report to the board of directors outlining the service s performance and adherence to the performance targets during the prior year. Depending on the results of the performance review and the Authority s discretion several actions can be taken: Continue trial for the remaining year of the pilot period Take corrective action to address deficient service performance: o Service changes including adjustments to alignment, trip times, frequency, and stops o Additional/modified marketing approach o Conduct survey to screen for unseen flaw Eliminate service if performance is substantially underperforming Year Two Review By the end of the second year of the pilot period the service should meet all of the key performance indicator targets. After a second annual performance review the following actions can be taken: End pilot period and continue service as a full member of the system End pilot period and eliminate service Limited extension of pilot period given specific reason or extenuating circumstances Year Three Following the decision point at the end of the second year to continue or discontinue the pilot service, the third year may be used as a wind-down period to transition a discontinued service out of operation.
24 23 Operation Plan Operating Cost Calculation Methodology The costing process uses round trip running times, plus 15% layover to generate a cycle time for each time period, which in conjunction with the proposed frequency calculates the vehicle requirements and in turn the revenue hours. Revenue miles are derived using the total number of one-way trips and the one-way trip distances. The operating resource requirements were converted into operating costs by applying unit costs of $77.60 per revenue hour and $6.52 per revenue mile. The total operating cost is calculated using a weighted approach with revenue hours accounting for 70% of total operating cost and revenue miles accounting for 30% of total operating cost. The operating cost for Years 2, 3, & 4 were increased based on the projected CPI. Estimated Vehicle Requirements Pilot project estimated vehicle requirements were calculated based on roundtrip cycle time and proposed service frequency. Ridership and Revenue Estimation Approach The projected ridership represents the anticipated initial ridership based on existing ridership on comparable routes or origin-destination patterns. For a pilot project to be successful the initial projected ridership must grow into the performance target ridership. Estimated revenue was derived by applying an average local fare of $0.89 per boarding 4 to the ridership estimates for all pilot projects except Intercounty Express on SR-22 which used $2.90 per boarding. The revenue was increased by 25% in Years 2, 3, & 4 based on the proposed fare increase. Other Capital Costs Minor capital costs are anticipated as part of the pilot projects including costs related to stops, minor street modifications, and other physical infrastructure. As specific candidate pilot project scenarios are identified further refinement to the capital costs will occur. 4 OCTA Average Fare Data
25 24 Operating Cost Service YEAR 1 YEAR 2 YEAR 3 YEAR 4 Limited Stop Service on Harbor Boulevard $1,848,000 $1,879,000 $1,952,000 $2,003,000 Intercounty Express on SR 22 $539,000 $548,000 $569,000 $584,000 Intracounty Express on SR 73 $107,000 $109,000 $113,000 $116,000 Route 70/90 Service Connection Improvement $0 $0 $0 $0 Station Van $120,000 $122,000 $127,000 $130,000 Additional Street Supervision $100,000 $102,000 $106,000 $0 Total $2,714,000 $2,760,000 $2,867,000 $2,833,000 Marketing & Survey Costs Service YEAR 1 YEAR 2 YEAR 3 YEAR 4 Limited Stop Service on Harbor Boulevard $100,000 $100,000 $0 $0 Intercounty Express on SR 22 $50,000 $50,000 $0 $0 Intracounty Express on SR 73 $25,000 $0 $0 $0 Route 70/90 Service Connection Improvement $0 $0 $0 $0 Station Van $25,000 $25,000 $25,000 $0 Total $200,000 $175,000 $25,000 $ 0 Capital Costs Service YEAR 1 YEAR 2 YEAR 3 YEAR 4 Limited Stop Service on Harbor Boulevard $200,000 $0 $0 $0 Intercounty Express on SR 22 $5,000 $0 $0 $0 Intracounty Express on SR 73 $5,000 $0 $0 $0 Route 70/90 Service Connection Improvement $0 $0 $0 $0 Station Van $0 $0 $0 $0 Same-Day Taxi $0 $0 $0 $0 Total $210,000 $0 $0 $0 Total Cost $3,124,000 $2,935,000 $2,892,000 $2,833,000
26 25 Fare Revenue Service YEAR 1 YEAR 2 YEAR 3 YEAR 4 Limited Stop Service on Harbor Boulevard $753,000 $941,000 $941,000 $941,000 Intercounty Express on SR 22 $155,000 $194,000 $194,000 $194,000 Intracounty Express on SR 73 $22,000 $28,000 $28,000 $28,000 Route 70/90 Service Connection Improvement $0 $0 $0 $0 Station Van $0 $0 $0 $0 Total $930,000 $1,163,000 $1,163,000 $1,163,000 Funding Plan YEAR 1 YEAR 2 YEAR 3 YEAR 4 Net Cost $2,194,000 $1,772,000 $1,729,000 $1,670,000 CMAQ Funded $2,194,000 $1,772,000 $1,729,000 $0 CURE Funded (Station Van) $0 $0 $0 $130,000 OCTD Funded $0 $0 $0 $1,540,000 Total CMAQ Eligible Expenses (3 Year) $5,695,000 Additional FTA Capital Revenue (5307) Service YEAR 1 YEAR 2 YEAR 3 YEAR 4 Limited Stop Service on Harbor Boulevard $0 $0 $150,000 $150,000 Intercounty Express on SR 22 $0 $0 $349,000 $349,000 Intracounty Express on SR 73 $0 $0 $38,000 $38,000 Route 70/90 Service Connection Improvement $0 $0 $0 $0 Station Van $0 $0 $12,000 $12,000 Total $0 $0 $549,000 $549,000
27 Implementation Schedule 26
Att. A, AI 46, 11/9/17
 Total s San Diego Metropolitan Transit System POLICY 42 PERFORMANCE MONITORING REPORT Page 1 of 6 Date: 11/8/17 OBJECTIVE Develop a Customer-Focused and Competitive System The following measures of productivity
Date: 11/6/15. Total Passengers
 Total San Diego Metropolitan Transit System POLICY 42 PERFORMANCE MONITORING REPORT Page 1 of 6 OBJECTIVE Develop a Customer-Focused and Competitive System The following measures of productivity and service
SAMTRANS TITLE VI STANDARDS AND POLICIES
 SAMTRANS TITLE VI STANDARDS AND POLICIES Adopted March 13, 2013 Federal Title VI requirements of the Civil Rights Act of 1964 were recently updated by the Federal Transit Administration (FTA) and now require
Chapter 3. Burke & Company
 Chapter 3 Burke & Company 3. WRTA RIDERSHIP AND RIDERSHIP TRENDS 3.1 Service Overview The Worcester Regional Transit Authority (WRTA) provides transit service to over half a million people. The service
METROBUS SERVICE GUIDELINES
 METROBUS SERVICE GUIDELINES In the late 1990's when stabilization of bus service was accomplished between WMATA and the local jurisdictional bus systems, the need for service planning processes and procedures
DEMOGRAPHICS AND EXISTING SERVICE
 EXECUTIVE SUMMARY The Central Corridor light-rail transit (LRT) project will open in 2014 and operate between downtown Minneapolis and downtown St. Paul, serving the University of Minnesota and University
About This Report GAUGE INDICATOR. Red. Orange. Green. Gold
 ATTACHMENT A About This Report The Orange County Transportation Authority (OCTA) operates a countywide network of local, community, rail connector, and express bus routes serving over 6, bus stops. OCTA
RACINE COUNTY PUBLIC TRANSIT PLAN:
 RACINE COUNTY PUBLIC TRANSIT PLAN: 2013-2017 Recommended Transit Service Improvement Plan NEWSLETTER 3 SEPTEMBER 2013 This newsletter describes the final recommended public transit plan for the City of
LA Metro Rapid - Considerations in Identifying BRT Corridors. Martha Butler LACMTA, Transportation Planning Manager Los Angeles, California
 LA Metro Rapid - Considerations in Identifying BRT Corridors Martha Butler LACMTA, Transportation Planning Manager Los Angeles, California LA Metro Transportation planner/coordinator, designer, builder
8 CROSS-BOUNDARY AGREEMENT WITH BRAMPTON TRANSIT
 8 CROSS-BOUNDARY AGREEMENT WITH BRAMPTON TRANSIT The Transportation Services Committee recommends the adoption of the recommendations contained in the following report dated May 27, 2010, from the Commissioner
Metrolink Service Expansion Program
 Rail and Facilities Program Update Metrolink Service Expansion Program Fullerton Turnback Facility 23.90 Laguna Niguel Turnback Facility 28.20 New Control Points & Signals Anaheim Layover Facility 18.30
SRTA Year End Fixed Route Ridership Analysis: FY 2018
 SRTA Year End Fixed Route Ridership Analysis: FY 2018 2018 Contents Introduction... 1 A. Key Terms Used in this Report... 1 Key Findings... 2 A. Ridership... 2 B. Fare Payment... 4 Performance Analysis
Transform66 Transportation Management Plan: Transit & TDM Strategies
 Transform66 Transportation Management Plan: Transit & TDM Strategies Commuter Connections Committee November 15, 2016 1 Transforming I-66 A short introduction. http://outside.transform66.org/meetings/video_recordings.asp
ORANGE COUNTY TRANSPORTATION AUTHORITY. Go Local Fixed-Guideway Program History and Project Update. PowerPoint 3
 ORANGE COUNTY TRANSPORTATION AUTHORITY Go Local Fixed-Guideway Program History and Project Update PowerPoint 3 Santa Ana-Garden Grove Fixed Guideway Project OCTA Board of Directors September 26, 2011 Project
APPENDIX B COMMUTER BUS FAREBOX POLICY PEER REVIEW
 APPENDIX B COMMUTER BUS FAREBOX POLICY PEER REVIEW APPENDIX B COMMUTER BUS FAREBOX POLICY PEER REVIEW The following pages are excerpts from a DRAFT-version Fare Analysis report conducted by Nelson\Nygaard
Development of SH119 BRT Route Pattern Alternatives for Tier 2 - Service Level and BRT Route Pattern Alternatives
 Development of SH119 BRT Route Pattern Alternatives for Tier 2 - Service Level and BRT Route Pattern Alternatives June 1, 2018 Development of SH119 BRT Route Pattern Alternatives for Tier 2 - Service Level
2018 Service Changes Ada County
 2018 Service Changes Ada County System Benefits 15 minute headways on State Street during peak hours o 30 minutes on Saturdays 30 minute headways on Emerald all day on weekdays More frequent and direct
APPENDIX 2 TORONTO TRANSIT COMMISSION SERVICE STANDARDS AND DECISION RULES FOR PLANNING TRANSIT SERVICE
 APPENDIX 2 TORONTO TRANSIT COMMISSION SERVICE STANDARDS AND DECISION RULES FOR PLANNING TRANSIT SERVICE Contents 1 Introduction... 1 2 Network Design Standards... 2 2.1 Transit Service Classifications...
Interstate 90 and Mercer Island Mobility Study APRIL Commissioned by. Prepared by
 Interstate 90 and Mercer Island Mobility Study APRIL 2017 Commissioned by Prepared by Interstate 90 and Mercer Island Mobility Study Commissioned by: Sound Transit Prepared by: April 2017 Contents Section
TransAction Overview. Introduction. Vision. NVTA Jurisdictions
 Introduction Vision NVTA Jurisdictions In the 21 st century, Northern Virginia will develop and sustain a multimodal transportation system that enhances quality of life and supports economic growth. Investments
All Door Boarding Title VI Service Fare Analysis. Appendix P.3
 All Door Boarding Title VI Service Fare Analysis Appendix P.3 Metro Board Report Los Angeles County Metropolitan Transportation Authority One Gateway Plaza 3rd Floor Board Room Los Angeles,
SAMTRANS SERVICE PLAN
 Agenda Overview Part I: Key Findings Market Assessment Service Evaluation Part II: Service Development Framework Metrics Criteria Part III: Next Steps SAMTRANS SERVICE PLAN Preliminary Analysis and Criteria
Title VI Service Equity Analysis
 Pierce Transit Title VI Service Equity Analysis Pursuant to FTA Circular 4702.1B NE Tacoma Service May 2016 Pierce Transit Transit Development Dept. PIERCE TRANSIT TITLE VI SERVICE EQUITY ANALYSIS TABLE
Table of Contents. List of Tables
 Table of Contents 1. Introduction... 1 2. Service Recommendations... 1 A. Extend Service on Fort Belvoir to New Post Exchange/Commissary Complex... 1 B. Improve Service Frequencies on Sunday from Current
Title VI Service Equity Analysis
 Pierce Transit Title VI Service Equity Analysis Pursuant to FTA Circular 4702.1B September 2013 Service Change February 2013 Page intentionally left blank PIERCE TRANSIT TITLE VI SERVICE EQUITY ANALYSIS
Corridor Analysis. Corridor Objectives and Strategies Express Local Limited Stop Overlay on Local Service 1 Deadhead
 Corridor Analysis Outline Corridor Objectives and Strategies Express Local Limited Stop Overlay on Local Service 1 Deadhead 1 Stacey Schwarcz, "Service Design for Heavy Demand Corridors: Limited-Stop Bus
Memorandum. Fund Allocation Fund Programming Policy/Legislation Plan/Study Capital Project Oversight/Delivery Budget/Finance Contract/Agreement Other:
 Memorandum Date: March 23, 2018 To: Transportation Authority Board From: Eric Cordoba Deputy Director Capital Projects Subject: 4/10/18 Board Meeting: San Francisco Freeway Corridor Management Study Update
Request to Improve Transit along the Dufferin Street Corridor
 For Action Request to Improve Transit along the Dufferin Street Corridor Date: July 10, 2018 To: TTC Board From: Chief Customer Officer Summary The 29 Dufferin bus route is one of the top five busiest
CHAPTER 5: Operations Plan
 CHAPTER 5: Operations Plan Report Prepared by: Contents 5 OPERATIONS PLAN... 5-1 5.1 Proposed Service Changes... 5-2 5.1.1 Fiscal Year 2017... 5-2 5.1.2 Fiscal Year 2018... 5-6 5.1.3 Fiscal Year 2019...
A. CONCLUSIONS OF THE FGEIS
 Chapter 11: Traffic and Parking A. CONCLUSIONS OF THE FGEIS The FGEIS found that the Approved Plan will generate a substantial volume of vehicular and pedestrian activity, including an estimated 1,300
FY Transit Needs Assessment. Ventura County Transportation Commission
 FY 18-19 Transit Needs Assessment Ventura County Transportation Commission Contents List of Figures and Appendices.. 2 Appendices... 1 Chapter 1: Introduction What is the Ventura County Transportation
DRAFT Service Implementation Plan
 2017 Service Implementation Plan October 2016 SECTION NAME 2017 Service Implementation Plan October 2016 2017 SERVICE IMPLEMENTATION PLAN TABLE OF CONTENTS Table of Contents... I List of Tables... III
ROUTE EBA EAST BUSWAY ALL STOPS ROUTE EBS EAST BUSWAY SHORT
 ROUTE EBA EAST BUSWAY ALL STOPS ROUTE EBS EAST BUSWAY SHORT The EBA East Busway All Stops and EBS East Busway Short routes provide the core Martin Luther King Jr. East Busway services. Route EBA operates
NORTHERN NAPA VALLEY TRANSIT STUDY
 NORTHERN NAPA VALLEY TRANSIT STUDY Draft Final Recommendations Report Submitted by: June 5, 2007 TABLE OF CONTENTS Executive Summary... i ES-1 Project Objectives and Approach... i ES-2 Current Service
Mount Pleasant (42, 43) and Connecticut Avenue (L1, L2) Lines Service Evaluation Study Open House Welcome! wmata.com/bus
 and Connecticut Avenue (L1, L2) Lines Service Evaluation Study Open House Welcome! wmata.com/bus") Mount Pleasant (42, 43) and Connecticut Avenue (L1, L2) Lines Service Evaluation Study Open House Welcome! Study Overview and Timeline Phase 1: Collect and Analyze Data Project Kickoff, September 2017
Mount Pleasant (42, 43) and Connecticut Avenue (L1, L2) Lines Service Evaluation Study Open House Welcome! Study Overview and Timeline Phase 1: Collect and Analyze Data Project Kickoff, September 2017
SAN LUIS OBISPO TRANSIT + SAN LUIS OBISPO RTA JOINT SHORT RANGE TRANSIT PLANS: SERVICE STRATEGIES. Presented by: Gordon Shaw, PE, AICP; Principal
 SAN LUIS OBISPO TRANSIT + SAN LUIS OBISPO RTA JOINT SHORT RANGE TRANSIT PLANS: SERVICE STRATEGIES Presented by: Gordon Shaw, PE, AICP; Principal Project Status Review of existing services and setting complete
Bus Corridor Service Options
 Bus Corridor Service Options Outline Corridor Objectives and Strategies Express Local Limited Stop Overlay on Local Service 1 Deadhead 1 Stacey Schwarcz, "Service Design for Heavy Demand Corridors: Limited-Stop
LOS ANGELES COUNTY CONGESTION REDUCTION DEMONSTRATION INITIATIVE
 One Gateway Plaza Los Angeles, CA 90012-2952 213-922.2000 Tel metro.net 35 REGULAR BOARD MEETING JULY 24, 2008 SUBJECT: ACTION: LOS ANGELES COUNTY CONGESTION REDUCTION DEMONSTRATION INITIATIVE AMEND THE
New System. New Routes. New Way. May 20, 2014
 Route Optimization I N I T I A T I V E New System. New Routes. New Way. May 20, 2014 1 Welcome Blueprint for Transportation Excellence (BTE) 20 year strategic plan Blueprint 2020 JTA s five-year plan for
PORTLAND NORTH INTER-CITY EXPRESS SERVICE Freeport-Yarmouth-Cumberland-Falmouth-Portland Concept Report June 2014
 Greater Portland Transit District PORTLAND NORTH INTER-CITY EXPRESS SERVICE Freeport-Yarmouth-Cumberland-Falmouth-Portland Concept Report June 2014 In February 2014, Metro s Board of Directors approved
Community Transit Solutions for the Suburbs CTAA Expo June 2014
 Community Transit Solutions for the Suburbs CTAA Expo June 2014 New Suburban Challenges Lower density development patterns Where is the funding to compete with urban and suburban commuter needs? Increased
Norwalk H.S. Norwalk Green Line Station. Lakewood Green Line Station NORWALK. Bellflower H.S. Studebaker Rd. Cerritos College. Gahr H.S.
 Blvd Blvd Blvd EXISTING NETWORK Transit Hills Blue Metro Cabrillo 92 7 76 2 8 82 74 7 6 7 72 Poly 2 2 2 Mall 7s 3 4 4 46 8 s 3 Green Medical 2 2 76 92 73 7 9 9 94 Wilson 3 92 72 2 72 72 73 73 Norwalk Gahr
Transit System Performance Update
 Clause 5 in Report No. 4 of Committee of the Whole was adopted, without amendment, by the Council of The Regional Municipality of York at its meeting held on March 29, 2018. 5 2017 Transit System Performance
Establishes a fare structure for Tacoma Link light rail, to be implemented in September 2014.
 RESOLUTION NO. R2013-24 Establish a Fare Structure and Fare Level for Tacoma Link MEETING: DATE: TYPE OF ACTION: STAFF CONTACT: PHONE: Board 09/26/2013 Final Action Ric Ilgenfritz, Executive Director,
Chapel Hill Transit: Short Range Transit Plan. Preferred Alternative DRAFT
 : Short Range Transit Plan Preferred Alternative August 2018 Table of Contents Executive Summary... 1 Preferred Alternative... 3 Best Practices for Route Design... 3 Project Goals... 4 Preferred Alternative...
STEP ALTERNATIVES RANKING TABLE
 ALTERNATIVES RANKING TABLE Priority Ranking 0 = Lowest Priority 1 2 3 4 5 = Highest Priority Abbreviations TD = Transportation Disadvantaged PWD = People with Disabilities I. Existing Enhancements Increase
General Issues Committee Item Transit Operating Budget Ten Year Local Transit Strategy
 General Issues Committee Item 4.1 2017 Transit Operating Budget Ten Year Local Transit Strategy January 27, 2017 Presentation Outline 2017 Operating Budget Overview Ten Year Local Transit Strategy 2 2017
COLT RECOMMENDED BUSINESS PLAN
 COLT RECOMMENDED BUSINESS PLAN 2008 INTRODUCTION The past decade has been one of change in Lebanon County and this situation is expected to continue in the future. This has included growth in population,
Summary of Proposed NH 120 Service
 Proposed NH 120 Bus Route Moody Building Etna Road Summary of Proposed NH 120 Service The Upper Valley Lake Sunapee Regional Planning Commission (UVLSRPC) working together with a Steering Committee comprised
STA MOVING FORWARD A plan for more and better transit services
 STA MOVING FORWARD A plan for more and better transit services More options. More often. Better transit. Approved by the STA Board of Directors in Resolution 727-14 on December 18, 2014. Revised by the
STA MOVING FORWARD A plan for more and better transit services
 A plan for more and better transit services PLAN FOR IMPLEMENTATION December 18, 2014 More options. More often. Better transit. Approved by the STA Board of Directors in Resolution 727-14 on December 18,
Service Performance 2013 Networked Family of Services
 Service Performance 2013 Networked Family of Services Overview RTD s Mission is: "To meet our constituents' present and future public transit needs by offering safe, clean, reliable, courteous, accessible
Project Deliverable 4.1.3d Individual City Report - City of La Verne
 Pomona Valley ITS Project Project Deliverable 4.1.3d Individual City Report - City of La Verne Prepared by: April 19, 2002 099017000.1 Copyright 2002, Kimley-Horn and Associates, Inc TABLE OF CONTENTS
Treasure Island Supplemental Information Report Addendum
 1 1 1 1 0 1 0 1 0 1 Treasure Island Supplemental Information Report Addendum Introduction Purpose The purpose of this Supplemental Information Report (SIR) Addendum is to determine if the current land
COMMUNICATIONS DEPARTMENT (Lisa Belsanti, Director) (Joshua Schare, Public Information Officer)
 (Joshua Schare, Public Information Officer)") CITY COUNCIL UNFINISHED BUSINESS AUGUST 21, 2017 SUBJECT: INITIATED BY: SUNSET STRIP ENTERTAINMENT SHUTTLE - PILOT PROGRAM HUMAN SERVICES & RENT STABILIZATION DEPARTMENT (Elizabeth Savage, Director) 'fj1f'..
CITY COUNCIL UNFINISHED BUSINESS AUGUST 21, 2017 SUBJECT: INITIATED BY: SUNSET STRIP ENTERTAINMENT SHUTTLE - PILOT PROGRAM HUMAN SERVICES & RENT STABILIZATION DEPARTMENT (Elizabeth Savage, Director) 'fj1f'..
Table of Contents. TRANSIT DEVELOPMENT PLAN UPDATE i
 Table of Contents Chapter 1. Introduction... 1 Chapter 2. Financial Review... 3 2.1 Operating Costs... 3 2.2 Capital Costs... 3 2.3 Revenues... 4 2.4 Overall Funding Implications... 4 Chapter 3. Service
1.2 Corridor History and Current Characteristics
 SECTION 1 Description and Background of Study Area 1.1 Introduction This preliminary engineering report was prepared for the Alaska Department of Transportation and Public Facilities (ADOT&PF). It is part
FY Year End Performance Report
 Overall Ridership Big Blue Bus carried 18,748,869 passengers in FY2014-2015, a 0.3% reduction from the year prior. This negligible reduction in ridership represents the beginnings of a reversal from a
5.1 Traffic and Transportation
 5.1 When it opens in 2009, the Bellevue Nickel Improvement Project will increase the number of vehicles able to travel through the study area, improve travel speeds, and improve safety by reducing the
Service Performance 2010 Networked Family of Services
 Service Performance 2010 Networked Family of Services Overview RTD s Mission is: "To meet our constituents' present and future public transit needs by offering safe, clean, reliable, courteous, accessible
Transportation Improvement District (TID) Exercise New Castle County Unified Development Code
 Exercise New Castle County Unified Development Code") Transportation Improvement District (TID) Exercise New Castle County Unified Development Code Churchmans Crossing TID How should New Castle County deploy Transportation Improvement Districts (TIDs)? Site
Transportation Improvement District (TID) Exercise New Castle County Unified Development Code Churchmans Crossing TID How should New Castle County deploy Transportation Improvement Districts (TIDs)? Site
Eleven things you should know about the carpool lanes in Los Angeles County.
 Eleven things you should know about the carpool lanes in Los Angeles County. Los Angeles County Metropolitan Transportation Authority One Gateway Plaza Los Angeles, CA 912 COMPANY NAME Street Address City,
SERVICE GUIDELINES Revised April 2015
 SERVICE GUIDELINES Revised April 2015 Table of Contents 1 INTRODUCTION... 1 2 RIPTA SERVICES... 2 Rapid Bus Routes... 2 Key Corridor Routes... 2 Urban Radial Routes... 2 Non-Urban/Suburban/Crosstown Routes...
Memorandum. Roger Millar, Secretary of Transportation. Date: April 5, Interstate 90 Operations and Mercer Island Mobility
 Memorandum To: From: The Honorable Dow Constantine, King County Executive; The Honorable Ed Murray, City of Seattle Mayor; The Honorable Bruce Bassett, City of Mercer Island Mayor; The Honorable John Stokes,
PREFACE. Service frequency; Hours of service; Service coverage; Passenger loading; Reliability, and Transit vs. auto travel time.
 PREFACE The Florida Department of Transportation (FDOT) has embarked upon a statewide evaluation of transit system performance. The outcome of this evaluation is a benchmark of transit performance that
STA MOVING FORWARD A plan for more and better transit services
 A plan for more and better transit services A DRAFT PLAN FOR IMPLEMENTATION July, 17, 2014 More options. More often. Better transit. Contents Introduction...3 The Future...4 The Plan...5 High Performance
This report recommends two new TTC transit services in southwest Toronto.
 Report for Action New TTC Services - Southwest Toronto Date: March 20, 2018 To: TTC Board From: Chief Customer Officer Summary This report recommends two new TTC transit services in southwest Toronto.
Regional Fare Change Overview. Nick Eull Senior Manager of Revenue Operations Metro Transit
 Regional Fare Change Overview Nick Eull Senior Manager of Revenue Operations Metro Transit Committee of the Whole April 5 th, 2017 Today s Presentation Fare change goals and considerations Public engagement
WESTERN EL DORADO COUNTY SHORT AND LONG-RANGE TRANSIT PLAN Executive Summary
 WESTERN EL DORADO COUNTY SHORT AND LONG-RANGE TRANSIT PLAN Executive Summary Prepared for the El Dorado County Transportation Commission Prepared by The El Dorado County Transportation Commission (EDCTC)
Lake Erie Commerce Center Traffic Analysis
 LOCATION: East of NYS Route 5 at Bayview Road Town of Hamburg Erie County, New York PREPARED BY: Wendel Companies 140 John James Audubon Parkway Suite 200 Amherst, New York 14228 January 2012 i ii Table
CHAPTER 1 TRANSIT MARKET AREAS AND EXISTING SERVICE
 CHAPTER 1 TRANSIT MARKET AREAS AND EXISTING SERVICE Transit Market Areas While several factors influence the propensity to use transit, the primary predictors of transit productivity are the density of
Word Count: 3,565 Number of Tables: 4 Number of Figures: 6 Number of Photographs: 0. Word Limit: 7,500 Tables/Figures Word Count = 2,250
 Katherine F. Turnbull, Ken Buckeye, Nick Thompson 1 Corresponding Author Katherine F. Turnbull Executive Associate Director Texas Transportation Institute Texas A&M University System 3135 TAMU College
Existing Services, Ridership, and Standards Report. June 2018
 Existing Services, Ridership, and Standards Report June 2018 Prepared for: Prepared by: Contents Overview of Existing Conditions... 1 Fixed Route Service... 1 Mobility Bus... 34 Market Analysis... 41 Identification/Description
Appendix F International Terminal Building Main Terminal Departures Level and Boarding Areas A and G Alternatives Analysis
 Appendix F International Terminal Building Main Terminal Departures Level and Boarding Areas A and G Alternatives Analysis ITB MAIN TERMINAL DEPARTURES LEVEL & BOARDING AREAS A & G ALTERNATIVES ANALYSIS
Assessment of Travel Trends
 I - 2 0 E A S T T R A N S I T I N I T I A T I V E Assessment of Travel Trends Prepared for: Metropolitan Atlanta Rapid Transit Authority Prepared by: AECOM/JJG Joint Venture Atlanta, GA October 2011 General
Executive Summary. Introduction. Community Assessment
 Executive Summary Introduction The Red Rose Transit Authority (RRTA) Transit Development Plan provides an evaluation of existing RRTA fixed route services, with the outcome being practical recommendations
CobbLinc Forward Service Package
 The Cobb County Department of Transportation is conducting a short-term plan for CobbLinc to meet future transportation needs for residents, workers, and businesses. updates to CobbLinc Transit would be
Arlington County Board Meeting Project Briefing. October 20, 2015
 Arlington County Board Meeting Project Briefing October 20, 2015 Project Map 2 Project Context Only Interstate in the Country limited to HOV only traffic during rush hours Stoplight at the end of I-66
 Existing Conditions AIRPORT PROFILE Passenger Terminal Complex 57 air carrier gates 11,500 structured parking stalls Airfield Operations Area 9,000 North Runway 9L-27R 6,905 Crosswind Runway 13-31 5,276
APPENDIX J MODIFICATIONS PERFORMED TO THE TOR
 APPENDIX J MODIFICATIONS PERFORMED TO THE TOR This appendix summarizes the modifications that were performed in years 2012 and 2017 to rectify calculation errors that were observed in the data presented
2015 Independence Day Travel Overview U.S. Intercity Bus Industry
 2015 Independence Day Travel Overview U.S. Intercity Bus Industry Chaddick Institute for Metropolitan Development, DePaul University June 25, 2015 This Intercity Bus Briefing summarizes the Chaddick Institute
SOUTHERN CALIFORNIA REGIONAL RAIL AUTHORITY NOTICE OF PUBLIC HEARING
 SOUTHERN CALIFORNIA REGIONAL RAIL AUTHORITY NOTICE OF PUBLIC HEARING The Southern California Regional Rail Authority (SCRRA) (Metrolink) will hold a Public Hearing concerning potential Fare Policy Changes
Public Transit Services on NH 120 Claremont - Lebanon
 Public Transit Services on NH 120 Claremont - Lebanon Overview of Preferred Alternative April 12, 2011 Presentation Overview Study Goals Quick Review Methodology and Approach Key Findings Results of Public
VCTC Transit Ridership and Performance Measures Quarterly Report
 VCTC Transit Ridership and Performance Measures Quarterly Report Overview Quarter 2 Fiscal Year 2018-2019 This report provides performance measures for VCTC Intercity Bus Service covering the FY 2018-19
2017 TBARTA Future Regional Priority Projects Adopted by TBARTA Board, December 9, 2016
 2017 TBARTA Future Regional Priority Projects Adopted by TBARTA Board, December 9, 2016 Project numbers do not signify ranking they are for mapping identification purposes only. 1. 15th Street East The
PERFORMANCE REPORT NOVEMBER 2017
 PERFORMANCE REPORT NOVEMBER 2017 Note: New FY2018 Goal/Target/Min or Max incorporated in the Fixed Route and Connection Dashboards. Keith A. Clinkscale Performance Manager INTRODUCTION/BACKGROUND In June
KING STREET PILOT STUDY PUBLIC MEETING
 KING STREET PILOT STUDY PUBLIC MEETING 2017.02.13 PUBLIC WORK with GEHL STUDIO / NEW YORK SWERHUN ASSOCIATES SAM SCHWARTZ CONSULTING LLC STARTING POINTS 17 1 - TRANSIT FIRST! Transit service is beyond
Pinellas Suncoast Transit Authority Community Bus Plan
 Pinellas Suncoast Transit Authority Community Bus Plan FINAL REPORT JANUARY 2014 Prepared by: TABLE OF CONTENTS Executive Summary... 2 Community Bus Plan Introduction... 22 Previous Studies... 25 Market
Playa Vista Ability2Change Webinar
 Playa Vista Ability2Change Webinar Aaron Gaul Director UrbanTrans North America Hi, I m Aaron. I m a transportation nerd. 1 PROJECT CONTEXT Playa Vista Community Overview 5,100+ employees 49% growth in
KING STREET TRANSIT PILOT
 KING STREET TRANSIT PILOT Update toronto.ca/kingstreetpilot #kingstreetpilot HIGHLIGHTS TRANSIT RIDERSHIP TRANSIT CAPACITY To respond to this growth in ridership, the TTC has increased the capacity of
Transportation Supporting Dulles Airport
 Transportation Supporting Dulles Airport Committee for Dulles Economic Development and Transportation Committee July 12, 2018 Tom Biesiadny, Director Fairfax County Multiple Transportation Improvements
Central Oregon Intergovernmental Council
 Central Oregon Intergovernmental Council Regional Transit Master Plan (RTMP) Technical Advisory Committee March 8, 2013 Agenda Introductions (5 min) Project Update (5 min) Updated Demand Estimates (5 min)
FNORTHWEST ARKANSAS WESTERN BELTWAY FEASIBILITY STUDY
 FNORTHWEST ARKANSAS WESTERN BELTWAY FEASIBILITY STUDY EXECUTIVE SUMMARY The 2030 Northwest Arkansas Regional Transportation Plan developed by the Northwest Arkansas Regional Planning Commission (NWARPC)
This report recommends routing changes resulting from the Junction Area Study.
 For Action Routing Changes Junction Area Study Date: April 11, 2019 To: TTC Board From: Chief Customer Officer Summary The TTC operates an established and mature bus network. TTC staff conduct localized
Wake Bus Plan. Short Range Transit Plans. Proposed Transit Service Projects and Changes. GoTriangle. Volume 2 DRAFT
 Wake Bus Plan Short Range Transit Plans Proposed Transit Service Projects and Changes Volume 2 GoTriangle DRAFT Table of Contents Information on the Wake Bus Plan Short Range Transit Plans Project Sheet
Potomac River Commuter Ferry Feasibility Study & RPE Results
 1.1 Introduction The Prince William County Department of Transportation conducted a route proving exercise (RPE) and feasibility study of a proposed commuter ferry service on the Potomac River between
Selection of a Locally Preferred Alternative for the Interstate 405 Improvement Project Between State Route 55 and Interstate 605.
 ORANGE COUNTY TRANSPORTATION AUTHORITY Selection of a Locally Preferred Alternative for the Interstate 405 Improvement Project Between State Route 55 and Interstate 605 PowerPoint San Diego Freeway (Interstate
Greater Portland Transit District
 Greater Portland Transit District TO: FROM: Freeport Town Council Greg Jordan - Metro General Manager DATE: September 10, 2014 SUBJECT: Metro Request to Pursue Grant Funding for Trial Express Bus Service
Business Growth (as of mid 2002)
") Page 1 of 6 Planning FHWA > HEP > Planning > Econ Dev < Previous Contents Next > Business Growth (as of mid 2002) Data from two business directories was used to analyze the change in the number of businesses
Page 1 of 6 Planning FHWA > HEP > Planning > Econ Dev < Previous Contents Next > Business Growth (as of mid 2002) Data from two business directories was used to analyze the change in the number of businesses
Bus Operations Report
 Third Quarter FY 216 (January 1 - March 31, 216) Wednesday April 27, 216 Operations Ridership: 783,194 passengers used in the third quarter. This represents a 2% increase over the same period in FY 215.