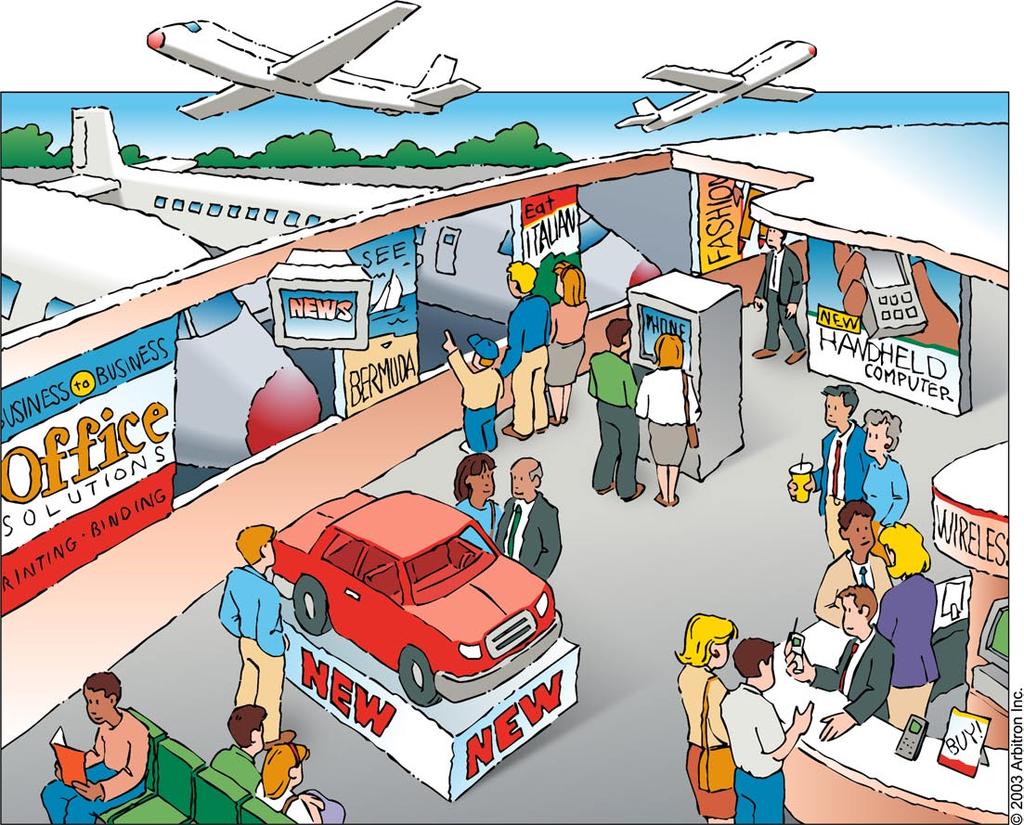
The Arbitron Airport Advertising Study: Exploring an Undiscovered Upscale Medium 3
|
|
|
- Horace Wood
- 5 years ago
- Views:
Transcription
1
2 The Arbitron Airport Advertising Study: Exploring an Undiscovered Upscale Medium 3 Table of Contents Overview...4 Definition of Terms...5 How the Study Was Conducted...5 Significant Highlights...6 Key Findings...9 A. Airport Traffic...9 B. Airline Traveler Profile...11 C. The Lifestyle of Airline Travelers...14 D. Time Spent at the Airport...20 E. Airport Advertising and Shopping...21 F. Airline Travelers Media Exposure...24 G. Maximizing Outdoor Media Campaigns...27 Recommendations...28 Appendix A: Summary...30 Appendix B: Airport Advertising Reach...31 B-1. Profile of U.S. Airline Travelers...31 B-2. Media Habits of U.S. Airline Travelers...32 B-3. Travel Habits of U.S. Airline Travelers...33 Appendix C: Airport Advertising Frequency...34 C-1. Profile of U.S. Airline Travelers...34 C-2. Media Habits of U.S. Airline Travelers...35 C-3. Travel Habits of U.S. Airline Travelers...36 About Arbitron Inc....37

3 4 The Arbitron Airport Advertising Study: Exploring an Undiscovered Upscale Medium Overview The Arbitron Airport Advertising Study represents the first comprehensive analysis of the airport media audience and their consumer profile. This industry study is the fourth in a series examining the power and impact of out-of-home/outdoor advertising: 2001: The Arbitron Outdoor Study, a comprehensive examination of traditional outdoor advertising, the audience it impacts and its role in the media mix. 2003: The Arbitron Cinema Advertising Study, a profile of the youthful and affluent moviegoing audience. 2003: The Arbitron National In-Car Study, a detailed profile of the shopping habits of mobile Americans and their exposure to out-of-home media, including radio and outdoor. All reports in the Arbitron Out-of-Home Media series can be found at This study explores the size, characteristics and behavior of airline travelers. Most specifically, the cream of the airport crop Frequent Flyers. They are the affluent and upscale Americans who take four or more flights per year and account for almost 60% of all airport advertising impressions. We will examine these avid Airline Travelers and how best to market to them. Our research shows that in this modern world of heightened security, Americans are spending more time at the airport each time they travel. While waiting at the airport, they often shop and read airport advertising. A majority of airport advertising is currently targeted toward the business-tobusiness and technology sectors. These categories are well suited for the business traveler; however, this study indicates that the airport also provides an exceptional opportunity for luxury goods and entertainment services to reach upscale targets. This is why we feel airport advertising is an undiscovered upscale medium. Frequent airline travelers are sophisticated consumers with varied tastes and the income to pursue their interests. Marketing to the careers of airline travelers is too limiting. Airport advertising should also market to their lifestyles. Frequent Flyers buy designer clothes, watches, perfume and personal digital devices far more often than business-to-business products or services. This study shows that airport advertising can be an important complement to outdoor campaigns and should be part of the standard media mix. This is particularly true for advertisers targeting affluent, upscale males between the ages of 25 and 54 years old. Airport advertising has an immense power to reach an elusive and upscale audience. We hope this study will help advance the premise of the airport as a compelling advertising medium. As with all Arbitron Industry Studies, this research can be found on our Web site (
4 The Arbitron Airport Advertising Study: Exploring an Undiscovered Upscale Medium 5 Definition of Terms Throughout this summary we will refer to the following terms: Airline Traveler 1 : An American who has taken at least one round-trip flight in the past 12 months. Designated Market Area (DMA ): A geographic classification defined and updated annually by Nielsen Media Research, Inc., based on historical television viewing patterns. A county or split county is assigned exclusively to one DMA. Frequent Flyer 2 : An American who has taken four or more round-trip flights in the past 12 months. Mega-Miler: An American who has traveled 261+ miles in an automobile in the past week. Power-Pedestrian: An American who has walked five or more miles in a city or downtown area in the past week. How the Study Was Conducted A total of 2,005 people were interviewed in July 2003 to investigate America s airline travel habits, media exposure, Internet usage and interest in consumer goods and services. Telephone interviews were conducted with respondents age 12 and over chosen at random from a national sample of Arbitron s Spring 2003 survey diarykeepers. Additional studies of airline travel among adults 18+ were conducted in October 2003, January 2004 and March 2004 to allow for seasonal trending. Each of these studies consisted of a national representative sample of 1,000 respondents. This report also contains information from Scarborough Research, the gold standard for consumer shopping behavior research. Scarborough interviews 200,000 consumers for its national survey covering more than 75 DMAs. In each local market, Scarborough asks which airport the consumer utilizes most often; as a result, Scarborough subscribers can analyze the local shopping and consumer profiles of specific airports. 1 Scarborough Research defines an Airline Traveler as an American age 18+ who has taken at least one round-trip flight in the past 12 months. 2 Scarborough Research defines a Frequent Flyer as an American age 18+ who has taken five or more round-trip flights in the past 12 months.

5 6 The Arbitron Airport Advertising Study: Exploring an Undiscovered Upscale Medium Significant Highlights Ninety-two million Americans have taken at least one round-trip airline flight in the past 12 months. Thirty-nine percent of Americans ages 18+ say they have taken at least one round-trip airline flight in the past year. Twenty-one percent of Americans, or 50 million people, have flown within the past three months, and 11%, or 26 million people, have used air travel in the past month. These estimates are averages of travel that occurred across all four seasons. Airline Travelers are 80% more likely to have an annual household income of $100,000 or more. Eighteen percent of airline travelers have an annual household income of $100,000 or more, compared with only 10% of average Americans. Fifty-one percent of airline travelers have a household income of $50,000 or more per year; by contrast, only 37% of average American households reach that level. Airline Travelers are sophisticated shoppers. Airline Travelers are more likely to have a propensity for designer clothes, luxury cars and cutting-edge personal digital devices. They also shop more often online and spend more when they do shop. Airline Travelers are avid moviegoers. These who fly are far more likely to have seen a movie recently. They are also more likely to be avid DVD collectors. Frequent Flyers account for nearly 60% of all airport advertising impressions. Seventeen million Americans are Frequent Flyers having taken four or more round-trip flights in the past year. Even though this segment makes up just 18% of airline travelers, Frequent Flyers account for 58% of all trips taken averaging nine round-trip flights per year and a majority of the exposures to airport advertising. Frequent Flyers are over three times as likely to live in $100,000+ households. Frequent Flyers are the most affluent travelers, with 33% having an annual household income of $100,000 or more. Sixty percent of Frequent Flyers live in households earning $50,000 or more per year. Males constitute the largest segment of Frequent Flyers. Fifty-eight percent of Frequent Flyers are male, and 61% are between 25 and 54 years old making the airport an excellent place to target this valuable demographic. Airline Travelers spend less time with television. Airline Travelers spend around 2 hours and 41 minutes with TV per day, compared to average Americans, who spend closer to 3 hours and 8 minutes per day. Annualized, Airline Travelers spend 164 fewer hours per year with TV than an average American. Frequent Flyers watch television for only 2 hours and 33 minutes per day, making their annual time spent approximately 213 hours fewer than that of the average American.
6 The Arbitron Airport Advertising Study: Exploring an Undiscovered Upscale Medium 7 Twice as many Americans fly as read Time or Newsweek magazines. According to Scarborough Research, 41% of Americans 18 years or older have used airline travel in the past year, compared to only 21% who have read Time or Newsweek in the past six months. More than twice as many Males in New York fly as read Sports Illustrated. Fifty-four percent of males between the ages of 18 and 34 living in the New York DMA have flown in the past year; only 24% of them have read a copy of Sports Illustrated magazine in the past six months according to Scarborough Research. This is an example of the surprising reach of airport advertising compared to traditional media. Frequent Flyers are heavily exposed to traditional outdoor media. Forty-five percent of Frequent Flyers are Mega-Milers, logging 261 or more miles per week in an automobile. Only 32% of average Americans clock that many miles per week. Thirty percent of Frequent Flyers walk five or more miles a week in a city or downtown area, compared to 21% of the general population. This makes the airport a natural extension of any outdoor campaign. Airline travel remains remarkably consistent throughout the year. The number of people using airline travel does not vary significantly from month to month or season to season. The monthly average remains steady at around 26 million Americans, and the three-month average hovers around 50 million. A slight peak occurs only during the holidays (November-January), when nearly one-quarter of Americans fly. Forty-six percent of Airline Travelers are spending more time at the airport. Nearly half of all Airline Travelers are spending more time at the airport now than they did two years ago. Fifty-one percent spend 30 minutes or more at the airport before going through security, and 68% spend an additional 30 minutes or more in the terminal while waiting to board their flight. During longer airport waiting periods Airline Travelers take the time to read advertisements. Seventy-two percent of Airline Travelers who recall noticing airport advertising displays say they take the time to read them. Frequent Flyers don t view these messages with a jaded eye either: 82% say they take the time to read airport advertising displays. Sixty-four percent of Airline Travelers make a purchase at an airport store or restaurant. Airline Travelers are spending their extra time at the airport shopping and/or dining. Airport purchases rise to 75% among Frequent Flyers. Airport advertising that runs for three months delivers double the reach of a one-month campaign. Eleven percent of Americans fly during an average month, but 21% of Americans fly at least once during an average three-month period.
7 8 The Arbitron Airport Advertising Study: Exploring an Undiscovered Upscale Medium Eighty-one percent of Frequent Flyers can be reached at least once during a three-month airport advertising campaign. Eighty-one percent of Frequent Flyers have taken at least one flight in the past three months. Fifty-one percent have used air travel in the past month. Over one-third of Airline Travelers and nearly half of Frequent Flyers are concentrated in 10 DMAs. Thirty-nine percent of all Americans who have used airline travel in the past year are concentrated in just 10 DMAs. Forty-six percent of Frequent Flyers are also centered in 10 markets. New York leads the pack, with over 9% of all Airline Travelers and Frequent Flyers calling it home. Most Airline Travelers use multiple airports within their home DMA. Airline Travelers in major cities use multiple airports for departure. A breakdown of airport usage for each of the top 75 DMAs is available through Scarborough Research.

8 The Arbitron Airport Advertising Study: Exploring an Undiscovered Upscale Medium 9 Key Findings A. Airport Traffic 1. An estimated 92 million Americans age 18+ have taken at least one roundtrip airline flight in the past year. Thirty-nine percent of Americans have taken at least one round-trip flight in the past year. Twenty-one percent of Americans, or 50 million people, have flown within the past three months. Eleven percent of Americans, or 26 million people, have flown in the past month. These estimates are averages of travel that occurred across all four seasons. One-Third of Americans Have Used Airline Travel in the Past Year % of Americans Who Have Taken at Least One Round-Trip Flight 39% 21% 92 million Americans 11% 50 million Americans 26 million Americans Past Month Past 3 Months Past Year Base: Total Population Airline travel remains remarkably consistent throughout the year. The number of people using airline travel does not vary significantly from month to month, making airport advertising an effective medium for reaching Americans year around. The number of people flying per month remains steady at around 11%, and the three-month average hovers around 21%. A slight peak occurs only during the holidays (November-January), when nearly one-quarter of Americans fly. Airline Travel Remains Steady Throughout the Year % of Americans Who Took at Least One Round-Trip Flight in the Past Month 12% 10% 11% 10% One-Quarter of Americans Use Airline Travel During the Holiday Season % of Americans Who Took at Least One Round-Trip Flight in the Past 3 Months 23% The Holidays 19% 20% 21% January March July October Nov-Dec-Jan Feb-Mar-Apr May-Jun-Jul Aug-Sep-Oct Base: Total Population 18+ Base: Total Population 18+
9 10 The Arbitron Airport Advertising Study: Exploring an Undiscovered Upscale Medium 3. Half of all air travelers take two or more trips annually. Thirty-three percent of air passengers are moderate travelers, taking two or three flights per year. Eighteen percent are Frequent Flyers, taking four or more trips annually. How Frequently Do Americans Fly? Number of Round-Trip Flights Airline Travelers Take per Year 4+ Trips 18% Don t Know 5% 2-3 Trips 33% 1 Trip 44% Base: Americans Who Have Used Airline Travel in the Past Year 4. The heaviest Airline Travelers known as Frequent Flyers average nine round trip flights per year. Seventeen million Americans are classified as Frequent Flyers, meaning that they take at least four flights per year. The average number of flights taken by these avid airline passengers is more than nine round trips annually. Frequent Flyers Average More Than Nine Round-Trip Flights per Year Number of Round-Trip Flights Airline Travelers Take per Year 9 3 Average Air Travelers (Take 1 Trip per Year) Frequent Flyers (Take 4+ Trips per Year) Base: Americans Who Have Used Airline Travel in the Past Year
10 The Arbitron Airport Advertising Study: Exploring an Undiscovered Upscale Medium Frequent Flyers account for nearly 60% of all airline flights taken in the past year. Even though Frequent Flyers make up just 18% of Airline Travelers, they account for 58% of all trips taken in the past year and a majority of airport advertising impressions. Frequent Flyers Account for Over Half of All Airline Flights Taken in the Past Year Frequent Flyers (Take 4+ Trips per Year) 18% 58% Airline Travelers Total Airline Trips Taken B. Airline Traveler Profile 6. Airline Travelers are the cream of the crop. Americans who fly, particularly those who take four or more flights per year, are a very special group of consumers. They are wealthy, highly educated and discerning shoppers. 7. Airline Travelers are 80% more likely to have an annual household income of $100,000 or more. Eighteen percent of Airline Travelers have an annual household income of $100,000 or more per year, compared with only 10% of average Americans. 8. One-third of Frequent Flyers live in $100,000+ households. Frequent Flyers those who take four or more airline trips per year are the most affluent travelers, with 33% having an annual household income of $100,000 or more. Forty-four percent live in a household making at least $75,000 per year, compared to only 20% of average Americans.
11 12 The Arbitron Airport Advertising Study: Exploring an Undiscovered Upscale Medium 9. Airline Travelers are highly educated and more likely to be employed. Over half of all Airline Travelers have a college or graduate school degree, compared with only 33% of average Americans. Among Frequent Flyers, the likelihood of higher education soars to 68%. Sixty-seven percent of Airline Travelers and a full three-quarters of Frequent Flyers are also employed, compared to the national average of only 58%. Average American (Total U.S. Airline Traveler (In Past 12 Months) (37% of U.S. Frequent Flyer (4+ Round Trips in Past 12 Months) (7% of U.S. $100K+ annual household income 10% 18% 33% College or graduate degree 33% 52% 68% Employed full/part time 58% 67% 75% 10. Males 25 to 54 years old are the largest segment of Frequent Flyers. Fiftyeight percent of Frequent Flyers are male, and 61% are between 25 and 54 years old making the airport an excellent place to target this valuable demographic. Frequent Flyers Are More Likely To Be Male Frequent Flyers Skew Older 46% 47% 58% 54% 53% 42% % in Each Age Group 53% 57% 61% 20% 19% 10% 17% 25% 30% Male Female Average Americans Airline Travelers Frequent Flyers Average Americans Airline Travelers Frequent Flyers 11. Frequent Flyers call every U.S. region home. Frequent Airline Travelers can just as easily come home to an airport in the Northeast (22%), South (27%), Midwest (27%) or West (24%). 12. The Top 10 DMAs for Airline Travel are home to 39% of all passengers. The Top 10 DMAs that are home to the most Airline Travelers (listed below) account for 31% of the United States population but contain 39% of all airline passengers in the past year.
12 The Arbitron Airport Advertising Study: Exploring an Undiscovered Upscale Medium New York is the #1 home DMA for Airline Travelers in the past 12 months. The New York DMA is home to the most Airline Travelers in the United States, with over eight million New Yorkers flying in the past year. Top 10 Home DMAs for Airline Travel % Airline Travelers Who Live in DMA # Airline Travelers Who Live in DMA Total Population of DMA 1. New York 9.4% 8,321,575 15,570, Los Angeles 6.8% 5,982,555 12,197, Chicago 4.2% 3,675,380 6,922, San Francisco- Oakland-San Jose 3.7% 3,292,670 5,179, Boston 2.8% 2,481,130 4,739, Washington, DC 2.7% 2,350,590 4,363, Philadelphia 2.6% 2,333,475 5,730, Seattle-Tacoma 2.2% 1,968,680 3,278, Atlanta 2.1% 1,850,285 4,000, Dallas-Ft. Worth 2.1% 1,844,820 4,338,240 Totals 38.6% 34,101,160 66,322,125 Source: Scarborough USA+, Release 1, 2003, 12-month, Adults The Top 10 DMAs for Frequent Flyers are home to 46% of all Frequent Flyers. The DMAs that are home to the most Frequent Flyers (listed below) account for 30% of the United States population but contain 46% of all Frequent Flyers. 15. New York is the #1 home DMA for Frequent Flyers. The New York DMA is host to the most Frequent Flyers in the United States, with 974,000 of them calling New York home. Los Angeles follows, with over 700,000. Top 10 Home DMAs for Frequent Flyers % Frequent Flyers Who Live in DMA # Frequent Flyers Who Live in DMA Total Population of DMA 1. New York 9.2% 974,000 15,570, Los Angeles 6.7% 705,005 12,197, Chicago 5.3% 560,310 6,922, San Francisco- Oakland-San Jose 5.0% 532,620 5,179, Atlanta 4.3% 451,945 4,000, Washington, DC 4.1% 437,265 4,363, Dallas-Ft. Worth 3.8% 397,850 4,338, Boston 3.0% 319,925 4,739, Houston 2.7% 290,000 3,716, Phoenix 2.3% 247,680 3,055,735 Totals 46.4% 4,916,600 64,085,495 Source: Scarborough USA+, Release 1, 2003, 12-month, Adults 18+
13 14 The Arbitron Airport Advertising Study: Exploring an Undiscovered Upscale Medium 16. Most Frequent Flyers use more than one airport in their home DMA. Airline Travelers in major cities use multiple airports for departure. A majority of Frequent Flyers in New York City depart from more than one airport per year. San Francisco residents also tend to use multiple airports each year. A breakdown of airport usage for each of the top 75 DMAs is available through Scarborough Research. New York Airports (Used for Departure in Past 12 Months) Airline Travelers (In New York DMA) (At Least 1 Round-Trip Flight per Year) Frequent Flyers (in New York DMA) (5+ Round-Trip Flights per Year) Percent Amount Percent Amount John F. Kennedy (JFK) 49% 3,944,880 67% 634,995 Newark Liberty (New Jersey) 43% 3,415,780 68% 643,860 LaGuardia 37% 2,968,180 64% 607,385 Other Airports 17% 1,381,745 26% 246,500 Source: Scarborough Release 2, 2003, New York DMA, Sep02-Aug03, Adults 18+. Note: Other Airports include MacArthur (Long Island), Stewart International (Orange County), Westchester County and Bradley International, among others. San Francisco Airports (Used for Departure in Past 12 Months) Airline Travelers (in San Francisco DMA) (At Least 1 Round-Trip Flight per Year) Frequent Flyers (in San Francisco DMA) (5+ Round-Trip Flights per Year) Percent Amount Percent Amount San Francisco International 63% 2,074,935 82% 398,155 Oakland International 44% 1,463,835 60% 293,070 San Jose International 29% 950,110 40% 197,000 Other Airports 11% 357,410 12% 56,175 Source: Scarborough Release 2, 2003, San Francisco DMA, Aug02-Jul03, Adults 18+. Note: Other Airports include Sacramento International and Sonoma County, among others. C. The Lifestyle of Airline Travelers Scarborough shows that Airline Travelers particularly Frequent Flyers are discerning shoppers. Scarborough Research, the gold standard for consumer shopping behavior research, tracks the exclusive behavior of Airline Travelers and Frequent Flyers in its national survey of 200,000 consumers. Scarborough defines an Airline Traveler as someone who takes at least one round-trip flight per year; Frequent Flyers take five or more round-trip flights annually. In each market, Scarborough asks which airport the consumer utilizes most often; as a result, Scarborough can analyze the local shopping and consumer profile of specific airports. Below we have included some highlights of the consumer shopping data from Scarborough, including a buying power index. The index compares buying and shopping patterns of airline passengers to those of the country overall. An index of 100 indicates that airline passengers show virtually the identical buying and shopping patterns as the country overall. An index above 100 indicates that airline passengers are more likely than the norm to buy the
14 The Arbitron Airport Advertising Study: Exploring an Undiscovered Upscale Medium 15 product or service. As an example, Frequent Flyers have an index of 194 for using online banking. This indicates that those taking five or more round-trip flights per year are 94% more likely to bank online than the typical consumer. 17. Airline Travelers remain a strong target for business-to-business advertisers. Airline Travelers, particularly Frequent Flyers, tend to be corporate decision makers. A large portion of airport advertising is currently targeted toward these managers and executives with good reason. Participated in purchasing decisions in company in the past year Airline Traveler Index (At Least 1 Round-Trip Flight per Year) Frequent Flyer Index (5+ Round-Trip Flights per Year) Business travel or convention arrangements Computer hardware/software Information technology (network/internet) * Overnight delivery services Telephone and communication *How to read: Frequent Flyers are 258% (or two and a half times) more likely than a typical consumer to have participated in an information technology purchasing decision within their company in the past year. Source: Scarborough USA+ Release 1, 2003, 12-month, Adults 18+.
15 16 The Arbitron Airport Advertising Study: Exploring an Undiscovered Upscale Medium 18. Designer fashions and accessories are part of the Airline Traveler s personal style. Whether it is designer shoes, premium watches or a new perfume, Airline Travelers have the income and inclination to shop at some of our nation s most exclusive stores. Spent $1,000 or more in the past year on: Airline Traveler Index (At Least 1 Round-Trip Flight per Year) Frequent Flyer Index (5+ Round-Trip Flights per Year) Men s business clothing Men s casual clothing Men s shoes Women s business clothing Women s casual clothing Women s shoes Jewelry or watches * Skin care (including cosmetics and perfumes) *How to read: Frequent Flyers are 248% (or two and a half times) more likely than a typical consumer to spend $1,000 or more on jewelry or watches in one year. Source: Scarborough USA+, Release 2, 2002, 12-month, Adults Luxury automobile enthusiasts congregate at the airports. Airline Travelers are the upscale car buyers in the United States. Household plans to buy/lease: Airline Traveler Index (At Least 1 Round-Trip Flight peryear) Frequent Flyer Index (5+ Round-Trip Flights peryear) New luxury vehicle * New sport utility vehicle Household plans to pay: $35,000 or more for new vehicle next year *How to read: Frequent Flyers are 191% (or nearly two times) more likely than a typical consumer to buy or lease a new luxury vehicle. Source: Scarborough USA+, Release 1, 2003, 12-month, Adults 18+.
16 The Arbitron Airport Advertising Study: Exploring an Undiscovered Upscale Medium Financial services are paramount for Airline Travelers. Airline Travelers are affluent and take an active role in planning their finances. Here are just a few banking services widely used by Airline Travelers. Household has/uses: Airline Traveler Index (At Least 1 Round-Trip Flight per Year) Frequent Flyer Index (5+ Round-Trip Flights per Year) Keogh plan * Money market account Online banking IRA (individual retirement account) Home equity loan *How to read: Frequent Flyers are 285% (or almost three times) more likely than a typical consumer to have a Keogh plan. Source: Scarborough USA+, Release 1, 2003, 12-month, Adults Frequent Flyers are passionate about trying new products and services. Frequent Flyers are trailblazers. Forty-three percent classify themselves as early adopters meaning that they are the first or among the first of their family and friends to try a new product or service. Thirty percent of all Airline Travelers consider themselves this adventurous, compared to only 25% of average Americans. The manufacturers of new products such as high-definition televisions or new services such as satellite radio should target the airports. Frequent Flyers Seek Out New Products and Services Frequent Flyers Are Interested in Accessing Audio/Video in New Ways Think about when you buy or try new products or services, compared to other people you know. In general, would you say that you 25% 30% 43% 27% 28% 22% 44% 40% 34% 37% 39% 43% 29% 30% 35% 11% 16% 19% Are First or Among the First to Buy or Try Buy or Try at Same Time as Most Are Last or Among the Last to Buy or Try Interested in Personal Video Recorder (TiVo) Interested in Satellite Radio Own an MP3 Player Average Americans Airline Travelers Frequent Flyers Average Americans Airline Travelers Frequent Flyers
17 18 The Arbitron Airport Advertising Study: Exploring an Undiscovered Upscale Medium 22. Home electronic equipment is popular among Airline Travelers. Manufacturers of high-end home entertainment devices can find their core consumers at the airport. Spent $1,000 or more in the past year on: Airline Traveler Index (At Least 1 Round-Trip Flight per Year) Frequent Flyer Index (5+ Round-Trip Flights per Year) Television Stereo (audio) system Camera or accessories Plan to buy in the next year: MP3 player * *How to read: Frequent Flyers are 142% (or almost one and a half times) more likely than a typical consumer to buy an MP3 player in the next year. Source: Scarborough USA+, Release 2, 2002, 12-month, Adults Movies are a major source of entertainment for Airline Travelers. Thirty percent of all Airline Travelers watched a movie in the theater last week, compared to only 20% of the general population. Nearly a third of all Frequent Flyers have gone to the movies in the past week as well. Frequent Flyers are also more likely to have an extensive DVD collection. Movie studios have had major success with traditional outdoor media, and airport advertising appears to be a highly effective way to increase the frequency of their messages with core movie consumers. Movies Are a Major Source of Entertainment for Frequent Flyers Frequent Flyers have more than 27 DVDs in their collections, on average 42% 54% 55% 56% 66% 70% 20% 30% 31% Visited a Movie Theater in the Past Week Visited a Movie Theater in the Past Month Owns a DVD Collection Average Americans Airline Travelers Frequent Flyers
18 The Arbitron Airport Advertising Study: Exploring an Undiscovered Upscale Medium Live music, theater and resorts are also staples of the Frequent Flyer s lifestyle. Concert tour operators and resort package providers should make a greater promotional effort at the airports. Personally attended/visited in the past year: Airline Traveler Index (At Least 1 Round-Trip Flight per Year) Frequent Flyer Index (5+ Round-Trip Flights per Year) Symphony concert or opera * Live theater Rock concert Disney World (Orlando) Universal Studios (Orlando) *How to read: Frequent Flyers are 154% (or one and a half times) more likely than a typical consumer to have attended the symphony or opera in one year. Source: Scarborough USA+, Release 1, 2003, 12-month, Adults Sports both watching and participating is a favorite of Airline Travelers. The professional sports leagues and equipment manufacturers can reach their fan base at the airport. Personally attended/visited in the past year: Airline Traveler Index (At Least 1 Round-Trip Flight per Year) Frequent Flyer Index (5+ Round-Trip Flights per Year) National Basketball Association game College football game Major-league baseball game National football game Participated in: Snow skiing * Golf Backpacking/hiking Extreme sports (rock climbing, bungee jumping, etc.) Bicycling *How to read: Frequent Flyers are 204% (or two times) more likely than a typical consumer to be snow skiers. Source: Scarborough USA+, Release 1, 2003, 12-month, Adults 18+.
19 20 The Arbitron Airport Advertising Study: Exploring an Undiscovered Upscale Medium D. Time Spent at the Airport 26. Americans are spending more time at the airport. Forty-six percent of all Airline Travelers say they are spending more time at the airport now than they did two years ago. Airline Travelers Are Spending More Time at the Airport Are you spending more, about the same or less time at the airport than you did two years ago? Less Time 36% Don't Know 5% Same Amount 13% More Time 46% Base: Americans Who Have Used Airline Travel in the Past Year 27. Airline Travelers are getting to the airport earlier than ever and are spending more time in the pre-security areas. Fifty-one percent of Airline Travelers say they spend 30 minutes or more in the airport lobby before going through security. Over Half of Airline Travelers Spend 30 Minutes or More at the Airport Lobby How much time do you spend at the airport before going through security? Don't Know 5% More Than 1 Hour 19% 30 Minutes - 1 Hour 32% Less Than 30 Minutes 44% Base: Americans Who Have Used Airline Travel in the Past Year
20 The Arbitron Airport Advertising Study: Exploring an Undiscovered Upscale Medium After going through security, Airline Travelers are spending more time in the terminal area before they board their flight. Sixty-eight percent of Airline Travelers say they spend an additional 30 minutes or more in the terminal before their flight boards. Over Two-Thirds of Airline Travelers Spend 30 Minutes or More at the Airport Terminal How much additional time do you spend at the airport terminal after going through security? More Than 1 Hour 30% Don't Know 5% 30 Minutes - 1 Hour 38% Less Than 30 Minutes 27% Base: Americans Who Have Used Airline Travel in the Past Year E. Airport Advertising and Shopping 29. Airline Travelers take notice of airport signs and advertising displays. Fiftyeight percent of Airline Travelers who have flown in the past year recall noticing an advertising display at the airport. The awareness factor jumps to 68% for Frequent Flyers. Airline Travelers Notice Airport Advertising % of Americans Who Take Notice of Advertisements (Billboards or Signage) at the Airport 58% 68% Air Travelers Frequent Flyers Base: Americans Who Have Used Airline Travel in the Past Year
21 22 The Arbitron Airport Advertising Study: Exploring an Undiscovered Upscale Medium 30. During these longer waiting periods Airline Travelers take the time to read advertising displays. Seventy-two percent of Airline Travelers who recall noticing airport advertising displays say they take the time to read them. Frequent Flyers don t view these messages with a jaded eye either: 82% say they take the time to read airport advertising. Airline Travelers Read Airport Advertising % of Americans Who Frequently/Sometimes Read Advertisements (Billboards or Signage) at the Airport 82% 72% Air Travelers Frequent Flyers Base: Airline Travelers Who Have Noticed Airport Advertising 31. Shopping has become another important pastime at the airport. Sixty-four percent of Airline consumers who traveled in the past 12 months have made a purchase at an airport store or restaurant. Incidences of airport shopping increase to 75% among Frequent Flyers. Airline Travelers Shop at the Airport % of Americans Who Frequently/Sometimes Make Purchases at Stores or Restaurants at the Airport 64% 75% Air Travelers Frequent Flyers Base: Americans Who Have Used Airline Travel in the Past Year 32. Airport shops and restaurants should post signs directing passengers to their location. Directional signs, very popular with outdoor advertisers, are rare in airport advertising. Few stores and restaurants use airport advertising to promote their location. This is a huge missed opportunity. Seventy-five percent of air travelers indicate they would be interested in advertising signs that would direct them to airport shops and restaurants.
22 The Arbitron Airport Advertising Study: Exploring an Undiscovered Upscale Medium Airport advertising that runs for three months delivers double the reach of a one-month campaign. Eleven percent of Americans fly during an average month, but 21% of Americans fly at least once during an average three-month period. Airport Reach Can Be Doubled with a Three-Month Campaign % of Americans Who Have Used Airline Travel 21% 11% Last 3 Months Last Month Base: Americans Who Have Used Airline Travel in the Past Year 34. Eighty-one percent of Frequent Flyers can be reached at least once during a three-month airport advertising campaign. Fifty-eight percent of Frequent Flyers have used air travel in the past month, but 81% have taken at least one flight in the past three months. Longer campaigns increase frequency to this select group of consumers. Eighty-One Percent of Frequent Flyers Can Be Reached in Three Months % of Frequent Flyers Who Have Traveled in 81% 58% Last 3 Months Last Month Base: Americans Who Have Taken 4+ Flights in the Past Year
23 24 The Arbitron Airport Advertising Study: Exploring an Undiscovered Upscale Medium F. Airline Travelers Media Exposure 35. Airline Travelers spend less time with television. Airline Travelers spend 38% of their weekly media time with television, compared to 42 percent for average Americans. Translated into real time, Airline Travelers spend roughly 2 hours and 41 minutes with TV per day, compared to the average American, who spends closer to 3 hours and 8 minutes per day. Annualized, Airline Travelers spend 164 fewer hours per year with TV than an average American. Frequent Flyers only spend 2 hours and 33 minutes watching TV per day, making their annual time spent approximately 213 hours fewer than the average American. Airline Travelers are also less likely to be heavy TV viewers. Air Travelers Spend Less Time with TV and More Time with the Internet % of Time Spent per Day Among TV, Radio, Newspaper and Internet 42% 38% 37% 35% 34% 34% 19% 20% 15% 9% 8% 10% TV Radio Internet Newspaper Average Americans Airline Travelers Frequent Flyers
24 The Arbitron Airport Advertising Study: Exploring an Undiscovered Upscale Medium Airline Travelers spend more time online. On the other hand, time spent with the Internet consumes 19% of the Airline Traveler s daily media time, compared with only 15% for the general population. Translated into real time, Airline Travelers spend approximately 1 hour and 22 minutes online per day, compared to the average American, who spends only 1 hour and 6 minutes per day. Annualized, Airline Travelers spend 97 hours more online than an average American. Airline Travelers are also more likely to be heavy Internet users. Airline Travelers Are More Likely To Be Heavy Internet Users and Less Likely To Be Heavy TV Viewers 35% 24% 18% 16% 22% 28% Heavy TV Viewers Heavy Internet Users (Watch 5+ Hours per Day) (Use 1+ Hour per Day) Average Americans Airline Travelers Frequent Flyers 37. Twice as many Americans fly as read Time or Newsweek magazines. According to Scarborough Research, 41% of Americans 18 years or older have used airline travel in the past year, compared to only 20% or 21%, respectively, who have read Time or Newsweek magazines in the past six months. More Americans May Be Reached Through Airports Than Time or Newsweek 41% 20% 21% Used Airline Travel in Past 12 Months Read Time magazine in Past 6 Months Read Newsweek in Past 6 Months Source: Scarborough USA+, Release 1, 2003 Base: Total Population 18+
25 26 The Arbitron Airport Advertising Study: Exploring an Undiscovered Upscale Medium 38. More than twice as many Males in New York fly as read Sports Illustrated. Fifty-four percent of males between the ages of 18 and 34 living in the New York DMA have flown in the past year; only 24% of them have read a copy of Sports Illustrated magazine in the past six months according to Scarborough Research. This is an example of the surprising reach of airport advertising compared to traditional media and is typical of other markets. More NY Males May Be Reached Through Airports Than Major Magazines 54% 24% 25% 21% Used Airline Travel in Past 12 Months Read Sports Illustrated in Past 6 Months Read Time Magazine in Past 6 Months Read Newsweek in Past 6 Months Source: Scarborough USA+, New York, Release 2, 2003 Base: Males Age Living In New York DMA 39. Frequent Flyers are Internet junkies very likely to have home broadband connections and shop online. Airline Travelers, especially Frequent Flyers, shop more often online and spend more money when they do. This makes Airline Travelers a natural target for Internet retailers. Average American (Total U.S. Airline Traveler (In past 12 Months) (37% of U.S. Frequent Flyer (4 or More Round Trips per Year) (7% of U.S. Internet access at home/work 72% 86% 93% Broadband home Internet access 31% 38% 48% Purchased online in the past month 27% 34% 55% Amount spent online $635 $680 $1,019 Booked airline travel online in the past year: for personal travel 36% 60% 71% for business travel 12% 24% 44% Number of bookings made online 2 2 5
26 The Arbitron Airport Advertising Study: Exploring an Undiscovered Upscale Medium 27 G. Maximizing Outdoor Media Campaigns 40. Airport advertising complements a traditional outdoor campaign. Thirtyseven percent of Airline Travelers are Mega-Milers, logging 261 or more miles on the road each week, compared to 32% of average Americans. Frequent Flyers are even more likely to be on the road, with 45% belonging to the Mega- Milers club. Not surprisingly, Frequent Flyers have a profile similar to that of the desirable Mega-Milers. Advertisers that have had success targeting motorists can extend that success at the airport. If you want to learn more about automotive travel and traditional outdoor media, get a free copy of The Arbitron Outdoor Study, available at Frequent Flyers Are Heavy Consumers of Outdoor Advertising Average Distance Traveled In a Vehicle per Week Frequent Flyers average 375 road miles per week 45% 28% 27% 22% 20% 32% 27% 32% 37% Light (1-99 Miles) Moderate ( Miles) Mega-Milers (261+ Miles) Average Americans Airline Travelers Frequent Flyers 41. Outdoor campaigns targeting pedestrians can also be extended to the airport. Airline Travelers are Power Pedestrians too. Twenty-four percent of Airline Travelers walk five or more miles in a city or downtown area per week, compared to 21% of average Americans. Frequent Flyers also walk the walk, with 30% covering five or more miles in a city or downtown area per week. Successful pedestrian campaigns can increase frequency among upscale consumers by utilizing airport advertising. Frequent Flyers Are Heavily Exposed to Street Furniture and Transit Advertising Average Distance Walked in a City or Downtown Area per Week Frequent Flyers walk 7 miles per week on average 29% 30% 28% 26% 26% 27% 21% 24% 30% Light (1.25 Mile or Less) Moderate ( Miles) Power-Pedestrians (5+ Miles) Average Americans Airline Travelers Frequent Flyers

27 28 The Arbitron Airport Advertising Study: Exploring an Undiscovered Upscale Medium Recommendations 1. Advertisers can increase their exposure to upscale Americans via airport advertising. Airline Travelers, particularly Frequent Flyers, are a refined segment of America with varied interests and significant expendable income. Current airport advertising is predominately targeted toward the business-tobusiness or technology sectors. This study indicates that airport terminal advertising is also a logical medium for a wide range of luxury and entertainment goods. 2. The airport offers a rare opportunity to catch the attention of Americans that may be harder to reach through other media. Frequent Flyers spend more than 213 fewer hours per year with television than the average American. On the other hand, Frequent Flyers account for almost 60% of all airport advertising impressions. This makes airport advertising a strong complement in a media plan. 3. Upscale retailers should take advantage of the sophisticated and affluent crowds congregating at the airports. Advertisers of high-end clothes, shoes, jewelry and grooming products should market directly to this audience. Premium retail chains should also pursue this audience, both for in-store and online purchases. 4. Successful outdoor campaigns should include an airport component. Airline Travelers log a lot of vehicle miles on the road and walking in a city or downtown area. Thus, Airline Travelers are heavy outdoor advertising consumers. Campaigns that currently market to these individuals can have the same success at the airport. The airport offers advertising space that reaches an affluent, upscale and captive audience. 5. Airport retailers should post displays and signs directing travelers to their stores. Few airport retailers and restaurants utilize airport advertising to direct consumers to their location. Our research shows that Airline Travelers want the convenience of signs directing them to stores. 6. Advertisers shouldn t underestimate the inventory in the airport lobby. People are spending more time at the airport before going through security. There is an opportunity to maximize the available space in this underutilized but valuable area. Many Americans are spending almost as much time in the airport lobby as they are in the terminal. 7. Airport advertising campaigns that run for three months or more maximize their reach and frequency impact. A majority of Frequent Flyers go to the airport at least once every three months, but longer campaigns can greatly increase frequency to these coveted consumers. If an even greater reach is desired, rotate the creative to keep frequent travelers interested and engaged.
28 The Arbitron Airport Advertising Study: Exploring an Undiscovered Upscale Medium Advertisers should place creative in all major airports within a DMA. Airline Travelers in major cities use multiple airports for departures. If an advertiser wants to reach the most travelers with maximum frequency, advertisements should be placed in all major airports serving a market. A breakdown of airport usage for each of the top 75 DMAs is available through Scarborough Research. 9. Technology companies marketing personal or consumer entertainment devices should have a strong presence at the airport. Frequent Flyers are early adopters who are interested in cutting-edge technology and hold influence with their friends and family. Marketing at the airport can go a long way toward reaching these influential consumers and starting a lucrative word-ofmouth campaign. 10. Movie studios should also promote their films at the airport. Airline Travelers are avid movie fans. They go to the theater to see films more often than average, and they pay again to own them on DVD. The film industry is an aggressive user of outdoor advertising on the roads and streets but is missing a significant opportunity at the airports. 11. Internet businesses should market to the online-savvy airport audience. Online retailers of clothes, electronics and entertainment should market directly to consumers at the airport. Airline Travelers, particularly Frequent Flyers, shop more often online and spend more money when they do shop. These are busy people on the move, and they need to learn about quick and convenient ways to shop for the things they want.
29 30 The Arbitron Airport Advertising Study: Exploring an Undiscovered Upscale Medium Appendix A: Summary Airline Travelers and Airport Advertising July 2003 through April 2004* Those who have used airline travel in the past year 92 million Americans 39% of U.S. population average number of flights per year Those who have used airline travel in the last 3 months 50 million Americans 21% of U.S. population average number of flights per year Those who have used airline travel in the last month 26 million Americans 11% of U.S. population average number of flights per year Frequent Flyers (4 or more round-trip flights in the past year) 17 million Americans 7% of U.S. population average number of flights per year *These data reflect an average of four studies conducted in July 2003, October 2003, January 2004 and April 2004.
30 The Arbitron Airport Advertising Study: Exploring an Undiscovered Upscale Medium 31 Appendix B: Airport Advertising Reach B-1. Profile of U.S. Airline Travelers U.S. Population Traveled in the Past Year (39% of U.S. Traveled in the Past 3 Months (21% of U.S. Traveled in the Past Month (11% of U.S. Demographics Men 46%* 47%* 45% 46% Women 54% 53% 55% 54% % 9% 8% 9% % 10% 8% 6% % 17% 16% 17% % 20% 20% 21% % 20% 20% 23% % 14% 17% 14% % 11% 11% 10% Employed part/full time 58% 67% 66% 67% Retired 16% 12% 12% 11% Student 12% 11% 11% 11% Homemaker 8% 6% 5% 6% Unemployed 5% 3% 3% 3% $100K+ household income 10% 18% 20% 21% White 75% 78% 78% 80% African-American 10% 7% 8% 7% Hispanic/Latino 9% 6% 6% 6% Home geography (region) Northeast 19% 21% 21% 22% South 35% 30% 28% 25% Midwest 26% 24% 25% 27% West 19% 24% 23% 23% *How to read: Forty-six percent (46%) of the U.S. population age 12 and older are male vs. 47% of those who used airline travel in the past year.
31 32 The Arbitron Airport Advertising Study: Exploring an Undiscovered Upscale Medium Appendix B: Airport Advertising Reach (continued) B-2. Media Habits of U.S. Airline Travelers U.S. Population Traveled in the Past Year (39% of U.S. Traveled in the Past 3 Months (21% of U.S. Traveled in the Past Month (11% of U.S. Media time spent per day TV 3:08 2:41 2:33 2:26 Radio 2:36 2:27 2:21 2:31 Newspaper 0:39 0:36 0:40 0:46 Internet 1:06 1:22 1:17 1:12 Total 7:29 7:06 6:51 6:55 Percentage of media time spent TV 42% 38% 37% 35% Radio 35% 34% 34% 36% Newspaper 9% 8% 10% 11% Internet 15% 19% 19% 17% Movie theater habits most recent visit Last week 20% 29% 28% 30% Last month 42% 53% 53% 55% Last 3 months 55% 66% 66% 70% Saw 4 or more movies in the theater in past 3 months 18% 26% 26% 29% New product and service adoption scale First or among the first to buy 25% 30% 31% 33% Buy same time as most 27% 28% 31% 32% After most or last to buy 44% 40% 36% 34% Online spending Purchased online in the past month 27% 34% 37% 43% Average amount spent in last 12 months $635 $680 $736 $851
32 The Arbitron Airport Advertising Study: Exploring an Undiscovered Upscale Medium 33 Appendix B: Airport Advertising Reach (continued) B-3. Travel Habits of U.S. Airline Travelers U.S. Population Traveled in the Past Year (39% of U.S. Traveled in the Past 3 Months (21% of U.S. Traveled in the Past Month (11% of U.S. Airline travel Number of Americans 237 million 92 million 50 million 26 million Average number of flights per year Automobile travel (car, van, truck, bus) Light (1-99 miles) 28% 22% 31% 23% Moderate ( miles) 27% 32% 25% 26% Mega-Milers (261+ miles) 32% 37% 39% 40% Pedestrian travel Light (1.25 mile or less) 29% 26% 30% 24% Moderate ( miles) 28% 30% 31% 34% Power-Pedestrians (5 miles or more) 21% 24% 22% 30%
2009 North Carolina Visitor Profile
 2009 Visitor Profile A publication of the Division of Tourism, Film & Sports Development August 2010 Division of Tourism, Film and Sports Development 2009 Visitor Profile 2009 Visitor Profile The Division
AIRPORT ADVERTISING BURBANK, CA [BUR] AIRPORT MEDIA GUIDE
![AIRPORT ADVERTISING BURBANK, CA [BUR] AIRPORT MEDIA GUIDE](/thumbs/89/99820938.jpg "AIRPORT ADVERTISING BURBANK, CA [BUR] AIRPORT MEDIA GUIDE") AIRPORT ADVERTISING BANK, CA [] AIRPORT MEDIA GUIDE AIRPORT ADVERTISING Airport advertising delivers your message to a saturated audience of affluent, educated, tech-savvy business and leisure travelers
AIRPORT ADVERTISING BANK, CA [] AIRPORT MEDIA GUIDE AIRPORT ADVERTISING Airport advertising delivers your message to a saturated audience of affluent, educated, tech-savvy business and leisure travelers
AIRPORT ADVERTISING SPOKANE, WA [GEG] AIRPORT MEDIA GUIDE
![AIRPORT ADVERTISING SPOKANE, WA [GEG] AIRPORT MEDIA GUIDE](/thumbs/73/69473863.jpg "AIRPORT ADVERTISING SPOKANE, WA [GEG] AIRPORT MEDIA GUIDE") AIRPORT ADVERTISING SPOKANE, WA [] AIRPORT MEDIA GUIDE AIRPORT ADVERTISING Airport advertising delivers your message to a saturated audience of affluent, educated, tech-savvy business and leisure travelers
AIRPORT ADVERTISING SPOKANE, WA [] AIRPORT MEDIA GUIDE AIRPORT ADVERTISING Airport advertising delivers your message to a saturated audience of affluent, educated, tech-savvy business and leisure travelers
March 2011 Visitor Profile
 RESEARCH DATA SERVICES, INC. 777 SOUTH HARBOUR ISLAND BOULEVARD SUITE 260 TAMPA, FLORIDA 33602 TEL (813) 254-2975 FAX (813) 223-2986 Visit St. Petersburg/Clearwater March 2011 Visitor Profile Prepared
TRAVEL HABITS OF THE BAY AREA MILLENNIAL
 TRAVEL HABITS OF THE BAY AREA MILLENNIAL It s no surprise San Francisco International Airport is one of the busiest airports in the world since the Bay Area is home to some of the most prolific travelers
April 2011 Visitor Profile
 RESEARCH DATA SERVICES, INC. 777 SOUTH HARBOUR ISLAND BOULEVARD SUITE 260 TAMPA, FLORIDA 33602 TEL (813) 254-2975 FAX (813) 223-2986 Visit St. Petersburg/Clearwater April 2011 Visitor Profile Prepared
May 2009 Visitor Profile
 RESEARCH DATA SERVICES, INC. 3825 HENDERSON BOULEVARD SUITE 300 TAMPA, FLORIDA 33629 TEL (813) 254-2975 FAX (813) 254-2986 Visit St. Petersburg/Clearwater May 2009 Visitor Profile Prepared for: Pinellas
Get your wishes fulfilled. Make the most of your marketing in the Middle East during Ramadan
 Get your wishes fulfilled Make the most of your marketing in the Middle East during Ramadan Ramadan Rundown This year, Ramadan will begin on May 15 th eleven days before it did last year (May 26 th ) Ramadan
2011 North Carolina Visitor Profile
 2011 North Carolina Visitor Profile A publication of the North Carolina Division of Tourism, Film & Sports Development May 2012 North Carolina Division of Tourism, Film and Sports Development 2011 North
Impact of Advance Purchase and Length-of-Stay on Average Ticket Prices in Top Business Destinations
 Impact of Advance Purchase and Length-of-Stay on Average Ticket Prices in Top Business Destinations Research Summary Average ticket prices continue to trend downward in 2016, but since 2014 there have
Oregon 2009 Visitor Report June, 2010
 Oregon 2009 Visitor Report June, 200 Table of Contents Introduction...... 3 Methodology.. 4 U.S. Travel Market Size & Structure.. 5 Oregon s Travel Market Size & Structure...... Overnight Trip Detail............
2013 IRVING HOTEL GUEST SURVEY Final Project Report
 2013 IRVING HOTEL GUEST SURVEY Final Project Report Research prepared for the Irving Convention & Visitors Bureau by Destination Analysts, Inc. Table of Contents SECTION 1 Introduction 2 SECTION 2 Executive
St. Petersburg/Clearwater Area Convention and Visitors Bureau. September 2006 Visitor Profile
 RESEARCH DATA SERVICES, INC. 405 NORTH REO STREET SUITE 100 TAMPA, FLORIDA 33609 TEL (813) 254-2975 FAX (813) 254-2986 St. Petersburg/Clearwater Area Convention and Visitors Bureau September 2006 Visitor
Oregon 2011 Visitor Final Report
 Oregon 0 Visitor Final Report Table of Contents Introduction...... 3 Methodology.. U.S. Travel Market Size & Structure..... 5 Oregon Travel Market Size & Structure... Overnight Trip Detail............
This study is brought to you courtesy of.
 This study is brought to you courtesy of www.google.com/think/insights 2010 Air Traveler s Road to Decision The Role of Digital on Airline Travelers Google/OTX U.S., September 2010 Research Methodology
2015 IRVING HOTEL GUEST SURVEY Final Project Report
 2015 IRVING HOTEL GUEST SURVEY Final Project Report Research prepared for the Irving Convention & Visitors Bureau by Destination Analysts, Inc. Table of Contents S E C T I O N 1 Introduction 2 S E C T
Advertise. at Blue Grass Airport. Opportunities to Reach Travelers from around the Globe
 Advertise at Blue Grass Airport Opportunities to Reach Travelers from around the Globe For more information on advertising opportunities, contact Amy Caudill at 859.425.3126 or acaudill@bluegrassairport.com
2011 Visitor Profile Survey
 2011 Visitor Profile Survey Prepared for RSCVA February 23, 2012 Executive Summary for RSCVA Board of Directors 436 14th Street, Suite 820 Oakland, CA 94612 (510) 844-0680 Research goals 2 Survey a representative
2009 North Carolina Regional Travel Summary
 2009 North Carolina Regional Travel Summary A publication of the North Carolina Division of Tourism, Film & Sports Development July 2010 July 2010 Division of Tourism, Film and Sports Development 2009
Oregon 2013 Visitor Report
 Oregon 0 Visitor Report Table of Contents Introduction...... Methodology.. 4 U.S. Travel Market Size & Structure..... 5 Oregon Travel Market Size & Structure... 9 Overnight Trip Detail............ 7 Overnight
BRANSON 2 nd QUARTER 2014 MARKETING REPORT
 BRANSON 2 nd QUARTER 2014 MARKETING REPORT October 14, 2014 Branson Convention & Visitors Bureau PRESENTATION OVERVIEW Economic Overview Travel Industry Update Branson 2Q 2014 Update ECONOMIC OUTLOOK Consumer
Juneau Household Waterfront Opinion Survey
 Juneau Household Waterfront Opinion Survey Prepared for: City and Borough of Juneau Prepared by: April 13, 2004 TABLE OF CONTENTS Executive Summary...1 Introduction and Methodology...6 Survey Results...7
Evaluating Lodging Opportunities
 Evaluating Lodging Opportunities This section explores market opportunities for new lodging accommodations in the downtown area. It will help you understand travel and visitation trends, existing competition,
Exploring travel in Suzanne Devai, Research Director
 Exploring travel in 2015 Suzanne Devai, Research Director How does an improving economic outlook impact on the travel sector? 2 Feb-08 May-08 Aug-08 Nov-08 Feb-09 May-09 Aug-09 Nov-09 Feb-10 May-10 Aug-10
LOS ANGELES. Results Event Summary FEBRUARY 18-19, 2017 LOS ANGELES CONVENTION CENTER FIND US: SUPPORTING SPONSORS: CONTRIBUTING SPONSORS:
 LOS ANGELES FEBRUARY 18-19, 2017 LOS ANGELES CONVENTION CENTER W W W.T R AV E L S H O W S. C O M Results Event Summary MAJOR SPONSOR: 1000Tips SUPPORTING SPONSORS: Experience Pavilion CONTRIBUTING SPONSORS:
Oregon 2013 Regional Visitor Report The Southern Region
 Oregon 01 Regional Visitor Report The Southern Region Introduction Longwoods International began tracking American travelers in 1985, and has conducted large-scale syndicated visitor research quarterly
2014 West Virginia Image & Advertising Accountability Research
 2014 West Virginia Image & Advertising Accountability Research November 2014 Table of Contents Introduction....... 3 Purpose... 4 Methodology.. 5 Executive Summary...... 7 Conclusions and Recommendations.....
PLATINUM AIRPORT SPONSORSHIPS
 PLATINUM AIRPORT SPONSORSHIPS 2011 JCDecaux Airport is pleased to offer ten exceptional sponsorship programs designed to reach the elite traveling public in our most important markets. Own a Piece of New
PLATINUM AIRPORT SPONSORSHIPS
 PLATINUM AIRPORT SPONSORSHIPS JCDecaux Airport is pleased to offer ten exceptional sponsorship programs designed to reach the elite traveling public in our most important markets. Own a Piece of New York
AIRPORT ADVERTISING LAS VEGAS, NV [LAS] AIRPORT MEDIA GUIDE
![AIRPORT ADVERTISING LAS VEGAS, NV [LAS] AIRPORT MEDIA GUIDE](/thumbs/75/72625833.jpg "AIRPORT ADVERTISING LAS VEGAS, NV [LAS] AIRPORT MEDIA GUIDE") AIRPORT ADVERTISING VEGAS, NV [] AIRPORT MEDIA GUIDE AIRPORT ADVERTISING Airport advertising delivers your message to a saturated audience of affluent, educated, tech-savvy business and leisure travelers
AIRPORT ADVERTISING VEGAS, NV [] AIRPORT MEDIA GUIDE AIRPORT ADVERTISING Airport advertising delivers your message to a saturated audience of affluent, educated, tech-savvy business and leisure travelers
Tampa Bay 2014 Visitor Report
 Tampa Bay 2014 Visitor Report Table of Contents Introduction...... Research Objectives 4 Methodology. 5 Size & Structure of the U.S. Travel Market.. 6 Size & Structure of Tampa Bay s Domestic Travel Market..
WASHINGTON, DC. Results Event Summary JANUARY 14-15, 2017 WASHINGTON CONVENTION CENTER
 WASHINGTON, DC JANUARY 14-15, 2017 WASHINGTON CONVENTION CENTER WWW.TRAVELSHOWS.COM Results Event Summary NATIONAL MEDIA SPONSOR: OFFICIAL TRAVEL AGENCY PARTNER: 1000Tips BROADCAST SPONSOR: PHOTO BOOTH
CANADIAN TRAVEL MARKET. Culture & Entertainment Activities While on Trips of One or More Nights. Overview Report.
 CANADIAN TRAVEL MARKET Culture & Entertainment Activities While on Trips of One or More Nights Overview Report February 29, 2008 Prepared by Lang Research Inc. on behalf of: Ontario Ministry of Tourism,
Oregon 2015 Visitor Report
 Oregon 05 Visitor Report Table of Contents Introduction...... Methodology.. 4 Key Findings. 5 Size & Structure of the U.S. Travel Market.. 9 Size & Structure of Oregon s Travel Market Overnight Trip Detail............
BRAZIL INTERNATIONAL INBOUND TRAVEL MARKET PROFILE (2011) Copyright 2012 by the U.S. Travel Association. All Rights Reserved.
 Copyright 2012 by the U.S. Travel Association. All Rights Reserved.") BRAZIL INTERNATIONAL INBOUND TRAVEL MARKET PROFILE (211) Copyright 212 by the U.S. Travel Association. All Rights Reserved. EXECUTIVE SUMMARY With a population of nearly 2 million and a GDP exceeding $2
BRAZIL INTERNATIONAL INBOUND TRAVEL MARKET PROFILE (211) Copyright 212 by the U.S. Travel Association. All Rights Reserved. EXECUTIVE SUMMARY With a population of nearly 2 million and a GDP exceeding $2
September 2016 Visitor Profile
 RESEARCH DATA SERVICES, INC. 777 SOUTH HARBOUR ISLAND BOULEVARD SUITE 26 TAMPA, FLORIDA 3362 TEL (813) 254-2975 FAX (813) 223-2986 Visit St. Petersburg/Clearwater September 216 Visitor Profile Prepared
JATA Market Research Study Passenger Survey Results
 JATA Market Research Study Passenger Survey Results Prepared for the Jackson Area Transportation Authority (JATA) April, 2015 3131 South Dixie Hwy. Suite 545 Dayton, OH 45439 937.299.5007 www.rlsandassoc.com
2015 Business Survey Report Erie to Pittsburgh Trail March 2015
 2015 Business Survey Report Erie to Pittsburgh Trail March 2015 Table of Contents Executive Summary 2 2013 EPT Trail User Survey and Impact Analysis 3 Overview 3 Results 3 2014 2015 Erie to Pittsburgh
Get your wishes fulfilled. Make the most of your marketing in Turkey during Ramadan
 Get your wishes fulfilled Make the most of your marketing in Turkey during Ramadan Ramadan Rundown This year, Ramadan will begin on May 15 th eleven days before it did last year (May 26 th ) Ramadan this
This study is brought to you courtesy of.
 This study is brought to you courtesy of www.google.com/think/insights 2010 Hotel Traveler s Road to Decision The Role of Digital on Hotel Travelers Google/OTX U.S., September 2010 Research Methodology
Oregon 2015 Regional Visitor Report The Central Region
 Oregon 015 Regional Visitor Report The Central Region Introduction Longwoods International began tracking American travelers in 1985, and has conducted large-scale syndicated visitor research quarterly
Advertising Opportunities & Sponsors Rate Sheet
 Advertising Opportunities & Sponsors Rate Sheet SiestaMan s The Last Sunset in Paradise 2007 Why advertise with SiestaMan? Tourism icon with beautiful bikini co-hosts producing a unique brand of travel
Santa Barbara County Association of Governments 2002 COMMUTE PROFILE
 Santa Barbara County Association of Governments 2002 COMMUTE PROFILE for Santa Barbara, San Luis Obispo and Ventura Counties FINAL REPORT Santa Barbara County Association of Governments - 2002 COMMUTE
TripAdvisor Workshop Christchurch 7 June 2016
 TripAdvisor Workshop Christchurch 7 June 2016 TripAdvisor: The World s Largest Travel Site 1 M I L L I O N Reviews & Opinions 3402005 MILLION 2000 Unique visitors a month M I L L I O N 350 r e vie w s
The Housing Market and the Macroeconomy
 The Housing Market and the Macroeconomy New England Mortgage Bankers Association October 2, 2009 1 The World is in a Deep Recession In the U.S. EMPLOYMENT: Job losses in August, 2009: -216,000 Job losses
Oregon 2015 Regional Visitor Report The Mt. Hood-Columbia River Gorge Region
 Oregon 015 Regional Visitor Report The Mt. Hood-Columbia River Gorge Region Introduction Longwoods International began tracking American travelers in 1985, and has conducted large-scale syndicated visitor
March 2014 Passenger and Cargo Traffic Statistics Reno-Tahoe International Airport
 March 2014 Passenger and Cargo Traffic Statistics Reno-Tahoe International Airport April 25, 2014 U.S. DOMESTIC INDUSTRY OVERVIEW FOR MARCH 2014 All RNO Carriers Domestic Systemwide year over year comparison
Cedar Rapids Area Convention and Visitors Bureau Visitor Study
 Cedar Rapids Area Convention and Visitors Bureau Visitor Study 2003-2004 University of Northern Iowa Sustainable Tourism & The Environment Program www.uni.edu/step Project Directors: Sam Lankford, Ph.D.
West Virginia 2011 Overnight Visitor Final Report
 West Virginia 011 Overnight Visitor Final Report June, 01 Table of Contents Introduction...... Methodology.. Travel Market Size & Structure... 5 Overnight Expenditures.. 11 Overnight Trip Characteristics...
Factors Influencing Visitor's Choices of Urban Destinations in North America
 Factors Influencing Visitor's Choices of Urban Destinations in North America Ontario Ministry of Tourism and Recreation May 21, 2004 Study conducted by Global Insight Inc. Executive Summary A. Introduction:
2006 RENO-SPARKS VISITOR PROFILE STUDY
 2006 RENO-SPARKS VISITOR PROFILE STUDY PREPARED FOR RENO-SPARKS CONVENTION & VISITOR AUTHORITY Study Conducted and Reported by 475 Hill Street, Suite 2 Reno, Nevada 89501 (775) 323-7677 www.infosearchintl.com
Tampa/Hillsborough County Visitor Report
 Tampa/Hillsborough County 015 Visitor Report Table of Contents Introduction.. Research Objectives.... Methodology... 5 Key Findings 6 Size & Structure of the U.S. Travel Market.... 10 Size & Structure
USING SPECIAL INTERESTS TO DRIVE TRAVEL. Chris Atkinson TNZ Marketing Communications Manager Sectors Wednesday 12 March, 9am
 USING SPECIAL INTERESTS TO DRIVE TRAVEL Chris Atkinson TNZ Marketing Communications Manager Sectors Wednesday 12 March, 9am Agenda 1. Introduction 2. Special Interest (SI) overview and definition 3. Recap:
EXECUTIVE SUMMARY. West Michigan Whitecaps Midwest League Class A Affiliate of the Detroit Tigers. The Team: The Games:
 EXECUTIVE SUMMARY The Team: The Games: The Field: The History: The FUN! West Michigan Whitecaps Midwest League Class A Affiliate of the Detroit Tigers 70 home games from April through early September,
Department of Agricultural and Resource Economics, Fort Collins, CO
 June 2007 EDR 07-15 Department of Agricultural and Resource Economics, Fort Collins, CO 80523-1172 http://dare.colostate.edu/pubs OF WINE AND WILDLIFE: ASSESSING MARKET POTENTIAL FOR COLORADO AGRITOURISM
RESULTS - EVENT SUMMARY
 PHILADELPHIA MARCH 10-11, 2018 PENNSYLVANIA CONVENTION CENTER WWW.TRAVELSHOWS.COM RESULTS - EVENT SUMMARY FIND US: /TravelandAdventureShow @TravAdventure /TravAdventure 2018 PHILADELPHIA TRAVEL & ADVENTURE
NEW OPPORTUNITIES IN DIGITAL PRESS FOR THE GLOBAL TRAVEL INDUSTRY
 NEW OPPORTUNITIES IN DIGITAL PRESS FOR THE GLOBAL TRAVEL INDUSTRY DIGIREDOO FROM DAWSON MEDIA DIRECT IS NOW AVAILABLE ON EUROSTAR TRAINS, EXPANDING POTENTIAL PASSENGER REACH TO OVER 5 MILLION PASSENGERS
Oregon 2015 Regional Visitor Report The Coast Region
 Oregon 05 Regional Visitor Report The Coast Region Introduction Longwoods International began tracking American travelers in 985, and has conducted large-scale syndicated visitor research quarterly since
Florida s Paradise Coast. Leading the Way to Prosperity
 Florida s Paradise Coast Leading the Way to Prosperity Ten Years in Review Measure 2003 2013 Average Daily Rate $130.32 $166.10 Overnight Visitors 1,312,987 1,573,000 Direct Expenditures $581.5 M $962.5
Minnesota 2014 Visitor Report June 2015
 Minnesota 04 Visitor Report June 0 Table of Contents Introduction Methodology 4 U.S. Travel Market Trends Size and Structure of Minnesota s Travel Market 9 Overnight Trip Detail 6 Overnight Trip Characteristics
SpendTrend Summer Travel and Spending Analysis
 SpendTrend Summer Travel and Spending Analysis July 2018 1 2018 First Data Corporation. All rights reserved. The First Data name, logo and related trademarks and service marks are owned by First Data Corporation
West Virginia 2013 Visitor Report
 West Virginia 013 Visitor Report Table of Contents Introduction...... 3 Research Objectives 4 Research Method. 5 Travel Market Size & Structure.... Overnight Expenditures.. 11 Overnight Trip Characteristics...
Duluth, MN 2015 Visitor Report
 Duluth, MN 015 Visitor Report Table of Contents Introduction...... Methodology.. Key Findings. 5 Size & Structure of the U.S. Travel Market.. 9 Size & Structure of Duluth s Travel Market 1 Overnight Trip
March 2012 Visitor Profile
 RESEARCH DATA SERVICES, INC. 777 SOUTH HARBOUR ISLAND BOULEVARD SUITE 260 TAMPA, FLORIDA 33602 TEL (813) 254-2975 FAX (813) 223-2986 Naples, Marco Island, Everglades Convention and Visitors Bureau March
CHARACTERISTICS OF TRAVELERS FROM MEXICO (Air) TO CALIFORNIA
 TO CALIFORNIA") CHARACTERISTICS OF TRAVELERS FROM MEXICO (Air) TO CALIFORNIA - 2013 Air travelers from Mexico represent one of the largest international markets for California with approximately 515,000 visitors to the
CHARACTERISTICS OF TRAVELERS FROM MEXICO (Air) TO CALIFORNIA - 2013 Air travelers from Mexico represent one of the largest international markets for California with approximately 515,000 visitors to the
JANUARY 19-21, 2018 GREATER COLUMBUS CONVENTION CENTER GET YOUR SHARE OF OHIO S $1.5 BILLION VACATION & TRAVEL SPENDING!
 DON T MISS This Opportunity GREATER COLUMBUS CONVENTION CENTER GET YOUR SHARE OF OHIO S $1.5 BILLION VACATION & TRAVEL SPENDING! Ohioans spend more than $1.5 billion on vacation travel and accommodations
Number of tourism trips of residents increased namely for leisure
 Tourism Demand of Residents 1 st Quarter 2018 25 July 2018 Number of tourism trips of residents increased namely for leisure In the 1 st quarter 2018, residents in Portugal took a total of 4.5 million
MARKET INSIGHTS UPDATE North America
 SPOTLIGHT ON: THE SHOULDER TRAVEL SEASON PG2 A monthly update including relevant information on travel industry trends, consumer and meetings market research, competitive intelligence, and Hawai i s performance
November 2013 Passenger and Cargo Traffic Statistics Reno-Tahoe International Airport
 November 2013 Passenger and Cargo Traffic Statistics Reno-Tahoe International Airport December 26, 2013 U.S. DOMESTIC INDUSTRY OVERVIEW FOR NOVEMBER 2013 All RNO Carriers Domestic Systemwide year over
2012 North Carolina Visitor Profile
 2012 North Carolina Visitor Profile A publication of the North Carolina Division of Tourism, Film & Sports Development April 2013 North Carolina Division of Tourism, Film and Sports Development 2012 North
Introducing Aces... Key Differentiators. Aces 78% Visited casino on P12M trip
 Introducing... 8% Predominantly driven by a love of gaming and gambling, this segment loves casinos and the related ambiance that provides them with a sense of escape. For this group, the casino resort
IATOS 2003 Outdoor Enthusiast Survey CTC Market Research March, 2003
 IATOS 2003 Outdoor Enthusiast Survey CTC Market Research March, 2003 The IATOS Expo (International Adventure Travel and Outdoor Sports Show, Chicago, February 2003) provided the CTC s Outdoor Product Development
October 2011 Visitor Profile
 RESEARCH DATA SERVICES, INC. 777 SOUTH HARBOUR ISLAND BOULEVARD SUITE 260 TAMPA, FLORIDA 33602 TEL (813) 254-2975 FAX (813) 223-2986 Naples, Marco Island, Everglades Convention and Visitors Bureau October
Fort Lauderdale August 8, 2017
 Fort Lauderdale August 8, 2017 8/10/2017 TAP Software Analytics Division Brian Finucane TAP Reports Jeff Eastman TAP Hotel Reports Jeanne Eastman TAP Data Source Jeff Eastman Cloud Database Numerous Data
JAPAC TRAVELLER REPORT. Transit/Carrier. Peak time for engagement. Top engaged audience. Repeat Travellers per month. Tokyo.
 Tokyo JAPAC TRAVELLER REPORT Delhi Mumbai Hong Kong Macau Manila Bangkok Kuala Lumpur Singapore Jakarta Sydney Melbourne Tokyo Hong Kong Delhi Mumbai Macau Bangkok Kuala Lumpur Singapore Jakarta Manila
Salt Lake Downtown Alliance. June 2018
 Salt Lake Downtown Alliance June 2018 2 SURVEY DETAILS Short telephone survey updating previous benchmark data around key topics 609 respondents ±4% margin of error Trending is provided for all questions
April 2012 Visitor Profile
 RESEARCH DATA SERVICES, INC. 777 SOUTH HARBOUR ISLAND BOULEVARD SUITE 260 TAMPA, FLORIDA 33602 TEL (813) 254-2975 FAX (813) 223-2986 Naples, Marco Island, Everglades Convention and Visitors Bureau April
GENERAL AVIATION LUXURY TRAVEL BUSINESS TRAVEL
 GENERAL AVIATION LUXURY TRAVEL BUSINESS TRAVEL 2017 Contents 03 What Does FlightAware Do? 04 FlightAware Demographics 06 Authoritative Source for Press 07 Sponsorship Opportunities 08 Newsletter and Flight
Oregon 2011 Regional Visitor Report The Eastern Region
 Oregon 2011 Regional Visitor Report The Eastern Region Introduction Longwoods International began tracking American travelers in 1985, and has conducted large-scale syndicated visitor research quarterly
Who Visits Louisiana. A Presentation For the Louisiana Travel Promotion Association March 15, 2007
 Who Visits Louisiana A Presentation For the Louisiana Travel Promotion Association March 15, 2007 Louisiana Market Share of U.S.Resident Visitors 2.4% 2.4% 2.3% 2.3% 2.2% 2.2% 2.1% 2.1% 2.0% 2.0% 2.4%
Oregon 2011 Regional Visitor Report The Central Region
 Oregon 2011 Regional Visitor Report The Central Region Introduction Longwoods International began tracking American travelers in 1985, and has conducted large-scale syndicated visitor research quarterly
West Virginia 2009 Visitor Report December, 2010
 West Virginia 009 Visitor Report December, 010 Table of Contents Introduction...... Methodology.. 4 Travel Market Size & Structure... 6 Overnight Expenditures.. 1 Overnight Trip Characteristics... 16 Demographic
Inter-Office Memo Reno-Tahoe Airport Authority
 Inter-Office Memo Reno-Tahoe Airport Authority Date: November 30, 2009 To: Statistics Recipients From: Krys T. Bart, A.A.E., President/CEO Subject: RENO-TAHOE INTERNATIONAL AIRPORT PASSENGER STATISTICS
Introducing Connected Explorers...
 Introducing... 8 Use smart phone/ tablet when travelling Key Differentiators 46 79 This segment has a psychological need to take a break from the everyday and be exposed to new experiences and knowledge.
National Housing Trends
 National Housing Trends America s Choice of Best Long Term Investment Gallup 2017 The Cost of RENTING vs. BUYING HISTORICALLY: NOW: Percentage of Income Needed to Afford Median Rent 25.8% 29.2% Percentage
Existing Services, Ridership, and Standards Report. June 2018
 Existing Services, Ridership, and Standards Report June 2018 Prepared for: Prepared by: Contents Overview of Existing Conditions... 1 Fixed Route Service... 1 Mobility Bus... 34 Market Analysis... 41 Identification/Description
2012 Homewood Suites WorkStyles Study
 2012 Homewood Suites WorkStyles Study June, 2012 Shawn Yan Market Research Department Executive Summary Overall, many business travelers spent 3 to 10 nights on the road in the past year. The average length
MARKET TRENDS AND OPPORTUNITIES
 Team North America Chicago Los Angeles New York San Francisco MARKET TRENDS AND OPPORTUNITIES Tourism Marketing Workshop Manila, Philippines 10-12 October 2012 Historical Outbound Travel Data United States,
Frequent Fliers Rank New York - Los Angeles as the Top Market for Reward Travel in the United States
 Issued: April 4, 2007 Contact: Jay Sorensen, 414-961-1939 IdeaWorksCompany.com Frequent Fliers Rank New York - Los Angeles as the Top Market for Reward Travel in the United States IdeaWorks releases report
Puerto Ricans in Georgia, the United States, and Puerto Rico, 2014
 Issued September 2016 Centro DS2014GA-14 Puerto Ricans in Georgia, the United States, and Puerto Rico, 2014 In 2014, an estimated 89,462 Puerto Ricans lived in Georgia and accounted for 1.7 percent of
Risk Assessment in Winter Backcountry Travel
 Wilderness and Environmental Medicine, 20, 269 274 (2009) ORIGINAL RESEARCH Risk Assessment in Winter Backcountry Travel Natalie A. Silverton, MD; Scott E. McIntosh, MD; Han S. Kim, PhD, MSPH From the
Special Events Internal or External
 Merit Winners The Regional Municipality of Durham Kerri King The Regional Municipality of Durham Whitby, Ontario, Canada Need/Opportunity / The Regional Municipality of Durham is the largest geographic
2001 PACKAGED TRAVEL IN NORTH AMERICA TRAVELER PROFILE AND ECONOMIC IMPACTS
 00 PACKAGED TRAVEL IN NORTH AMERICA TRAVELER PROFILE AND ECONOMIC IMPACTS November 00 Prepared for National Tour Association PACKAGED TRAVEL IN NORTH AMERICA TRAVELER PROFILE AND ECONOMIC IMPACTS, 00
Cruise Industry Overview
 FLORIDA-CARIBBEAN CRUISE ASSOCIATION 11200 Pines Blvd., Suite 201 ~ Pembroke Pines, Florida 33026 Phone: (954) 441-8881 ~ Fax: (954) 441-3171 ~ E-mail: fcca@f-cca.com ~ Website: www.f-cca.com Cruise Industry
to Market Your Travel Products and Services to Ohio s Most Sought-After Travel Enthusiasts!
 This Opportunity to Market Your Travel Products and Services to Ohio s Most Sought-After Travel Enthusiasts! GREATER COLUMBUS CONVENTION CENTER GET YOUR SHARE OF OHIO S $1.5 BILLION VACATION & TRAVEL SPENDING!
Bus Shelter Advertising Programs
 Bus Shelter Advertising Programs Benefits of Bus Shelter Advertising Bus Shelter Displays offer uncluttered showcases for advertising. They provide eye-level visibility to vehicular and pedestrian traffic
InterContinental Brand Simon Scoot -Vice President InterContinental Brand Management. June 2010
 InterContinental Brand Simon Scoot -Vice President InterContinental Brand Management June 2010 1 Video Brand History 2 InterContinental: leading global network Americas: System = 55 hotels Pipeline = 6
EFFECTS OF CITYWIDE CONVENTIONS ON DOWNTOWN VANCOUVER HOTELS IN 2016
 EFFECTS OF CITYWIDE CONVENTIONS ON DOWNTOWN VANCOUVER HOTELS IN 2016 NICOLETTE DOUGLAS CONSULTING APRIL 2017 TABLE OF CONTENTS EXECUTIVE SUMMARY... 3 BACKGROUND AND PURPOSE... 6 APPROACH... 6 ANALYSIS...
2017/ Q1 Performance Measures Report
 2017/2018 - Q1 Performance Measures Report Contents Ridership & Revenue... 1 Historical Revenue & Ridership... 1 Revenue Actual vs. Planned... 3 Mean Distance Between Failures... 5 Maintenance Cost Quarter
January 2018 Air Traffic Activity Summary
 January 2018 Air Traffic Activity Summary Jan-2018 Jan-2017 CY-2018 CY-2017 Passengers 528,947 505,421 4.7% 528,947 505,421 4.7% Passengers 537,332 515,787 4.2% 537,332 515,787 4.2% Passengers 1,066,279