Total Maximum Daily Loads of Bacteria for Poquoson River and Back Creek in the City of Poquoson and in York County, Virginia
|
|
|
- Briana Francis
- 5 years ago
- Views:
Transcription


1 Total Maximum Daily Loads of Bacteria for Poquoson River and Back Creek in the City of Poquoson and in York County, Virginia VIRGINIA DEPARTMENT OF ENVIRONMENTAL QUALITY 629 East Main Street Richmond, VA 2328 Draft Prepared by Virginia Institute of Marine Science Gloucester Point, VA July 30, 203
2 Table of Contents List of Figures... ii List of Tables... iii List of Abbreviations... iv EXECUTIVE SUMMARY... v.0 INTRODUCTION.... Background....2 Listing of Waterbodies under the CWA....3 Watershed Location and Description Designated Uses and Applicable Water Quality Standard Impairment Listing WATERSHED CHARACTERIZATION Topology, Soil, and Climate Landuse Water Quality Conditions SOURCE ASSESSMENT General Nonpoint sources Summary of Source Assessment TMDL DEVELOPMENT Overview Selection of a TMDL Endpoint Model Development for Computing TMDL Consideration of Critical Conditions and Seasonal Variation Margin of Safety TMDL Computation Summary of TMDL and Load Allocation IMPLEMENTATION AND PUBLIC PARTICIPATION General Staged Implementation Reasonable Assurance for Implementation Public Participation... 4 REFERENCES Appendix A: Model Development... A A. Model Development... A A.2 TMDL Development... A A.3 Source Distribution and Load Allocation... A24 Appendix B: Fecal coliform data collected by the Virginia Department of Health, Division of Shellfish Sanitation (VDH-DSS) In the Poquoson River.... B i
3 List of Figures Figure.: Location Map of the Poquoson River... 3 Figure.2: Delineation of the Poquoson River Sub-watersheds... 3 Figure.3: Locations of VDH-DSS Stations in the Poquoson River... 5 Figure.4: Locations of VA-DEQ Stations in the Poquoson River... 9 Figure 2.: Land Use of the Poquoson River Watershed... 2 Figure 2.2: Percentage Landuses of the Poquoson River Watershed... 5 Figure 2.3: Annual Distribution of Mean Fecal Coliform Concentration... 6 Figure 2.4: Monthly Averaged Fecal Coliform Concentration Distribution... 7 Figure 2.5: Monthly Mean and Standard Deviation of Fecal Coliform Concentration... 7 Figure 3.: MS4 Phase II in York County and City of Poquoson... 9 Figure 3.2: Septic System Locations in the Poquoson River Watershed... 2 Figure 3.3: Distribution of SSO Locations in the Poquoson River Watershed Figure 3.4: Cumulative Frequency Distributions of SSOs in the Poquoson River Watershed Figure 4.: Condemnation Shellfish Area of the Poquoson River Figure 4.2: Condemnation Shellfish Area of the Poquoson River Figure 4.3: Time Series Comparison of Daily Stream Flow between Model Simulation and EPA Watershed Model (Left Panel) and Observations from USGS Stream Gage in Figure 4.4: Time Series Comparison of Fecal Coliform Concentration between Model Simulation (Blue Lines) and Observations (Circles) from 2000 to The Red Lines Denote the Geometric Mean and 90 th Percentile Criteria Figure A.: Subwatersheds Model Segmentation... A2 Figure A.2: A Diagram of Estuarine Model Grid... A3 Figure A.3: Time Series Comparison of the Daily Stream Flow between Model Simulation and Observed Data from USGS Stream Gage in 985 and A5 Figure A.4: Long-term Accumulated Daily Stream Flow Comparison between Model Simulation and the Reference Flow Station USGS A5 Figure A.5: Model Calibration of Enterococci at Selected Stations in the Impaired Segments... A Figure A.6-: Model Results of Fecal Coliform Distribution at Station 53P-29 for Current Condition and after Load Reduction... A Figure A.6-2: Model Results of Fecal Coliform Distribution at Station 53P-34 for Current Condition and after Load Reduction... A2 Figure A.6-3: Model Results of Fecal Coliform Distribution at Station 53P-26 for Current Condition and after Load Reduction... A3 Figure A.6-4: Model Results of Fecal Coliform Distribution at Station 53P-9 for Current Condition and after Load Reduction... A4 Figure A.6-5: Model Results of Fecal Coliform Distribution at Station 53P-7B for Current Condition and after Load Reduction... A5 Figure A.6-6: Model Results of Fecal Coliform Distribution at Station 53P-46.7 for Current Condition and after Load Reduction... A6 Figure A.6-7: Model Results of Fecal Coliform Distribution at Station 53P-44.3 for Current Condition and after Load Reduction... A7 Figure A.6-8: Model Results of Fecal Coliform Distribution at Station 53P-8 for Current Condition and after Load Reduction... A8 Figure A.6-9: Model Results of Fecal Coliform Distribution at Station 53P-24 for Current Condition and after Load Reduction... A9 Figure A.6-: Model Results of Fecal Coliform Distribution at Station 53P-2 for Current Condition and after Load Reduction... A20 Figure B.: Locations of VDH-DSS stations monitored in the Poquoson River ( )... B ii
4 List of Tables Table.: Exceedances of the Fecal Coliform Criteria ( ) of Poquoson River DSS Monitoring Stations... 6 Table.2: The Water Types, Designated Uses, Impairments, WQC, and List Years for the Poquoson River Impaired Segments... 7 Table.3: VA-DEQ Measurements of Fecal Coliform in the Poquoson River... Table.4: VA-DEQ Measurements of Enterococci in the Poquoson River... Table 2.: Descriptions of Landuse... 2 Table 2.2: Landuse Descriptions and Percentages of the Poquoson River Watershed... 4 Table 2.3: Landuse Descriptions and Percentages of the Back Creek Watershed... 4 Table 3.: MS4 Permit Holders and the Area Occupied by Each MS4 Locality per TMDL Watershed... 8 Table 3.2: Human Population, Households, and Pets in the Poquoson River Watershed Table 3.3: Fecal Coliform Information for SSOs in the Poquoson River Watershed Table 3.4: Typical Wildlife Densities and Wildlife Habitat Table 3.5: A Summary of Livestock in the Poquoson River Watershed Table 3.6: Total Number of Slips by Marina in the Poquoson River Watershed Table 3.7: Summary of Source Distribution in the Poquoson River Watershed Table 3.8: Loadings from Source Categories as Percentage of Total Table 4.: Estimated Loads and Load Reductions for Fecal Coliform Table 4.2: Estimated Loads and Load Reductions for Jurisdictions Table 4.3: Pathogens TMDLs for Poquoson River and Back Creek (Counts/Day) Table 4.4: Reduction of Potential Sources Table A.: Estimated Loads and Load Reductions for Fecal Coliform... A22 Table A.2: Estimated Loads and Load Reductions for Fecal Coliform by City and County... A22 Table A.3: Estimated Loads and Load Reductions for Fecal Coliform by Impaired Segments... A23 Table A.4: The fecal coliform TMDLs for Impaired Segments... A23 Table A.5: Reduction of Potential Sources... A24 Table A.6: Load Allocation and Required Reduction for Fecal Coliform... A25 iii
5 List of Abbreviations BMP CFR CWA DGIF DSS EFDC EPA FA GIS HRSD IP LA LSPC MDL MOS MOU MS4s NLCD NPDES SWCB TAC TMDL USCB USDA USEPA USFWS USGS VA-DCR VA-DEQ VA-DGIF VDH VDOT VPDES WLA WQAIR WQC WQLS WQMIRA WQMP WQS WWTP Best Management Plan Code of Federal Regulations Clean Water Act Department of Game and Inland Fisheries Virginia Division of Shellfish Sanitation Environmental Fluid Dynamics Computer Code Environmental Protection Agency Future Allocation Geographic Information System Hampton Roads Sanitation District Implementation Plan Load Allocation Loading Simulation Program C++ Maximum Daily Load Margin of Safety Memorandum of Understanding Municipal Separate Storm Sewer Systems National Land Cover Data National Pollutant Discharge Elimination System State Water Control Board Technical Advisory Committee Total Maximum Daily Load United States Census Bureau United States Department of Agriculture United States Environmental Protection Agency E United States Fish and Wildlife Service United States Geological Survey Virginia Department of Conservation and Recreation Virginia Department of Environmental Quality Virginia Department of Game and Inland Fisheries Virginia Department of Health Virginia Department of Transportation Virginia Pollutant Discharge Elimination System Wasteload Allocation Water Quality Assessment Integrated Report Water Quality Criteria Water Quality Limited Segments Water Quality Monitoring, Information, and Restoration Act Water Quality Management Plans Water Quality Standard Wastewater Treatment Plant iv
6 EXECUTIVE SUMMARY Introduction Section 303(d) of the Clean Water Act (CWA) and the United States Environmental Protection Agency s (USEPA s) Water Quality Planning and Management Regulations (40 CFR Part 30) require states to develop total maximum daily loads (TMDLs) for waterbodies that are exceeding water quality standards (WQSs). TMDLs represent the total pollutant loading that a waterbody can receive without violating WQSs. The TMDL process establishes the allowable loadings of pollutants for a waterbody based on the relationship between pollution sources and in-stream water quality conditions. By following the TMDL process, states can establish controls based on water quality conditions to reduce pollution from both point and nonpoint sources to restore and maintain the quality of their water resources. A TMDL of the Poquoson River was completed in 2006 using a volumetric method for eleven shellfish harvesting impaired sites and one recreational impaired site (VA2006). Since 2006, new listings have been added to the TMDL list. In addition, three MS4 permits held within the Poquoson River watershed require allowable waste loads to be determined during the TMDL process. However, the previous TMDLs were not developed based on the watershed approach and did not have sufficient spatial resolution to estimate waste loads allocation from each jurisdiction for MS4 permits. In order to fulfill TMDL requirements, TMDL development using a watershed-based approach is needed for this watershed. The Poquoson River watershed is located along the Western Shore of the Chesapeake Bay about 4 km south of the York River mouth in the City of Poquoson and in York County, Virginia. Based on the water quality assessment, it does not support the primary contact recreation (e.g., swimming and fishing) and shellfish consumption designated uses. The Back Creek watershed is located north of the Poquoson watershed and drains to the Chesapeake Bay. It does not support its shellfish harvesting designated use. The TMDLs presented in this report have been developed to meet bacterial standards for the following impaired segments of the Poquoson River: Assessment Unit VAT-C07E_LMC 0A04 Water name Lambs Creek - Poquoson River Location Description South shore tributary to Poquoson R, west of Poquoson Shores. On border of Poquoson/York boundary. Between Moores Cr. and Roberts Cr to east. CBP Segment MOBPH. DSS Shellfish condemnation # C (effective ). Cause Category 4A Cause Name Fecal Coliform Size (miles) 0.6 v
7 VAT-C07E_PTC 0A04 Patricks Creek - Poquoson River North shore trib to Poquoson River south of Dare area. CBP Segment MOBPH. DSS Shellfish condemnation # D (eff ). 4A Fecal Coliform 0. VAT-C07E_ROB 0A04 VAT-C07E_WH H0A06 VAT-C07E_POQ 0A06 VAT-C07E_CHS 0A06 VAT-C07E_HOD 0A08 VAT-C07E_LYO 0A06 Roberts Creek - Upper White House Cove - Bennet Cr. Area Poquoson River - Upper [TMDL-CD] Chisman Creek-Upper & Goose Cr Hodges Creek - Upper Lyons Creek - Upper (DSS_06-IR) South of mouth of Poquoson R., between Hunts Pt. and Griffins Beach areas. CBP Segment MOBPH. DSS Shellfish condemnation # A (effective ). Located in York Haven Anchorage area, south of mouth of Poquoson R, CBP segment MOBPH. Portion of DSS Shellfish condemnation # C (effective ). From Rt 7 reservoir dam (RM 5.7) downstream to past confluence of Quarter March Cr (RM Calthrop Neck. Including Moores & Quarter March Creeks. CBP Segment MOBPH. DSS shellfish condemn # B (effective ). From end of tidal waters (upper 2/3 of creek), downstream to area of Evergreen Shores (approx. RM 0.9). CBP Segment MOBPH. DSS condemnation # B (effective ). North shore trib to Poquoson Fish Neck. CBP Segment MOBPH. Portion of DSS shellfish condemnation # A (effective ). South shore tributary to Poquoson R, in area of York Haven Anchorage. East of Roberts Cr. and north of White House Cove. CBP Segment MOBPH. Portion of DSS Shellfish condemnation # B (effective ). 4A 4A 4A 4A 5B 5B Fecal Coliform Fecal Coliform Fecal Coliform Enterococ -cus Fecal Coliform Fecal Coliform, Enterococ -cus Fecal Coliform, Enterococ -cus vi
8 VAT-C07E_FLY 0A06 VAT-C07E_CAB 0A08 Floyds Bay Cabin Creek - Upper Located in southeast corner of Bennett Cr, trib to Poquoson River. Area of York Haven Anchorage. Portion of DSS shellfish condemnation # D (effective ). CBP Segment MOBPH. Cabin Creek upstream portion (N of Poquoson R mouth) tributary to Poquoson River. From end of tidal waters downstream approx. /2 creek's length. CBP Segment MOBPH. DSS shellfish condemnation # (effective ). 5B Fecal Coliform 0.04 VAT-C07E_POQ 0B08 Poquoson River - Upper [No TMDL] From Pilney Point Estates downstream to end of Calthrop Neck. CBP Segment MOBPH. Portion of DSS shellfish condemn # B ( ) outside of TMDL for Poquoson R. TMDL (25403). 5B Fecal coliform, Enterococ -cus 0.2 VAT-C07E_POQ 02B08 Unnamed Crane [No TMDL] North shore trib to Poquoson R (incl. area adjacent to mouth of Patricks Cr.) at Crane. CBP Segment MOBPH. Portion of DSS shellfish condemnation # D (effective ). Outside TMDL for Patricks Creek [396]. 5B Fecal coliform 0.02 Additionally, included in this report is the bacteria TMDL for one impaired segment of Back Creek: Assessment Unit Water name Location Description Cause Category Cause Name Size (miles) VAT-C07E_BCK0 A00 Back Creek - Upper Back Creek (S of York R mouth) tributary to The Thorofare and Chesapeake Bay. From end of tidal waters downstream to point upstream of Dandy (RM.6). CBP Segment MOBPH. DSS shellfish condemnation # A (effective ). 5B Fecal coliform vii
9 Sources of Bacteria The watershed approach using information of landuse, survey, and observations was applied to conduct the source assessment. There is no point sources, such as a wastewater treatment plant (WWTP), in the Poquoson River watershed that discharges bacteria to the River. Three MS4 permits are held within the Poquoson River TMDL watershed. The potential sources of bacteria in the watershed include MS4 regulated areas, nonpoint sources such as livestock, wildlife, pets, human activities, failing septic systems, and Sanitary Sewer Overflows (SSOs). Modeling Approach A system of numerical models was applied to simulate the loadings of fecal coliform bacteria from the Poquoson River watershed, and the resulting response of in-stream fecal coliform concentrations. The watershed model, Loading Simulation Program in C ++ (LSPC), developed by the USEPA, was selected to simulate the watershed hydrology and fecal coliform load to the Poquoson River. The Environmental Fluid Dynamics Computer Code (EFDC) was used to simulate the transport and fate of fecal coliform bacteria in the receiving water. The model was calibrated based on field observations and the model simulation spanned a period of eight years. Endpoints The fecal coliform criteria for the shellfish designated use are more stringent than the enterococcus criteria for the recreation designated use. Therefore the endpoint selected for these TMDLs was based upon the fecal coliform bacteria since this will be protective of both designated uses. The numerical criteria for fecal coliform are a Geometric Mean of 4 MPN /0mL and a 90 th percentile of 49 MPN/0mL for a 30-month assessment period. As the 90 th percentile criterion is more stringent of these two criteria, it is used as the endpoint. For recreation areas, the enterococci criterion was applied. The numerical criteria for enterococci is that no more than % of the total samples in the assessment period shall exceed 4 cfu/0 ml and the monthly geometric mean does not exceed 35 cfu/0ml. the monthly geometric mean of 35 cfu/0ml was used as the endpoint. The endpoints were established based on the designated uses of shellfish harvesting and recreation uses with respect to each listed area. The stringent criteria are applied for the waterbody impaired by both pathogens. Load Allocation Scenarios For the shellfish and recreational use impairments, the appropriate water quality standard is a monthly geometric mean value of 4 MPN/0mL and a 90 th percentile value of 49 MPN/0mL for fecal coliform bacteria. Results from calibrated model simulation were used to establish the existing load in the system. The allowable load was calculated using the water quality standard criteria to establish the TMDLs. The difference between the TMDL and the existing loading (annual based loading) represents the necessary level of viii
10 reduction. In order to take into account future growth in the watershed, one percent (%) of the TMDL load is allocated to future growth (FA). There are three Phase II MS4 permits in the watershed: York County (VAR040028), City of Poquoson (VAR040024), and VDOT (VAR040044). Waste Loads (WLA) are allocated to these MS4s based on urbanized land within the regulated area of the watershed. The Technical Advisory Committee (TAC) recommended that the aggregation of the VDOT MS4 WLA with Poquoson and York s MS4 WLA was the best course of action. The remaining loads are nonpoint source loads and are allocated as Load Allocation (LA).The maximum reductions required to meet fecal coliform and enterococcus water quality standards are approximately 5.4% and 48.2% for the Poquoson River and Back Creek watersheds, respectively. The fecal coliform TMDL (counts/day) for the Poquoson and Back Creek watersheds are summarized below: Impairment WLA LA MOS TMDL Poquoson River 6.65E+ 2.29E+2 Implicit 2.96E+2 MS4 Poquoson (VAR040024) 2.87E+ VDOT (VAR040044) MS4 York (VAR040028) 3.48E+ VDOT (VAR040044) Future Load 2.96E+ Back Creek 9.46E+ 2.87E+ Implicit 3.82E+ MS4 York (VAR040028) 9.08E+ VDOT (VAR040044) Future Load 3.8E+09 *Each of the municipality MS4 loads has been aggregated with a portion of the adjacent VDOT MS4 load due to the continuity of the system. Where: TMDL =Total Maximum Daily Load (counts/day) LA = Load Allocation (nonpoint source) (counts/day) WLA =Wasteload Allocation (MS4) (counts/day) MOS =Margin of Safety The fecal coliform existing and allowable loads for York County and the Cities of Poquoson are summarized below: Waterbody Name Jurisdiction Existing Counts/Day TMDL Counts/Day Reduction Poquoson River City of Poquoson 2.46E+2.002E % York County 3.950E+2.955E % Sum 6.E E+2 5.5% Back Creek York County E+ 3.83E+ 48.2% The load allocation (LA) was partitioned to the nonpoint sources within the watershed based on the TMDL endpoint and modeling scenarios of source reduction to meet water quality standards. A complete reduction of controllable loads including human-derived ix
11 fecal coliform (septic, SSO, and marina), livestock, and pets is applied to the load allocation. Reduction for wildlife is considered when the reduction of controllable loads does not achieve the water quality standards for the estuary. Load allocation (combining LA and WLA) is summarized below: Waterbody Name Poquoson River Back Creek Category Current Load (Counts/Day) Allocation (Counts/Day) Reduction Needed (%) Wildlife 3.90E E Pets.44E E Livestock 3.8E+ 0.00E Septic 3.55E E SSO 3.0E+ 0.00E Marina.40E+ 0.00E Total 6.E E Wildlife 5.84E+ 3.8E Pets.50E+ 0.00E Livestock 5.90E E Septic.34E E SSO 0 0 Marina 0 0 Total 7.35E+ 3.8E Margin of Safety EPA regulations at 40 CFR 30.7 (c)() require TMDLs to take into account critical conditions for stream flow, loading, and water quality parameters. This was done by using long-term water quality data that cover different flow regimes, and an eight-year simulation to estimate the current bacteria loads and load reduction targets. An implicit margin of safety (MOS) was incorporated in this TMDL by establishing allocations that would meet both the geometric mean and 90 th percentile standards. Recommendations for TMDL Implementation The goal of this TMDL is to develop an allocation plan that achieves water quality standards during the implementation phase. Virginia's 997 Water Quality Monitoring, Information and Restoration Act (WQMIRA) states, in Section , that the "Board shall develop and implement a plan to achieve fully supporting status for impaired waters." The TMDLs developed for the Poquoson River watershed impairments provide allocation scenarios that will be a starting point for developing implementation strategies. Additional monitoring aimed at targeting the necessary reductions is critical to implementation development. Once established, continued monitoring will aid in tracking success toward meeting water quality milestones. Public participation is critical to the implementation process. Reductions in non-point x
12 source loading are the crucial factor in addressing the problem. These sources cannot be addressed without public understanding of, and support for, the implementation process. Stakeholder input will be critical from the onset of the implementation process in order to develop an implementation plan that will be truly effective. Public Participation Public participation was elicited at every stage of the TMDL development in order to receive inputs from stakeholders and to apprise the stakeholders of the progress made. Public meetings were organized for this purpose. The first public meeting was held on March 8, 203 at the Sandy Bottom Nature Park (255 Big Bethel Road, Hampton, VA), to inform the stakeholders of the TMDL development process and to obtain feedback. Results of the hydrologic calibration, bacteria source estimates, and TMDL development were discussed at the public meeting. Two Technical Advisory Committee (TAC) meetings were held at this location during the TMDL development processes. At both TAC meetings, held on May and June 26 of 203, stakeholders reviewed TMDL development processes and methodology, and provided comments and suggestions. Stakeholders also provided available data for the TMDL development. Input from these meetings was utilized in the development of the TMDL and improved confidence in the allocation scenarios and TMDL process. The second public meeting was held on July 30, 203, again at the Sandy Bottom Nature Park. Updated bacterial loading distribution and TMDL results were presented and discussed in the public meeting. xi
13 .0 INTRODUCTION. Background Section 303(d) of the Clean Water Act and the United States Environmental Protection Agency s (USEPA s) Water Quality Planning and Management Regulations (40 CFR Part 30) require states to develop Total Maximum Daily Loads (TMDLs) for waterbodies that are exceeding Water Quality Standards (WQSs). TMDLs represent the total pollutant loading that a waterbody can receive without violating WQSs. The TMDL process establishes the allowable loadings of pollutants for a waterbody that the waterbody can receive without violating WQSs. By following the TMDL process, states can establish controls based on water quality conditions to reduce pollution from both point and nonpoint sources to restore and maintain the quality of their water resources. The Poquoson River watershed is located along the Western Shore of the Chesapeake Bay about 4 km south of the York River mouth (Figure.). The Poquoson River drains northeast to the mainstem of the Bay, which then drains directly southeast to the Atlantic Ocean. A total of 2 segments of Poquoson River and segment of Back Creek are listed on the 2006 Virginia 305(b)/303(d) Water Quality Assessment Integrated Report (VA-DEQ, 2006) as an impaired waterbody due to violation of the State s water quality standards for fecal coliform and enterrococcus (see Table in Exec Summary). Based on the water quality assessment, it does not support its designated use of primary contact recreation (e.g., swimming and fishing) and providing shellfish growing areas. Figure.2 illustrates the delineation of the thirteen impaired segments. A TMDL has been developed to meet the fecal coliform standards. This document, upon approval of EPA, establishes fecal coliform TMDLs for these 3 impaired segments. A TMDL of the Poquoson River and Back Creek was completed in 2006 using a volumetric method for eleven shellfish harvesting impaired sites and one recreational impaired site (VA2006). Since 2006, new listings have been added to the TMDL list. In addition, three MS4 permits held within the Poquoson River watershed require allowable waste loads to be determined during the TMDL process. However, the previous TMDLs were not developed based on the watershed approach and did not have sufficient spatial resolution to estimate waste loads from each jurisdiction for MS4 permits. In order to fulfill TMDL requirements, TMDL development using a watershed-based approach is needed for this watershed..2 Listing of Waterbodies under the CWA WQSs are regulations based on federal or state law that set numeric or narrative limits on pollutants. Water quality monitoring is performed to measure pollutants and determine if the measured levels are within the bounds of the limits set for the uses designated for the waterbody. Waterbodies with pollutant levels that exceed the designated standards are considered impaired for the corresponding designated use (e.g. swimming, drinking, shellfish harvesting, etc.). Under the provisions of 303 (d) of the Clean Water Act (CWA), impaired waterways are placed on the list reported to the EPA. The impaired water list is included in the biennial 305(b)/ 303(d) Water Quality Assessment Integrated Report (WQAIR, VA-DEQ, 2006). Those waters placed on the list require the development of a TMDL and corresponding implementation plan intended to eliminate
.")
14 the impairment and bring the water into compliance with the designated standards..3 Watershed Location and Description The Poquoson River is located along the Western Shore of the Chesapeake Bay about 4 km south of the York River mouth (Figure.). The watershed is low in elevation and is characterized by nearly flat terrain, terraces, tidal marshes, and ponds. Brackish wetlands are common and serve as habitat for fish and shellfish and wildlife (Woods et al., 999). The watershed area for Poquoson River is 83.5 km 2 (20,630 acres) in size. The Poquoson River watershed is mainly wetlands, forested, and urban, which are 32%, 3%, and 29%, respectively, accounting for approximately 92% of the watershed area. The Back Creek is located north of the Poquoson watershed and drains to the Chesapeake Bay. The soil characteristics of the watershed are the same as the Poquoson River watershed. For the Back Creek watershed, wetland, forest, and urban landuses account for 48%, 9%, and 6%, respectively. 2

15 Figure.: Location Map of the Poquoson River Figure.2: Delineation of the Poquoson River Sub-watersheds.4 Designated Uses and Applicable Water Quality Standard.4. Designation of Uses According to Virginia WQSs (9VAC ): All State waters, including wetlands, are designated for the following uses: recreational uses, e.g., swimming and boating; the propagation and growth of a balanced, indigenous population of aquatic life, including game fish, which might reasonably be expected to inhabit them; wildlife; and the production of edible and marketable natural resources, e.g., fish and shellfish. The state promulgates standards to protect waters to ensure the uses designated for those waters are met. In Virginia s WQSs, certain standards are assigned by water class, while other standards are assigned to specifically described waterbodies/waterways to protect the designated uses of those waters. Virginia has seven waters classes (I through VII) 3
16 with DO, ph, and temperature criteria for each class (9VAC ). The identification of waters by class is found in the river basins section tables. The tables delineate the class of waters to which the basin section belongs in accordance with the class descriptions given in 9VAC By finding the class of waters for a basin section in the classification column and referring to 9VAC , the DO, ph, and maximum temperature criteria can be found for each basin section. Poquoson River is considered as a Class II water, Estuarine Water (Tidal Water-Coastal Zone to Fall Line) (9VAC )..4.2 Bacteria Standard Effective February, 20, VADEQ specified new bacteria standards in 9 VAC A. These standards replaced the existing fecal coliform standard of 9 VAC For a non-shellfish supporting waterbody to be in compliance with Virginia bacteria standards for primary contact recreation in a saltwater or transition zone, the current criteria are as follows: Enterococci bacteria shall not exceed a monthly geometric mean of 35 cfu/0 ml in transition and saltwater. If there are insufficient data to calculate monthly geometric means in transition and saltwater, no more than % of the total samples in the assessment period shall exceed enterococci 4 cfu/0 ml. For shellfish growing areas, the criteria used for developing TMDLs are outlined in 9 VAC and read as follows: In all open ocean or estuarine waters capable of propagating shellfish or in specific areas where public or leased private shellfish beds are present, and including those waters on which condemnation or restriction classifications are established by the State Department of Health, the following criteria for fecal coliform bacteria shall apply: The geometric mean fecal coliform value for a sampling station shall not exceed an MPN (most probable number) of 4 per 0 milliliters. The 90 th percentile shall not exceed an MPN of 43 for a 5-tube, 3-dilution test or 49 for a 3-tube, 3-dilution test. These standards are calculated using a 30-month window, which means that every consecutive 30-month data group must have a geometric mean of 4 MPN/0mL or less and a 90th percentile of 49 MPN/0mL or less to meet both standards..5 Impairment Listing Both the Virginia Department of Health - Division of Shellfish Sanitation (VDH-DSS) and the Department of Environmental Quality (VA-DEQ) conducted long-term observations. These data were used for assessing impairment and for supporting model development. 4

17 .5. VDH-DSS monitoring data The VDH-DSS state agency has occupied 64 fecal coliform measurement stations in the Poquoson River during the period The locations of these stations are shown in Figure.3 and time series for all stations are provided in Appendix B of this report. Sufficient exceedances of Virginia's WQSs for fecal coliform bacteria criteria were recorded at numerous stations to assess the segments of Poquoson River as not supporting of the CWA's shellfish harvesting area use support goal. The percentage of exceedances of the fecal coliform criteria for both the geometric mean and the 90 th percentile are tabulated in Table. for all 64 VDH-DSS stations. The designated uses, impairments, and criteria for Poquoson River segments are summarized in Table.2. Figure.3: Locations of VDH-DSS Stations in the Poquoson River 5
18 Table.: Exceedances of the Fecal Coliform Criteria ( ) of Poquoson Stream Name Station ID River DSS Monitoring Stations Number of Samples Geomean Criterion MPN/0 ml 6 Geomean Exceedance Percentage 90 th Percentile Criterion MPN/0 ml 90 th Percentile Exceedance Cabin Cr. 53P-A % % Cabin Cr. 53P-B % % Cabin Cr. 53P-C 4 0.0% % Chisman Cr. 53P % % Chisman Cr. 53P % % Chisman Cr. 53P % % Chisman Cr. 53P % % Chisman Cr. 53P % % Chisman Cr. 53P-6A % 49.2% Chisman Cr. 53P-6B % 49.6% Chisman Cr. 53P % % Chisman Cr. 53P % % Goose Cr. 53P-8D % % Goose Cr. 53P-9A % % Goose Cr. 53P-9B % % Goose Cr. 53P % % Goose Cr. 53P % % Poquoson R. 53P % % Poquoson R. 53P % 49 3.% Poquoson R. 53P % % Hodges Cove 53P-7A % % Hodges Cove 53P-7B % % Poquoson R. 53P % % Poquoson R. 53P % % Patricks Cr. 53P % % Patricks Cr. 53P-20A % % Patricks Cr. 53P % % Patricks Cr. 53P % % Qtr. March 53P % % Qtr. March 53P % % Qtr. March 53P % % Qtr. March 53P % % Qtr. March 53P % % Qtr. March 53P % % Qtr. March 53P % % Lambs Cr. 53P % % Lambs Cr. 53P % % Roberts Cr. 53P % % Roberts Cr. 53P % % Bennett Cr. 53P % % Whitehouse 53P % %
19 Whitehouse 53P % % Whitehouse 53P % % Whitehouse 53P % % Whitehouse 53P % % Whitehouse 53P-42A % % Whitehouse 53P % 49.4% Whitehouse 53P % % Whitehouse 53P % % Whitehouse 53P-44.2Z % % Whitehouse 53P % % Whitehouse 53P % % Whitehouse 53P-45Z % % Floyds Bay 53P % % Floyds Bay 53P % 49 3.% Floyds Bay 53P-46.5Z % % Floyds Bay 53P % % Floyds Bay 53P % 49.2% Floyds Bay 53P % % Floyds Bay 53P % % Bennett Cr. 53P % % Bennett Cr. 53P % % Bennett Cr. 53P % % Bennett Cr. 53P % % Table.2: The Water Types, Designated Uses, Impairments, WQC, and List Years Stream Name Lambs Creek Patricks Creek Roberts Creek White House Cove Poquoson River Upper Chisman Creek-upper Hodges Creek-upper Lyons Creek-upper for the Poquoson River Impaired Segments Water Type Tidal Tidal Tidal Tidal Tidal Tidal Tidal Tidal Designated Use Shellfish Harvesting Shellfish Harvesting Shellfish Harvesting Shellfish Harvesting Recreation, Shellfish Harvesting Shellfish Harvesting Recreation, Shellfish Harvesting Recreation, Shellfish 7 Impairment Fecal coliform Fecal coliform Fecal coliform Fecal coliform Fecal coliform Fecal coliform Fecal coliform Fecal coliform Criteria (MPN/0ml) Geomean <4 90 th percentile<49 Geomean <4 90 th percentile<49 Geomean <4 90 th percentile<49 Geomean <4 90 th percentile<49 Geomean <4 90 th percentile<49 Sample max 4 Geomean <4 90 th percentile<49 Geomean <35 Sample max 4 Geomean <35 Sample max 4 List Year
20 Stream Name Floyds Bay Cabin Creek-Upper Poquoson River - Upper Unnamed Crane Water Type Tidal Tidal Tidal Tidal Harvesting Designated Use Shellfish Harvesting Shellfish Harvesting Shellfish Harvesting Shellfish Harvesting Impairment Fecal coliform Fecal coliform Fecal coliform Fecal coliform Criteria (MPN/0ml) Geomean <4 90 th percentile<49 Geomean <4 90 th percentile<49 Geomean <4 90 th percentile<49 Geomean <4 90 th percentile<49 List Year VA-DEQ monitoring data In the Poquoson River, the VA-DEQ state agency has occupied 8 stations for the measurement of fecal coliform and 8 stations for the measurement of enterococci. Locations of these stations are shown in Figure.4. Table.3 shows the number of fecal coliform measurements and their average values for each station. Table.4 summarizes enterococci measurements by showing the number of samples at each station and the exceedance percentages based on the instantaneous criterion of 4 MPN/0 ml. Locations of VA-DEQ Stations Measuring Bacteria in the Poquoson River 7-GOO BTC CHS CHS00.88 Ñ Ñ Ñ Ñ 7BBEN BEN POQ004.2 Ñ Ñ 7-POQ POQ Ñ Ñ Meters 8
21 Figure.4: Locations of VA-DEQ Stations in the Poquoson River 9
22 Table.3: VA-DEQ Measurements of Fecal Coliform in the Poquoson River Station Number of Fecal Coliform Average Observations (MPN/0 ml) 7-BEN CHS CHS GOO POQ POQ POQ BBEN Table.4: VA-DEQ Measurements of Enterococci in the Poquoson River Station Number of Enterococci Average Percentage in Observations (MPN/0 ml) Violation* 7-BEN % 7-CHS % 7-CHS % 7-GOO % 7-POQ % 7-POQ % 7-POQ % 7BBEN % *For Enterococci, the criterion for violation is above an instantaneous value of 4 MPN/0 ML
23 2. Topology, Soil, and Climate 2.0 WATERSHED CHARACTERIZATION The Poquoson River watershed is categorized as Ecoregion 63b and 63c. The watershed is low in elevation and is characterized by nearly flat terrain, terraces, tidal marshes, and ponds. Brackish wetlands are common and serve as habitat for fish and shellfish and wildlife (Woods et al., 999). Typical soil profiles are loamy fine sand, fine sandy loam, and sand. Large portions of soil are characterized as hydrologic soil group C, which have moderately high runoff potential (USDA, As part of the Tidewater Climate Region, the Poquoson River region experiences average January temperatures of 4 F and average July temperatures of 79 F. Average January precipitation is 4.7 inches and average July precipitation is 4.7 inches. Annual precipitation ranges from to inches with a mean precipitation of 45. inches. It is influenced by stream discharge, groundwater seepage, and surface runoff. 2.2 Landuse The land use characterization for the entire Poquoson River watershed was based on land cover data from the NOAA Coastal Change Analysis Program (C-CAP) ( The landuse is shown in Figure 2.. The classification matches part of the National Land Cover Database (NLCD) with more detailed land use for wetlands. Brief descriptions of land use classifications and the percentages of landuse in the Poquoson River watershed areas are presented in Tables 2. and 2.2, respectively. For analysis purposes, landuse was divided into eight groups shown in Figure 2.2. Dominant land uses in the watershed were found to be forest (32.0%), wetlands (3. %), and urban and open space (30%), which account for 93% of the total area in the watershed. For Back Creek, the dominant landuses are wetland (48%), forest (9%), and urban (6%).

24 Figure 2.: Land Use of the Poquoson River Watershed Table 2.: Descriptions of Landuse Description of Landuse High Intensity Residential: Includes significant land area covered by concrete, asphalt, and other constructed materials. Vegetation, if present, occupies less than 20% of the landscape. Constructed material accounts for 80-0% of the total cover. Median Intensity Residential: Includes areas with a mixture of constructed materials and vegetation or other cover. Constructed materials account for 50 to 79% of total area. Low Intensity Residential: Includes areas with a mixture of constructed materials and vegetation. Constructed materials account for 30-80% of the cover. Vegetation may account for 20-70% of the cover. These areas most commonly include single-family housing units. Population densities will be lower than in high intensity residential areas. 2
25 Open Space: Includes areas with a mixture of some constructed materials, but mostly managed grasses or low-lying vegetation planted in developed areas for recreation, erosion control, or aesthetic purposes. Row Crops: Areas used for the production of crops, such as corn, soybeans, vegetables, tobacco, and cotton. Pasture/Hay: Areas of grasses, legumes, or grass-legume mixtures planted for livestock grazing or the production of seed or hay crops. Grassland: Includes areas dominated by grammanoid or herbaceous vegetation, generally greater than80 % of total vegetation. Deciduous Forest: Areas dominated by trees where 75% or more of the tree species shed foliage simultaneously in response to seasonal change. Evergreen Forest: Areas characterized by trees where 75% or more of the tree species maintain their leaves all year; Canopy is never without green foliage. Mixed Forest: Areas dominated by trees where neither deciduous nor evergreen species represent more than 75% of the cover present. Emergent Herbaceous Wetlands: Areas where perennial herbaceous vegetation accounts for 75-0% of the cover and the soil or substrate is periodically saturated with or covered with water. Estuarine Forested Wetland: Areas where woody vegetation accounts for 25-0% of the coverage and this vegetation exceeds 5 m in height, and all such wetlands that occur in tidal areas in which salinity due to ocean-derived salts is equal to or greater than 0.5 percent. Total vegetation cover is greater than 20%. Estuarine Shrub: Includes tidal wetlands dominated by woody vegetation less than 5 meters in height. Estuarine Emergent Wetland: Includes all tidal wetlands dominated by erect, rooted, herbaceous hydrophytes (excluding mosses and lichens). Wetlands that occur in tidal areas in which salinity due to ocean-derived salts is equal to or greater than 0.5 percent and that are present for most of the growing season in most years. Total vegetation cover is greater than 80%. Barren land (unconsolidated shore): Includes materials such as silt, sand, or gravel that is subject to inundation and redistribution due to the action of water. Substrates lack vegetation except for pioneering plants that become established during brief periods when growing conditions are favorable. Open Water: Areas of open water, generally with less than 25% or greater cover of vegetation or soil. 3
26 Table 2.2: Landuse Descriptions and Percentages of the Poquoson River Watershed York County City of Poquoson Totals Landuse Name Acres % Acres % Acres % High Intensity Medium Intensity Low Intensity, , Open Space, , Crops Pasture Grassland Deciduous Forest, , Evergreen Forest 2, , Mixed Forest Scrub/Shrub Forest , Forested Wetland 2, , Shrub Wetland Emergent Wetland Estuarine Forested Wetland Shrub Wetland Estuarine Emergent , , Unconsolidated Shore Barren Land Open Water Estuarine Aquatic Bed Totals 4, , , Table 2.3: Landuse Descriptions and Percentages of the Back Creek Watershed Landuse Name Acres % High Intensity Medium Intensity Low Intensity Open Space Crops Pasture Grassland


27 Deciduous Forest Evergreen Forest Mixed Forest Scrub/Shrub Forest Forested Wetland Shrub Wetland Emergent Wetland Estuarine Forested Wetland Shrub Wetland Estuarine Emergent Unconsolidated Shore Barren Land Open Water Estuarine Aquatic Bed.3 0. Sum Figure 2.2: Percentage Landuses of the Poquoson River Watershed 5
28 F C (MP N/0ml) 2.3 Water Quality Conditions The VA-DEQ performs water quality monitoring throughout Virginia to determine if WQSs are being met for the designated uses of the corresponding waters. Samples have been taken at the water quality monitoring stations in Poquoson River (Figure.4). VA-DSS also performs long-term monitoring in shellfish growing areas in the River. A summary of the data is listed in Tables.3 and.4. Fecal bacteria, E. coli, and enterococci, have been used as indicator organisms for predicting human health impacts in TMDL studies. A statistical analysis found that the highest correlation to gastrointestinal illness was linked to elevated levels of E. coli and enterococci in freshwater (enterococci in salt water). Currently VA-DEQ analyzes the fecal coliform, enterococci, and E. coli concentrations in water samples by using the membrane filtration method. This method usually has a maximum detection limit of 8,000 counts/0 ml, but the upper limit can be increased to 6,000 counts/0 ml if concentrations are expected to be high. The minimum detection limits for fecal coliform, enterococci, and E. coli are 0,, and 25 counts/0 ml, respectively. The VDH-DSS state agency has occupied 64 fecal coliform measurement stations in the Poquoson River during the period (Figure.3 and Table.). The routine measurements are conducted monthly. Figure 2.3 shows the annual mean fecal coliform concentration from 990 to 202. It can be seen that fecal coliform concentrations vary from year to year with high concentrations having occurred in wet hydrological years of 998, 999, and It appears that fecal coliform concentrations have some changes in recent years, but these are not statistically significant (Figure 2.4). Mean daily high concentration occurs in spring (March to May) and fall (August to November). Large variations occur in March, August, and September (Figure 2.5) P oquos on R iver Figure 2.3: Annual Distribution of Mean Fecal Coliform Concentration 6
29 F C (MP N/0ml) Figure 2.4: Monthly Averaged Fecal Coliform Concentration Distribution 40 P oquos on R iv er Mean S td J an F eb Mar Apr May J un J ul Aug S ep Oct Nov Dec Month Figure 2.5: Monthly Mean and Standard Deviation of Fecal Coliform Concentration 7
30 3.0 SOURCE ASSESSMENT 3. General A primary component of pathogens TMDL development for Poquoson River is the evaluation of potential sources of pathogens in the watershed. The watershed approach was applied for the source assessment. Landuse data, together with human population, wildlife, manure application, etc., were used for the assessment. Sources of information that were used in evaluating potential pollutant sources included the VA-DEQ, the Virginia Department of Conservation and Recreation (VA-DCR), the Virginia Department of Game and Inland Fisheries (VADGIF), the Virginia Department of Health (VDH), US Department of Agriculture (USDA) agriculture census data, public participation, watershed studies, stream monitoring, published information, and best professional judgment. York County and the City of Poquoson provided GIS data, including septic information and impervious landuse that are used for source assessment. 3.2 Point Sources and MS4s The potential pollutant sources in the watershed can be broken down into point and nonpoint sources. Point sources are permitted pollutant loads derived from individual sources and discharged at specific locations. Based on data obtained from the VA-DEQ, there are 24 individual and general permitted facilities in the Poquoson and Back River watersheds. However, no permitted point sources within the Poquoson River watershed discharge fecal coliform into the River. In addition to the individual and general permits, Municipal Separate Storm Sewer System (MS4) permits have been issued to cities and other facilities within the Poquoson watershed. Overall, there are three Phase II MS4 permits held in the Poquoson River TMDL watershed. The areas covered by each of the MS4 permits are depicted in Figure 3.. Table 3. lists the MS4 permit holders located within the Poquoson River watershed. The TAC recommended that the VDOT MS4 WLA be aggregated with the Poquoson and York MS4, the acreage associated with VDOT is not listed explicitly. Table 3.: MS4 Permit Holders and the Area Occupied by Each MS4 Locality per TMDL Watershed MS4 Permit Holder Phase Permit Number Jurisdiction Acreage York County II VAR York County,098 City of Poquoson II VAR City of Poquoson 2,692 VDOT II VAR York County/City of Poquoson - 8

31 Figure 3.: MS4 Phase II in York County and City of Poquoson 3.3 Nonpoint sources Nonpoint sources are from various sources over a relatively large land area, which are the dominant pollutant sources in the watershed. Nonpoint sources include human-related sources that are mainly through failures of septic systems, SSOs, and pets, livestock, and wildlife. Human Population Nonpoint sources related to humans are derived from information about the human population in a region. Population numbers for humans and households are derived from US Census Bureau data (USCB, 20). As only a portion of York County is located within the watershed, the human population of York County within the watershed is estimated based on its area for urban landuses within the Poquoson River watershed with respect to the county watershed area for urban landuse. The estimated population and the number of households are listed in Table 3.2. Pets Dogs are the predominant contributors of fecal coliform. The dog population was often calculated using a formula for estimating the number of pets from national percentages, reported by the American Veterinary Association: number of dogs = number of households * This number is much higher than the number of licenses registered in the County and the City. The current number of licenses for the City of Poquoson was obtained. This number was divided by urban landuse acreage to obtain the number of dog per acre of urban landuse area. This rate is used to estimate the total number of dogs in 9
32 the Poquoson River watershed for both the City of Poquoson and York County. According to a previous study in the Chesapeake Bay region, about 23% -30% of dog wastes are assumed to be subject to runoff. A rate of 23% was used to estimate loading. The estimated dog number is listed in Table 3.2. Table 3.2: Human Population, Households, and Pets in the Poquoson River Watershed City of Poquoson York County Total Population (20) 7,33 24,470 3,80 Poquoson Households 2,758 9,3,87 River Dogs 907* Population (20) Back Creek Households Dogs *The number of dogs is based on the number of licenses issued by the City of Poquoson and the urban landuse areas for the watershed. Septic Systems Conventional septic tank systems are only effective where the soil is adequately porous to allow percolation of liquids, and the groundwater level is low enough to avoid contamination. Leaking pipes or treatment tanks (i.e., leakage losses) can allow wastewater to return to the groundwater, or discharge to the surface, without adequate treatment. Leaking septic systems are a source of nutrients and bacteria. The City of Poquoson currently is on a public sewer system. Some areas of York County are still using septic systems there are,03 septic tanks in the watershed. The septic tank locations in York County are shown in Figure 3.2. The estimated failure rate is assumed to be 2% based on data from the Tidewater region. The estimated average number of persons for each septic tank is assumed to be 2.7 and each person is assumed to discharge 70 gal/day with a fecal coliform concentration of.0 4 MPN/0ml (EPA, 200a). 20
 Sanitary Sewer Overflows (SSOs) are discharges of raw sewage from municipal and non-municipal sanitary sewer")
33 Figure 3.2: Septic System Locations in the Poquoson River Watershed Sanitary Sewer Overflows (SSOs) Sanitary Sewer Overflows (SSOs) are discharges of raw sewage from municipal and non-municipal sanitary sewer systems. SSOs can release untreated sewage into basements or out of manholes and onto city streets, playgrounds, and into streams before this sewage can reach a treatment facility (VA-DEQ, 20). SSOs are often caused by blockages in sewer lines and breaks in the sewer lines. Based on the data recorded from provided by VA-DEQ, the SSO locations in the watershed are identified (Figure 3.3). The accumulative spillage distribution is shown in Figure 3.4. The loading corresponding to a 95 th -percentile spillage volume is estimated as 25% raw sewage and 75% non-raw sewage. The fecal coliform concentrations for raw sewage and non-raw sewage are listed in Table 3.3. It can be seen that SSO spills occurred less than times each year, and they do not contribute significantly on a daily basis. However, when spillage occurs, it can cause a short-term increase of fecal coliform concentration in the receiving waters. A summary of spillage is listed in Table

34 Figure 3.3: Distribution of SSO Locations in the Poquoson River Watershed Figure 3.4: Cumulative Frequency Distributions of SSOs in the Poquoson River Watershed 22
35 Table 3.3: Fecal Coliform Information for SSOs in the Poquoson River Watershed Area Number of Spills 95% Volume (Gallons) Raw Sewage Concentration (MPN/0ml) Non-Raw Sewage Concentration (MPN/0ml) m 3 Fecal Coliform (Counts/Day) 8 8,750 2,700, , E ,700, , E+09 Wildlife The wildlife inventory for the Poquoson watershed was developed based on a number of information and data sources, including habitat availability, Department of Game and Inland Fisheries (DGIF) harvest data and population estimates, and stakeholder comments and observations. The number of animals in the watershed was estimated by combining typical wildlife densities with available stream wildlife habitat, which were generated based on GIS data of land use and streams. According to field survey and UVA population model, the deer population is much higher in this watershed than its averaged density in the region. Therefore, high acreage densities of animals per acre were used to estimate the deer population. Plum Tree Island National Wildlife Refuge is situated on the eastern side of the City of Poquoson adjacent to the Chesapeake Bay. It consists of 3,50 acres of saltmarsh, shrub-scrub, and wooded habitats that provide a haven for waterfowl, marsh-birds, and shorebirds. Waterfowl and migration bird populations are much higher in this watershed. The survey of bird population density in a similar wildlife refuge of Blackwater National Wildlife Refuge in Maryland shows a very high density with.85 birds per acre compared to the typical density of 0.02 birds per acre. In order to more accurately estimate the bird population, a tidal prism model was used to inversely estimate the fecal coliform loading from the Plum Tree Island National Wildlife Refuge based on observations. This approach was applied for bacterial TMDLs in Maryland and Virginia (MDE, 20; Shen and Zhao, 20). The tidal prism model was developed for the Lloyd Bay and Eastern Cove where dominant loadings are from the Plum Tree Island National Wildlife Refuge with sufficient observations. Based on the tidal prism model, the loading can be computed from the observations as follows: Q in C in -Q out C+L 0 -k c VC=0 (Eq. ) L 0 = k c VC+ Q out C- Q in C in (Eq. 2) where Q in and Q out are water fluxes (m 3 per tidal cycle) in and out of the model segment, which can be computed as αvin and α(vin+r), where α is return ratio, Vin is the tidal prism, and R is the runoff. C in and C out are observed fecal coliform concentrations at the boundary and inside of the segment, respectively. k c is the decay rate of fecal coliform. The value of the decay rate varies from 0.7 to 3.0 per day in saltwater (Mancini, 978; 23
36 Thomann and Mueller, 987). A decay rate of.0 per day (0.52 per tidal circle) was used as a conservative estimate in the TMDL calculation (MDE, 20). L 0 is the loading from the watershed (counts per tidal cycle) and V is the volume of the model segment. Using tidal range, surface area, and return ratio, water fluxes can be computed. By using observed fecal coliform concentrations, loading can be estimated. We assumed that 30% of loading is subject for run off. Using a fecal coliform production rate of bacteria per day (USEPA, 200a), an estimated mean density of about 0.77 birds per acre is determined. This rate is much larger than a commonly used rate of 0.02 birds/ac. A fraction (25%) of this density was applied to the watershed that is not inside or adjacent to the wildlife refuge, which gives a rate of 0.2 birds/ac (ten times larger than the mean value). This rate was used to compute bacterial daily production and applied to watershed model for forest, wetland, and urban land. The value was further verified by the watershed model simulations which yield good agreement between model prediction and observations (Appendix A).Typical wildlife densities are presented in Table 3.4. Table 3.4: Typical Wildlife Densities and Wildlife Habitat Wildlife Type Population Density Habitat Requirements Deer animals/acre Entire watershed, except open water and urban development Raccoon animals/acre Forest and Wetland within 600 feet of streams and ponds Raccoon 0.06 animals/acre Upland Forest Muskrat 50/mile Streams and Rivers Nutria 8.5/mile Streams and Rivers Duck/birds.53 animals/acre* Entire Watershed *0.77 animals/acre is applied to Plum Tree Island National Wildlife Refuge and 25% of this density is applied to the rest of the Poquoson River watershed. Livestock The shoreline survey data of the Shellfish Sanitation Division of VDH, together with National Agriculture Statistics Survey data were used to estimate the livestock values. VDH Shellfish Sanitation Division conducted a detailed survey of the watershed and identified pollutant sources. The sanitation survey data were exclusively used to estimate livestock contributions. A summary of livestock in the watershed is listed in Table 3.5. Table 3.5: A Summary of Livestock in the Poquoson River Watershed Animal Name Number Direct Access Horses 7 No Cattle 26 Yes/No Caged chickens 20 No Pastured goats No Caged ducks 5 No 24
37 Marinas Marinas and boating activities can contribute bacteria loading when their wastes are not adequately collected in pump stations or the pump stations do not work properly. A summary of marina and boat information is listed in Table 3.6 (VDH-DSS, shoreline survey). A total loading contribution from boating slips was estimated based on estimated totals of boats at marinas in the watershed and the number of people occupying each boat and daily bacteria production for each person. For the current calculation, an average of 3 persons per slip is assumed and only % of the slips contribute to the loading. Table 3.6: Total Number of Slips by Marina in the Poquoson River Watershed Location Slips/Moorings Existing Poquoson Marina End of Rens Rd., Poquoson 56 moorings 34 dry storage spaces Wet: 4 < 26 ft, 5 > 26 ft Islander Marina Wet: < 26 ft, East River Road, Poquoson 4 > 26 ft York Haven Marina, Wet: 37<26 ft, 7 0 Mingee St., Poquoson 24>26 ft Dare Marina Incorporated 82 Railway Rd, Grafton 53 moorings 204 dry storage Thomas Marina 300 Presson Road, Yorktown 39 Aqua Marine 52 Wildey Rd., Seaford 26 Seaford Scallop Company 509 Shirley Rd., Seaford 7 Mills Marina Incorporated 742 Back Creek Road, Seaford 63 Seaford Yacht Club 584 Goodwin Neck Rd., Yorktown 60 Rens Road Pier end of Rens Rd., Poquoson 4 E. T. Firth Wholesale Seafood 4A Brown s Neck Rd., Poquoson Mingee St., Poquoson 4 Chesapeake Watch at 808 Ship Point Rd., Grafton 8 Smith s Marine Railway Inc. 8 Railway Road, Grafton 5 Robanna Shores Community Assn. end of Thomas Road, Seaford Crockett Road, Seaford 2 Southeast Rope and Rigging 2 25
38 End of Shirley Rd., Seaford 08 Dandy Loop, Yorktown 8 3 Dandy Loop, Yorktown Summary of Source Assessment Based on information from landuse, human population, field survey, and observation data, nonpoint sources of bacteria were estimated for each subwatershed based on landuse and livestock distribution. A summary of distribution over the entire watershed is listed in Table 3.7. Note that the SSO is estimated based on the 95 th -percentile loading. As spillage occurred less than times per year, it does not contribute significantly daily. Table 3.8 lists the loading from each source category as a percentage of the total. Loadings from septics, SSO, and marina are grouped as human. Overall, wildlife and pets contribute 88% of the total loading. Table 3.7: Summary of Source Distribution in the Poquoson River Watershed Poquoson River Back Creek Source Animal Number Loading (Counts/Day) Percent Deer E+ 5.6% Ducks/Birds E % Wildlife Muskrat 456.4E+ 0.8% Nutria E+.7% Raccoon E+ 0.7% Total Wildlife E % Pets Dogs E % Septic 23 (tanks) 8.788E+09 0.% SSO 7.453E+ 5.0% Livestock 7.866E+ 5.3% Marinas 579 (slips) 2.36E+.5% Totals.498E+3 0.0% Deer E+ 6.6% Ducks/Birds E+ 66.% Wildlife Muskrat 65.63E+.7% Nutria E+ 4.0% Raccoon E+09.0% Total Wildlife E+ 79.4% Pets Dogs E+ 20.5% Septic 20.72E+8 <% SSO 0 Livestock E+08 <% Marinas 0 0 Totals 9.42E 0% 26
39 Table 3.8: Loadings from Source Categories as Percentage of Total Waterbody Name Loading (Counts/Day) Percent Wildlife 9.648E % Human (septics, SSOs, 9.856E+ 6.6% Poquoson River marinas) Livestock 7.866E+ 5.3% Pet 3.560E % Total.498E+3 0.0% Wildlife 5.84E Human.72E+08 (septics, SSOs, <% Back Creek marinas) Livestock 5.90E+08 <% Pet.50E+ 20.5% Total 9.42E+ 27
40 4.0 TMDL DEVELOPMENT 4. Overview A TMDL is the total amount of a pollutant that a waterbody can receive and still meet WQSs. A TMDL may be expressed as a mass per unit time, toxicity, or other appropriate measure (CFR, 2006). These loads are based on an averaging period that is defined by the specific WQSs. A TMDL is the sum of individual wasteload allocations (WLAs) for point sources and load allocations (LAs) for nonpoint sources, incorporating natural background levels. The TMDL must, either implicitly or explicitly, include a margin of safety (MOS) that accounts for the uncertainty in the relationship between pollutant loads and the quality of the receiving waterbody, and in the scientific and technical understanding of water quality in natural systems. In addition, where applicable, the TMDL may include a future allocation (FA) as necessary. This definition is denoted by the following equation: TMDL = WLAs + LAs + MOS + (FA, where applicable) This section documents the detailed fecal coliform TMDLs and LA development for Poquoson River. 4.2 Selection of a TMDL Endpoint An important step in developing the TMDL is the establishment of in-stream numerical endpoints, which are used to evaluate the attainment of acceptable water quality and allowable loading capacity. Most impaired segments are within shellfish growing areas delineated by the VDH-DSS. Examples of the condemned areas are shown in Figures 4. and 4.2. Two segments are listed for both shellfish harvesting and primary contact. The most stringent criterion was selected as the endpoint for the impaired area. According to WQS 9VAC , the numerical criteria for fecal coliform for the shellfish harvesting use of Poquoson River impaired sites is a Geometric Mean of 4 MPN/0mL and a 90 th percentile of 49 MPN/0mL for a 30-month assessment period. Because the 90 th Percentile value of 49 MPN/0ml is more stringent, it was used as the endpoint for fecal coliform to determine the TMDL. For impairments designated for recreational use, the enterococci criteria were applied. The numerical criteria for enterococci is that no more than % of the total samples in the assessment period shall exceed 4 cfu/0 ml and that the monthly geometric mean does not exceed 43 cfu/0 ml. If the upstream recreational impairment connects a downstream shellfish growing area, the more stringent shellfish criteria will be applied. 28


41 Figure 4.: Condemnation Shellfish Area of the Poquoson River Figure 4.2: Condemnation Shellfish Area of the Poquoson River 29
42 4.3 Model Development for Computing TMDL Numerical models are a widely used approach for TMDL and other water quality studies. In this study, a system of numerical models was applied to simulate the loadings of bacteria and the resulting response of in-stream bacteria. The modeling system consists of two individual model components: the watershed model and the hydrodynamic-water quality model. The watershed model Loading Simulation Program in C ++ (LSPC), developed by the USEPA (Shen et al., 2005), was selected to simulate the watershed hydrology and bacteria loadings in the watershed. The Environmental Fluid Dynamics Computer Code (EFDC) (Hamrick, 992a; Park et al., 995) was used to simulate bacteria transport in the receiving water. A detailed model description, model setup, model calibration, and scenario runs are presented in Appendix A. The LSPC model is driven by hourly precipitation and was used to simulate the freshwater flow and its associated nonpoint source pollutants. The simulated freshwater flow and bacteria loadings from each sub-watershed were fed into the adjacent water quality model segments. The EFDC model simulates the transport and fate of bacteria in the River. Because the Back Creek is a small creek that directly drains to the Chesapeake Bay, the tidal prism model was used to compute the current and allowable loads (Eq. 2) (MDE, 20; Shen and Zhao, 20) There are no USGS flow measurements in this watershed. The flow simulated by the watershed model was calibrated using USGS gauging data at Gage in Beaverdam Swamp near Ark, VA, located approximately 20 miles north of the Poquoson River watershed. The measurement period is between 980 and 989. This is the only USGS gauging station located in this region. The EPA Chesapeake Bay Program conducted a watershed model simulation in the Bay region. The model simulation was also compared to the Bay Program output in Poquoson area for urban landuse (acreage flow). A comparison of model results against the EPA watershed model at the selected subwatershed and USGS station of flow is shown in Figure 4.3. Detailed modeling processes and calibration procedures are presented in Appendix A. 30
43 Figure 4.3: Time Series Comparison of Daily Stream Flow between Model Simulation and EPA Watershed Model (Left Panel) and Observations from USGS Stream Gage in 987 Numerical model calibration of fecal coliform was conducted for the period of The model was calibrated at DSS and DEQ stations. A constant decay of.0 per day was used for the bacterial loss in the stream. Model results at 4 selected stations are shown in Figure 4.4. There is good agreement between observed data and simulated data during the calibration period indicating that the model has the ability to simulate bacteria in the Poquoson River and can be applied in the development of the TMDL. Bacteria variations over an eight-year period are consistent. The detailed model calibration and TMDL development are presented in Appendix A. 3
44 32
45 Figure 4.4: Time Series Comparison of Fecal Coliform Concentration between Model Simulation (Blue Lines) and Observations (Circles) from 2000 to The Red Lines Denote the Geometric Mean and 90 th Percentile Criteria. 4.4 Consideration of Critical Conditions and Seasonal Variation EPA regulations at 40 CFR 30.7 (c)() require TMDLs to take into account critical conditions for stream flow, loading, and water quality parameters. The intent of this requirement is to ensure that the water quality of the waterbody is protected during times when they are most vulnerable. Critical conditions are important because they describe the factors that combine to cause a violation of WQSs and help to identify the actions that may have to be undertaken to meet WQSs. The current loadings to the waterbody were determined using a long-term record of water quality monitoring (observation) data. The period of record for the data was 990 to 202, which spans different flow regimes and temperatures. An 8-year model simulation ( ) was conducted and model results show that concentrations of bacteria variations were consistent over this 8-year period. The resulting estimate is quite robust. Seasonal variations involved changes in surface runoff, stream flow, and water quality as a result of hydrologic and climatologic patterns. These are accounted for by the use of this long-term simulation to estimate the current load and reduction targets. 33
46 4.5 Margin of Safety To allocate loads while protecting the aquatic environment, a MOS needs to be considered. A MOS is typically expressed either as unallocated assimilative capacity or as conservative analytical assumptions used in establishing the TMDL (e.g., derivation of numeric targets, modeling assumptions or effectiveness of proposed controls). In the TMDL calculation, the MOS can either be explicitly stated as an additional separate quantity, or implicitly stated, as in conservative assumptions. For the Poquoson River, long-term model simulations were conducted. The MOS was implicitly incorporated in this TMDL that allocation scenarios were designed to meet the fecal coliform standards for geometric mean of 4 MPN/0mL and for 90 th percentile of 49 MPN/0mL. 4.6 TMDL Computation The TMDL for each impairment was computed based on model simulation results of long-term annual mean loading with the consideration of the probability of being exceeded in a daily basis. The EPA-recommended method to convert long-term annual mean loading to daily maximum loading is applied (Appendix A). According to the endpoints for fecal coliform for the established pollutant reduction target, the allowable fecal coliform loading reduction to meet the criteria can be computed. A reduction of loadings from watersheds is needed. The load reduction needed for the attainment of the criteria was determined as follows: Load Reduction Current Load Allowable Load 0% Current Load All TMDLs have some probability of being exceeded. That probability is either explicitly specified or implicitly assumed. EPA guidance states that the probability component of a calculated maximum daily load (MDL) from daily simulation should be based on a representative statistical measure that is dependent upon the specific TMDL and best professional judgment of the developers (USEPA, 2007). The MDL for this analysis is determined based on a pre-defined probability and long-term simulation. The computed MDL is consistent with achieving the annual cumulative load target. A 90 th percentile was selected as the pre-defined probability, which agrees with fecal coliform criteria. The detailed calculation of the MDL is described in Appendix A. The results of maximum daily loading for Poquoson River and Back Creek were listed in Table 4.. The results of load and load reduction for each jurisdiction are listed in Table 4.2. Waterbody Table 4.: Estimated Loads and Load Reductions for Fecal Coliform Pollutant Criterion (MPN/0ml) Current Load (Counts/Day) Allowable Load (Counts/Day) Required Reduction (%) Poquoson River Fecal Coliform 90 th Percentile: 49 6.E E+2 5.5% Back Creek Fecal Coliform 90 th Percentile: E+ 3.8E
47 Table 4.2: Estimated Loads and Load Reductions for Jurisdictions Waterbody Name Jurisdiction Existing Counts/day TMDL Counts/day Reduction Poquoson River City of Poquoson 2.5E+2.00E % York County 3.95E+2.95E % Sum 6.E E+2 5.5% Back Creek York County 7.35E+ 3.8E+ 48.2% 4.7 Summary of TMDL and Load Allocation There are no wastewater treatment facilities in the watershed of the Poquoson River that have permits to discharge bacteria to the River. In order to consider future growth in the region, one percent of TMDL loading is allocated to future growth (FA). There are three MS4 permits for York County, City of Poquoson, and VDOT. The loading is estimated based on urban landuse in the MS4 regulated area within the watershed. The waste loads for permits are determined based on partitioning of the total loading between total landuse and urban landuse within regulated areas. In addition, the potential loadings from SSOs and marinas are included in load allocation as they are not regulated by MS4s discharge. The TMDLs are summarized in Table 4.3 Table 4.3: Pathogens TMDLs for Poquoson River and Back Creek (Counts/Day) Impairment WLA LA MOS TMDL Poquoson River 6.65E+ 2.29E+2 Implicit 2.96E+2 MS4 Poquoson (VAR040024) 2.87E+ VDOT (VAR040044) MS4 York (VAR040028) 3.48E+ VDOT (VAR040044) Future Load 2.96E+ Back Creek 9.46E+ 2.87E+ Implicit 3.8E+ MS4 York (VAR040028) 9.08E+ VDOT (VAR040044) Future Load 3.8E+09 *Each of the municipality MS4 loads has been aggregated with a portion of the adjacent VDOT MS4 load due to the continuity of the system. Where: TMDL =Total Maximum Daily Load LA = Load Allocation (nonpoint source) WLA =Wasteload Allocation (MS4) MOS =Margin of Safety 35
48 The loadings for each bacterial source were determined based on source assessment. Load allocation was determined based on percent of source contribution and model simulations with respect to the reduction of source categories. The percent reduction needed to attain the water quality criterion was allocated to each source category and listed in Table 4.4. The TMDL seeks to eliminate 0% of the human-derived fecal component regardless of the allowable load determined through the allocation process. Human-derived fecal coliform is a serious concern in the estuarine environment and both state and federal law preclude the discharge of human waste. According to the preceding analysis, reduction of the controllable loads, human (septic, SSOs, and boating activities), livestock and pets, may not result in achievement of the water quality standard. Therefore an additional reduction is allocated to wildlife. Although SSO incidence does not occur daily, it can contribute short term increase of bacterial loading in the watershed. Therefore, it is considered as controllable loading. The estimation is based on 95 th percentile which is considered the worst scenario. The allocations presented demonstrate how the TMDLs could be implemented to achieve water quality standards; however, the state reserves the right to allocate differently, as long as consistency with the achievement of water quality standards is maintained. Table 4.4: Reduction of Potential Sources Waterbody Name Poquoson River Back Creek Category Current Load (Counts/Day) Percentage Allowable Load (Counts/Day) Reduction Needed (%) Wildlife 3.90E E Pets.44E E Livestock 3.8E E Septic 3.55E E SSO 3.0E E Marina.40E E Total 6.E E Wildlife 5.84E E Pets.50E E Livestock 5.90E+08 < 0.00E Septic.34E+08 <0 0.00E SSO Marina Total 7.35E E IMPLEMENTATION AND PUBLIC PARTICIPATION 5. General Once the EPA has approved a TMDL, measures must be taken to reduce pollution levels 36
49 from both point and nonpoint sources in the stream. For point sources, all new or revised Virginia Pollutant Discharge Elimination System (VPDES)/National Pollutant Discharge Elimination System (NPDES) permits must be consistent with the TMDL WLA pursuant to 40 CFR (d)()(vii)(b) and must be submitted to EPA for approval. The measures for nonpoint source reductions, which can include the use of better treatment technology and the installation of best management practices (BMPs), are implemented in an iterative process that is described along with specific BMPs in the implementation plan. The process for developing an implementation plan has been described in the TMDL Implementation Plan Guidance Manual, published in July 2003 and available upon request from the DEQ and DCR TMDL project staff or at With successful completion of implementation plans, local stakeholders will have a blueprint to restore impaired waters and enhance the value of their land and water resources. Additionally, development of an approved implementation plan may enhance opportunities for obtaining financial and technical assistance during implementation. 5.2 Staged Implementation In general, Virginia intends for the required pollutant reductions to be implemented in an iterative process that first addresses those sources with the largest impact on water quality. For example, in agricultural areas of the watershed, BMP technology can be used to reduce the runoff of bacteria discharging to the River. It will be beneficial to remove the livestock impact. Additionally, in both urban and rural areas, reducing the human loading from failing septic systems should be a primary implementation focus because of its health implications. This component could be implemented through education on septic tank pump-outs as well as a septic system repair/replacement program and the use of alternative waste treatment systems. The iterative implementation of BMPs in the watershed has several benefits:. To enable tracking of water quality improvements following BMP implementation through follow-up stream monitoring; 2. To provide a measure of quality control, given the uncertainties inherent in computer simulation modeling; 3. To provide a mechanism for developing public support through periodic updates on BMP implementation and water quality improvements; 4. To help to ensure that the most cost-effective practices are implemented first; and 5. To allow for the evaluation of the adequacy of the TMDL in achieving WQSs. Watershed stakeholders will have the opportunity to participate in the development of the TMDL implementation plan. 37
50 The SSOs evaluated in this report are associated with the sanitary sewer collections systems of the HRSD and the municipalities within the Poquoson watershed. Prior to the development of this TMDL, consent orders were issued requiring HRSD and municipalities to evaluate their collection system and develop plans to eliminate SSOs. This TMDL will not affect the execution of these orders. A summary of these orders and their requirements are described below. The State Water Control Board issued HRSD and thirteen satellite municipal collection systems (the cities of Chesapeake, Hampton, Newport News, Poquoson, Portsmouth, Suffolk, Virginia Beach and Williamsburg; the counties of Gloucester, Isle of Wight, and York; the James City Service Authority; and the town of Smithfield) a special order by consent effective September 26, The overarching goal of the order is to reduce the occurrence of sanitary sewer overflows in the regional sanitary sewer system. In general, the order provides for conducting a regional sanitary sewer system evaluation including flow, pressure, and rainfall monitoring and conducting Sanitary Sewer Evaluation Studies (SSES) in identified basins pursuant to the Regional Technical Standards (the regional Technical Standards are incorporated into the order as Attachment and provide detailed requirements to ensure a consistent regional approach for completion of the work required by the order). Data obtained from the studies will be used in the development of a regionally integrated, calibrated and dynamic flow model. System maintenance is addressed by the development of Management, Operations, and Maintenance Programs for HRSD and each municipality. Deficiencies identified by the SSES must be considered and if appropriate, scheduled for rehabilitation or replacement in the development of Rehabilitation Plans. In addition, to address adequate capacity to collect, convey, and treat peak flows in the regional sanitary sewer system during wet weather, a Regional Wet Weather Management Plan will be developed and implemented to define improvements in the regional system necessary to meet wastewater transmission and treatment needs to Reasonable Assurance for Implementation 5.3. Follow-Up Monitoring Following the development of the TMDL, DEQ will make every effort to continue to monitor the impaired stream in accordance with its ambient monitoring program. DEQ s Ambient Watershed Monitoring Plan for conventional pollutants calls for watershed monitoring to take place on a rotating basis, bi-monthly for two consecutive years of a six-year cycle. In accordance with DEQ Guidance Memo No , during periods of reduced resources, monitoring can temporarily discontinue until the TMDL staff determines that implementation measures to address the source(s) of impairments are being installed. Monitoring can resume at the start of the following fiscal year, next scheduled monitoring station rotation, or when deemed necessary by the regional office or TMDL staff, as a new special study. The purpose, location, parameters, frequency, and duration of the monitoring will be 38
51 determined by the DEQ staff, in cooperation with DCR staff, the Implementation Plan Steering Committee, and local stakeholders. Whenever possible, the location of the follow-up monitoring station(s) will be the same as the listing station. At a minimum, the monitoring station must be representative of the original impaired segment. The details of the follow-up monitoring will be outlined in the Annual Water Monitoring Plan prepared by each DEQ Regional Office. Other agency personnel, watershed stakeholders, etc. may provide input on the Annual Water Monitoring Plan. These recommendations must be made to the DEQ regional TMDL coordinator by September 30 of each year. DEQ staff, in cooperation with DCR staff, the Implementation Plan Steering Committee and local stakeholders, will continue to use data from the ambient monitoring stations to evaluate reductions in pollutants ( water quality milestones as established in the IP), the effectiveness of the TMDL in attaining and maintaining WQSs, and the success of implementation efforts. Recommendations may then be made, when necessary, to target implementation efforts in specific areas and continue or discontinue monitoring at follow-up stations. In some cases, watersheds will require monitoring above and beyond what is included in DEQ s standard monitoring plan. Ancillary monitoring by citizens, watershed groups, local government, or universities is an option that may be used in such cases. An effort should be made to ensure that ancillary monitoring follows established quality assurance/quality control (QA/QC) guidelines in order to maximize compatibility with DEQ monitoring data. In instances where citizens monitoring data are not available and additional monitoring is needed to assess the effectiveness of targeting efforts, TMDL staff may request of the monitoring managers in each regional office an increase in the number of stations or that they monitor existing stations at a higher frequency in the watershed. The additional monitoring beyond the original bi-monthly single station monitoring will be contingent on staff resources and available laboratory budget. More information on citizen monitoring in Virginia and QA/QC guidelines is available at To demonstrate that the watershed is meeting WQSs for watersheds where corrective actions have taken place (whether or not a TMDL or TMDL Implementation Plan has been completed), DEQ must meet the minimum data requirements from the original listing station or a station representative of the originally listed segment. The minimum data requirement for conventional pollutants (bacteria, DO, etc.) is bi-monthly monitoring for two consecutive years. For biological monitoring, the minimum requirement is two consecutive samples (one in the spring and one in the fall) in a one-year period Regulatory Framework While Section 303(d) of the CWA and current EPA regulations do not require the development of TMDL implementation plans as part of the TMDL process, they do require reasonable assurance that the LAs and WLAs can and will be implemented. EPA also requires that all new or revised NPDES permits must be consistent with the TMDL 39
52 WLA pursuant to 40 CFR (d)()(vii)(b). All such permits should be submitted to EPA for review. Additionally, Virginia s 997 Water Quality Monitoring, Information and Restoration Act (the Act ) directs the State Water Control Board to develop and implement a plan to achieve fully supporting status for impaired waters (Section ). The Act also establishes that the implementation plan shall include the date of expected achievement of water quality objectives, measurable goals, corrective actions necessary and the associated costs, benefits and environmental impacts of addressing the impairments. EPA outlines the minimum elements of an approvable implementation plan in its 999 Guidance for Water Quality-Based Decisions: The TMDL Process. The listed elements include implementation actions/management measures, timelines, legal or regulatory controls, time required to attain WQSs, monitoring plans and milestones for attaining WQSs. For the implementation of the WLA component of the TMDL, the Commonwealth intends to utilize the VPDES program, which typically includes consideration of the WQMIRA requirements during the permitting process. Requirements of the permit process should not be duplicated in the TMDL process, and with the exception of stormwater-related permits, permitted sources are not usually addressed during the development of a TMDL implementation plan. For the implementation of the TMDL s LA component, a TMDL implementation plan addressing at a minimum the WQMIRA requirements will be developed. An exception is the municipal separate storm sewer systems (MS4s), which are both covered by NPDES permits and expected to be included in TMDL implementation plans. Watershed stakeholders will have opportunities to provide input and to participate in the development of the TMDL implementation plan. Regional and local offices of DEQ, DCR, and other cooperating agencies are technical resources to assist in this endeavor. In response to a Memorandum of Understanding (MOU) between the EPA and DEQ, DEQ also submitted a draft Continuous Planning Process to EPA in which DEQ commits to regularly updating the Water Quality Management Plans (WQMPs). Thus, the WQMPs will be, among other things, the repository for all TMDLs and TMDL implementation plans developed within a river basin. DEQ staff will present both EPA-approved TMDLs and TMDL implementation plans to the State Water Control Board for inclusion in the appropriate WQMP, in accordance with the CWA s Section 303(e) and Virginia s Public Participation Guidelines for Water Quality Management Planning. DEQ staff will also request that the State Water Control Board (SWCB) adopt TMDL WLAs as part of the Water Quality Management Planning Regulation (9VAC ), except in those cases when permit limitations are equivalent to numeric criteria contained in the Virginia WQSs. This regulatory action is in accordance with A.4.c and B of the Code of Virginia. SWCB actions relating to water quality management 40
53 planning are described in the public participation guidelines referenced above and can be found on DEQ s website under Implementation Funding Sources Cooperating agencies, organizations, and stakeholders must identify potential funding sources available for implementation during the development of the implementation plan in accordance with the Virginia Guidance Manual for Total Maximum Daily Load Implementation Plans. Potential sources for implementation may include the U.S. Department of Agriculture s Conservation Reserve Enhancement and Environmental Quality Incentive Programs, EPA Section 39 funds, the Virginia State Revolving Loan Program, Virginia Agricultural Best Management Practices Cost-Share Programs, the Virginia Water Quality Improvement Fund, tax credits and landowner contributions. The TMDL Implementation Plan Guidance Manual contains additional information on funding sources, as well as government agencies that might support implementation efforts and suggestions for integrating TMDL implementation with other watershed planning efforts. 5.4 Public Participation The development of the TMDL would not have been possible without public participation. Public participation was elicited at every stage of the TMDL development in order to receive inputs from stakeholders and to apprise the stakeholders of the progress made. Public meetings were organized for this purpose. The first public meeting was held on March 8, 203 at the Sandy Bottom Nature Park (255 Big Bethel Road, Hampton, VA), to inform the stakeholders of the TMDL development process and to obtain feedback. Results of the hydrologic calibration, bacteria source estimates, and TMDL development were discussed at the public meeting. Two Technical Advisory Committee (TAC) meetings were held at this location during the TMDL development processes. At both TAC meetings, held on May and June 26 of 203, stakeholders reviewed TMDL development processes and methodology, and provided comments and suggestions. Stakeholders also provided available data for the TMDL development. Input from these meetings was utilized in the development of the TMDL and improved confidence in the allocation scenarios and TMDL process. The second public meeting was held on July 30, 203, again at the Sandy Bottom Nature Park. Updated bacterial loading distribution and TMDL results were presented and discussed in the public meeting. 4
54 REFERENCES CFR (Code of Federal Regulations), CRF Hamrick, J. M. 992a. A three-dimensional environmental fluid dynamics computer code: Theoretical and computational aspects. Special Report in Applied Marine Science and Ocean Engineering. No. 37. The College of William and Mary, VIMS, 63 pp. Hamrick, J. M. 992b. Estuarine environmental impact assessment using a three-dimensional circulation and transport model. Estuarine and Coastal Modeling, Proceedings of the 2nd International Conference, M. L. Spaulding et al., eds., ASCE, New York, Mancini, J.L Numerical Estimates of Coliform Mortality Rates Under Various Conditions. Journal, WPCF, November, Maryland Department of the Environment (MDE) 20. Total Maximum Daily Loads of Fecal Coliform for the Restricted Shellfish Harvesting Area in Monie Bay in Somerset County, Maryland. Park, K., A. Y. Kuo, J. Shen, and J. M. Hamrick A three-dimensional hydrodynamic eutrophication model (HEM-3D): description of water quality and sediment process submodels. Special Report in Applied Marine Sci. and Ocean Engin. No. 327, pp. 2, Virginia Institute of Marine Sci., Gloucester Point, VA Shen, J., A. Parker, and J. Riverson A new approach for a windows-based watershed modeling system based on a database-supporting architecture. Environmental modeling and software 20: Shen, J., H. Wang, and G. M. Sisson. 2002a. Application of an integrated watershed and tidal prism model to the Poquoson coastal embayment. Special Report in Applied Marine Science and Ocean Engineering, No. 380, Virginia Institute of Marine Science, Gloucester Pt. VA. Shen, J., N. Sullines, and A. Park. 2002b. Mobile Bay TMDL development, linking inland and estuarine systems. Coastal Water Resources, American Water Resources Association, 2002 Spring Specialty Conference, May 3 5, 2002, New Orleans, LA, pp Shen, J. and Y. Zhao. 20. Combined Bayesian Statistics and Load Duration Curve Method for Bacteria Nonpoint Source Loading Estimation. Water Research, 44, Thomann, R. V. and J. A. Mueller Principles of surface water quality modeling and 42
55 control. Harper and Row, Publishers, NY. 644 pp. US Census Bureau (USCB). 20. Census of Population, Public Law 94-7 Redistricting Data File. United States Environmental Protection Agency (USEPA) Nutrient tool NutrientTool.xls program. USEPA. 200a. Total Maximum Daily Load for Pathogens, Flint Creek Watershed. USEPA. 200b. Total Maximum Daily Load (TMDL) For Metals, Pathogens and Turbidity in the Hurricane Creek Watershed, Tuscaloosa County, Alabama. USEPA, Atlanta, GA. USEPA Loading Simulation Program in C++. USEPA Options for expressing daily loads in TMDLs. U.S. Environmental Protection Agency, Office of Wetland, Ocean &Watersheds. VA-DEQ, Total maximum daily load (TMDL) report for shellfish areas listed due to bacterial contamination: Poquoson River and Back Creek. VA-DEQ, 20. Virginia Water Quality Assessment Integrated Report. VA-DEQ 20. Bacteria Total Maximum Daily Load (TMDL) Development for the Elizabeth River Watershed. Woods, A.J., James, M., Omernik, J.M., and Brown, D.D Level III and IV ecoregions of Delaware, Maryland, Pennsylvania, Virginia, and West Virginiana. U.S. Environmental Protection Agency National Health and Environmental Effects Research Laboratory. 43
56 A. Model Development Appendix A: Model Development Numerical models are widely used for TMDLs and other water quality studies. In this study, a system of numerical models was developed to simulate the loadings of bacteria, and the resulting response of in-stream bacteria transport and fate. The modeling system consists of two individual model components: the watershed model and the hydrodynamic-transport model. The watershed model LSPC, developed by the USEPA, was selected to simulate bacteria loads to the receiving waterbody of the Poquoson River watershed. The EFDC (Hamrick, 992a; Park et al., 995) was used to simulate the water quality of the receiving water. A.. Model Description A... Watershed Model The LSPC model is a stand-alone, personal computer-based watershed modeling program developed in Microsoft C ++ (Shen et al., 2005). It includes selected Hydrologic Simulation Program FORTRAN (HSPF) algorithms for simulating hydrology, sediment, and general water quality on land, as well as a simplified stream transport model (USEPA, 2004; Shen et al., 2002a, b; USEPA, 200a, b). Like other watershed models, LSPC is a precipitation-driven model and requires necessary meteorological data as model input. LSPC was configured for the Poquoson River watershed to simulate this watershed of 56 hydrologically connected subwatersheds (Figure A.). The subwatersheds were used as modeling units for the simulation of flow and pathogen deposition on the watershed. LSPC was used to simulate the freshwater flow and its associated nonpoint source pollutants. The simulated freshwater flow and pathogen loadings for each subwatershed were fed into the adjacent water quality model segments. In simulating nonpoint source pollutants from the watershed, LSPC uses a traditional buildup and washoff approach. Pollutants from various sources (livestock, wildlife, septic systems, etc.) accumulate on the land surface and are subject to runoff during rain events. Different land uses are associated with various anthropogenic and natural processes that determine the potential pollutant load. The pollutants that are contributed by interflow and groundwater are also modeled in LSPC for each land use category. Pollutant loadings from surface runoff, interflow, and groundwater outflow are combined to form the final loading output from LSPC. In summary, nonpoint sources from the watershed are represented in the model as landuse-based runoff from the landuse categories to account for their contribution (USEPA, 200a). For this study, the watershed processes were simulated based on buildup and washoff processes. The final loads were converted to model accumulation rates (ACQOP, units A

57 of counts/acre/day for pathogens). The ACQOP can be calculated for each land use based on all sources contributing nutrients to the land surface. Sources of bacteria assessment were described in Section 3. The dominant bacterial sources are from urban landuse, wetlands, and forest. Wildlife contributions from different animals were summed together to obtain total loading as count per day and were applied to forest and wetland. For urban landuse, contributions from wildlife (birds/duck), pets, failures of septic systems are summed together and then applied to the urban landuse. As wildlife and pets are dominant bacterial sources, urban landuse contributes highest bacterial loading. Contribution from livestock was applied only to the subwatershed where these sources are located. For the current model simulation, SSOs were not simulated by watershed model as the incidences occurred less than 3% of the time within a given year. Loading estimation was conducted for each subwatershed and each landuse so that spatial loading variations can be simulated. These loading parameters were adjusted accordingly during model calibration to account for uncertainty in the loading estimation. The final loads discharged to the stream were estimated based on model simulation results to minimize the uncertainty of source variations in different subwatersheds. The other two major parameters governing bacteria simulation, the maximum storage limit (SQOLIM, units in lb/acre/day for nutrients or counts/acre/day) and the washoff rate (WSQOP, unit in inches/hour), were specified based on soil characteristics and land use practices (Shen et al., 2005). The WSQOP is defined as the rate of surface runoff that results in 90% removal of pollutants in one hour. The lower the value, the more easily washoff occurs. Figure A.: Subwatersheds Model Segmentation A2

58 Figure A.2: A Diagram of Estuarine Model Grid A...2 Hydrodynamic Model Hydrodynamic transport is the essential dynamic for driving the movement of dissolved and particulate substances in aquatic waters. Hydrodynamic models are used to represent transport patterns in complex aquatic systems. For the Poquoson River study, the EFDC model was selected to simulate hydrodynamics. EFDC is a general purpose modeling package for simulating -, 2-, and 3-dimensional flow and transport in surface water systems including: rivers, lakes, estuaries, reservoirs, wetlands, and oceanic coastal regions. It was originally developed at the Virginia Institute of Marine Science for estuarine and coastal applications and is considered public domain software (Hamrick, 992a, 992b). The model code has been extensively tested and documented. The EFDC model has been integrated into the EPA s TMDL Modeling Toolbox for supporting TMDL development ( Inputs to the EFDC model for the Poquoson River include: A3
59 Bathymetry Freshwater inputs (lateral and up-stream) from watersheds Surface meteorological parameters such as wind Bacteria loadings from watershed Tide and salinity at the open boundary The model uses a grid to represent the study area (Figure A.). The grid is comprised of cells connected through the modeling process. The scale of the grid (cell size) determines the level of resolution in the model and the model efficiency from an operational perspective. The smaller the cell size, the higher the resolution and the lower the computational efficiency. The model grid used for the Poquoson River was developed based on the high-resolution shoreline digital files from USEPA and USGS topographic maps. The grid covers the entire River so that the mouth of the River can be used to set the boundary condition. Setting the model boundary well outside the model area of interest increases the model accuracy by reducing the influence of the boundary condition. There are a total of 593 cells in the horizontal surface grid and three vertical layers. Long-term mean salinity at the surface and the bottom and harmonic tidal constituents were used for the model open boundary. Daily flow and bacteria loading were discharged to the River for the simulations. A..2 Model Calibration and Verification A..2. Watershed Model The calibration process involved adjustment of the model parameters used to represent the hydrologic processes until acceptable agreement between simulated flows and field measurements were achieved. Since there is no USGS gage or any other continuous flow data available in the Poquoson River watershed, a reference watershed was used for calibration. The USGS Gage in Beaverdam Swamp near Ark, VA, located approximately 20 miles north of the Poquoson River watershed, was used to calibrate the model parameters for hydrology simulation. This is the only gage station in this region. The observation was from The landuses of forest and wetland and soil types are similar to the Back River watershed, but the Poquoson River watershed has less urban land. The US EPA conducted a watershed simulation for tidal water region. The EPA model results were also used for the model calibration as the LSPC and the EPA models are similar watershed models. Figure A.3 shows the time series comparison of daily stream flow for years 985 and 987 for the watershed of Beaverdam Swamp using USGS data and a selected urban subwatershed in the Poquoson River watershed using EAP data. It can been seen that model results matches the EPA model results very well as the precipitation data used for this watershed are similar. Figure A.4 shows the long-term daily stream flow frequency comparison between the model results and field data collected by the USGS gage. Based on this comparison, it can be seen that LSPC has reasonably reproduced the observations. A4

60 Figure A.3: Time Series Comparison of the Daily Stream Flow between Model Simulation and Observed Data from USGS Stream Gage in 985 and 987 Figure A.4: Long-term Accumulated Daily Stream Flow Comparison between Model Simulation and the Reference Flow Station USGS A5
61 A..2.2 Estuarine Model Calibration of the bacteria transport model is typically performed using water quality measurements from the watershed. Absent the necessary data from the Poquoson River watershed, the calibration was performed on the observation data in the Poquoson River receiving water using an iterative approach between the watershed model and receiving water model. The watershed model parameters (accumulation and loss rates) for bacteria associated with surface runoff of each land use category were estimated on the basis of all available field survey data using USEPA recommended loading production rates (USEPA, FecalTool.xls program, 998) (Section:3.3). An eight-year model simulation ( ) was conducted. A constant bacteria decay rate of.0/day is used, which was derived based upon observations and literature review (MDE, 20). Figure A.5 shows 8 selected stations of impaired segments. It can be seen that model simulated the observed data quite well, indicating that the loading-based watershed approach provides a good estimate. As bacterial concentrations in the River are highly driven by events, i.e., SSOs and boating activities, as well as directly access of wildlife, some discrepancies can be expected. In particular, the model can miss some observations of high concentration, as the causes of these events are unknown. Overall, model simulations are satisfactory. A6
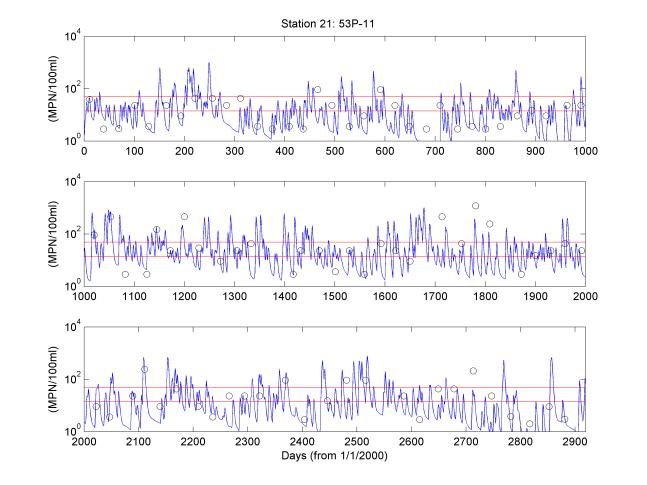
62 A7
63 A8
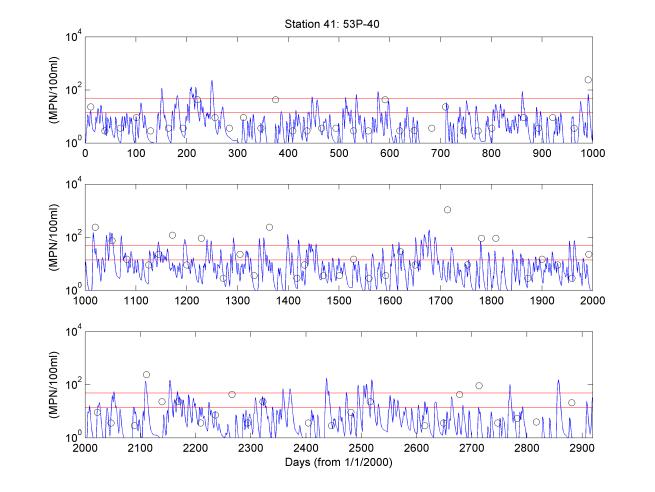
64 A9
65 Figure A.5: Model Calibration of Enterococci at Selected Stations in the Impaired Segments A.2 TMDL Development A.2. Allowable Load An eight-year model simulation from 2000 to 2007 was selected to represent the current condition loadings. According to the enterococci endpoint, a series of loading reductions were conducted to find the allowable loads to evaluate the attainment of acceptable in-stream water quality. With about 54% reduction of fecal coliform loadings from different subwatersheds, the water quality standards can be attained. The attainment of water quality standards was based on 30-month statistics of geometric mean and 90 th percentile concentrations. Fecal coliform concentrations at each observation station were assessed to ensure that water quality standards were met. There are two segments (VAT-C07E_LYO0A06 and VAT-C07E_HOD0A08) that violate both primary contact and shellfish criteria. As the 90 th percentile shellfish standard is the most stringent criterion, it is used to determine the load reduction. The distribution of instantaneous 30-month moving geometric mean and 90 th percentile concentrations of fecal coliform at selected stations where high violation were observed under existing condition and corresponding concentrations after reduction are shown in Figures A.6- to A.6-. A
66 Figure A.6-: Model Results of Fecal Coliform Distribution at Station 53P-29 for Current Condition and after Load Reduction A
67 Figure A.6-2: Model Results of Fecal Coliform Distribution at Station 53P-34 for Current Condition and after Load Reduction A2
68 Figure A.6-3: Model Results of Fecal Coliform Distribution at Station 53P-26 for Current Condition and after Load Reduction A3
69 Figure A.6-4: Model Results of Fecal Coliform Distribution at Station 53P-9 for Current Condition and after Load Reduction A4
70 Figure A.6-5: Model Results of Fecal Coliform Distribution at Station 53P-7B for Current Condition and after Load Reduction A5
71 Figure A.6-6: Model Results of Fecal Coliform Distribution at Station 53P-46.7 for Current Condition and after Load Reduction A6
72 Figure A.6-7: Model Results of Fecal Coliform Distribution at Station 53P-44.3 for Current Condition and after Load Reduction A7
73 Figure A.6-8: Model Results of Fecal Coliform Distribution at Station 53P-8 for Current Condition and after Load Reduction A8
74 Figure A.6-9: Model Results of Fecal Coliform Distribution at Station 53P-24 for Current Condition and after Load Reduction A9
75 Figure A.6-: Model Results of Fecal Coliform Distribution at Station 53P-2 for Current Condition and after Load Reduction A20
76 A.2.2 Total Maximum Daily Load The TMDL seeks to eliminate 0% of the human-derived fecal component regardless of the allowable load determined through the LA process. Human-derived forms of fecal coliform are a serious concern in the estuarine environment and both state and federal law preclude the discharge of human waste. According to the preceding analysis, reduction of the controllable loads, human, livestock and pets, will not result in achievement of the water quality standard. Absent any other sources, the reduction is allocated to wildlife. The allocations presented demonstrate how the TMDLs could be implemented to achieve water quality standards; however, the state reserves the right to allocate differently, as long as consistency with the achievement of water quality standards is maintained. All TMDLs have some probability of being exceeded, with the probability being either explicitly specified or implicitly assumed. EPA guidance states that the probability component of a calculated maximum daily load (MDL) should be based on a representative statistical measure that is dependent upon the specific TMDL and best professional judgment of the developers (USEPA, 2007). This statistical measure represents how often the MDL is expected, or allowed, to be exceeded. The primary options for selecting this level of protection would be:. The maximum daily load reflects some central tendency: In this option, the maximum daily load is based upon the mean or median value of the range of loads expected to occur. The variability in the actual loads is not addressed. 2. The maximum daily load reflects a level of protection implicitly provided by the selection of some critical period: In this option, the maximum daily load is based upon the allowable load that is predicted to occur during some critical period examined during the analysis. The developer does not explicitly specify the probability of occurrence. 3. The maximum daily load is a value that will be exceeded with a pre-defined probability: In this option, a reasonable upper bound percentile is selected for the maximum daily load based upon a characterization of the variability of daily loads. For example, selection of the 95 th percentile value would result in a maximum daily load that would be exceeded 5% of the time. Because time variable model simulations were conducted, daily loads vary significantly. Daily loading varies both seasonally and annually with respect to different hydrological years. Therefore, the MDL for this analysis is determined based on a pre-defined probability. The computed MDL is consistent with achieving the annual cumulative load target. A 90 th percentile was selected as the pre-defined probability, which agrees with fecal coliform criteria. Because loading distribution is better described by a log-normal distribution in the Poquoson River, the MDL is computed as follows (USEPA, 2007): TMDL LTA exp( Z p y ) y A2
77 Where Zp is p th percentage point of the standard normal distribution. For the 95 th percentile, Zp =.28. LTA is long-term mean daily loading and y is computed as: y ln( CV 2 ) where CV is coefficient of variation of the untransformed data, which equals to standard deviation divided by the mean. Using the method described above, LTA is the mean daily loading from for each subwatershed. The daily mean loading and standard deviations with respect to loads were computed. The maximum daily load of fecal coliform was calculated using the above equations. The results of maximum daily loading were listed in Table 4. for Poquoson River. The loading distribution between York County and the City of Poquoson is listed in Table A.2 and the loading distributions by impaired segments are listed in Table A.3. The fecal coliform TMDLs for Impaired Segments is listed in Table A.4. Note that future allocation is not implemented in load and wastewater load allocation. Table A.: Estimated Loads and Load Reductions for Fecal Coliform Waterbody Pollutant Criterion (MPN/0ml) Current Load (Counts/Day) Allowable Load (Counts/Day) Required Reduction (%) Poquoson River Fecal Coliform 90 th Percentile: 49 6.E E+2 5.5% Back Creek Fecal Coliform 90 th Percentile: E+ 3.8E Table A.2: Estimated Loads and Load Reductions for Fecal Coliform by City and County Waterbody Name Jurisdiction Existing Counts/Day TMDL Counts/Day Reduction Poquoson River City of Poquoson 2.5E+2.00E % York County 3.95E+2.95E % Sum 6.E E+2 5.5% Back Creek York County 7.35E+ 3.8E+ 48.2% A22
78 Table A.3: Estimated Loads and Load Reductions for Fecal Coliform by Impaired Segments List ID VAT-C07E_LMC0A04 VAT-C07E_PTC0A04 Name Lambs Creek - Poquoson River Patricks Creek - Poquoson River Current Load (Counts/Day) Allowable Load (Counts/Day) Reduction (%).67E E E+ 4.52E VAT-C07E_ROB0A04 Roberts Creek - Upper 7.3E+ 5.33E VAT-C07E_WHH0A06 VAT-C07E_POQ0A06 VAT-C07E_CHS0A06 White House Cove - Bennet Cr. Area Poquoson River - Upper [TMDL-CD] Chisman Creek-Upper & Goose Cr 6.E+ 3.42E E E E E VAT-C07E_HOD0A08 Hodges Creek - Upper 4.3E+.73E VAT-C07E_LYO0A06 Lyons Creek - Upper (DSS_06-IR).E+ 7.22E VAT-C07E_FLY0A06 Floyds Bay 2.8E+.38E VAT-C07E_CAB0A08 Cabin Creek - Upper 2.29E+.37E VAT-C07E_POQ0B08 Poquoson Upper downstream POQ0A06 4.9E+.38E+ 67. VAT-C07E_POQ02B08 Unnamed 6.20E Sum 6.E E Table A.4: The fecal coliform TMDLs for Impaired Segments List ID TMDL LA WLA MOS VAT-C07E_LMC0A E+ 4.44E+.39E+ Implicit VAT-C07E_PTC0A E+ 3.9E+ 6.5E+09 Implicit VAT-C07E_ROB0A E+ 4.45E+ 8.86E+09 Implicit VAT-C07E_WHH0A E+.95E+.47E+ Implicit VAT-C07E_POQ0A E+ 6.2E+.63E+ Implicit VAT-C07E_CHS0A E+ 4.89E+.20E+ Implicit VAT-C07E_HOD0A08.73E+.68E+ 4.84E+09 Implicit VAT-C07E_LYO0A E+ 5.8E+ 2.04E+ Implicit VAT-C07E_FLY0A06.38E+.9E+.92E+ Implicit VAT-C07E_CAB0A08.37E+.27E+.05E+ Implicit VAT-C07E_POQ0B08.38E+.27E+.09E+09 Implicit VAT-C07E_POQ02B E E E+08 Implicit Sum 2.96E E+2 6.4E+ A23
79 A.3 Source Distribution and Load Allocation Finally, the results of the fecal coliform loading for each source category estimated by the watershed approach and model simulations were used to partition the load allocation that would meet water quality standards according to sources. Although an SSO does not occur very often, it is considered as a controllable source. The activities of boating (marina) are considered as well and allocated to entire area. The allocation is summarized in Table A.5. Table A.5: Reduction of Potential Sources Waterbody Name Poquoson River Back Creek Category Current Load (Counts/Day) Percentage Allowable Load (Counts/Day) Reduction Needed (%) Wildlife 3.90E E Pets.44E E Livestock 3.8E E Septic 3.55E E SSO 3.0E E Marina.40E E Total 6.E E Wildlife 5.84E E Pets.50E E Livestock 5.90E+08 < 0.00E Septic.34E+08 <0 0.00E SSO Marina Total 7.35E E The distribution of source distribution, current load, and reduction required for each listed area are summarized in Table A.6. The sources from humans are the sum of failing septic systems, boating activities, and potential SSOs. As SSOs only occurred less than times over in a year, they do not contribute significantly to daily loading. The estimation of SSOs was based on 95 th percentile flow of incidences occurred in that watershed. The estimation can be considered as a worst-case scenario. The contributions of marinas (boating activities) were not included in the allocations to each subwatershed of impaired area. A24
80 Table A.6: Load Allocation and Required Reduction for Fecal Coliform Area Name Percent Lambs Creek Patricks Creek/unnamed Crane Roberts Creek White House Cove Poquoson River-Upper * Chisman Creek-upper Hodges River-upper Lyons Creek-upper Current Load (Counts/Day) Load Allocation (Counts/Day) Reduction (%) Human 63.%.05E Livestock 0.0% 6.664E Pet.9%.986E+.67E+ 5.9 Wildlife 25.0% 4.64E+ 4.64E+ 0.0 Total 0.0%.667E E Human 2.4% 3.866E Livestock 6.2% 2.576E Pet 3.7% 2.83E Wildlife 67.7%.078E+ 7.67E Total 0.0%.593E+ 7.67E Human 0.0% 0.000E Livestock 0.0% 0.000E Pet 24.4%.779E Wildlife 75.6% 5.526E E+ 3.5 Total 0.0% 7.305E E Wildlife 0.0% 0.000E Human 0.0% 0.000E Livestock 44.0% 2.687E+ 8.00E Pet 56.0% 3.44E+ 3.44E+ 0.0 Total 0.0% 6.E E Human.0%.293E Livestock 0.0% 2.43E Pet 26.2% 3.397E Wildlife 63.8% 8.277E+ 7.84E+ 5.3 Total 0.0%.297E E Human 0.2% 3.45E Livestock 20.3% 2.645E Pet 2.5% 2.806E Wildlife 57.9% 7.552E E+ 9.4 Total 0.0%.303E E Human 0.0% 0.000E Livestock 0.0% 0.000E Pet 5.2% 2.225E Wildlife 94.8% 4.090E+.725E Total 0.0% 4.33E+.725E Human 0.0% 0.000E Livestock 0.0% 0.000E Pet 37.2% 4.35E E A25
81 Floyds Bay Cabin Creek-upper Wildlife 62.8% 6.974E E+ 0.0 Total 0.0%.E+ 7.22E Human 0.0% 2.532E Livestock 0.0% 0.000E Pet 24.0% 5.228E Wildlife 76.0%.659E+.38E+ 6.8 Total 0.0% 2.82E+.38E Human 0.00% 0.000E Livestock.64% 3.75E Pet 9.22% 2.2E Wildlife 89.4% 2.042E+.375E Total 0.00% 2.290E+.375E *POQA06/POQB08 A26
 In the Poquoson River. Figure B.")
82 Appendix B: Fecal coliform data collected by the Virginia Department of Health, Division of Shellfish Sanitation (VDH-DSS) In the Poquoson River. Figure B.: Locations of VDH-DSS stations monitored in the Poquoson River ( ) B
Meeting Agenda. Why are we here? Getting Started. Designated Uses. Water Quality Standards
 Upper Basin Total Maximum Daily Load Study and Rapidan Technical Advisory Committee Meetings July 27, Meeting Agenda Water Quality Assessments and TMDL Process Bryant Thomas, VA DEQ Overview of 16 TMDL
CITY OF LYNDEN STORMWATER MANAGEMENT PROGRAM REPORT MARCH 1, 2016
 CITY OF LYNDEN STORMWATER MANAGEMENT PROGRAM 2015 WATER QUALITY MONITORING REPORT CITY OF LYNDEN 300 4 TH STREET LYNDEN, WASHINGTON 98264 PHONE (360) 354-3446 MARCH 1, 2016 This document serves as an attachment
North Carolina Addendum Total Maximum Daily Load (TMDL) for Impaired Segments in the Dan River Watershed to Virginia TMDLs Approved by EPA Region 3
 for Impaired Segments in the Dan River Watershed to Virginia TMDLs Approved by EPA Region 3") North Carolina Addendum Total Maximum Daily Load (TMDL) for Impaired Segments in the Dan River Watershed to Virginia TMDLs Approved by EPA Region 3 Assessment units (AU) for the Dan River, 22-(39)b and
North Carolina Addendum Total Maximum Daily Load (TMDL) for Impaired Segments in the Dan River Watershed to Virginia TMDLs Approved by EPA Region 3 Assessment units (AU) for the Dan River, 22-(39)b and
Water Quality Trends for Patchogue Bay
 Water Quality Trends for Patchogue Bay 2018 This report summarizes water quality data for fecal coliform and total coliform in Patchogue Bay for the years 2003-2017. Prepared by: Brian M. McCaffrey Stormwater
Assessment of Pathogen Strategies
 Assessment of Pathogen Strategies Bacteria levels in receiving waters are a primary concern for federal, state, and local agencies. The primary sources of bacteria are generally attributed to combined
ASSESSMENT OF FECAL COLIFORM IN LITTLE RABBIT CREEK AND LITTLE SURVIVAL CREEK
 ASSESSMENT OF FECAL COLIFORM IN LITTLE RABBIT CREEK AND LITTLE SURVIVAL CREEK FINAL REPORT Prepared for: Alaska Department of Environmental Conservation 555 Cordova Street Anchorage, Alaska 99501 Prepared
FLORIDA DEPARTMENT OF ENVIRONMENTAL PROTECTION. Division of Environmental Assessment and Restoration, Bureau of Watershed Restoration
 FLORIDA DEPARTMENT OF ENVIRONMENTAL PROTECTION Division of Environmental Assessment and Restoration, Bureau of Watershed Restoration NORTHWEST DISTRICT PENSACOLA BAY BASIN FINAL TMDL Report Fecal Coliform
Water Quality Trends for Conscience Bay
 Water Quality Trends for Conscience Bay 2018 This report summarizes water quality data for fecal coliform and total coliform in Conscience Bay for the years 1998-2018. Prepared by: Brian M. McCaffrey Stormwater
Total Coliform and Fecal Coliform TMDL for Lower Sweetwater Creek (WBID 1570A)
") FINAL FLORIDA DEPARTMENT OF ENVIRONMENTAL PROTECTION Division of Water Resource Management, Bureau of Watershed Management SOUTHWEST DISTRICT TAMPA BAY BASIN TMDL Report Total Coliform and Fecal Coliform
FINAL FLORIDA DEPARTMENT OF ENVIRONMENTAL PROTECTION Division of Water Resource Management, Bureau of Watershed Management SOUTHWEST DISTRICT TAMPA BAY BASIN TMDL Report Total Coliform and Fecal Coliform
Tufts University Water: Systems, Science, and Society (WSSS) Program
 Program") To: From: John Foster, Elbow Cay, the Bahamas; Friends of the Environment, Marsh Harbor, the Bahamas Alex Bedig, Amanda Garfield, Shonda Gaylord, Jack Melcher, Melissa Ng, Nathan Rawding, Kendall Webster,
To: From: John Foster, Elbow Cay, the Bahamas; Friends of the Environment, Marsh Harbor, the Bahamas Alex Bedig, Amanda Garfield, Shonda Gaylord, Jack Melcher, Melissa Ng, Nathan Rawding, Kendall Webster,
Fecal Coliform TMDL for Strawberry Creek (WBID 2239)
") FLORIDA DEPARTMENT OF ENVIRONMENTAL PROTECTION Division of Environmental Assessment and Restoration, Bureau of Watershed Restoration NORTHEAST DISTRICT LOWER ST. JOHNS BASIN Final TMDL Report Fecal Coliform
FLORIDA DEPARTMENT OF ENVIRONMENTAL PROTECTION Division of Environmental Assessment and Restoration, Bureau of Watershed Restoration NORTHEAST DISTRICT LOWER ST. JOHNS BASIN Final TMDL Report Fecal Coliform
Fecal Coliform TMDL for Saint Joes Creek, WBID 1668A
 FLORIDA DEPARTMENT OF ENVIRONMENTAL PROTECTION Division of Water Resource Management, Bureau of Watershed Management SOUTHWEST DISTRICT SPRINGS COAST BASIN ANCLOTE RIVER/COASTAL PINELLAS COUNTY PLANNING
RE: PATAHA CREEK FECAL COLIFORM COMPLIANCE WITH WATER QUALITY STANDARDS
 To: WRIA 35 Planning Committee Memo From: Jory Oppenheimer and Kari Vigerstol Project: WRIA 35 Level II Water Quality CC: Ben Floyd, HDR/EES; John Koreny, HDR/EES Date: March 10, 2005 Job No: 22592 RE:
Fourth Creek (Subbasin ) Yadkin-Pee Dee River Basin North Carolina
 Yadkin-Pee Dee River Basin North Carolina") Final Total Maximum Daily Load (TMDL) for Fecal Coliform October 2001 Fourth Creek (Subbasin 03-07-06) Yadkin-Pee Dee River Basin North Carolina Prepared by: NC Department of Environment and Natural Resources
Final Total Maximum Daily Load (TMDL) for Fecal Coliform October 2001 Fourth Creek (Subbasin 03-07-06) Yadkin-Pee Dee River Basin North Carolina Prepared by: NC Department of Environment and Natural Resources
Fecal and Total Coliform TMDL for Sparkman Branch (WBID 1561)
") FINAL FLORIDA DEPARTMENT OF ENVIRONMENTAL PROTECTION Division of Water Resource Management, Bureau of Watershed Management Southwest DISTRICT Tampa Bay BASIN TMDL Report Fecal and Total Coliform TMDL for
FINAL FLORIDA DEPARTMENT OF ENVIRONMENTAL PROTECTION Division of Water Resource Management, Bureau of Watershed Management Southwest DISTRICT Tampa Bay BASIN TMDL Report Fecal and Total Coliform TMDL for
City of Peoria Clean Water Efforts. Governor s s Conference on the Management of the Illinois River October 4, 2007
 City of Peoria Clean Water Efforts Governor s s Conference on the Management of the Illinois River October 4, 2007 1 What do you call dinner and a movie with an unemployed guy? An unfunded man-date! 2
FECAL COLIFORM MONITORING IN GRAYS HARBOR COUNTY: SUMMARY REPORT OF MONITORING RESULTS FOR
 Chehalis Basin Partnership Fecal Coliform Monitoring in Grays Harbor County: Summary Report of Monitoring Results for 2000-2003 Draft June 30, 2003 Prepared by Tetra Tech/KCM, Inc. 1917 First Avenue, Seattle,
Figure 1. Overview map of Burrard Inlet, showing location of False Creek inlet.
 Figure 1. Overview map of Burrard Inlet, showing location of False Creek inlet. 65 Figure 2. Location map of False Creek and shoreline and mid-channel monitoring sites. 66 Figure 3. Location of CSO's,
Statistical Evaluation of BMP Effectiveness in Reducing Fecal Coliform Impairment in Mermentau River Basin
 Statistical Evaluation of BMP Effectiveness in Reducing Fecal Coliform Impairment in Mermentau River Basin Z.-Q. Deng 1 and H. Chowdhary 2 1 Assistant Professor, Department of Civil and Environmental Engineering,
FINAL Water Year 2012 Bacteria Sampling Report for the Klamath River Estuary
 FINAL Water Year 2012 Bacteria Sampling Report for the Klamath River Estuary Prepared by: Patrick Fox Yurok Tribe Environmental Program April 2013 Acknowledgements The Yurok Tribe Environmental Program
Fecal Coliform Bacteria Monitoring for the Sleepy Creek Watershed Incremental 319 Project Final Report
 Fecal Coliform Bacteria Monitoring for the Sleepy Creek Watershed Incremental 319 Project Final Report Prepared for: West Virginia Conservation Agency Prepared by: Cacapon Institute Back Creek Road PO
Pathogens and Grazing Livestock
 Pathogens and Grazing Livestock Steve Ensley DVM, PhD 10/16/09 Water Borne Pathogens This presentation will have a specific emphasis on water borne pathogens. NUMBERS OF IOWA WATER SOURCES WITH Stream/River
White Oak Creek. Recreational Use Attainability Analysis Summary of Findings. Texas Institute for Applied Environmental Research Stephenville, Texas
 White Oak Creek Recreational Use Attainability Analysis Summary of Findings Texas Institute for Applied Environmental Research Stephenville, Texas August 8, 2016 Sulphur Springs, Texas August 9, 2016 Mount
Lower St. Johns River Tributaries Fecal Coliform Basin Management Action Plan Jacksonville Environmental Symposium
 Lower St. Johns River Tributaries Fecal Coliform Basin Management Action Plan Jacksonville Environmental Symposium WBIDs Addressed in This BMAP This BMAP includes 10 of the 75 (cycle 2) fecal coliform
Town of Oakfield Agricultural and Farmland Protection Plan
 SECTION III COMMUNITY OVERVIEW A. Regional Setting / Location The Town of Oakfield is located in the northwestern portion of Genesee County. Located west of New York's Finger Lakes, the Town is uniquely
Exploring Drivers of Fecal Coliform Pollution Trends in the Puget Sound. Washington Commercial Shellfish
 9/22/2016 Exploring Drivers of Fecal Coliform Pollution Trends in the Puget Sound Authors: Lindsey Hamilton, Scott Berbells, Lawrence Sullivan, Jean Snyder Washington State Department of Health Washington
Portland Water District Sebago Lake Monitoring Programs Lower Bay Bacteria Monitoring Presenting data from 1977 to 2018 Laurel Jackson
 Portland Water District Sebago Lake Monitoring Programs Lower Bay Bacteria Monitoring Presenting data from 1977 to 2018 Laurel Jackson Introduction Sebago Lake is the primary drinking water supply for
Finding sources of fecal coliform bacteria in stormwater runoff
 Finding sources of fecal coliform bacteria in stormwater runoff David Tomasko, Ph.D. May 12, 2016 Why the concern over bacteria? Cholera Tens of millions killed over the centuries > 100,000 Americans 11
Waukegan & Calumet Rivers. All Hands Meeting
 Waukegan & Calumet Rivers 516(e) Update All Hands Meeting David F. Bucaro, P.E. Chief, Economic Formulation & Analysis Section, Planning Branch May 18 th, 2011 Kensington Court Ann Arbor, MI 1 2 Waukegan
The north half of Section 18, Township 37 North, Range 6 East, Second Principal Meridian, Jefferson Township, Elkhart County, Indiana; also,
 The north half of Section 18, Township 37 North, Range 6 East, Second Principal Meridian, Jefferson Township, Elkhart County, Indiana; also, The east half of Sections 21, 28, and 33, Township 37 North,
Recreational Use Attainability Analysis Summary of Findings & Public Comment
 The Neches River Above Lake Palestine, Prairie Creek, Mud Creek, and West Mud Creek Recreational Use Attainability Analysis Summary of Findings & Public Comment Texas Institute for Applied Environmental
FECAL COLIFORM BACTERIA SUMMARY SHEET
 FECAL COLIFORM BACTERIA SUMMARY SHEET WATERBODY: Greybull River (Tributary to Big Horn River) (WYBH10080009) REACH DESCRIPTION: Confluence wi e Big Horn River upstream to Meeteetse, Wyoming. BACKGROUND:
Analysis of Indicator Bacteria in NJ Dead-end Lagoons. Michael Callaghan Gasbarro Mentor: Dr. Kathryn Goddard
 Analysis of Indicator Bacteria in NJ Dead-end Lagoons Michael Callaghan Gasbarro Mentor: Dr. Kathryn Goddard Delaware Valley Estuary Summit Session 20: January 28, 2015 Dead-end Canals or Lagoons Popular
Land-Use and Water Quality Across the Cape Fear River Basin, NC: from 2001 to Jennifer Braswell Alford, PhD
 Land-Use and Water Quality Across the Cape Fear River Basin, NC: Exploring Spatial and Temporal Relationships from 2001 to 2006 Jennifer Braswell Alford, PhD Introduction There are over 3.6 million miles
Clean Ocean Access Water Quality Monitoring Summary Report
 Clean Ocean Access 2008-2017 Water Quality Monitoring Summary Report CONTRIBUTING AUTHORS: Eva Touhey, Program Manager, Clean Ocean Access Jessica Frascotti, Program Coordinator, Clean Ocean Access Dave
SECTION 3 GENERAL DESCRIPTION OF THE RIVER BASIN
 SECTION 3 GENERAL DESCRIPTION OF THE RIVER BASIN SECTION 3 GENERAL DESCRIPTION OF THE RIVER BASIN River basin description. A general description of the river basin or subbasin, as appropriate, in which
Fecal Coliform Total Maximum Daily Load (TMDL) - North Branch of the Sunrise River Final Report
 - North Branch of the Sunrise River Final Report") Fecal Coliform Total Maximum Daily Load (TMDL) - North Branch of the Sunrise River Final Report Minnesota Pollution Control Agency Chisago County December 2006 wq-iw6-01e 1 Fecal Coliform Total Maximum
Fecal Coliform Total Maximum Daily Load (TMDL) - North Branch of the Sunrise River Final Report Minnesota Pollution Control Agency Chisago County December 2006 wq-iw6-01e 1 Fecal Coliform Total Maximum
X. WHATCOM CREEK SMA. X.1 Watershed Analysis. X.1.1 Landscape Setting
 X. WHATCOM CREEK SMA Summary: The entire length of Whatcom Creek is located within the City of Bellingham. SMA jurisdiction associated with this creek is approximately 300 acres. Land use is dominated
Hydrological study for the operation of Aposelemis reservoir Extended abstract
 Hydrological study for the operation of Aposelemis Extended abstract Scope and contents of the study The scope of the study was the analytic and systematic approach of the Aposelemis operation, based on
2.0 Physical Characteristics
 _ 2.0 Physical Characteristics 2.1 Existing Land Use for the Project The site is comprised of approximately 114 acres bounded by Highway 101 to the north, the existing town of Los Alamos to the east, State
An Introduction. The Saginaw River/Bay Area of Concern
 Saginaw River & Bay Area of Concern: Looking Forward Continued Partnerships in the Restoration of Saginaw Bay Michelle Selzer Lake Huron Coordinator & Interim AOC Coordinator Saginaw Bay Watershed Conference
Paul Sturm Roberto Viqueira Ríos
 Paul Sturm Roberto Viqueira Ríos In this talk Brief Background on Land Based Sources Historical Perspective Guánica watershed characteristics/ issues High priority restoration projects Other key issues
DIDYMO SURVEY, LOWER FRYINGPAN RIVER, BASALT, COLORADO 2015
 DIDYMO SURVEY, LOWER FRYINGPAN RIVER, BASALT, COLORADO 2015 Second Annual Report PREPARED FOR: ROARING FORK CONSERVANCY PREPARED BY: COLORADO MOUNTAIN COLLEGE NATURAL RESOURCE MANAGEMENT PROGRAM TIMBERLINE
MANAGING FRESHWATER INFLOWS TO ESTUARIES
 MANAGING FRESHWATER INFLOWS TO ESTUARIES Yuna River Hydrologic Characterization A. Warner Warner, A. (2005). Yuna River Hydrologic Characterization. University Park, Pennsylvania: The Nature Conservancy.
Appendix G: Summary of Microbial Source Tracking Studies in Southern California
 Appendix G: Summary of Microbial Source Tracking Studies in Southern California s Indicators/ Analyzed 2003-2004 Mission Bay MEC / Weston Bay, MS4, General Bacteroides by PCR Human Bacteroides by PCR Ribotyping
ROAD AND TRAIL PROJECT APPROVAL
 ROAD AND TRAIL PROJECT APPROVAL www.marincountyparks.org Marin County Parks, 3501 Civic Center Dr, Suite 260, San Rafael, CA 94903 DATE: July 12, 2017 PRESERVE: Gary Giacomini Open Space Preserve PROJECT:
Mud Creek and West Mud Creek
 Mud Creek and West Mud Creek Recreational Use Attainability Analysis Summary of Findings Texas Institute for Applied Environmental Research Stephenville, Texas September 15, 2014 1 Project Partners Texas
Rule Governing the Designation and Establishment of All-Terrain Vehicle Use Trails on State Land
 Rule Governing the Designation and Establishment of All-Terrain Vehicle Use Trails on State Land 1.0 Authority 1.1 This rule is promulgated pursuant to 23 V.S.A. 3506. Section 3506 (b)(4) states that an
Loyalsock Creek Bacterial Coliforms. Presented By: Dr. Mel Zimmerman Clean Water Institute Lycoming College Matthew Bennett Jim Rogers
 Loyalsock Creek Bacterial Coliforms Presented By: Dr. Mel Zimmerman Clean Water Institute Lycoming College Matthew Bennett Jim Rogers What is E. coli? Short for Escherichia coli (a bacteria) It is a
PURPOSE AND NEED. Introduction
 Public Scoping: Allocation of Recreation Capacity for Commercial Outfitter Guide Services on North Kruzof Island Trails (Kruzof Island Outfitter Guide) PURPOSE AND NEED Introduction The U.S. Department
WIFSS research on E. coli O157:H7 in central coastal California. Rob Atwill, D.V.M., Ph.D. University of California-Davis
 WIFSS research on E. coli O157:H7 in central coastal California Rob Atwill, D.V.M., Ph.D. University of California-Davis To all cooperators: ranchers, growers, regulators, environmentalists, resource managers,
THE IMPLEMENTATION OF EWFD/WFD IN THE REGION OF VOJVODINA WITHIN JOINT SLOVAK-SERBIA SERBIA PROJECTS
 Towards Integrated River Basin Management The 55 th Anniversary of the Founding of the Water Research Institute THE IMPLEMENTATION OF EWFD/WFD IN THE REGION OF VOJVODINA WITHIN JOINT SLOVAK-SERBIA SERBIA
TOWARDS SUSTAINABLE MANAGEMENT OF MARINE AND COASTAL HABITATS ASIA- PACIFIC DAY FOR THE OCEAN
 TOWARDS SUSTAINABLE MANAGEMENT OF MARINE AND COASTAL HABITATS WANNAKIAT THUBTHIMSANG PHUKET MARINE BIOLOGICAL CENTER, DMCR, THAILAND ASIA- PACIFIC DAY FOR THE OCEAN 20 NOVEMBER 2018, CONFERENCE ROOM 4,
Spatial Distribution and Characteristics of At-Risk Species in the Southeast U.S.
 Nicholas Institute for Environmental Policy Solutions Scoping Document Part 2 Exploratory Analysis of Characteristics and Trends of At-Risk Species in the Southeast U.S. Spatial Distribution and Characteristics
Pinellas County Environmental Lands
 Pinellas County Environmental Lands In addition to traditional parks and recreation facilities, Pinellas County owns and manages a system of environmental lands that provides specialized resource-based
INVESTIGATION OF NONPOINT POLLUTION SOURCES IMPACTING SHELLFISH GROWING AREAS IN TOMALES BAY,
 TOMALES BAY SHELLFISH TECHNICAL ADVISORY COMMITTEE FINAL REPORT: INVESTIGATION OF NONPOINT POLLUTION SOURCES IMPACTING SHELLFISH GROWING AREAS IN TOMALES BAY, 995-96 December 2000 Tomales Bay Shellfish
UNITED STATES DEPARTMENT OF THE INTERIOR BUREAU OF LAND MANAGEMENT MANUAL TRANSMITTAL SHEET
 Form 1221-2 (June 1969) UNITED STATES DEPARTMENT OF THE INTERIOR BUREAU OF LAND MANAGEMENT MANUAL TRANSMITTAL SHEET Release 8-83 Date Subject 8353 Trail Management Areas Secretarially Designated (Public)
To all our cooperators from across California. be they ranchers, growers, or regulators, activists, resource managers, and the public THANK YOU!
 Managing Rangeland sheds for Agricultural Production, Quality, and Food Safety To all our cooperators from across California be they ranchers, growers, or regulators, activists, resource managers, and
Hydrology Input for West Souris River IWMP
 Hydrology Input for West Souris River IWMP Prepared by: Mark Lee Manitoba Water Stewardship 1 1 1 Overall view of: drainage area watershed characteristics gauging stations meteorological stations Runoff
SAMTRANS TITLE VI STANDARDS AND POLICIES
 SAMTRANS TITLE VI STANDARDS AND POLICIES Adopted March 13, 2013 Federal Title VI requirements of the Civil Rights Act of 1964 were recently updated by the Federal Transit Administration (FTA) and now require
Staff Report of Oakland Bay Activities 10/1/08 to 12/31/08. 1/15/09 Stephanie Kenny. Funded through Consolidated Contract # C14956
 Staff Report of Oakland Bay Activities 10/1/08 to 12/31/08 1/15/09 Stephanie Kenny Funded through Consolidated Contract # C14956 Citizens looking at some of the displays during the Oakland Bay open house
ES Aircraft Deicing Document Identification Number Date: March 15, ) Activity Description:
 Activity Description:") ES-301-1.06 Aircraft Deicing Document Identification Number ES-301-1.06 Date: March 15, 2018 Document Owner: Keith Pass 1) Activity Description: Aircraft deicing is the application of aircraft deicing
ES-301-1.06 Aircraft Deicing Document Identification Number ES-301-1.06 Date: March 15, 2018 Document Owner: Keith Pass 1) Activity Description: Aircraft deicing is the application of aircraft deicing
Little Venice Water Quality Monitoring 2002 Annual Report
 Florida International University FIU Digital Commons SERC Research Reports Southeast Environmental Research Center 5-7-2003 Little Venice Water Quality Monitoring 2002 Annual Report Ronald Jones Southeast
Geoscape Toronto The Oak Ridges Moraine Activity 2 - Page 1 of 10 Information Bulletin
 About 13,000 years ago as the Laurentide Ice Sheet melted, glacial meltwater accumulated between the ice sheet and the Niagara Escarpment. This formed a lake basin into which gravel and sand were deposited.
Version Isolated & Non-Waters Only 1 of 3
 APPROVED JURISDICTIONAL DETERMINATION FORM U.S. Army Corps of Engineers SECTION I: BACKGROUND INFORMATION A. REPORT COMPLETION DATE FOR APPROVED JURISDICTIONAL DETERMINATION (JD): July 6, 2010. B. DISTRICT
The Casco Bay Estuary Partnership (CBEP, formerly the Casco
 The Casco Bay Estuary Partnership The Casco Bay Estuary Partnership (CBEP, formerly the Casco Bay Estuary Project) is a collaborative effort to preserve and protect the bay s resources. The partners include
E. coli and Coliform Bacteria Levels of Edgewood s Watershed Katie Schneider and Leslie Reed
 E. coli and Coliform Bacteria Levels of Edgewood s Watershed Katie Schneider and Leslie Reed Abstract Bacteria levels throughout the Lake Wingra watershed are a concern to the Lake Wingra community. Local
LAKE HURON BEACH STUDY
 LAKE HURON BEACH STUDY A microbiological water quality evaluation of Grand Bend Beach and related pollution sources in 1985 Ministry of the Environment D.A. McTavish Director Southwestern Region Copyright
Decision Memo for Desolation Trail: Mill D to Desolation Lake Trail Relocation
 for Salt Lake County, Utah Uinta-Wasatch-Cache National Forest Salt Lake Ranger District 1. Background The present location of the Desolation Trail (#1159) between Mill D and Desolation Lake follows old
Hatchery Scientific Review Group Review and Recommendations
 Hatchery Scientific Review Group Review and Recommendations Willamette - Clackamas Spring Chinook Salmon Population and Related Hatchery Programs January 31, 2009 Columbia River Hatchery Reform Project
Daisy Dean Trail 628/619 ATV Trail Construction
 Background and Purpose and Need The Daisy Dean ATV Trail Construction Project is located in the Little Belt Mountains, Musselshell Ranger District, Lewis and Clark National Forest approximately 32 miles
Blue Earth River Basin Fecal Coliform TMDL Study
 Blue Earth River Basin Fecal Coliform TMDL Study What is fecal coliform bacteria? Fecal coliforms are bacteria that live in the digestive tract of warmblood animals (humans, pets, farm animals, and wildlife)
"Transboundary coordination according to the FD Directive in the shared river basins of Greece
 Workshop on Transboundary Issues Budapest March 31st April 1st "Transboundary coordination according to the FD Directive in the shared river basins of Greece Katerina Triantafyllou, ECOS Consulting S.A.
CHAPTER III: TRAIL DESIGN STANDARDS, SPECIFICATIONS & PERMITS
 CHAPTER III Trail Design Standards, Specifications & Permits This chapter discusses trail standards, preferred surface types for different activities, permits, and other requirements one must consider
Evaluation copy. Fecal Coliform. Computer INTRODUCTION
 Fecal Coliform Computer 9 INTRODUCTION The concentration of fecal coliform bacteria in water is measured to determine the likelihood of contamination by microbiological organisms. While fecal coliform
VI. ALTERNATIVES TO THE MASTER PLAN C. RENOVATED EAST BUILDING ALTERNATIVE
 VI. ALTERNATIVES TO THE MASTER PLAN C. RENOVATED EAST BUILDING ALTERNATIVE INTRODUCTION The Renovated East Building Alternative would include the continued use of the renovated West Building and the renovation
Adapting water resource management in coastal areas A case study in Hai Phong, Vietnam
 Adapting water resource management in coastal areas A case study in Hai Phong, Vietnam Thuc Phan, James Smart, Samantha Capon, Wade Hadwen Australian Rivers Institute, Griffith University Presentation
METROBUS SERVICE GUIDELINES
 METROBUS SERVICE GUIDELINES In the late 1990's when stabilization of bus service was accomplished between WMATA and the local jurisdictional bus systems, the need for service planning processes and procedures
Northeast Stoney Trail In Calgary, Alberta
 aci Acoustical Consultants Inc. 5031 210 Street Edmonton, Alberta, Canada T6M 0A8 Phone: (780) 414-6373, Fax: (780) 414-6376 www.aciacoustical.com Environmental Noise Computer Modelling For Northeast Stoney
Case Study: 1. The Clarence River Catchment
 Case Study: 1. The Clarence River Catchment The NSW coastline is a great natural asset, making an enormous contribution to the economy. The resources of coastal catchments such as the Clarence River Catchment,
Bacteria Contamination of Surface Waters Due to Livestock Grazing in the Stanislaus National Forest, California (Second Year of Study)
") Bacteria Contamination of Surface Waters Due to Livestock Grazing in the Stanislaus National Forest, California (Second Year of Study) Lindsey Myers, staff biologist Central Sierra Environmental Resource
Bacteria Contamination of Surface Waters Due to Livestock Grazing in the Stanislaus National Forest, California (Second Year of Study) Lindsey Myers, staff biologist Central Sierra Environmental Resource
TACWA September Meeting CHALLENGES IN MEETING THE TEXAS BACTERIAL LIMITS WITH UV ALONG THE COAST AND BAYS. Gennady Boksiner, P.E. September 30, 2011
 TACWA September Meeting CHALLENGES IN MEETING THE TEXAS BACTERIAL LIMITS WITH UV ALONG THE COAST AND BAYS Gennady Boksiner, P.E. September 30, 2011 Bacterial Groups Intestinal bacteria of humans and other
II. THE BOULDER CREEK DRAINAGE BASIN
 II. THE BOULDER CREEK DRAINAGE BASIN This section provides an overview of the watersheds and flood hazards associated with Boulder Creek and South Boulder Creek including descriptions of the drainage basins,
Chapter 2: El Dorado County Characteristics and Demographics
 Chapter 2: El Dorado County Characteristics and Demographics 2.1 Geographic Area and Demographics El Dorado County comprises 1,805 square miles with over half of the area in the Eldorado National Forest
Flying Cloud Airport (FCM) Zoning Process: Informing a Mn/DOT Path Forward
 Zoning Process: Informing a Mn/DOT Path Forward") : Informing a Mn/DOT Path Forward A Review of the Flying Cloud Airport (FCM) Joint Airport Zoning Board (JAZB) Process and the Draft Airport Zoning Ordinance B A RPZ RPZ A B C Zone Chad E. Leqve Director
: Informing a Mn/DOT Path Forward A Review of the Flying Cloud Airport (FCM) Joint Airport Zoning Board (JAZB) Process and the Draft Airport Zoning Ordinance B A RPZ RPZ A B C Zone Chad E. Leqve Director
Summary table of disaster occurrences, by hazards types, scale, and geographic region
 ANNEX BASIC RANGE OF DISASTER-RELATED STATISTICS TABLES Statistical tables are organised into worksheets according to basic components in the DSRF. The variables represent queries from a disaster-related
SF1363 / HF 1061: Legacy Funding; Conference Agreement
 - Conference 1 Art 1 - Outdoor Heritage Fund 2 3 Prairies 4 WMA, SNA, & Prairie Bank Easement Acq. Phase III 5 Accelerated Prairie Restoration - Phase III 6 MN Buffers for Wildlife & Water 7 Northern Tallgrass
Watershed Runoff Analysis
 CREATING SOLUTIONS FOR A CHANGING WORLD Watershed Runoff Analysis April 18, 2017 John Melack, UCSB Ed Beighley & Dongmei Feng, Northeastern University Study Workflow Civil and Environmental Engineering
Via Only. In reply refer to/attn: Place ID:794813:ERyan
 California Regional Water Quality Control Board, San Diego Region May 5, 2016 Via Email Only Mr. Richard Boon, Chief Orange County Stormwater Program OC Public Works 2301 N. Glassell Street Orange, CA
Water Resources Update after NCGA Long Session
 Water Resources Update after NCGA Long Session North Carolina Beach Inlet & Waterway Association Annual Conference November 16, 2015 Division of Water Resources Overview New Name / Reorganization Jordan
2004 SOUTH DAKOTA MOTEL AND CAMPGROUND OCCUPANCY REPORT and INTERNATIONAL VISITOR SURVEY
 2004 SOUTH DAKOTA MOTEL AND CAMPGROUND OCCUPANCY REPORT and INTERNATIONAL VISITOR SURVEY Prepared By: Center for Tourism Research Black Hills State University Spearfish, South Dakota Commissioned by: South
Feasibility Study Federal Inspection Service Facility at Long Beach Airport
 Feasibility Study Federal Inspection Service Facility at Long Beach Airport 13 December 2016 Long Beach City Council PLEASE NOTE: The information, analysis, assessments and opinions contained in this presentation
DEPARTMENT OF NATURAL RESOURCE PROTECTION TECHNICAL REPORT SERIES TR: 95-02
 DEPARTMENT OF NATURAL RESOURCE PROTECTION TECHNICAL REPORT SERIES TR: 95-02 SUMMARY OF BACTERIOLOGICAL TESTING IN THE LAS OLAS ISLES AUGUST 1994 THROUGH AUGUST 1995 ENVIRONMENTAL MONITORING DIVISION WATER
Figure 1 shows the evaluation area around Tailings Basin Cells 2E/1E. Two areas were evaluated for potential wetland impacts including:
 Barr Engineering Company 4700 West 77th Street Minneapolis, MN 55435-4803 Phone: 952-832-2600 Fax: 952-832-2601 www.barr.com An EEO Employer Minneapolis, MN Hibbing, MN Duluth, MN Ann Arbor, MI Jefferson
International Osoyoos Lake Board of Control Annual Report to the International Joint Commission
 International Osoyoos Lake Board of Control 2015 Annual Report to the International Joint Commission Cover: Northern extent of Osoyoos Lake, where the Okanagan River enters the lake, 2015. View is to the
% farmers/private landowners in watershed applying BMPs. Other (Number of participants completed the training)
") Easygrants ID: 23803 National Fish and Wildlife Foundation NFWF/Legacy Grant Project ID: 0302.10.023803 U. S. Coral Reef Task Force Partnership Initiative 2010 - Submit Final Programmatic Report (Activities
Easygrants ID: 23803 National Fish and Wildlife Foundation NFWF/Legacy Grant Project ID: 0302.10.023803 U. S. Coral Reef Task Force Partnership Initiative 2010 - Submit Final Programmatic Report (Activities
Minnesota Department of Natural Resources
 Minnesota Department of Natural Resources Fisheries Management DRAFT VERSION - PRELIMINARY DATA (AS OF 6/2/2) Lake Name: Yankton Survey Type: Population Assessment DOW Number: 2-7- Survey ID Date: 6/6/2
Conservation of Critical Environmental Resources in Chatham Park
 Conservation of Critical Environmental Resources in Chatham Park Elaine Chiosso, Haw Riverkeeper Haw River Assembly Haw River As Seen From Chatham Park "Spreading southwestward from the banks of the Haw
Rainfall Appendix. Summary Statistics of Rainfall Data for Sites in the West-Central Florida. A Simple Conceptualized Rainfall/Discharge Relationship
 Rainfall Appendix Summary Statistics of Rainfall Data for Sites in the West-Central Florida A Simple Conceptualized Rainfall/Discharge Relationship Stream or river flows are, of course, integrally associated
SPLASH PAD EVALUATION SUMMARY REPORT January 2016
 Public Utility District No. 1 of Chelan County Public Power Benefit Recreation and Parks Phase: Pre-feasibility For full report, refer to Appendix A SPLASH PAD EVALUATION SUMMARY REPORT January 2016 Photo