Land-Use and Water Quality Across the Cape Fear River Basin, NC: from 2001 to Jennifer Braswell Alford, PhD
|
|
|
- Willis Fowler
- 5 years ago
- Views:
Transcription

1 Land-Use and Water Quality Across the Cape Fear River Basin, NC: Exploring Spatial and Temporal Relationships from 2001 to 2006 Jennifer Braswell Alford, PhD
2 Introduction There are over 3.6 million miles of rivers and streams in the United States each exhibiting unique characteristics that are physically, biologically and chemically influenced by the diverse landscapes they traverse (EPA, 2010). Over the past several decades point source and non point Over the past several decades, point source and non-point source pollution (NPSP) inputs to rivers systems have increasingly impaired surface water quality in local and regional watersheds (Carpenter et al., 1998; Mallin et al., 2009; Brabec, 2009).
3 Study Area The Cape Fear River B i Basin
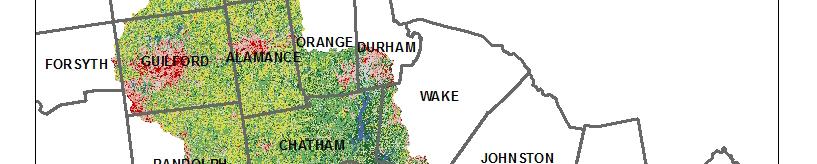
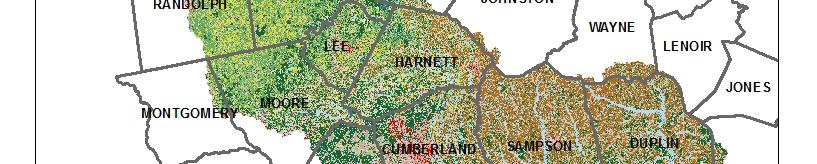
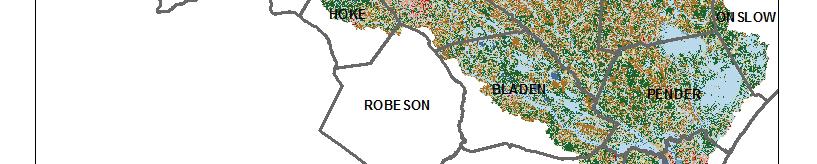


4


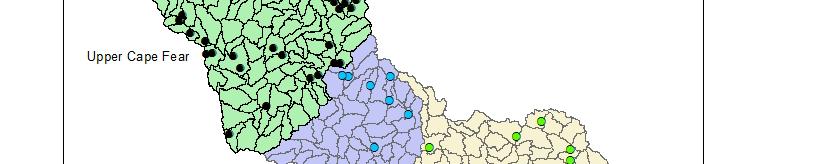
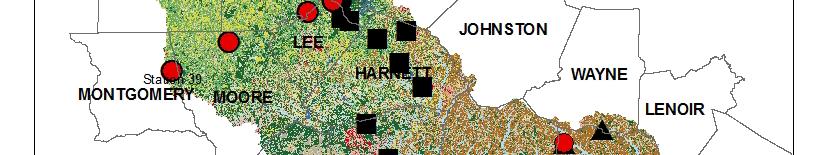
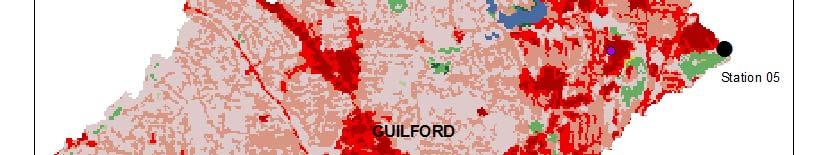
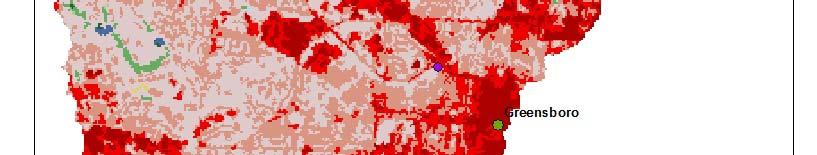
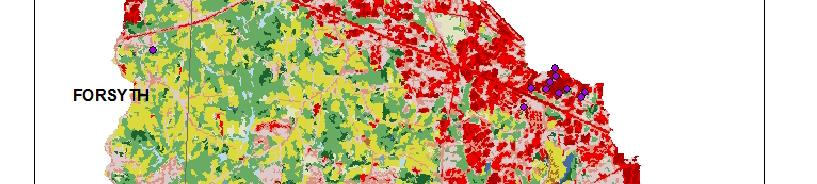
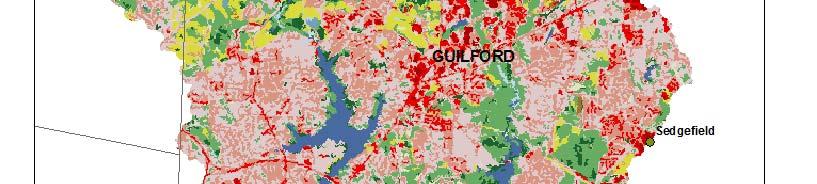
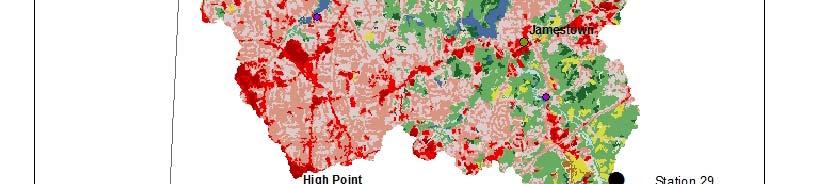
5 Methods: Water Quality Analysis The Upper Cape Fear River Basin Assembly Water Quality Monitoring Stations Source: NC DENR Division of Water Quality (2011)


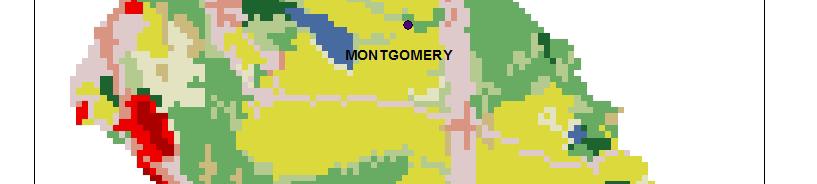
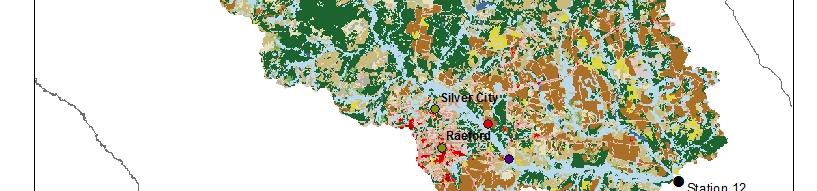
6 Methods: Water Quality Analysis The Middle Cape Fear River Basin Assembly Water Quality Monitoring Stations Source: NC DENR Division of Water Quality (2011)


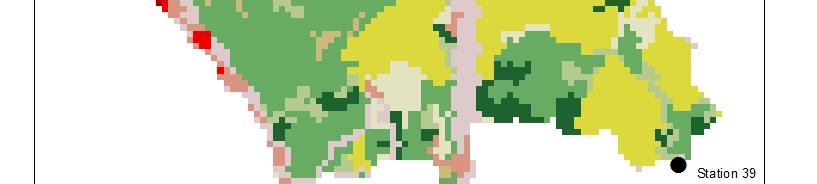
7 Methods: Water Quality Analysis The Lower Cape Fear River Basin Assembly Water Quality Monitoring Stations Source: NC DENR Division of Water Quality (2011)
8 Methods and Data Sources Dependent Variables Annual Average Dissolved Oxygen Independent Variables Percent Land-Use/Land-Cover Type (km2) Annual Average and Annual Geometric Mean Fecal coliform Number of Permitted Livestock Head by Permit Annual laverage Ammonium Total Precipitation i i Nitrogen (NH3-N) Annual Average Nitrate-Nitrite Nitrite Nitrogen (NO2-NO3) Type of Physiographic Region Annual Average Phosphorus (P)


9 Caveats 30 meter resolution No flow data Imagery dates Nested watersheds Monitoring data
10 Hypotheses Increases in forested land-use types will support better water quality when compared to increases in urban or agricultural land-use types. Water quality will begin to exhibit a noticeable change as Water quality will begin to exhibit a noticeable change as development activities increase across the river basin and at the physiographic region scale.
11 Hypotheses Less-urbanized areas will exhibit poorer water quality when compared to highly urbanized areas. Monitoring stations draining landscape that contain CAFOs will exhibit poorer water quality when compared to those draining traditional agricultural practices.
12 Findings: River Basin Scale Water Quality Parameters Minimum Maximum Mean Standard Deviation Number of Stations with Annual Averages Exceeding State/EPA Standards Water Quality Parameters Minimum Maximum Mean Standard Deviation Number of Stations with Annual Averages Exceeding State/EPA Standards Fecal coliform (col/100ml) DO 18 3, Fecal coliform (col/100ml) DO 24 1, NO2-NO NO2-NO NH3-N P NH3-N P n = 72


13 Findings: Changes in Land-Use-Types 1.50% 1.00% 0.50% 0.00% Agriculture Developed Forested Wetlands CFRB UCFRB MCFRB LCFRB -0.50% -1.00% -1.50%
14
15
16 Findings: Upper CFRB Water Quality Parameters Fecal coliform (col/100ml) Minimum Maximum Mean Standard Deviation Number of Stations with Annual Averages Exceeding State/EPA Standards 85 3, Water Quality Parameters Fecal coliform (col/100ml) Minimum Maximum Mean Standard Deviation Number of Stations with Annual Averages Exceeding State/EPA Standards 42 1, DO NO2-NO DO NO2-NO NH3-N N P NH3-N N P n = 31


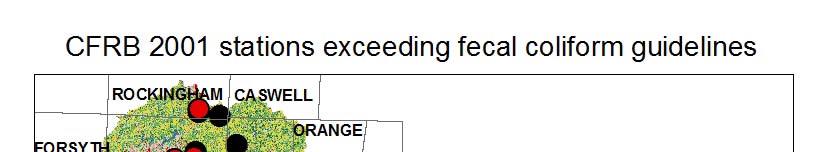
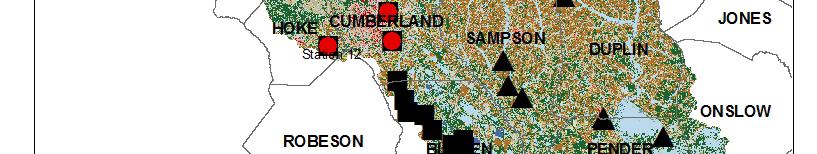
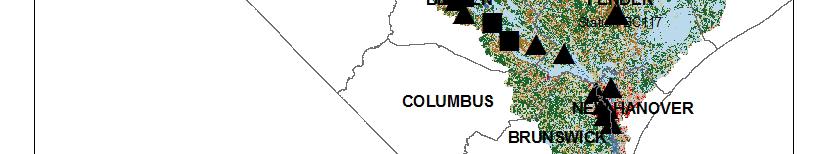
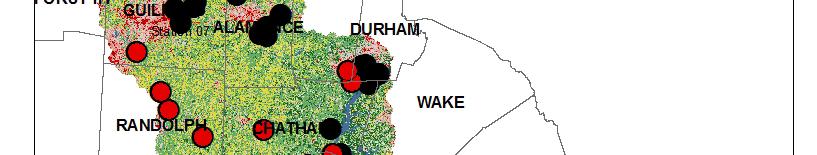
17 Findings: UCFRB Water Quality FC_200l col/100ml 1500 FC_2006 col/100ml UCFRB_01 UCFRB_02 UCFRB_03 UCFRB_05 UCFRB_06 UCFRB_07 UCFRB_08 UCFRB_09 UCFRB_11 UCFRB_12 UCFRB_13 UCFRB_14 UCFRB_15 UCFRB_18 UCFRB_19 UCFRB_20 UCFRB_21 UCFRB_22 UCFRB_23 UCFRB_24 UCFRB_25 UCFRB_26 UCFRB_27 UCFRB_29 UCFRB_33 UCFRB_35 UCFRB_37 UCFRB_38 UCFRB_39 UCFRB_42 UCFRB_44 Figure 16. Changes in Fecal coliform from 2001 to 2006 for stations located in the Upper CFRB

18


19 UCFRB: Fecal coliform
20 Findings: Middle CFRB Water Quality Parameters Fecal coliform (col/100ml) Minimum Maximum Mean Standard Deviation Number of Stations with Annual Averages Exceeding State/EPA Standards 18 2, Water Quality Parameters Minimum Maximum Mean Standard Deviation Number of Stations with Annual Averages Exceeding State/EPA Standards Fecal coliform (col/100ml) DO DO NO2-NO NO2-NO NH3-N NH3-N P P n = 21

21 MCFRB: Fecal coliform FC_200l col/100ml FC_2006 col/100ml Figure 24. Changes in Fecal coliform from 2001 to 2006 for stations located in the Middle CFRB


22 Results: MCFRB Fecal coliform
23 Findings: Lower CFRB Wt Water Minimumi Maximum Mean Standard d Number of Wt Water Minimumi Maximum Mean Standard d Number of fstations ti Quality Deviation Quality Deviation Parameters Parameters Fecal coliform (col/100ml) Stations with Annual Averages Exceeding State/EPA Standards Fecal coliform (col/100ml) with Annual Averages Exceeding State/EPA Standards 41 1, DO DO NO2-NO NO2-NO NH3-N NH3-N P P n = 20


24 LCFRB: Fecal coliform FC_200l col/100ml FC_2006 col/100ml Figure 31. Changes Fecal coliform from 2001 to 2006 for stations located in the Lower CFRB


25 LCFRB: Fecal coliform
26 Fecal coliform 2001 Model Independent Model p-value Unstandardized Exponent Percent Variables r 2 b Coefficient Value Change 4 Constant UCFRB Region % % Exurban Development % % Mixed Forest % Total Precipitation % The final regression model for Fecal coliform in 2001 can be formally expressed as follows: Log FC (2001) = UCFRB DOS MF 0.07 PT Where, FC = Fecal coliform col per 100ml UCFRB = Upper Cape Fear River Basin DOS = Percent Exurban Development MF = Percent Mixed Forest PT = Precipitation, Total
27 Fecal coliform 2006 Model Independent Model p-value Unstandardized Exponent Percent Variables r 2 b Coefficient Value Change 6 Constant % Mixed Forest % % Exurban Development % % Scrub/Shrub Land % UCFRB Region % The final regression model for Fecal coliform in 2006 can be formally expressed as follows: Log FC (2006) = MF DOS SS UCFRB Where, FC = Fecal coliform col per 100ml MF = Percent Mixed Forest DOS = Percent Exurban Development SS= Percent Shrub/Scrub Land UCFRB = Upper Cape Fear River Basin Region
28 Dissolved Oxygen 2001 Model Independent Model p-value Unstandardized Exponent Percent Variables r 2 b Coefficient i Vl Value Change 2 Constant MCFRB Region % % Emergent % Herbaceous Wetlands The final regression model for Dissolved Oxygen in 2001 can be formally expressed as follows: Where, Log DO (2001) = MCFRB 0.07 EHW MCFRB = Middle Cape Fear River Basin EHW = Percent Emergent Herbaceous Wetlands
29 Dissolved Oxygen 2006 Model Independent Model p-value Unstandardized b Exponent Percent Variables r 2 Coefficient Value Change 3 Constant LCFRB Region % Number of Permitted Livestock % (Headcount) % Emergent Herbaceous % Wetlands The final regression model for dissolved oxygen in 2006 can be formally expressed as follows: Log DO (2006) = LCFRB 0.12 HC 0.07 EHW Where, LCFRB = Lower Cape Fear River Basin HC = Number of Permitted Livestock (Headcount) EHW = Percent Emergent Herbaceous Wetlands
30 Nutrients The regression models for Nitrate-Nitrite Nitrogen, Ammonium Nitrogen and Phosphorus all generated R-squares less than 17%.
31 Conclusions Although there were only small changes in land-use types from 2001 to 2006, specific land-use types were still statistically linked to water quality impairment at the river basin scale. Stations that exceeded the state standard for fecal in 2001 Stations that exceeded the state standard for fecal in 2001 were largely concentrated in the UCFRB, while in 2006, they were more spatially distributed throughout the river basin.
32 Conclusions Percent mixed forest was the most significant land-use type that was predicted to increase fecal concentrations in both 2001 and Transitional land-use types including exurban development and mixed forest appear to play a critical role in shaping the geography g of water quality across the CFRB.
33 Conclusions Research could be conducted that spatially illustrates how climatic conditions and the proximity of specific land-use types impact water quality as well as the effectiveness of vegetated buffer zones bordering surface water systems. More data is needed to address the extent to which specific activities (e.g. spraying fecal on fields, development, and fertilizer applications) are impacting surface water resources throughout the river basin. Flow data is essential in understanding the extent to which climatic conditions, human activities, and specific land-use types impact water quality throughout h t the basin.
34 Conclusions If decision makers at the local and regional scales are aware of basin wide trends in both land-use changes and water quality, they could then develop more comprehensive policies that benefit the river basin as a whole. Taking into consideration how economic, social, and cultural activities influence water quality will lead to a more well-rounded approach to protecting water resources that can be sustained for future generations to come.
35 Acknowledgements Dr. Keith Debbage Dr, Zhi-Jun Liu Dr. Roy Si Stine Dr. Michael Mallin NC DENR Staff and countless others..thank You!
36 Thank You Jennifer Braswell Alford, PhD
Little Venice Water Quality Monitoring 2002 Annual Report
 Florida International University FIU Digital Commons SERC Research Reports Southeast Environmental Research Center 5-7-2003 Little Venice Water Quality Monitoring 2002 Annual Report Ronald Jones Southeast
Statistical Evaluation of BMP Effectiveness in Reducing Fecal Coliform Impairment in Mermentau River Basin
 Statistical Evaluation of BMP Effectiveness in Reducing Fecal Coliform Impairment in Mermentau River Basin Z.-Q. Deng 1 and H. Chowdhary 2 1 Assistant Professor, Department of Civil and Environmental Engineering,
RE: PATAHA CREEK FECAL COLIFORM COMPLIANCE WITH WATER QUALITY STANDARDS
 To: WRIA 35 Planning Committee Memo From: Jory Oppenheimer and Kari Vigerstol Project: WRIA 35 Level II Water Quality CC: Ben Floyd, HDR/EES; John Koreny, HDR/EES Date: March 10, 2005 Job No: 22592 RE:
ASSESSMENT OF FECAL COLIFORM IN LITTLE RABBIT CREEK AND LITTLE SURVIVAL CREEK
 ASSESSMENT OF FECAL COLIFORM IN LITTLE RABBIT CREEK AND LITTLE SURVIVAL CREEK FINAL REPORT Prepared for: Alaska Department of Environmental Conservation 555 Cordova Street Anchorage, Alaska 99501 Prepared
Figure 1. Overview map of Burrard Inlet, showing location of False Creek inlet.
 Figure 1. Overview map of Burrard Inlet, showing location of False Creek inlet. 65 Figure 2. Location map of False Creek and shoreline and mid-channel monitoring sites. 66 Figure 3. Location of CSO's,
FECAL COLIFORM MONITORING IN GRAYS HARBOR COUNTY: SUMMARY REPORT OF MONITORING RESULTS FOR
 Chehalis Basin Partnership Fecal Coliform Monitoring in Grays Harbor County: Summary Report of Monitoring Results for 2000-2003 Draft June 30, 2003 Prepared by Tetra Tech/KCM, Inc. 1917 First Avenue, Seattle,
Portland Water District Sebago Lake Monitoring Programs Lower Bay Bacteria Monitoring Presenting data from 1977 to 2018 Laurel Jackson
 Portland Water District Sebago Lake Monitoring Programs Lower Bay Bacteria Monitoring Presenting data from 1977 to 2018 Laurel Jackson Introduction Sebago Lake is the primary drinking water supply for
Seasonal changes in macroinvertebrate communities in agricultural catchments: natural variation or anthropogenic impact? Stephen Davis (UCD/Teagasc)
") Seasonal changes in macroinvertebrate communities in agricultural catchments: natural variation or anthropogenic impact? Stephen Davis (UCD/Teagasc) Mary Kelly-Quinn (UCD), Edel Hannigan (UCD), Mairead
Seasonal changes in macroinvertebrate communities in agricultural catchments: natural variation or anthropogenic impact? Stephen Davis (UCD/Teagasc) Mary Kelly-Quinn (UCD), Edel Hannigan (UCD), Mairead
Water Quality Trends for Patchogue Bay
 Water Quality Trends for Patchogue Bay 2018 This report summarizes water quality data for fecal coliform and total coliform in Patchogue Bay for the years 2003-2017. Prepared by: Brian M. McCaffrey Stormwater
Water Quality Trends for Conscience Bay
 Water Quality Trends for Conscience Bay 2018 This report summarizes water quality data for fecal coliform and total coliform in Conscience Bay for the years 1998-2018. Prepared by: Brian M. McCaffrey Stormwater
Fecal Coliform Bacteria Monitoring for the Sleepy Creek Watershed Incremental 319 Project Final Report
 Fecal Coliform Bacteria Monitoring for the Sleepy Creek Watershed Incremental 319 Project Final Report Prepared for: West Virginia Conservation Agency Prepared by: Cacapon Institute Back Creek Road PO
Comparative Analysis of Modeling Techniques for Coliform Organisms in Streams
 APPLIED MICROBIOLOGY, Feb. 1974, p. 340-345 Copyright 0 1974 American Society for Microbiology Vol. 27, No. 2 Printed in U.S.A. Comparative Analysis of Modeling Techniques for Coliform Organisms in Streams
Estuaries of South America
 Gerardo M.E. Perillo Maria Cintia Piccolo Mario Pino-Quivira (Eds.) Estuaries of South America Their Geomorphology and Dynamics With 102 Figures and 20 Tables Springer 1 What Do We Know About the Geomorphology
South Florida Coastal Water Quality Monitoring Network 4 6/06 Quarterly Report (C-15397)
") Florida International University FIU Digital Commons SERC Research Reports Southeast Environmental Research Center 9-23-26 South Florida Coastal Water Quality Monitoring Network 4 6/6 Quarterly Report
Florida International University FIU Digital Commons SERC Research Reports Southeast Environmental Research Center 9-23-26 South Florida Coastal Water Quality Monitoring Network 4 6/6 Quarterly Report
Fourth Creek (Subbasin ) Yadkin-Pee Dee River Basin North Carolina
 Yadkin-Pee Dee River Basin North Carolina") Final Total Maximum Daily Load (TMDL) for Fecal Coliform October 2001 Fourth Creek (Subbasin 03-07-06) Yadkin-Pee Dee River Basin North Carolina Prepared by: NC Department of Environment and Natural Resources
Final Total Maximum Daily Load (TMDL) for Fecal Coliform October 2001 Fourth Creek (Subbasin 03-07-06) Yadkin-Pee Dee River Basin North Carolina Prepared by: NC Department of Environment and Natural Resources
ANALYSIS OF INADEAUTE WATER QUALITY OD THE RESERVOIR VONARJE/SUTLA LAKE AND POSSIBILITY OF RESTORATION AND UTILIZATION
 EC project on Integration of Natural Water Retention Measures in river basin management The 1 st Danube Region Workshop ANALYSIS OF INADEAUTE WATER QUALITY OD THE RESERVOIR VONARJE/SUTLA LAKE AND POSSIBILITY
Water quality monitoring and analysis of fecal coliform of Canadarago Lake tributaries and outlet
 Water quality monitoring and analysis of fecal coliform of Canadarago Lake tributaries and outlet Tara Perry 1 and Marina Brown 2 INTRODUCTION Canadarago Lake, in Richfield Springs, NY, has four main tributaries
Analysis of Indicator Bacteria in NJ Dead-end Lagoons. Michael Callaghan Gasbarro Mentor: Dr. Kathryn Goddard
 Analysis of Indicator Bacteria in NJ Dead-end Lagoons Michael Callaghan Gasbarro Mentor: Dr. Kathryn Goddard Delaware Valley Estuary Summit Session 20: January 28, 2015 Dead-end Canals or Lagoons Popular
Long Pond Study
 Bridgewater State University Virtual Commons - Bridgewater State University Watershed Access Lab Projects Watershed Access Lab 2001 Long Pond Study 2000-2001 Recommended Citation Apponequet Regional High
MANAGING FRESHWATER INFLOWS TO ESTUARIES
 MANAGING FRESHWATER INFLOWS TO ESTUARIES Yuna River Hydrologic Characterization A. Warner Warner, A. (2005). Yuna River Hydrologic Characterization. University Park, Pennsylvania: The Nature Conservancy.
CITY OF LYNDEN STORMWATER MANAGEMENT PROGRAM REPORT MARCH 1, 2016
 CITY OF LYNDEN STORMWATER MANAGEMENT PROGRAM 2015 WATER QUALITY MONITORING REPORT CITY OF LYNDEN 300 4 TH STREET LYNDEN, WASHINGTON 98264 PHONE (360) 354-3446 MARCH 1, 2016 This document serves as an attachment
Exploring Drivers of Fecal Coliform Pollution Trends in the Puget Sound. Washington Commercial Shellfish
 9/22/2016 Exploring Drivers of Fecal Coliform Pollution Trends in the Puget Sound Authors: Lindsey Hamilton, Scott Berbells, Lawrence Sullivan, Jean Snyder Washington State Department of Health Washington
FINAL Water Year 2012 Bacteria Sampling Report for the Klamath River Estuary
 FINAL Water Year 2012 Bacteria Sampling Report for the Klamath River Estuary Prepared by: Patrick Fox Yurok Tribe Environmental Program April 2013 Acknowledgements The Yurok Tribe Environmental Program
FLORIDA DEPARTMENT OF ENVIRONMENTAL PROTECTION. Division of Environmental Assessment and Restoration, Bureau of Watershed Restoration
 FLORIDA DEPARTMENT OF ENVIRONMENTAL PROTECTION Division of Environmental Assessment and Restoration, Bureau of Watershed Restoration NORTHWEST DISTRICT PENSACOLA BAY BASIN FINAL TMDL Report Fecal Coliform
Map 1.1 Wenatchee Watershed Land Ownership
 Map 1.1 Wenatchee Watershed Land Ownership Map 1.1 Wenatchee Watershed Land Ownership The Wenatchee watershed lies in the heart of Washington state in Chelan County. Just larger than the state of Rhode
Rainfall Appendix. Summary Statistics of Rainfall Data for Sites in the West-Central Florida. A Simple Conceptualized Rainfall/Discharge Relationship
 Rainfall Appendix Summary Statistics of Rainfall Data for Sites in the West-Central Florida A Simple Conceptualized Rainfall/Discharge Relationship Stream or river flows are, of course, integrally associated
Appendix E. Pollutant Load Maps of SWAT Model Results
 . Pollutant Load Maps of SWAT Model Results Figures Figure E-1. SWAT model results for total phosphorus (TP) loads by WAU.... E-3 Figure E-2. SWAT model results for TP loads derived from cultivate crops
Meeting Agenda. Why are we here? Getting Started. Designated Uses. Water Quality Standards
 Upper Basin Total Maximum Daily Load Study and Rapidan Technical Advisory Committee Meetings July 27, Meeting Agenda Water Quality Assessments and TMDL Process Bryant Thomas, VA DEQ Overview of 16 TMDL
Assessment of Pathogen Strategies
 Assessment of Pathogen Strategies Bacteria levels in receiving waters are a primary concern for federal, state, and local agencies. The primary sources of bacteria are generally attributed to combined
Aquatic insect surveys at Mount Magazine State Park and Hobbs State Park Conservation Area with implementation of an educational component
 Aquatic insect surveys at Mount Magazine State Park and Hobbs State Park Conservation Area with implementation of an educational component Arkansas is home to a relatively large number of endemic invertebrates
Observation of cryosphere
 Observation of cryosphere By Sagar Ratna Bajracharya (email: sagar.bajracharya@icimod.org) Samjwal Ratna Bajracharya Arun Bhakta Shrestha International Centre for Integrated Mountain Development Kathmandu,
Conservation of Critical Environmental Resources in Chatham Park
 Conservation of Critical Environmental Resources in Chatham Park Elaine Chiosso, Haw Riverkeeper Haw River Assembly Haw River As Seen From Chatham Park "Spreading southwestward from the banks of the Haw
Finding sources of fecal coliform bacteria in stormwater runoff
 Finding sources of fecal coliform bacteria in stormwater runoff David Tomasko, Ph.D. May 12, 2016 Why the concern over bacteria? Cholera Tens of millions killed over the centuries > 100,000 Americans 11
Water quality assessment of Gilgit river, using fecal and total coliform as indicators
 Journal of Biodiversity and Environmental Sciences (JBES) ISSN: 2220-6663 (Print) 2222-3045 (Online) Vol. 5, No. 4, p. 343-347, 2014 http://www.innspub.net RESEARCH PAPER OPEN ACCESS Water quality assessment
OREGON Environmental Laboratory Accreditation Program ORELAP Fields of Accreditation BSK Associates Vancouver
 MATRIX Reference Code Analyte Code Description Drinking EPA 300.0 2.1 10053200 Methods for the Determination of Inorganic Substances in Environmental Samples 1575 Chloride 1730 Fluoride 1810 Nitrate as
Linking soils, hydrology, forest structure & productivity in. Michael S. Ross and Jay P. Sah. Everglades tree islands
 Linking soils, hydrology, forest structure & productivity in g Michael S. Ross and Jay P. Sah Everglades tree islands Tree Island restoration Stti Setting the objective Achieving the objective Extent Condition
North Carolina Addendum Total Maximum Daily Load (TMDL) for Impaired Segments in the Dan River Watershed to Virginia TMDLs Approved by EPA Region 3
 for Impaired Segments in the Dan River Watershed to Virginia TMDLs Approved by EPA Region 3") North Carolina Addendum Total Maximum Daily Load (TMDL) for Impaired Segments in the Dan River Watershed to Virginia TMDLs Approved by EPA Region 3 Assessment units (AU) for the Dan River, 22-(39)b and
North Carolina Addendum Total Maximum Daily Load (TMDL) for Impaired Segments in the Dan River Watershed to Virginia TMDLs Approved by EPA Region 3 Assessment units (AU) for the Dan River, 22-(39)b and
Glacial lakes as sentinels of climate change in Central Himalaya, Nepal
 Glacial lakes as sentinels of climate change in Central Himalaya, Nepal Sudeep Thakuri 1,2,3, Franco Salerno 1,3, Claudio Smiraglia 2,3, Carlo D Agata 2,3, Gaetano Viviano 1,3, Emanuela C. Manfredi 1,3,
Coverage of Mangrove Ecosystem along Three Coastal Zones of Puerto Rico using IKONOS Sensor
 Coverage of Mangrove Ecosystem along Three Coastal Zones of Puerto Rico using IKONOS Sensor Jennifer Toledo Rivera Geology Department, University of Puerto Rico, Mayagüez Campus P.O. Box 9017 Mayagüez,
Clean Ocean Access Water Quality Monitoring Summary Report
 Clean Ocean Access 2008-2017 Water Quality Monitoring Summary Report CONTRIBUTING AUTHORS: Eva Touhey, Program Manager, Clean Ocean Access Jessica Frascotti, Program Coordinator, Clean Ocean Access Dave
Airspace Complexity Measurement: An Air Traffic Control Simulation Analysis
 Airspace Complexity Measurement: An Air Traffic Control Simulation Analysis Parimal Kopardekar NASA Ames Research Center Albert Schwartz, Sherri Magyarits, and Jessica Rhodes FAA William J. Hughes Technical
Fecal and Total Coliform TMDL for Sparkman Branch (WBID 1561)
") FINAL FLORIDA DEPARTMENT OF ENVIRONMENTAL PROTECTION Division of Water Resource Management, Bureau of Watershed Management Southwest DISTRICT Tampa Bay BASIN TMDL Report Fecal and Total Coliform TMDL for
FINAL FLORIDA DEPARTMENT OF ENVIRONMENTAL PROTECTION Division of Water Resource Management, Bureau of Watershed Management Southwest DISTRICT Tampa Bay BASIN TMDL Report Fecal and Total Coliform TMDL for
LAKE HURON BEACH STUDY
 LAKE HURON BEACH STUDY A microbiological water quality evaluation of Grand Bend Beach and related pollution sources in 1985 Ministry of the Environment D.A. McTavish Director Southwestern Region Copyright
Pathogens and Grazing Livestock
 Pathogens and Grazing Livestock Steve Ensley DVM, PhD 10/16/09 Water Borne Pathogens This presentation will have a specific emphasis on water borne pathogens. NUMBERS OF IOWA WATER SOURCES WITH Stream/River
FECAL COLIFORM BACTERIA SUMMARY SHEET
 FECAL COLIFORM BACTERIA SUMMARY SHEET WATERBODY: Greybull River (Tributary to Big Horn River) (WYBH10080009) REACH DESCRIPTION: Confluence wi e Big Horn River upstream to Meeteetse, Wyoming. BACKGROUND:
Revealed Preference Methods
 Revealed Preference Methods New Bedford New Bedford Harbor is a major commercial fishing port and industrial center in southeastern Massachusetts on Buzzards Bay. From the 1940s to the 1970s, electrical
International Conference on Economic Management and Trade Cooperation (EMTC 2014)
") International Conference on Economic Management and Trade Cooperation (EMTC 2014) A Study on the Changing Trends of Domestic Tourism Consumption Composition of Urban Residents Grouped by Travel Purpose
International Conference on Economic Management and Trade Cooperation (EMTC 2014) A Study on the Changing Trends of Domestic Tourism Consumption Composition of Urban Residents Grouped by Travel Purpose
The Difference of Agricultural Land Use in Watersheds and Long Term Fluctuation on the River Water Quality
 Research article erd The Difference of Agricultural Land Use in Watersheds and Long Term Fluctuation on the River Water Quality YURI YAMAZAKI Obihiro University of Agriculture and Veterinary Medicine,
Section 2 North Slope Ecoregions and Climate Scenarios
 Section 2 North Slope Ecoregions and Climate Scenarios North Slope Ecoregions The geographic/ecological scope of the workshop will be freshwater and terrestrial systems of the North Slope of Alaska, with
Tufts University Water: Systems, Science, and Society (WSSS) Program
 Program") To: From: John Foster, Elbow Cay, the Bahamas; Friends of the Environment, Marsh Harbor, the Bahamas Alex Bedig, Amanda Garfield, Shonda Gaylord, Jack Melcher, Melissa Ng, Nathan Rawding, Kendall Webster,
To: From: John Foster, Elbow Cay, the Bahamas; Friends of the Environment, Marsh Harbor, the Bahamas Alex Bedig, Amanda Garfield, Shonda Gaylord, Jack Melcher, Melissa Ng, Nathan Rawding, Kendall Webster,
Terms of Reference (ToR) for a Short-Term assignment
 for a Short-Term assignment") Terms of Reference (ToR) for a Short-Term assignment Technical assistance requested Expert for climate change mitigation and adaptation Project Title Outline of the Climate Adaptation Strategy and basin-wide
Terms of Reference (ToR) for a Short-Term assignment Technical assistance requested Expert for climate change mitigation and adaptation Project Title Outline of the Climate Adaptation Strategy and basin-wide
Watershed: Natural Scene for Integrated Water Resource Management in the jurisdiction of Corantioquia Antioquia, Colombia. SA
 Watershed: Natural Scene for Integrated Water Resource Management in the jurisdiction of Corantioquia Antioquia, Colombia. SA EURO-RIOC 2010 Luis Alfonso Escobar Trujillo RELOC - Colombia Corantioquia
Workshop on Advances in Public Transport Control and Operations, Stockholm, June 2017
 ADAPT-IT Analysis and Development of Attractive Public Transport through Information Technology Real-time Holding Control Strategies for Single and Multiple Public Transport Lines G. Laskaris, PhD Candidate,
Robson Valley Avalanche Tract Mapping Project
 Robson Valley Avalanche Tract Mapping Project Prepared for: Chris Ritchie Ministry of Water Land and Air Protection 325 1011 4th Avenue Prince George, BC. V2L3H9 and Dale Seip Ministry of Forests 1011
Fifth International Scientific Agricultural Symposium Agrosym 2014
 Professional paper 10.7251/AGSY14041056M PREDICTIONS OF TOMATO PRODUCTION CHARACTERISTICS IN SERBIA Gora MILJANOVIC 1*, Beba MUTAVDZIC 2, Nebojsa NOVKOVIC 2, Miljojko JANOSEVIC 3 1 High Medical Scholl,
City of Peoria Clean Water Efforts. Governor s s Conference on the Management of the Illinois River October 4, 2007
 City of Peoria Clean Water Efforts Governor s s Conference on the Management of the Illinois River October 4, 2007 1 What do you call dinner and a movie with an unemployed guy? An unfunded man-date! 2
Total Coliform and Fecal Coliform TMDL for Lower Sweetwater Creek (WBID 1570A)
") FINAL FLORIDA DEPARTMENT OF ENVIRONMENTAL PROTECTION Division of Water Resource Management, Bureau of Watershed Management SOUTHWEST DISTRICT TAMPA BAY BASIN TMDL Report Total Coliform and Fecal Coliform
FINAL FLORIDA DEPARTMENT OF ENVIRONMENTAL PROTECTION Division of Water Resource Management, Bureau of Watershed Management SOUTHWEST DISTRICT TAMPA BAY BASIN TMDL Report Total Coliform and Fecal Coliform
Comparison of Gelman and Millipore Membrane Filters for Enumerating Fecal Coliform Bacteria
 APPLIED MICROBIOLOGY, Sept. 1973, p. 332-336 Copyright 0 1973 American Society for Microbiology Vol. 26, No. 3 Printed in U.S.A. Comparison of Gelman and Millipore Membrane Filters for Enumerating Fecal
The Economic Benefits of Agritourism in Missouri Farms
 The Economic Benefits of Agritourism in Missouri Farms Presented to: Missouri Department of Agriculture Prepared by: Carla Barbieri, Ph.D. Christine Tew, M.S. September 2010 University of Missouri Department
Bacteria Contamination of Surface Waters Due to Livestock Grazing in the Stanislaus National Forest, California (Second Year of Study)
") Bacteria Contamination of Surface Waters Due to Livestock Grazing in the Stanislaus National Forest, California (Second Year of Study) Lindsey Myers, staff biologist Central Sierra Environmental Resource
Bacteria Contamination of Surface Waters Due to Livestock Grazing in the Stanislaus National Forest, California (Second Year of Study) Lindsey Myers, staff biologist Central Sierra Environmental Resource
Watershed Report Blue Mountain Lake-Petit Jean River
 Watershed Report Blue Mountain Lake-Petit Jean River 1111020402 The Center for Advanced Spatial Technologies at the University of Arkansas has developed the Arkansas Automated Reporting and Mapping System
Hydrology Input for West Souris River IWMP
 Hydrology Input for West Souris River IWMP Prepared by: Mark Lee Manitoba Water Stewardship 1 1 1 Overall view of: drainage area watershed characteristics gauging stations meteorological stations Runoff
Statistical Evaluation of Seasonal Effects to Income, Sales and Work- Ocupation of Farmers, the Apples Case in Prizren and Korça Regions
 Abstract Statistical Evaluation of Seasonal Effects to Income, Sales and Work- Ocupation of Farmers, the Apples Case in Prizren and Korça Regions PhD. Eriona Deda Faculty of Economics and Agribusiness,
The Geography of Climate
 The Geography of Climate Objective for Today: Today we will examine ways that latitude and landforms influence climate The focus of our study will be the South American Continent in the Formal Region known
WIFSS research on E. coli O157:H7 in central coastal California. Rob Atwill, D.V.M., Ph.D. University of California-Davis
 WIFSS research on E. coli O157:H7 in central coastal California Rob Atwill, D.V.M., Ph.D. University of California-Davis To all cooperators: ranchers, growers, regulators, environmentalists, resource managers,
Nutrient and Sediment Loss from the Watersheds of Canandaigua Lake
 The College at Brockport: State University of New York Digital Commons @Brockport Technical Reports Studies on Water Resources of New York State and the Great Lakes 4-2000 Nutrient and Sediment Loss from
Fecal Coliform TMDL for Saint Joes Creek, WBID 1668A
 FLORIDA DEPARTMENT OF ENVIRONMENTAL PROTECTION Division of Water Resource Management, Bureau of Watershed Management SOUTHWEST DISTRICT SPRINGS COAST BASIN ANCLOTE RIVER/COASTAL PINELLAS COUNTY PLANNING
"ST. KLIMENT OHRIDSKI FACULTY OF GEOLOGY AND GEOGRAPHY
 SOFIA UNIVERSITY "ST. KLIMENT OHRIDSKI FACULTY OF GEOLOGY AND GEOGRAPHY APPLICATION OF THE MODEL "DRIVING FORCES PRESSURE STATE - RESPONSE FOR ASSESSMENT OF FLOOD RISK RADOSTINA BORISOVA DOCHEVA Bachelor
Paul Sturm Roberto Viqueira Ríos
 Paul Sturm Roberto Viqueira Ríos In this talk Brief Background on Land Based Sources Historical Perspective Guánica watershed characteristics/ issues High priority restoration projects Other key issues
Department of Agricultural and Resource Economics, Fort Collins, CO
 May 2016 EDR 16-01 Department of Agricultural and Resource Economics, Fort Collins, CO 80523-1172 http://dare.colostate.edu/pubs MAPPING THE WESTERN U.S. AGRITOURISM INDUSTRY: HOW DO TRAVEL PATTERNS VARY
Outline. The main objectives. The main objectives. Distribution of stable isotopes in the Sava River in Serbia
 Distribution of stable isotopes in the Sava River in Serbia N. MILJEVIĆ 1, D. GOLOBOČANIN 1, M. NADEŽDI DIĆ, N. OGRINC 3 1 Vinča a Institute of Nuclear Sciences, POB 5, 11001 Belgrade, Serbia Republic
Agritourism in Missouri: A Profile of Farms by Visitor Numbers
 Agritourism in Missouri: A Profile of Farms by Visitor Numbers Presented to: Sarah Gehring Missouri Department of Agriculture Prepared by: Carla Barbieri, Ph.D. Christine Tew, MS candidate April 2010 University
Using of space technologies for glacierand snow- related hazards studies
 United Nations / Germany international conference on International Cooperation Towards Low-Emission and Resilient Societies Using of space technologies for glacierand snow- related hazards studies Bonn,
ARRIVAL CHARACTERISTICS OF PASSENGERS INTENDING TO USE PUBLIC TRANSPORT
 ARRIVAL CHARACTERISTICS OF PASSENGERS INTENDING TO USE PUBLIC TRANSPORT Tiffany Lester, Darren Walton Opus International Consultants, Central Laboratories, Lower Hutt, New Zealand ABSTRACT A public transport
A GIS Analysis of Probable High Recreation Use Areas in Three Sisters Wilderness Deschutes and Willamette National Forests
 Lindsey Kiesz Geo 565 Term Project 3/15/2010 A GIS Analysis of Probable High Recreation Use Areas in Three Sisters Wilderness Deschutes and Willamette National Forests Introduction The Three Sisters Wilderness
GRANDE News Letter Volume1, No.3, December 2012
 GRANDE News Letter Volume1, No.3, December 2012 Building a water management system in La Paz, Bolivia Climate change is a phenomenon that affects the entire world, but its impact on people differs depending
Rainfall influence upon nutrient inputs to Caribbean coastal systems. Tim Carruthers
 Rainfall influence upon nutrient inputs to Caribbean coastal systems Tim Carruthers Outline Thalassia as an indicator for the Caribbean Use of δ 15 N Nutrient sources to a dry Caribbean Lagoon, Yucatan
Fecal Coliform TMDL for Strawberry Creek (WBID 2239)
") FLORIDA DEPARTMENT OF ENVIRONMENTAL PROTECTION Division of Environmental Assessment and Restoration, Bureau of Watershed Restoration NORTHEAST DISTRICT LOWER ST. JOHNS BASIN Final TMDL Report Fecal Coliform
FLORIDA DEPARTMENT OF ENVIRONMENTAL PROTECTION Division of Environmental Assessment and Restoration, Bureau of Watershed Restoration NORTHEAST DISTRICT LOWER ST. JOHNS BASIN Final TMDL Report Fecal Coliform
Anna Marlene Cressman
 THE DEVELOPMENT OF A SEMI-QUANTITATIVE DECISION SUPPORT SYSTEM FOR THE ESTIMATION OF MICROBIAL LOADING IN THE NEUSE WATERSHED USING GEOGRAPHIC INFORMATION SYSTEMS Anna Marlene Cressman A thesis submitted
Adapting water resource management in coastal areas A case study in Hai Phong, Vietnam
 Adapting water resource management in coastal areas A case study in Hai Phong, Vietnam Thuc Phan, James Smart, Samantha Capon, Wade Hadwen Australian Rivers Institute, Griffith University Presentation
Hydrological study for the operation of Aposelemis reservoir Extended abstract
 Hydrological study for the operation of Aposelemis Extended abstract Scope and contents of the study The scope of the study was the analytic and systematic approach of the Aposelemis operation, based on
Georgia Coastal Ecosystems Long Term Ecological Research Project Marsh Hammock Research 2008
 Georgia Coastal Ecosystems Long Term Ecological Research Project Marsh Hammock Research 2008 Participating Investigators: M. Alber 1, C. Alexander 2, S. Pennings 3, S. Joye 1, C. Meile 1, A. Burd 1, W.
% farmers/private landowners in watershed applying BMPs. Other (Number of participants completed the training)
") Easygrants ID: 23803 National Fish and Wildlife Foundation NFWF/Legacy Grant Project ID: 0302.10.023803 U. S. Coral Reef Task Force Partnership Initiative 2010 - Submit Final Programmatic Report (Activities
Easygrants ID: 23803 National Fish and Wildlife Foundation NFWF/Legacy Grant Project ID: 0302.10.023803 U. S. Coral Reef Task Force Partnership Initiative 2010 - Submit Final Programmatic Report (Activities
Lower St. Johns River Tributaries Fecal Coliform Basin Management Action Plan Jacksonville Environmental Symposium
 Lower St. Johns River Tributaries Fecal Coliform Basin Management Action Plan Jacksonville Environmental Symposium WBIDs Addressed in This BMAP This BMAP includes 10 of the 75 (cycle 2) fecal coliform
Discriminate Analysis of Synthetic Vision System Equivalent Safety Metric 4 (SVS-ESM-4)
") Discriminate Analysis of Synthetic Vision System Equivalent Safety Metric 4 (SVS-ESM-4) Cicely J. Daye Morgan State University Louis Glaab Aviation Safety and Security, SVS GA Discriminate Analysis of
Discriminate Analysis of Synthetic Vision System Equivalent Safety Metric 4 (SVS-ESM-4) Cicely J. Daye Morgan State University Louis Glaab Aviation Safety and Security, SVS GA Discriminate Analysis of
Labrador - Island Transmission Link Target Rare Plant Survey Locations
 27-28- Figure: 36 of 55 29-28- Figure: 37 of 55 29- Figure: 38 of 55 #* Figure: 39 of 55 30- - east side Figure: 40 of 55 31- Figure: 41 of 55 31- Figure: 42 of 55 32- - secondary Figure: 43 of 55 32-
Welcome to the Boise Airport Master Plan Update Open House
 Welcome to the Boise Airport Master Plan Update Open House Get the facts and sign up for the Master Plan Update newsletter at http://www.iflyboise.com/about-boi/master-plan/ What does the Master Plan Update
Cross-sectional time-series analysis of airspace capacity in Europe
 Cross-sectional time-series analysis of airspace capacity in Europe Dr. A. Majumdar Dr. W.Y. Ochieng Gerard McAuley (EUROCONTROL) Jean Michel Lenzi (EUROCONTROL) Catalin Lepadatu (EUROCONTROL) 1 Introduction
Temporal concentration Competition
 Do an carriers dominate their connecting markets? A methodology for the analysis of market concentration on transfer routes * & Jaap de Wit *Dept of Planning Faculty of Geosciences Utrecht University,
Using LiDAR to study alpine watersheds. Chris Hopkinson, Mike Demuth, Laura Chasmer, Scott Munro, Masaki Hayashi, Karen Miller, Derek Peddle
 Using LiDAR to study alpine watersheds Chris Hopkinson, Mike Demuth, Laura Chasmer, Scott Munro, Masaki Hayashi, Karen Miller, Derek Peddle Light Detection And Ranging r t LASER pulse emitted and reflection
Spatial Distribution and Characteristics of At-Risk Species in the Southeast U.S.
 Nicholas Institute for Environmental Policy Solutions Scoping Document Part 2 Exploratory Analysis of Characteristics and Trends of At-Risk Species in the Southeast U.S. Spatial Distribution and Characteristics
SULFUR DIOXIDE LEVELS 2013 JAMES BAY, VICTORIA, BRITISH COLUMBIA
 SULFUR DIOXIDE LEVELS 2013 JAMES BAY, VICTORIA, BRITISH COLUMBIA JAMES BAY NEIGHBOURHOOD PREPARED BY: ELEANOR SETTON, PHD KARLA POPLAWSKI, MSC UNIVERSITY OF VICTORIA GEOGRAPHY SPATIAL SCIENCES RESEARCH
SF1363 / HF 1061: Legacy Funding; Conference Agreement
 - Conference 1 Art 1 - Outdoor Heritage Fund 2 3 Prairies 4 WMA, SNA, & Prairie Bank Easement Acq. Phase III 5 Accelerated Prairie Restoration - Phase III 6 MN Buffers for Wildlife & Water 7 Northern Tallgrass
GEOGRAPHY OF GLACIERS 2
 GEOGRAPHY OF GLACIERS 2 Roger Braithwaite School of Environment and Development 1.069 Arthur Lewis Building University of Manchester, UK Tel: UK+161 275 3653 r.braithwaite@man.ac.uk 09/08/2012 Geography
Watershed Description
 Bear River Basin: Bear Lake Watershed 1 Watershed Description The Bear Lake Watershed in the Bear River Basin has an area of 3,280 km 2 and includes all lands draining to the Bear River between Stewart
Water quality management in the Lake Baikal region of Russia
 Lomonosov Moscow State University Faculty of Geography Department of Environmental Management Water quality management in the Lake Baikal region of Russia Dr., Prof. Sergey Kirillov Dr., Prof. Mikhail
Mark West Creek Flow Study Report
 Mark West Creek Flow Study Report Biology and Geology of Mark West Creek The headwaters of Mark West Creek are located in the Mayacamas Mountain range, which border Napa and Sonoma County, where it then
An Introduction. The Saginaw River/Bay Area of Concern
 Saginaw River & Bay Area of Concern: Looking Forward Continued Partnerships in the Restoration of Saginaw Bay Michelle Selzer Lake Huron Coordinator & Interim AOC Coordinator Saginaw Bay Watershed Conference
Summary table of disaster occurrences, by hazards types, scale, and geographic region
 ANNEX BASIC RANGE OF DISASTER-RELATED STATISTICS TABLES Statistical tables are organised into worksheets according to basic components in the DSRF. The variables represent queries from a disaster-related
Studies on effect of electrostatic spraying in
 60 September, 2014 Agric Eng Int: CIGR Journal Open access at http://www.cigrjournal.org Vol. 16, No.3 Studies on effect of electrostatic spraying in orchards P K Mishra 1, Manjeet Singh 2, Ankit Sharma