Fecal Coliform TMDL for Saint Joes Creek, WBID 1668A
|
|
|
- Brittany Moody
- 6 years ago
- Views:
Transcription
1 FLORIDA DEPARTMENT OF ENVIRONMENTAL PROTECTION Division of Water Resource Management, Bureau of Watershed Management SOUTHWEST DISTRICT SPRINGS COAST BASIN ANCLOTE RIVER/COASTAL PINELLAS COUNTY PLANNING UNIT TMDL Report Fecal Coliform TMDL for Saint Joes Creek, WBID 1668A Paul C. Kurisko April 24, 2008
2 Acknowledgments This study could not have been accomplished without significant contributions from staff in the s (FDEP) Watershed Assessment Section. Editorial assistance was provided by Jan Mandrup-Poulsen and Kevin Petrus. Geographic information systems (GIS) and map production assistance were provided by Janis Paulsen. For additional information on the watershed management approach and impaired waters in the Springs Coast Basin, contact Fred Calder Bureau of Watershed Management Watershed Planning and Coordination Section 2600 Blair Stone Road, Mail Station 3565 Tallahassee, FL fred.calder@dep.state.fl.us Phone: (850) ; SunCom: Fax: (850) Access to all data used in the development of this report can be obtained by contacting Kevin Petrus Bureau of Watershed Management Watershed Assessment Section 2600 Blair Stone Road, Mail Station 3555 Tallahassee, FL kevin.petrus@dep.state.fl.us Phone: (850) ; SunCom: Fax: (850) ii
3 Contents Chapter 1: INTRODUCTION Purpose of Report Identification of Waterbody Background 4 Chapter 2: DESCRIPTION OF WATER QUALITY PROBLEM Statutory Requirements and Rulemaking History Information on Verified Impairment 5 Chapter 3. DESCRIPTION OF APPLICABLE WATER QUALITY STANDARDS Classification of the Waterbody and Criteria Applicable to the TMDL Applicable Water Quality Standards and Numeric Water Quality Target Fecal Coliform Criterion 8 Chapter 4: ASSESSMENT OF SOURCES Types of Sources Potential Sources of Fecal Coliform Bacteria in Saint Joes Creek, WBID 1668A Point Sources Land Uses and Nonpoint Sources 10 Chapter 5: DETERMINATION OF ASSIMILATIVE CAPACITY Method Used To Determine Loading Capacity Data Used in the Determination of Loading Capacity TMDL Development Process Critical Conditions/Seasonality 23 Chapter 6: DETERMINATION OF THE TMDL Expression and Allocation of the TMDL Load Allocation Wasteload Allocation NPDES Wastewater Discharges NPDES Stormwater Discharges 29 iii
4 6.4 Margin of Safety 30 Chapter 7: NEXT STEPS: IMPLEMENTATION PLAN DEVELOPMENT AND BEYOND Basin Management Action Plan 31 References 32 Appendices 34 Appendix A.1: Summary of Monitoring Results for Fecal Coliform in Saint Joes Creek, Main Channel, WBID 1668A 34 Appendix A.2: Summary of Monitoring Results for Fecal Coliform in Miles Creek, WBID 1668A 36 Appendix B: Background Information on Federal and State Stormwater Programs 37 List of Tables Table 2.1. Verified Impairment in Saint Joes Creek, WBID 1668A 6 Table 2.2. Summary of Fecal Coliform Data for Saint Joes Creek, WBID 1668A, March 2004 May Table 4.1. Classification of 2004 Land Use Categories in Saint Joes Creek, Table 4.2. WBID 1668A 11 Estimated Coliform Loading from Dogs and Cats in Saint Joes Creek, WBID 1668A 13 Table 4.3. Population Density in Pinellas County, Florida, in Table 5.1.a. Observed Fecal Coliform Data for Calculating Exceedances to the State Criterion for Saint Joes Creek, Main Channel, WBID 1668A 21 Table 5.1.b. Observed Fecal Coliform Data for Calculating Exceedances to the State Criterion for Miles Creek, WBID 1668A 22 Table 5.2.a. Coliform Target Loads for Flow, Saint Joes Creek, Main Channel 24 Table 5.2.b. Coliform Target Loads for Flow, Miles Creek 25 Table 5.3a. Fecal Coliform Percentage Reductions Required for Saint Joes Creek, Main Channel 26 Table 5.3.b. Fecal Coliform Percentage Reductions Required for Miles Creek 27 Table 6.1. Fecal Coliform TMDL for Saint Joes Creek, WBID 1668A 29 iv
5 List of Figures Figure 1.1. Saint Joes Creek, WBID 1668A, and Major Geopolitical Features in the Coastal Pinellas County Portion of the Springs Coast Basin 2 Figure 1.2. Saint Joes Creek, WBID 1668A, and Monitoring Locations 3 Figure 2.1. Fecal Coliform Measurements for Saint Joes Creek, WBID 1668A, March 2004 May Figure 4.1. Principal Land Uses in Saint Joes Creek, WBID 1668A, in Figure 4.2. Population Density in the Area of Saint Joes Creek, WBID 1668A, in Figure 5.1.a. Flow Duration Curve for Saint Joes Creek, Main Channel, (Estimated Flow) 18 Figure 5.1.b. Flow Duration Curve for Miles Creek, (Estimated Flow) 18 Figure 5.2.a. Load Duration Curve for Fecal Coliform in Saint Joes Creek, Main Channel, WBID 1668A 19 Figure 5.2.b. Load Duration Curve for Fecal Coliform in Miles Creek, WBID 1668A 20 Websites, Bureau of Watershed Management Total Maximum Daily Load (TMDL) Program Identification of Impaired Surface Waters Rule Florida STORET Program (b) Report Criteria for Surface Water Quality Classifications Water Quality Status and Assessment Reports for the Springs Coast Basin v
6 U.S. Environmental Protection Agency, National STORET Program Region 4: Total Maximum Daily Loads in Florida National STORET Program vi
7 Chapter 1: INTRODUCTION 1.1 Purpose of Report This report presents the Total Maximum Daily Load (TMDL) for fecal coliform bacteria for the freshwater segment of Saint Joes Creek, located in the Anclote River/Coastal Pinellas County Planning Unit, which is part of the larger Springs Coast Basin. The stream was verified as impaired for fecal coliform bacteria and was included on the Verified List of impaired waters for the Coastal Pinellas County portion of the Springs Coast Basin that was adopted by Secretarial Order in December 2007 ( [FDEP], 2007). The TMDL establishes the allowable loadings to Saint Joes Creek that would restore the waterbody so that it meets the applicable water quality criterion for fecal coliform bacteria. 1.2 Identification of Waterbody Saint Joes Creek is located within the Long Bayou watershed, in the west-central portion of Pinellas County, Florida (Figure 1.1). For assessment purposes, FDEP divided the Saint Joes Creek watershed into four water assessment polygons with a unique waterbody identification (WBID) number for each waterbody segment (Figure 1.2). The main stem of Saint Joes Creek is divided into a tidal and a freshwater segment, identified as WBIDs 1668E and 1668A, respectively. Two tributaries, which flow into the tidal segment of the creek, are Bonn Creek (WBID 1668D) and Pinellas Park Ditch Number 5 (WBID 1668B). This TMDL report focuses on the freshwater segment of Saint Joes Creek (WBID 1668A) and on Miles Creek, a tributary of the freshwater segment of the creek. Figure 1.2 shows the stream channels within WBID 1668A. Separate TMDL reductions were determined for the main channel of Saint Joes Creek and the Miles Creek tributary. Saint Joes Creek discharges to the Cross Bayou, Long Bayou, and Boca Ciega Bay estuary system. It is free flowing until it reaches the uppermost portion of its tidal area. The tidal portion, or the upper reaches of WBID 1668E, begins where the creek crosses under 46 th Avenue in the city of St. Petersburg. The Saint Joes Creek watershed (WBID 1668A) has a total surface area of about 9 square miles (Figure 1.1). All of the watershed lies within Pinellas County. Land use is predominantly residential, with 73 percent of the area designated as such. Major urban areas include portions of the city of St. Petersburg, Kenneth City, and West and East Lealman (a U.S. Census Designated Place [CDP]) (U.S. Census Bureau American FactFinder Website). The population of St. Petersburg, as of the 2003 U.S. Census estimate, was 247,610, making it the fourth largest city in the state. Based on the population density in St. Petersburg (4,163 persons/square mile) the estimated existing population in the Saint Joes Creek area (WBID 1668A) is 37,467 (U.S. Census Bureau State & County QuickFacts Website). 1


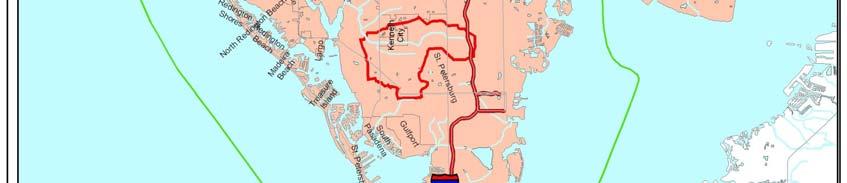

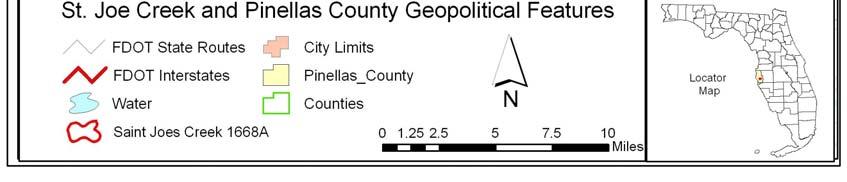
8 Figure 1.1. Saint Joes Creek, WBID 1668A, and Major Geopolitical Features in the Coastal Pinellas County Portion of the Springs Coast Basin 2

9 Figure 1.2. Saint Joes Creek, WBID 1668A, and Monitoring Locations 3
10 1.3 Background This report was developed as part of FDEP s watershed management approach for restoring and protecting state waters and addressing TMDL Program requirements. The watershed approach, which is implemented using a cyclical management process that rotates through the state s 52 river basins over a 5-year cycle, provides a framework for implementing the TMDL Program related requirements of the 1972 Federal Clean Water Act (U.S. Environmental Protection Agency [EPA] Federal Clean Water Act), and the 1999 Florida Watershed Restoration Act (FWRA) (Chapter , Laws of Florida). A TMDL represents the maximum amount of a given pollutant that a waterbody can assimilate and still meet water quality standards, including its applicable water quality criteria and its designated uses. TMDLs are developed for waterbodies that are verified as not meeting their water quality standards. They provide important water quality restoration goals that will guide restoration activities. This TMDL report will be followed by the development and implementation of a Basin Management Action Plan, or BMAP, to reduce the amount of fecal coliform bacteria that caused the verified impairment of the Saint Joes Creek freshwater segment. These activities will depend heavily on the active participation of the Southwest Florida Water Management District (SWFWMD), local governments, businesses, and other stakeholders. FDEP will work with these organizations and individuals to undertake or continue reductions in the discharge of pollutants and achieve the established TMDLs for impaired waterbodies. 4
11 Chapter 2: DESCRIPTION OF WATER QUALITY PROBLEM 2.1 Statutory Requirements and Rulemaking History Section 303(d) of the Federal Clean Water Act requires states to submit to the EPA a list of surface waters that do not meet applicable water quality standards (impaired waters) and establish a TMDL for each pollutant identified as causing the impairment of the listed waters on a schedule. FDEP has developed such lists, commonly referred to as 303(d) lists, since The list of impaired waters in each basin, referred to as the Verified List, is also required by the FWRA (Subsection [4], Florida Statutes [F.S.]), and the state s 303(d) list is amended annually to include basin updates. Florida s (d) list included 22 waterbodies (WBIDs) in the Springs Coast Basin. However, the FWRA (Section , F.S.) stated that all previous Florida 303(d) lists were for planning purposes only and directed FDEP to develop, and adopt by rule, a new science-based methodology to identify impaired waters. After a long rulemaking process, the Environmental Regulation Commission adopted the new methodology as Rule , Florida Administrative Code (F.A.C.) (Identification of Impaired Surface Waters Rule, or IWR, April 2001), and as amended. 2.2 Information on Verified Impairment FDEP used the IWR to assess water quality impairments in the freshwater segment of Saint Joes Creek (WBID 1668A) and verified the impairments for fecal coliform bacteria (see Table 2.1). Table 2.2 summarizes the data collected during the verification period (January 1, 1999, to June 30, 2006). The segment was verified as impaired for fecal coliform bacteria because more than 10 percent of values exceeded the Class III freshwater criterion of 400 counts per 100 milliliters (counts/100ml) for fecal coliform (23 out of 62 samples in the verified period exceeded the criterion of 400 counts/100ml). The verified impairments were based on data collected by the Pinellas County Watershed Management Division and FDEP. The assessment was based on data collected at 3 Pinellas County STORET stations (21FLPDEM35-10, -11, and -12) and 5 FDEP STORET stations (Southwest District STORET Stations , , , , and ). Seven of the stations are located on the main stem of Saint Joes Creek, and 1 station is located on Miles Creek (21FLPDEM35-12). Figure 1.2 shows the locations of the sampling sites. Figure 2.1 displays the fecal coliform data collected from 2004 through 2006, and Appendix A tabulates all available fecal coliform data for the impaired segment. Fecal coliform values exceeding the criterion of 400 counts/100ml during this period were used to develop the TMDL, as described in Chapter 5. 5
12 Table 2.1. Verified Impairment in Saint Joes Creek, WBID 1668A Parameter Causing Impairment Priority for TMDL Development Projected Year for TMDL Development* Fecal Coliform High 2007 *The TMDL was scheduled to be completed by December 31, 2006, based on a Consent Decree between the EPA and EarthJustice, but the Consent Decree allows a nine-month extension for completing the TMDL. Table 2.2. Summary of Fecal Coliform Data for Saint Joes Creek, WBID 1668A, March 2004 May 2006 Waterbody Parameter Causing Impairment Total Number of Samples 30-Day Geometric Mean Percent Fecal Coliform Samples > 400 counts/100ml Minimum Concentration (counts/100ml) Maximum Concentration (counts/100ml) Saint Joes Creek Main Channel Fecal Coliform 50 N/A ,500 Miles Creek Fecal Coliform 12 N/A ,300 N/A Not available 6
13 St Joe's Creek Fecal Coliform Measurements From 2004 to 2006 WBID 1668A Fecal Coliforms (counts/100 ml) Sampling Station ID Number 21FLPDEM FLPDEM FLPDEM35-12 Fecal Coliform Criteria: 400 counts/100 ml 0 Mar-04 May-04 Aug-04 Nov-04 Feb-05 May-05 Aug-05 Nov-05 Feb-06 May-06 Date Figure 2.1. Fecal Coliform Measurements for Saint Joes Creek, WBID 1668A, March 2004 May
14 Chapter 3. DESCRIPTION OF APPLICABLE WATER QUALITY STANDARDS 3.1 Classification of the Waterbody and Criteria Applicable to the TMDL Florida s surface waters are protected for five designated use classifications, as follows: Class I Class II Class III Class IV Class V Potable water supplies Shellfish propagation or harvesting Recreation, propagation, and maintenance of a healthy, wellbalanced population of fish and wildlife Agricultural water supplies Navigation, utility, and industrial use (there are no state waters currently in this class) Saint Joes Creek is a Class III waterbody, with a designated use of recreation, propagation, and maintenance of a healthy, well-balanced population of fish and wildlife. The Class III water quality criterion applicable to the impairment addressed by this TMDL is for fecal coliform bacteria. 3.2 Applicable Water Quality Standards and Numeric Water Quality Target Fecal Coliform Criterion Numeric criteria for bacterial quality are expressed in terms of fecal coliform bacteria concentrations. The water quality criterion for the protection of Class III waters, as established by Rule , F.A.C., is as follows: Fecal Coliform Bacteria: The most probable number (MPN) or membrane filter (MF) counts per 100 ml of fecal coliform bacteria shall not exceed a monthly average of 200, nor exceed 400 in 10 percent of the samples, nor exceed 800 on any one day. For fecal coliform, the criterion states that monthly averages shall be expressed as geometric means, based on a minimum of 10 samples taken over a 30-day period. However, during the development of load curves for the impaired segment (as described in subsequent chapters), there were insufficient data (fewer than 10 samples in a given month) available to evaluate the geometric mean criterion for fecal coliform bacteria. Therefore, the fecal coliform criterion selected for the TMDL is that values are not to exceed 400 counts/100ml in more than 10 percent of the samples. The 10 percent exceedance allowed by the water quality criterion was not used directly in estimating the target load, but was included in the TMDL margin of safety (MOS) (described in Section 6.4). 8
15 Chapter 4: ASSESSMENT OF SOURCES 4.1 Types of Sources An important part of the TMDL analysis is the identification of pollutant source categories, source subcategories, or individual sources of the pollutant causing impairment in the watershed and the amount of pollutant loading contributed by each of these sources. Sources are broadly classified as either point sources or nonpoint sources. Historically, the term point sources has meant discharges to surface waters that typically have a continuous flow via a discernable, confined, and discrete conveyance, such as a pipe. Domestic and industrial wastewater treatment facilities (WWTFs) are examples of traditional point sources. In contrast, the term nonpoint sources was used to describe intermittent, rainfall-driven, diffuse sources of pollution associated with everyday human activities, including runoff from urban land uses, agriculture, silviculture, and mining; discharges from failing septic systems; and atmospheric deposition. However, the 1987 amendments to the Clean Water Act redefined certain nonpoint sources of pollution as point sources subject to regulation under the EPA s National Pollutant Discharge Elimination System (NPDES) Program. These nonpoint sources included certain urban stormwater discharges, including those from local government master drainage systems, construction sites over 5 acres, and a wide variety of industries (see Appendix B for background information on the federal and state stormwater programs). To be consistent with Clean Water Act definitions, the term point source will be used to describe traditional point sources (such as domestic and industrial wastewater discharges) and stormwater systems requiring an NPDES stormwater permit when allocating pollutant load reductions required by a TMDL (see Section 6.1). However, the methodologies used to estimate nonpoint source loads do not distinguish between NPDES stormwater discharges and non-npdes stormwater discharges, and as such, this source assessment section does not make any distinction between the two types of stormwater. 4.2 Potential Sources of Fecal Coliform Bacteria in Saint Joes Creek, WBID 1668A Point Sources There are no permitted domestic WWTFs that discharge fecal coliform loads into the freshwater segment of Saint Joes Creek. One facility, the Pinellas County Utilities South Cross Bayou Water Reclamation Facility (NPDES No. FL ), discharges to the tidal segment of Saint Joes Creek, downstream of the reach that is the focus of this report. 9
16 Municipal Separate Storm Sewer System Permittees Municipal separate storm sewer systems (MS4s) may also discharge pollutants to waterbodies in response to storm events. To address stormwater discharges, the EPA developed the NPDES stormwater permitting program in two phases. Phase I, promulgated in 1990, addresses large and medium-size MS4s located in incorporated areas and counties with populations of 100,000 or more. Phase II permitting began in Regulated Phase II MS4s, defined in Section , F.A.C., typically cover urbanized areas serving jurisdictions with a population of at least 10,000 or discharging into Class I or Class II waters, or into Outstanding Florida Waters. There are two Phase I MS4 permits that cover the stormwater collection systems in the Saint Joes Creek watershed. Saint Joes Creek falls under the Phase I MS4 permits to Pinellas County (No. FLS000005) and the city of St. Petersburg (No. FLS000007). The copermittees of the Pinellas County permit are the town of Kenneth City and the Florida Department of Transportation (FDOT). Currently, no local governments in the watershed have applied for coverage under the Phase II NPDES MS4 permit Land Uses and Nonpoint Sources Nonpoint source pollution, unlike pollution from industrial and sewage treatment plants, comes from many diffuse sources. It is caused by rainfall moving over and through the ground. As the runoff moves, it picks up and carries away natural and human-made pollutants, finally depositing them into lakes, rivers, wetlands, coastal waters, and even underground sources of drinking water (EPA, 1994). Potential nonpoint sources of fecal coliform bacteria include loadings from surface runoff, wildlife, livestock, pets, leaking sewer lines, and leaking septic tanks. Wildlife Wildlife deposit coliform bacteria with their feces onto land surfaces, where they can be transported during storm events to nearby streams. Some wildlife (such as otters, beavers, raccoons, and birds) deposit their feces directly into the water. The bacterial load from naturally occurring wildlife is assumed to be background. In addition, any strategy employed to control this source would probably have a negligible impact on attaining water quality standards. Agricultural Animals Agricultural animals are the source of several types of coliform bacteria loading to streams. Agricultural activities, including runoff from pastureland and cattle in streams, can affect water quality. A review of the land use categories found no Florida Land Use Cover Classification System (FLUCCS) codes involving animal feeding operations, or specialty farms that contain animals. Land Uses The spatial distribution and acreage of different land use categories were identified using the SWFWMD 2004 land use coverage (scale 1:40,000) contained in FDEP s geographic information system (GIS) library. Land use categories in Saint Joes Creek were aggregated using the simplified Level 1 codes (Table 4.1). Figure 4.1 shows the acreage of the principal land uses draining into the main channel and Miles Creek tributary, which make up the 10
17 watershed area in this segment. The urban and built-up category predominates, covering about 97 percent of the total area, with residential areas making up 73 percent of the total. The agricultural land uses (0.1 percent) are associated with nurseries, which are not typically sources of fecal coliform bacteria. Table 4.1. Classification of 2004 Land Use Categories in Saint Joes Creek, WBID 1668A FLUCCS Code Land Use Acreage Percentage of Total 1000 Recreational and Open Land 66 1% 1100 Residential Low Density < 2 Dwelling Units/Acre 52 1% 1200 Residential Medium Density 2-5 Dwelling Units/Acre 33 1% 1300 Residential High Density 6 or more Dwelling Units/Acre 4,159 71% 1400 Commercial % 1500 Industrial 293 5% 1700 Institutional 252 4% 2000 Agricultural 3 0.1% 4000 Forests 3 0.1% 5000 Water 102 2% 6000 Wetlands 8 0.1% 8000 Transportation, Communication and Utilities 263 4% Totals 5, % 11

18 Figure 4.1. Principal Land Uses in Saint Joes Creek, WBID 1668A, in
19 Urban Development Coliform bacteria loading from urban areas is attributable to multiple sources, including stormwater runoff, leaks and overflows from sanitary sewer systems, illicit discharges of sanitary waste, runoff from improper disposal of waste materials, leaking septic systems, and domestic animals. Since nearly 73 percent of the land area in the watershed is residential, it is possible that pets, especially dogs, are affecting coliform bacteria levels in Saint Joes Creek. FDEP obtained data on the number of dogs and cats in the area from the Pinellas County Animal Service Department (Pinellas County Environmental Management, November 2007); using these estimates, the coliform loading from dogs and cats may be estimated (Table 4.2), Assuming that 10 percent of coliforms reach the waterbody and are viable upon reaching it, the approximate total loading is 4.23 x organisms/day. Table 4.2. Estimated Coliform Loading from Dogs and Cats in Saint Joes Creek, WBID 1668A Pet Estimated Number of Pets in WBID 1668A Estimated Loading of Total Estimated Number of Pets with Impact to WBID Estimated Counts/Pet/Day 1 Estimated Counts/Day Dogs 5,533 10% x x Cats 2,917 10% x x From the EPA document, Protocol for Developing Pathogen TMDLs, January 2001, pp Population According to the U.S. Census Bureau, the population density in Pinellas County in 2006 was at or less than 3,302.4 persons per square mile (Table 4.3). The U.S. Census Bureau reports that the total population in 2006 for Pinellas County, which includes (but is not exclusive to) WBID 1668A, was 924,413, with 495,191 housing units (2005 estimate). For all of Pinellas County, the bureau reported a housing unit density of 1,769 housing units per square mile. Pinellas County is above the average housing unit density of Florida of 153 housing units per square mile. In the Saint Joes Creek area, the estimated population density is about 4,163 people per square mile (U.S. Census Bureau for the city of St Petersburg). See Figure 4.2 for a U.S. Census Bureau map of the area. 13

20 Table 4.3. Population Density in Pinellas County, Florida, in 2006 Persons per Square Mile Total Population Housing Units per Square Mile Housing Units 3, , ,191 Source: U.S. Census Bureau State & County QuickFacts Website, Available: Figure 4.2. Population Density in the Area of Saint Joes Creek, WBID 1668A, in 2006 Septic Tanks According to the city of St. Petersburg and Pinellas County Utilities websites and sewer service maps, nearly all of the residences are connected to the sanitary sewer system, virtually eliminating septic tank effluent as a potential source to the creek. According to Pinellas County Utilities Engineering Division, the area of WBID 1668A north of 38 th Ave. in St. Petersburg is entirely served by sanitary sewers that connect to the South Cross Bayou Water Reclamation 14
21 Facility (WRF). The area south of 38 th Ave. is sewered by the city of St. Petersburg and is connected to all four of the city s wastewater treatment and WRFs. Domestic Sludge When domestic wastewater is treated, the solid material that accumulates in the wastewater treatment plant must be removed periodically to keep the plant operating properly. The collected material, called residuals, biosolids, or more commonly, sewage sludge, is the byproduct of these processes. The land application of sludge from domestic WWTFs is a potential source of coliform bacteria loading to surrounding surface waters. There are no known residual land application sites in the Saint Joes Creek watershed. Pinellas County Utilities South Cross Bayou WRF produces Class AA sludge residual. Class AA residuals (highest quality) are treated to eliminate pathogens and meet strict pollutant criteria. As a result, they may be used without restriction and may be sold to the public. Certain Class AA products are found in stores and garden centers. The city of St Petersburg s domestic facilities distribute their sludge residuals outside of Pinellas County. Reclaimed Water Usage Wastewater treatment plants with the ability to reuse effluent for irrigation are called WRFs. All of the four St Petersburg facilities and the South Cross Bayou wastewater treatment plants are WRFs. The effluent is reused as irrigation water for parks, golf courses and other sport fields, parks, cemeteries, and other open spaces where water irrigation is needed or beneficial. The effluent may also be used for industrial applications (e.g., closed circuit cooling systems). The effluent, although of good water quality, is not potable, and direct human contact should be avoided or at least minimized for public health and safety. It is disinfected for fecal coliform destruction, tested daily, and stored prior to land application reuse. Effluent is not applied during rain events to preclude runoff to waterbodies. The permitted effluent limitation for 75 percent of fecal coliform values is below detection limits, and any one sample shall not exceed 25 fecal coliform values per 100 ml of sample. All of the WRFs have a master reuse plan identifying permitted areas for irrigation and distribution. Some of the reclaimed water users are within the Saint Joes Creek watershed. The ground water is monitored periodically for fecal coliform bacteria. There is one monitoring well in WBID 1668A (St. Petersburg MWC-01). A review of the sampling results revealed that nearly all of the fecal coliform values were reported as non-detect. 15
22 Chapter 5: DETERMINATION OF ASSIMILATIVE CAPACITY 5.1 Method Used To Determine Loading Capacity The methodology used for this TMDL is the load duration curve. Also known as the Kansas Approach because it was developed by the state of Kansas (Stiles, 2002), this method has been well documented in the literature, with improved modifications used by the EPA, Region 4. Basically, the method relates the pollutant concentration to the flow of the stream to establish the existing loading capacity and the allowable pollutant load (TMDL) under a spectrum of flow conditions. It then determines the maximum allowable pollutant load and load reduction requirement based on the analysis of the critical flow conditions. Using this method, it takes five steps to develop the TMDL and establish the required load reduction: 1. Identify available flow and water quality data, 2. Develop the flow duration curve, 3. Develop the load duration curve for the existing loading, 4. Define the critical conditions, and 5. Establish the needed load reduction by comparing the existing loading with the allowable load under critical conditions. 5.2 Data Used in the Determination of Loading Capacity Fecal coliform bacteria concentrations and flow measurements were used to estimate both the allowable and existing coliform loads. TMDLs for fecal coliform bacteria are being developed for both the Saint Joes Creek main channel and Miles Creek because the number of criterion exceedances in each channel meet the IWR verified impaired listing requirements. The primary collectors of water quality data in the watershed are the Pinellas County Watershed Management Division and FDEP. For the main channel of Saint Joes Creek, Pinellas County STORET stations include two 21FLPDEM35 stations: -10, and -11. FDEP s (Southwest District) main channel stations include five STORET Stations: , , , , and For the Miles Creek tributary to Saint Joes Creek, the Pinellas County Watershed Management Division samples at STORET Station 21FLPDEM35-12 were included in the analysis. Figure 1.2 shows the locations of these sampling sites, while Table 2.2 provides a statistical overview of the observed data at the sites. Figure 2.1 displays the data for fecal coliform bacteria used in this analysis, and Appendix A lists the water quality monitoring results for fecal coliform bacteria. Flow measurements for TMDL development were obtained from a U.S. Geological Survey (USGS) gaging station located on Saint Joes Creek (USGS , at Pinellas Park, Florida, Latitude 27 48'50", Longitude 82 41'45" (Figure 1.2). The flow data from this gage were selected for this analysis because most of the fecal coliform data were collected at or near the gage site, and flows were measured and recorded during the verified period. 16
23 5.3 TMDL Development Process The range of flows from the USGS flow gage was divided into flow zones. The concept of zones is adopted from Dr. Bruce Cleland (Cleland, August 15, 2002, and September 2003). The purpose of the zones is to demarcate hydrologic conditions between drought and peak flood into flow ranges such as low, dry, average, moist, and high. Expressing the flows in terms of frequency of recurrence (duration) allows exceedances of the criterion to be linked to specific flow intervals and durations. For example, if all of the exceedances occurred during low-flow conditions, point sources of the pollutant would be suspected. Conversely, if all the exceedances took place during higher-flow periods, then nonpoint sources of the pollutant would be suspected. Following Cleland s approach (Cleland, September 2003), FDEP selected the following flow zones: High (0 10), Moist (11 40), Mid-range (41 60), Dry (61 90), and Low (91 100). To develop the flow duration curves and load duration curves for both the Saint Joes Creek main channel and Miles Creek, the daily flow at the downstream end of each channel was estimated by multiplying the gage flow by the ratio of each channel s watershed drainage area to the gage drainage area. Figure 5.1.a and Figure 5.1.b present the flow duration curves for the Saint Joes Creek main channel and Miles Creek watersheds, respectively. Using the flows from the flow duration curves, load duration curves for fecal coliform bacteria (Figure 5.2.a and Figure 5.2.b) were calculated using the following equation: (1) (observed flow) x (conversion factor) x (state criteria) = ([parameter quantity]/day or daily load) The equation above yields the load duration curve or allowable load curve, shown as the fecal coliform target lines in Figure 5.2.a and Figure 5.2.b. Using Equation 1 (above), a table of fecal coliform loads exceeding the load target were calculated, substituting the observed coliform exceedances for the state criterion value (Table 5.1.a and Table 5.1.b). All the fecal coliform observations were then plotted, and it was noted where the samples were in relation to the allowable load curve (above or below the curve). Those above the curves in Figure 5.2.a and Figure 5.2.b are noted as exceedances to the state criterion, and are indicated by a red triangle. 17
24 Flow Duration Curve Main Channel Flow (cfs) Flow Duration Interval Figure 5.1.a. Flow Duration Curve for Saint Joes Creek, Main Channel, (Estimated Flow) Flow Duration Curve Miles Creek Flow (cfs) Flow Duration Interval Figure 5.1.b. Flow Duration Curve for Miles Creek, (Estimated Flow) 18
25 Fecal Coliform Load in Saint Joes Creek Main Stream 1.E+13 1.E+12 y = (7 x )x R 2 = E+11 Load (CFU/day) 1.E+10 1.E+09 1.E+08 High Flows Moist Conditions Mid Range Flows Dry Conditions Low Flows 1.E Duration Interval Fecal Coliform Target Non-Exceedances Exceedances Power (Exceedances) Figure 5.2.a. Load Duration Curve for Fecal Coliform in Saint Joes Creek, Main Channel, WBID 1668A 19
26 Fecal Coliform Load in Miles Creek 1.E+14 1.E+13 y = (4 x )x R 2 = E+12 Load (CFU/day) 1.E+11 1.E+10 1.E+09 1.E+08 High Mid Range Moist Conditions Dry Low Flows Flows Conditions Flows 1.E Duration Interval Non Exceedances Exceedances Fecal Coliform Target Power (Exceedances) Figure 5.2.b. Load Duration Curve for Fecal Coliform in Miles Creek, WBID 1668A 20
27 Table 5.1.a. Observed Fecal Coliform Data for Calculating Exceedances to the State Criterion for Saint Joes Creek, Main Channel, WBID 1668A Fecal Coliform Station Sample Date Flow (cfs) Flow Rank (%) Fecal Coliform (CFU/100mL) Fecal Coliform Load (CFU/day) /15/ x /15/ x FLPDEM /5/ , x FLPDEM /5/ x FLPDEM /15/ , x FLPDEM /15/ , x FLPDEM /19/ x FLPDEM /19/ x FLPDEM /31/ x FLPDEM /31/ x FLPDEM /10/ , x FLPDEM /10/ x FLPDEM /10/ , x FLPDEM /10/ , x Note: Flow and concentration data analyzed for the TMDL were from March 2004 through May The Group 5 verification period is from January 1, 1999, through June 30, Flow data were estimated using flow data from USGS Gage , located in WBID 1668A. cfs cubic feet per second. CFU colony-forming units 21
28 Table 5.1.b. Observed Fecal Coliform Data for Calculating Exceedances to the State Criterion for Miles Creek, WBID 1668A Station Sample Date Flow (cfs) Flow Rank (%) Fecal Coliform (CFU/100mL) Fecal Coliform Load (CFU/day) 21FLPDEM /19/ x FLPDEM /3/ , x FLPDEM /14/ x FLPDEM /19/ x FLPDEM /5/ x FLPDEM /15/ , x FLPDEM /31/ x FLPDEM /2/ x FLPDEM /10/ , x Note: Flow and concentration data analyzed for the TMDL were from January 2005 through May The Group 5 verification period is from January 1, 1999, through June 30, Flow data were estimated using flow data from USGS Gage , located in WBID 1668A. As noted previously, values on the load duration curve can generally be grouped by hydrologic conditions to identify the most likely potential sources. Exceedances falling into the 10 th through 40 th percentile flows are typically associated with moist conditions when stormwater loads are the most likely source, and exceedances falling into the 60 th through 90 th percentiles are typically associated with dry conditions when point sources are likely the dominant source. As shown in Figure 5.2.a, the fecal coliform exceedances in the Saint Joes Creek main channel are nearly distributed equally within the 10 th to 40 th percentile, 40 th to 60 th percentile, and 60 th to 90 th percentile of flows, with no exceedances within the 0 to 10 th or 90 th to 100 th percentiles. For Miles Creek, as shown in Figure 5.2.b, exceedances occur during most hydrologic conditions except for the very highest flows (0 to 10 th percentile). Table 5.2.a and Table 5.2.b depict the allowable fecal coliform bacteria load for peak flow, low flow, and 5-percentile increments in flow for the Saint Joes Creek main channel and Miles Creek, respectively. The tables were created by taking the N th -percentile flow (flow rank in the table) from the measured flow data and multiplying each percentile flow by the fecal coliform criterion of 400 counts/100ml and converting into bacteria counts/day. This conversion was accomplished by multiplying the criterion by [(28317/100)*60*60*24]. The factor 28317/100 converts counts/100ml into counts per cubic foot, and the 60*60*24 converts seconds to days. 22
29 Finally, the actual needed load reduction for compliance with the state criterion was calculated using the following equation: (2) (existing load) (allowable load) X 100 (existing load) On the load duration curve, all points higher than the allowable load were considered an exceedance of the fecal coliform criterion. A regression analysis was performed to determine the best correlation for the exceedances. The existing loading of a given flow duration interval was calculated using the regression equation displayed in Figure 5.2.a for Saint Joes Creek, and Figure 5.2.b for Miles Creek, and a given flow duration interval between the 10 th and 90 th percentile, in 5-percentile increments. The allowable loading of a given flow duration interval was calculated using Equation (1), within the flow duration interval with 5-percentile increments. Using Equation (2), the load reduction was determined for each flow interval. Table 5.3.a and Table 5.3.b list the flow duration intervals, allowable loadings, existing loadings, and needed load reductions for fecal coliform bacteria for Saint Joes Creek and Miles Creek, respectively. 5.4 Critical Conditions/Seasonality The critical conditions for coliform loadings in a given watershed depend on the existence of point sources and land use patterns in the watershed. Typically, the critical condition for nonpoint sources is an extended dry period, followed by a rainfall runoff event. During wet weather periods, coliform bacteria that have built up on the land surface under dry weather conditions are washed off by rainfall, resulting in wet weather exceedances. However, significant nonpoint source contributions could also occur under dry weather conditions without any major surface runoff event. This usually happens when nonpoint sources contaminate the surficial aquifer, and coliform bacteria are brought into the receiving waters through baseflow. Animals with direct access to the receiving water could also contribute to the exceedances during dry weather conditions. The critical condition for point source loading typically occurs during periods of low stream flow, when dilution is minimized. 23
30 Table 5.2.a. Fecal Coliform Target Loads for Flow, Saint Joes Creek, Main Channel Flow Rank Flow Rank (%) Flow (cfs) Fecal Coliform Load (counts/day) Allowable Loads Flow Conditions 0.04% x Peak 0.10% x % x day 1% x % x % x % x % x % x % x % x % x % x % x % x % x % x % x % x % x % x % x % x % x % x 10 8 Low 24
31 Table 5.2.b. Fecal Coliform Target Loads for Flow, Miles Creek Allowable Loads Flow Rank Flow Rank (%) Flow (cfs) Fecal Coliform Load (counts/day) Flow Conditions 0.04% x Peak 0.10% x % x Day 1% x % x % x % x % x % x % x % x % x % x % x % x % x % x % x % x % x % x % x % x % x % x 10 8 Low 25
32 Table 5.3.a. Fecal Coliform Percentage Reductions Required for Saint Joes Creek, Main Channel Flow Ranking (%) Allowable Load (colonies/day) Existing Load (colonies/day) % Reduction Required x x x x x x x x x x x x x x x x x x x x x x x x x x x x x x x x x x Median 4.12 x x
33 Table 5.3.b. Fecal Coliform Percentage Reductions Required for Miles Creek Flow Ranking (%) Allowable Load (colonies/day) Existing Load (colonies/day) % Reduction Required x x x x x x x x x x x x x x x x x x x x x x x x x x x x x x x x x x Median 3.24 x x As shown in Figure 5.2.a and Figure 5.2.b, exceedances of fecal coliform bacteria in the Saint Joes Creek watershed appeared during nearly all flow regimes. In general, exceedances on the right side of the curve typically occur during low-flow events, implying a contribution from either point sources or baseflow. In contrast, exceedances on the left side of the curve usually represent potential sources accumulated on the land surface that could result from the land application of biosolids, wildlife, livestock, and pets. As discussed in Chapter 4, there are no active permitted facility discharges of fecal coliform loads directly into Saint Joes Creek, WBID 1668A; therefore, nonpoint sources are the contributory sources to the fecal coliform bacteria load. 27
34 Chapter 6: DETERMINATION OF THE TMDL 6.1 Expression and Allocation of the TMDL The objective of a TMDL is to provide a basis for allocating acceptable loads among all of the known pollutant sources in a watershed so that appropriate control measures can be implemented and water quality standards achieved. A TMDL is expressed as the sum of all point source loads (wasteload allocations, or WLAs), nonpoint source loads (load allocations, or LAs), and an appropriate margin of safety (MOS), which takes into account any uncertainty concerning the relationship between effluent limitations and water quality: TMDL = WLAs + LAs + MOS As discussed earlier, the WLA is broken out into separate subcategories for wastewater discharges and stormwater discharges regulated under the NPDES Program: TMDL WLAs wastewater + WLAs NPDES Stormwater + LAs + MOS It should be noted that the various components of the revised TMDL equation may not sum up to the value of the TMDL because (a) the WLA for NPDES stormwater is typically based on the percent reduction needed for nonpoint sources and is also accounted for within the LA, and (b) TMDL components can be expressed in different terms (for example, the WLA for stormwater is typically expressed as a percentage reduction, and the WLA for wastewater is typically expressed as mass per day). WLAs for stormwater discharges are typically expressed as a percentage reduction because it is very difficult to quantify the loads from MS4s (given the numerous discharge points) and to distinguish loads from MS4s from other nonpoint sources (given the nature of stormwater transport). The permitting of stormwater discharges also differs from the permitting of most wastewater point sources. Because stormwater discharges cannot be centrally collected, monitored, and treated, they are not subject to the same types of effluent limitations as wastewater facilities, and instead are required to meet a performance standard of providing treatment to the maximum extent practical through the implementation of best management practices (BMPs). This approach is consistent with federal regulations (40 CFR 130.2[I]), which state that TMDLs can be expressed in terms of mass per time (e.g., pounds per day), toxicity, or other appropriate measure. The fecal coliform bacteria TMDL for the Saint Joes Creek main channel and Miles Creek are expressed in terms of colonies per day for the overall TMDL and as a percent reduction for MS4 areas and other nonpoint sources to meet the applicable criterion. The TMDL represents the maximum daily fecal coliform load the river can assimilate and maintain the applicable fecal coliform bacteria criterion (Table 6.1). 28
35 Table 6.1. Fecal Coliform TMDL for Saint Joes Creek, WBID 1668A Channel Saint Joes Main Channel Miles Creek TMDL Median 10 th to 90 th Percentile Median 10 th to 90 th Percentile TMDL (colonies/day) Wastewater (colonies/day) WLA NPDES Stormwater (% reduction) LA (% reduction) MOS 4.1 x N/A Implicit 3.2 x N/A Implicit N/A Not applicable 6.2 Load Allocation Based on a load duration curve approach similar to that developed by the state of Kansas (Stiles, 2002), the load allocation for nonpoint sources in the Saint Joes Creek main channel is a 50 percent reduction for all flow periods. For Miles Creek, the load allocation for nonpoint sources is a 57 percent reduction of instream coliform concentrations for all flow periods. It should be noted that the LA includes loading from stormwater discharges that are not part of the NPDES stormwater program (see Appendix B). 6.3 Wasteload Allocation NPDES Wastewater Discharges As previously mentioned, there are no permitted domestic wastewater treatment facilities that discharge fecal coliform loads into the Saint Joes Creek main channel and Miles Creek NPDES Stormwater Discharges The WLA for the Pinellas County, City of St Petersburg, and FDOT MS4 permits calls for reductions of 49.8 and 57.2 percent in current anthropogenic fecal coliform loading contributing to the criteria exceedances in the Saint Joes Creek s main channel and Miles Creek, respectively. It should be noted that any MS4 permittee is only responsible for reducing the loads associated with stormwater outfalls that it owns or otherwise has responsible control over, and it is not responsible for reducing other nonpoint source loads in its jurisdiction. While the LA and WLA for fecal coliform bacteria have been expressed as the percent reduction needed to attain the applicable Class III criterion, it is the combined reductions from both anthropogenic point and nonpoint sources that will result in the required reduction of instream fecal coliform concentrations. However, it is not the intent of the TMDL to abate natural background conditions. 29
36 6.4 Margin of Safety Consistent with the recommendations of the Allocation Technical Advisory Committee (FDEP, February 1, 2001), an implicit MOS was used in the development of this TMDL. An implicit MOS was provided by the conservative decisions associated with the analytical assumptions and the development of assimilative capacity, which only focuses on exceedances. An MOS was included in the TMDL by not allowing any exceedances of the state criterion, even though intermittent natural exceedances of the criterion would be expected and would be taken into account when determining impairment. Additionally, the implicit MOS is appropriate, as existing loads are based on instream coliform measurements. These measurements include decay processes occurring instream and do not represent the maximum load that can be applied to the land and transported to the stream during a rain event. 30
37 Chapter 7: NEXT STEPS: IMPLEMENTATION PLAN DEVELOPMENT AND BEYOND 7.1 Basin Management Action Plan Following the adoption of this TMDL by rule, the next step in the TMDL process is to develop an implementation plan for the TMDL, referred to as the Basin Management Action Plan (BMAP). This document will be developed over the next year in cooperation with local stakeholders, who will attempt to reach consensus on detailed allocations and on how load reductions will be accomplished. The BMAP will include, among other things: Appropriate load reduction allocations among the affected parties, A description of the load reduction activities to be undertaken, including structural projects, nonstructural BMPs, and public education and outreach, A description of further research, data collection, or source identification needed in order to achieve the TMDL, Timetables for implementation, Confirmed and potential funding mechanisms, Any applicable signed agreement(s), Local ordinances defining actions to be taken or prohibited, Any applicable local water quality standards, permits, or load limitation agreements, Milestones for implementation and water quality improvement, and Implementation tracking, water quality monitoring, and follow-up measures. An assessment of progress toward the BMAP milestones will be conducted every five years, and revisions to the plan will be made as appropriate, in cooperation with basin stakeholders. 31
38 References City of St Petersburg Water Resources Department. June 7, Personal Communication. City of St Petersburg Water Resources Department Website Available: Cleland, B. August 15, TMDL development from the bottom up Part II: Using load duration curves to connect the pieces. Washington, D.C.: America s Clean Water Foundation. Available: Cleland, B. September TMDL development from the bottom up Part III: Duration curves and wet-weather assessments. Washington, D.C.: America s Clean Water Foundation. Available: Florida Administrative Code. Chapter , Surface water quality standards. Available: Chapter , Identification of impaired surface waters. Available: February 1, A report to the Governor and the Legislature on the allocation of total maximum daily loads in Florida. Tallahassee, Florida: Bureau of Watershed Management.. February Florida s Total Maximum Daily Load Program: The first 5 years, A report to the Legislature and Governor. Tallahassee, Florida: Division of Watershed Management. Available: December Order adopting Verified List of impaired waters and delisting of waters. Tallahassee, Florida. Available: June Water quality status report Springs Coast. Tallahassee, Florida. Available: ftp://ftp.dep.state.fl.us/pub/water/basin411/springscoast/status/springcst.pdf. Florida Department of Health Website Available: and Florida Watershed Restoration Act. Chapter , Laws of Florida. Available: Pinellas County Environmental Management, Watershed Management Division. November Letter to U.S. Environmental Protection Agency. Pinellas County Utilities. May 29, Personal Communication. Pinellas County Utilities Website Available: 32
39 Southwest Florida Water Management District GIS Data Website Available: Stiles, T A simple method to define bacteria TMDLs in Kansas. Topeka, Kansas: Kansas Department of Health and Environment. U.S. Census Bureau American FactFinder Website Available: U.S. Census Bureau State & County QuickFacts Website Available: U.S. Environmental Protection Agency Federal Clean Water Act. Available: Nonpoint source pollution: The nation's largest water quality problem. Pointer No. 1. EPA-841-F Available: January Protocol for developing pathogen TMDLs, First Edition. Washington, D.C.: Office of Water. EPA 841-R Available: U.S. Geological Survey Website Available: &referred_module=sw. 33
40 Appendices Appendix A.1: Summary of Monitoring Results for Fecal Coliform in Saint Joes Creek, Main Channel, WBID 1668A Station Sample Date Flow (cfs) Flow Rank Flow Rank (%) Fecal Coliform (CFU/100mL) Fecal Coliform Load (CFU/day) Remark Code 3/29/ % x 10 9 B 3/29/ % x 10 9 B 3/29/ % x /29/ % x /29/ % x /14/ % x B 6/14/ % x B 6/14/ % x B 6/14/ % x /20/ % x 10 8 K 9/20/ % x 10 9 B 9/20/ % x 10 9 B 9/20/ % x 10 9 B 9/20/ % x 10 9 B 9/22/ % x /15/ % x /15/ % x /15/ % x /15/ % x
41 Station TMDL Report: Saint Joes Creek, WBID 1668A, Springs Coast Basin, Fecal Coliform Sample Date Flow (cfs) Flow Rank Flow Rank (%) Fecal Coliform (CFU/100mL) Fecal Coliform Load (CFU/day) Remark Code 12/13/ % x 10 8 B 12/13/ % x 10 9 B 12/13/ % x 10 9 B 12/13/ % x 10 9 B 12/13/ % x 10 9 B 1/18/ % x 10 8 B 21FLPDEM /19/ % x FLPDEM /19/ % x FLPDEM /3/ % x 10 8 B 21FLPDEM /14/ % x 10 9 B 21FLPDEM /14/ % x 10 9 B 21FLPDEM /19/ % x 10 9 B 21FLPDEM /19/ % x 10 9 B 21FLPDEM /5/ % x FLPDEM /5/ % , x B 21FLPDEM /15/ % , x B 21FLPDEM /15/ % , x B 21FLPDEM /19/ % x FLPDEM /19/ % x FLPDEM /31/ % x FLPDEM /31/ % x FLPDEM /16/ % x 10 8 B 21FLPDEM /16/ % x 10 9 B 21FLPDEM /19/ % x 10 9 B 21FLPDEM /19/ % x FLPDEM /2/ % x 10 9 B 21FLPDEM /2/ % x FLPDEM /10/ % x FLPDEM /10/ % , x B 21FLPDEM /10/ % , x FLPDEM /10/ % , x J Note: Flow and concentration data analyzed for the TMDL were from March 2004 through May The Group 5 verification period is from January 1, 1999, through June 30, Flow data were from USGS Gage , located in WBID 1668A on Saint Joes Creek. Bold fecal coliform numbers indicate measurements that exceeded the 400 criteria.cfs cubic feet per second Remark Codes: B- Results based on colony counts outside the acceptable range J Estimated value K Actual value is known to be less than the value given 35
42 Station Appendix A.2: Summary of Monitoring Results for Fecal Coliform in Miles Creek, WBID 1668A Sample Date Estimated Flow (cfs) Flow Rank Flow Rank (%) Fecal Coliform (counts/100ml) Fecal Coliform Load (counts/day) 21FLPDEM /19/ % x FLPDEM /3/ % , x FLPDEM /14/ % x FLPDEM /19/ % x FLPDEM /5/ % x FLPDEM /15/ % , x B 21FLPDEM /19/ % x FLPDEM /31/ % x FLPDEM /16/ % x FLPDEM /19/ % x FLPDEM /2/ % x B 21FLPDEM /10/ % , x B Note: Flow and concentration data analyzed for the TMDL were from January 2005 through May The Group 5 verification period is from January 1, 1999, through June 30, Flow data was estimated using data from USGS Gage , located in WBID 1668A, on Saint Joes Creek. Bold fecal coliform numbers indicate measurements that exceeded the 400 criteria. Remark Codes: B- Results based on colony counts outside the acceptable range J Estimated value K Actual value is known to be less than the value given Remark Code 36
43 Appendix B: Background Information on Federal and State Stormwater Programs In 1982, Florida became the first state in the country to implement statewide regulations to address the issue of nonpoint source pollution by requiring new development and redevelopment to treat stormwater before it is discharged. The Stormwater Rule, as authorized in Chapter 403, F.S., was established as a technology-based program that relies on the implementation of BMPs that are designed to achieve a specific level of treatment (i.e., performance standards) as set forth in Rule 62-40, F.A.C. The rule requires the state s water management districts to establish stormwater pollutant load reduction goals (PLRGs) and adopt them as part of a Surface Water Improvement and Management (SWIM) plan, other watershed plan, or rule. Stormwater PLRGs are a major component of the load allocation part of a TMDL. To date, stormwater PLRGs have been established for Tampa Bay, Lake Thonotosassa, the Winter Haven Chain of Lakes, the Everglades, Lake Okeechobee, and Lake Apopka. In 1987, the U.S. Congress established Section 402(p) as part of the federal Clean Water Act Reauthorization. This section of the law amended the scope of the federal NPDES permitting program to designate certain stormwater discharges as point sources of pollution. The EPA promulgated regulations and began the implementation of the Phase I NPDES stormwater program in These stormwater discharges include certain discharges that are associated with industrial activities designated by specific standard industrial classification (SIC) codes, construction sites disturbing 5 or more acres of land, and master drainage systems of local governments with a population above 100,000, which are better known as MS4s. However, because the master drainage systems of most local governments in Florida are interconnected, the EPA implemented Phase I of the MS4 permitting program on a countywide basis, which brought in all cities (incorporated areas), Chapter 298 urban water control districts, and FDOT throughout the 15 counties meeting the population criteria. FDEP received authorization to implement the NPDES stormwater program in An important difference between the NPDES and other state stormwater permitting programs is that the NPDES Program covers both new and existing discharges, while the other state programs focus on new discharges. Additionally, Phase II of the NPDES Program, implemented in 2003, expands the need for these permits to construction sites between 1 and 5 acres, and to local governments with as few as 1,000 people. While these urban stormwater discharges are now technically referred to as point sources for the purpose of regulation, they are still diffuse sources of pollution that cannot be easily collected and treated by a central treatment facility, as are other point sources of pollution such as domestic and industrial wastewater discharges. It should be noted that all MS4 permits issued in Florida include a reopener clause that allows permit revisions to implement TMDLs when the implementation plan is formally adopted. 37
 245-8555 http://www.dep.state.fl.")
44 Division of Water Resource Management Bureau of Watershed Management 2600 Blair Stone Road, Mail Station 3565 Tallahassee, Florida (850)
Fecal and Total Coliform TMDL for Sparkman Branch (WBID 1561)
") FINAL FLORIDA DEPARTMENT OF ENVIRONMENTAL PROTECTION Division of Water Resource Management, Bureau of Watershed Management Southwest DISTRICT Tampa Bay BASIN TMDL Report Fecal and Total Coliform TMDL for
FINAL FLORIDA DEPARTMENT OF ENVIRONMENTAL PROTECTION Division of Water Resource Management, Bureau of Watershed Management Southwest DISTRICT Tampa Bay BASIN TMDL Report Fecal and Total Coliform TMDL for
FLORIDA DEPARTMENT OF ENVIRONMENTAL PROTECTION. Division of Environmental Assessment and Restoration, Bureau of Watershed Restoration
 FLORIDA DEPARTMENT OF ENVIRONMENTAL PROTECTION Division of Environmental Assessment and Restoration, Bureau of Watershed Restoration NORTHWEST DISTRICT PENSACOLA BAY BASIN FINAL TMDL Report Fecal Coliform
Total Coliform and Fecal Coliform TMDL for Lower Sweetwater Creek (WBID 1570A)
") FINAL FLORIDA DEPARTMENT OF ENVIRONMENTAL PROTECTION Division of Water Resource Management, Bureau of Watershed Management SOUTHWEST DISTRICT TAMPA BAY BASIN TMDL Report Total Coliform and Fecal Coliform
FINAL FLORIDA DEPARTMENT OF ENVIRONMENTAL PROTECTION Division of Water Resource Management, Bureau of Watershed Management SOUTHWEST DISTRICT TAMPA BAY BASIN TMDL Report Total Coliform and Fecal Coliform
Fecal Coliform TMDL for Strawberry Creek (WBID 2239)
") FLORIDA DEPARTMENT OF ENVIRONMENTAL PROTECTION Division of Environmental Assessment and Restoration, Bureau of Watershed Restoration NORTHEAST DISTRICT LOWER ST. JOHNS BASIN Final TMDL Report Fecal Coliform
FLORIDA DEPARTMENT OF ENVIRONMENTAL PROTECTION Division of Environmental Assessment and Restoration, Bureau of Watershed Restoration NORTHEAST DISTRICT LOWER ST. JOHNS BASIN Final TMDL Report Fecal Coliform
CITY OF LYNDEN STORMWATER MANAGEMENT PROGRAM REPORT MARCH 1, 2016
 CITY OF LYNDEN STORMWATER MANAGEMENT PROGRAM 2015 WATER QUALITY MONITORING REPORT CITY OF LYNDEN 300 4 TH STREET LYNDEN, WASHINGTON 98264 PHONE (360) 354-3446 MARCH 1, 2016 This document serves as an attachment
Lower St. Johns River Tributaries Fecal Coliform Basin Management Action Plan Jacksonville Environmental Symposium
 Lower St. Johns River Tributaries Fecal Coliform Basin Management Action Plan Jacksonville Environmental Symposium WBIDs Addressed in This BMAP This BMAP includes 10 of the 75 (cycle 2) fecal coliform
North Carolina Addendum Total Maximum Daily Load (TMDL) for Impaired Segments in the Dan River Watershed to Virginia TMDLs Approved by EPA Region 3
 for Impaired Segments in the Dan River Watershed to Virginia TMDLs Approved by EPA Region 3") North Carolina Addendum Total Maximum Daily Load (TMDL) for Impaired Segments in the Dan River Watershed to Virginia TMDLs Approved by EPA Region 3 Assessment units (AU) for the Dan River, 22-(39)b and
North Carolina Addendum Total Maximum Daily Load (TMDL) for Impaired Segments in the Dan River Watershed to Virginia TMDLs Approved by EPA Region 3 Assessment units (AU) for the Dan River, 22-(39)b and
Statistical Evaluation of BMP Effectiveness in Reducing Fecal Coliform Impairment in Mermentau River Basin
 Statistical Evaluation of BMP Effectiveness in Reducing Fecal Coliform Impairment in Mermentau River Basin Z.-Q. Deng 1 and H. Chowdhary 2 1 Assistant Professor, Department of Civil and Environmental Engineering,
Assessment of Pathogen Strategies
 Assessment of Pathogen Strategies Bacteria levels in receiving waters are a primary concern for federal, state, and local agencies. The primary sources of bacteria are generally attributed to combined
Water Quality Trends for Patchogue Bay
 Water Quality Trends for Patchogue Bay 2018 This report summarizes water quality data for fecal coliform and total coliform in Patchogue Bay for the years 2003-2017. Prepared by: Brian M. McCaffrey Stormwater
Meeting Agenda. Why are we here? Getting Started. Designated Uses. Water Quality Standards
 Upper Basin Total Maximum Daily Load Study and Rapidan Technical Advisory Committee Meetings July 27, Meeting Agenda Water Quality Assessments and TMDL Process Bryant Thomas, VA DEQ Overview of 16 TMDL
FECAL COLIFORM MONITORING IN GRAYS HARBOR COUNTY: SUMMARY REPORT OF MONITORING RESULTS FOR
 Chehalis Basin Partnership Fecal Coliform Monitoring in Grays Harbor County: Summary Report of Monitoring Results for 2000-2003 Draft June 30, 2003 Prepared by Tetra Tech/KCM, Inc. 1917 First Avenue, Seattle,
Tufts University Water: Systems, Science, and Society (WSSS) Program
 Program") To: From: John Foster, Elbow Cay, the Bahamas; Friends of the Environment, Marsh Harbor, the Bahamas Alex Bedig, Amanda Garfield, Shonda Gaylord, Jack Melcher, Melissa Ng, Nathan Rawding, Kendall Webster,
To: From: John Foster, Elbow Cay, the Bahamas; Friends of the Environment, Marsh Harbor, the Bahamas Alex Bedig, Amanda Garfield, Shonda Gaylord, Jack Melcher, Melissa Ng, Nathan Rawding, Kendall Webster,
Water Quality Trends for Conscience Bay
 Water Quality Trends for Conscience Bay 2018 This report summarizes water quality data for fecal coliform and total coliform in Conscience Bay for the years 1998-2018. Prepared by: Brian M. McCaffrey Stormwater
City of Peoria Clean Water Efforts. Governor s s Conference on the Management of the Illinois River October 4, 2007
 City of Peoria Clean Water Efforts Governor s s Conference on the Management of the Illinois River October 4, 2007 1 What do you call dinner and a movie with an unemployed guy? An unfunded man-date! 2
ASSESSMENT OF FECAL COLIFORM IN LITTLE RABBIT CREEK AND LITTLE SURVIVAL CREEK
 ASSESSMENT OF FECAL COLIFORM IN LITTLE RABBIT CREEK AND LITTLE SURVIVAL CREEK FINAL REPORT Prepared for: Alaska Department of Environmental Conservation 555 Cordova Street Anchorage, Alaska 99501 Prepared
Fourth Creek (Subbasin ) Yadkin-Pee Dee River Basin North Carolina
 Yadkin-Pee Dee River Basin North Carolina") Final Total Maximum Daily Load (TMDL) for Fecal Coliform October 2001 Fourth Creek (Subbasin 03-07-06) Yadkin-Pee Dee River Basin North Carolina Prepared by: NC Department of Environment and Natural Resources
Final Total Maximum Daily Load (TMDL) for Fecal Coliform October 2001 Fourth Creek (Subbasin 03-07-06) Yadkin-Pee Dee River Basin North Carolina Prepared by: NC Department of Environment and Natural Resources
Fecal Coliform Bacteria Monitoring for the Sleepy Creek Watershed Incremental 319 Project Final Report
 Fecal Coliform Bacteria Monitoring for the Sleepy Creek Watershed Incremental 319 Project Final Report Prepared for: West Virginia Conservation Agency Prepared by: Cacapon Institute Back Creek Road PO
Exploring Drivers of Fecal Coliform Pollution Trends in the Puget Sound. Washington Commercial Shellfish
 9/22/2016 Exploring Drivers of Fecal Coliform Pollution Trends in the Puget Sound Authors: Lindsey Hamilton, Scott Berbells, Lawrence Sullivan, Jean Snyder Washington State Department of Health Washington
RE: PATAHA CREEK FECAL COLIFORM COMPLIANCE WITH WATER QUALITY STANDARDS
 To: WRIA 35 Planning Committee Memo From: Jory Oppenheimer and Kari Vigerstol Project: WRIA 35 Level II Water Quality CC: Ben Floyd, HDR/EES; John Koreny, HDR/EES Date: March 10, 2005 Job No: 22592 RE:
Pathogens and Grazing Livestock
 Pathogens and Grazing Livestock Steve Ensley DVM, PhD 10/16/09 Water Borne Pathogens This presentation will have a specific emphasis on water borne pathogens. NUMBERS OF IOWA WATER SOURCES WITH Stream/River
SUTTER COUNTY. General Plan Update Technical Background Report
 SUTTER COUNTY General Plan Update Technical Background Report February 2008 SUTTER COUNTY GENERAL PLAN UPDATE TECHNICAL BACKGROUND REPORT PREPARED FOR: SUTTER COUNTY PREPARED BY: PBS&J IN PARTNERSHIP
Total Maximum Daily Loads of Bacteria for Poquoson River and Back Creek in the City of Poquoson and in York County, Virginia
 Total Maximum Daily Loads of Bacteria for Poquoson River and Back Creek in the City of Poquoson and in York County, Virginia VIRGINIA DEPARTMENT OF ENVIRONMENTAL QUALITY 629 East Main Street Richmond,
PREFACE. Service frequency; Hours of service; Service coverage; Passenger loading; Reliability, and Transit vs. auto travel time.
 PREFACE The Florida Department of Transportation (FDOT) has embarked upon a statewide evaluation of transit system performance. The outcome of this evaluation is a benchmark of transit performance that
FECAL COLIFORM BACTERIA SUMMARY SHEET
 FECAL COLIFORM BACTERIA SUMMARY SHEET WATERBODY: Greybull River (Tributary to Big Horn River) (WYBH10080009) REACH DESCRIPTION: Confluence wi e Big Horn River upstream to Meeteetse, Wyoming. BACKGROUND:
Portland Water District Sebago Lake Monitoring Programs Lower Bay Bacteria Monitoring Presenting data from 1977 to 2018 Laurel Jackson
 Portland Water District Sebago Lake Monitoring Programs Lower Bay Bacteria Monitoring Presenting data from 1977 to 2018 Laurel Jackson Introduction Sebago Lake is the primary drinking water supply for
Figure 1. Overview map of Burrard Inlet, showing location of False Creek inlet.
 Figure 1. Overview map of Burrard Inlet, showing location of False Creek inlet. 65 Figure 2. Location map of False Creek and shoreline and mid-channel monitoring sites. 66 Figure 3. Location of CSO's,
Finding sources of fecal coliform bacteria in stormwater runoff
 Finding sources of fecal coliform bacteria in stormwater runoff David Tomasko, Ph.D. May 12, 2016 Why the concern over bacteria? Cholera Tens of millions killed over the centuries > 100,000 Americans 11
ES Aircraft Deicing Document Identification Number Date: March 15, ) Activity Description:
 Activity Description:") ES-301-1.06 Aircraft Deicing Document Identification Number ES-301-1.06 Date: March 15, 2018 Document Owner: Keith Pass 1) Activity Description: Aircraft deicing is the application of aircraft deicing
ES-301-1.06 Aircraft Deicing Document Identification Number ES-301-1.06 Date: March 15, 2018 Document Owner: Keith Pass 1) Activity Description: Aircraft deicing is the application of aircraft deicing
DIDYMO SURVEY, LOWER FRYINGPAN RIVER, BASALT, COLORADO 2015
 DIDYMO SURVEY, LOWER FRYINGPAN RIVER, BASALT, COLORADO 2015 Second Annual Report PREPARED FOR: ROARING FORK CONSERVANCY PREPARED BY: COLORADO MOUNTAIN COLLEGE NATURAL RESOURCE MANAGEMENT PROGRAM TIMBERLINE
Effluent Guidelines for Airport Deicing Discharges
 Effluent Guidelines for Airport Deicing Discharges Airports Council International and Airlines for America s Deicing Management Conference May 23, 2012 ELG Background Effluent limitations guidelines and
COMMONWEALTH OF VIRGINIA STATE AIR POLLUTION CONTROL BOARD REGULATIONS FOR THE CONTROL AND ABATEMENT OF AIR POLLUTION
 COMMONWEALTH OF VIRGINIA STATE AIR POLLUTION CONTROL BOARD REGULATIONS FOR THE CONTROL AND ABATEMENT OF AIR POLLUTION 9 VAC 5 CHAPTER 40. EXISTING STATIONARY SOURCES. PART II. Emission Standards. ARTICLE
The north half of Section 18, Township 37 North, Range 6 East, Second Principal Meridian, Jefferson Township, Elkhart County, Indiana; also,
 The north half of Section 18, Township 37 North, Range 6 East, Second Principal Meridian, Jefferson Township, Elkhart County, Indiana; also, The east half of Sections 21, 28, and 33, Township 37 North,
Paul Sturm Roberto Viqueira Ríos
 Paul Sturm Roberto Viqueira Ríos In this talk Brief Background on Land Based Sources Historical Perspective Guánica watershed characteristics/ issues High priority restoration projects Other key issues
VI. ALTERNATIVES TO THE MASTER PLAN C. RENOVATED EAST BUILDING ALTERNATIVE
 VI. ALTERNATIVES TO THE MASTER PLAN C. RENOVATED EAST BUILDING ALTERNATIVE INTRODUCTION The Renovated East Building Alternative would include the continued use of the renovated West Building and the renovation
The Evolution of DFW Airport s Deicing Program Balancing Risks with Results MAY 20, 2015
 Dallas/Fort Worth International Airport The Evolution of DFW Airport s Deicing Program Balancing Risks with Results MAY 20, 2015 DFW: Connecting The World The cities of Dallas and Fort Worth overcame politics
Flying Cloud Airport (FCM) Zoning Process: Informing a Mn/DOT Path Forward
 Zoning Process: Informing a Mn/DOT Path Forward") : Informing a Mn/DOT Path Forward A Review of the Flying Cloud Airport (FCM) Joint Airport Zoning Board (JAZB) Process and the Draft Airport Zoning Ordinance B A RPZ RPZ A B C Zone Chad E. Leqve Director
: Informing a Mn/DOT Path Forward A Review of the Flying Cloud Airport (FCM) Joint Airport Zoning Board (JAZB) Process and the Draft Airport Zoning Ordinance B A RPZ RPZ A B C Zone Chad E. Leqve Director
Via Only. In reply refer to/attn: Place ID:794813:ERyan
 California Regional Water Quality Control Board, San Diego Region May 5, 2016 Via Email Only Mr. Richard Boon, Chief Orange County Stormwater Program OC Public Works 2301 N. Glassell Street Orange, CA
Town of Oakfield Agricultural and Farmland Protection Plan
 SECTION III COMMUNITY OVERVIEW A. Regional Setting / Location The Town of Oakfield is located in the northwestern portion of Genesee County. Located west of New York's Finger Lakes, the Town is uniquely
FINAL Water Year 2012 Bacteria Sampling Report for the Klamath River Estuary
 FINAL Water Year 2012 Bacteria Sampling Report for the Klamath River Estuary Prepared by: Patrick Fox Yurok Tribe Environmental Program April 2013 Acknowledgements The Yurok Tribe Environmental Program
Appendix G: Summary of Microbial Source Tracking Studies in Southern California
 Appendix G: Summary of Microbial Source Tracking Studies in Southern California s Indicators/ Analyzed 2003-2004 Mission Bay MEC / Weston Bay, MS4, General Bacteroides by PCR Human Bacteroides by PCR Ribotyping
SAMTRANS TITLE VI STANDARDS AND POLICIES
 SAMTRANS TITLE VI STANDARDS AND POLICIES Adopted March 13, 2013 Federal Title VI requirements of the Civil Rights Act of 1964 were recently updated by the Federal Transit Administration (FTA) and now require
Evaluation copy. Fecal Coliform. Computer INTRODUCTION
 Fecal Coliform Computer 9 INTRODUCTION The concentration of fecal coliform bacteria in water is measured to determine the likelihood of contamination by microbiological organisms. While fecal coliform
Brevard County Utility Services Department
 Brevard County Utility Services Department April 3, 2018 Jim Helmer, Department Director Brian Sorensen, W/WW Manager 1 Utility Services Department 9 TREATMENT PLANTS 6 WASTEWATER, 3 WATER 163 EMPLOYEES
White Oak Creek. Recreational Use Attainability Analysis Summary of Findings. Texas Institute for Applied Environmental Research Stephenville, Texas
 White Oak Creek Recreational Use Attainability Analysis Summary of Findings Texas Institute for Applied Environmental Research Stephenville, Texas August 8, 2016 Sulphur Springs, Texas August 9, 2016 Mount
Rule Governing the Designation and Establishment of All-Terrain Vehicle Use Trails on State Land
 Rule Governing the Designation and Establishment of All-Terrain Vehicle Use Trails on State Land 1.0 Authority 1.1 This rule is promulgated pursuant to 23 V.S.A. 3506. Section 3506 (b)(4) states that an
Clean Ocean Access Water Quality Monitoring Summary Report
 Clean Ocean Access 2008-2017 Water Quality Monitoring Summary Report CONTRIBUTING AUTHORS: Eva Touhey, Program Manager, Clean Ocean Access Jessica Frascotti, Program Coordinator, Clean Ocean Access Dave
MANAGING FRESHWATER INFLOWS TO ESTUARIES
 MANAGING FRESHWATER INFLOWS TO ESTUARIES Yuna River Hydrologic Characterization A. Warner Warner, A. (2005). Yuna River Hydrologic Characterization. University Park, Pennsylvania: The Nature Conservancy.
Analysis of Indicator Bacteria in NJ Dead-end Lagoons. Michael Callaghan Gasbarro Mentor: Dr. Kathryn Goddard
 Analysis of Indicator Bacteria in NJ Dead-end Lagoons Michael Callaghan Gasbarro Mentor: Dr. Kathryn Goddard Delaware Valley Estuary Summit Session 20: January 28, 2015 Dead-end Canals or Lagoons Popular
Fecal Coliform Total Maximum Daily Load (TMDL) - North Branch of the Sunrise River Final Report
 - North Branch of the Sunrise River Final Report") Fecal Coliform Total Maximum Daily Load (TMDL) - North Branch of the Sunrise River Final Report Minnesota Pollution Control Agency Chisago County December 2006 wq-iw6-01e 1 Fecal Coliform Total Maximum
Fecal Coliform Total Maximum Daily Load (TMDL) - North Branch of the Sunrise River Final Report Minnesota Pollution Control Agency Chisago County December 2006 wq-iw6-01e 1 Fecal Coliform Total Maximum
International Osoyoos Lake Board of Control Annual Report to the International Joint Commission
 International Osoyoos Lake Board of Control 2013 Annual Report to the International Joint Commission TABLE OF CONTENTS ACTIVITIES OF THE BOARD... 1 HYDROLOGIC CONDITIONS IN 2013... 2 Drought Criteria...
The Economic Contributions of Agritourism in New Jersey
 The Economic Contributions of Agritourism in New Jersey Bulletin E333 Cooperative Extension Brian J. Schilling, Extension Specialist in Agricultural Policy Kevin P. Sullivan, Institutional Research Analyst
DEPARTMENT OF NATURAL RESOURCE PROTECTION TECHNICAL REPORT SERIES TR: 95-02
 DEPARTMENT OF NATURAL RESOURCE PROTECTION TECHNICAL REPORT SERIES TR: 95-02 SUMMARY OF BACTERIOLOGICAL TESTING IN THE LAS OLAS ISLES AUGUST 1994 THROUGH AUGUST 1995 ENVIRONMENTAL MONITORING DIVISION WATER
SECTION 3 GENERAL DESCRIPTION OF THE RIVER BASIN
 SECTION 3 GENERAL DESCRIPTION OF THE RIVER BASIN SECTION 3 GENERAL DESCRIPTION OF THE RIVER BASIN River basin description. A general description of the river basin or subbasin, as appropriate, in which
Revealed Preference Methods
 Revealed Preference Methods New Bedford New Bedford Harbor is a major commercial fishing port and industrial center in southeastern Massachusetts on Buzzards Bay. From the 1940s to the 1970s, electrical
METROBUS SERVICE GUIDELINES
 METROBUS SERVICE GUIDELINES In the late 1990's when stabilization of bus service was accomplished between WMATA and the local jurisdictional bus systems, the need for service planning processes and procedures
Loyalsock Creek Bacterial Coliforms. Presented By: Dr. Mel Zimmerman Clean Water Institute Lycoming College Matthew Bennett Jim Rogers
 Loyalsock Creek Bacterial Coliforms Presented By: Dr. Mel Zimmerman Clean Water Institute Lycoming College Matthew Bennett Jim Rogers What is E. coli? Short for Escherichia coli (a bacteria) It is a
Parkland County Municipal Development Plan Amendment Acheson Industrial Area Structure Plan
 Parkland County Municipal Development Plan Amendment Acheson Industrial Area Structure Plan New Plan Acheson Industrial Area Structure Plan Amendment Parkland County Municipal Development Plan Board Reference
Appendix B Ultimate Airport Capacity and Delay Simulation Modeling Analysis
 Appendix B ULTIMATE AIRPORT CAPACITY & DELAY SIMULATION MODELING ANALYSIS B TABLE OF CONTENTS EXHIBITS TABLES B.1 Introduction... 1 B.2 Simulation Modeling Assumption and Methodology... 4 B.2.1 Runway
Cruise Industry Perspective on OWS and Waste Management
 Cruise Industry Perspective on OWS and Waste Management MAX1 OWS Studies Conference Wilmington, NC, 24 June 2015 James R. Van Langen, P.E. Environmental, Safety, Quality & Sustainability Consultant Cruise
Hydrological study for the operation of Aposelemis reservoir Extended abstract
 Hydrological study for the operation of Aposelemis Extended abstract Scope and contents of the study The scope of the study was the analytic and systematic approach of the Aposelemis operation, based on
PERFORMANCE MEASURE INFORMATION SHEET #16
 PERFORMANCE MEASURE INFORMATION SHEET #16 ARROW LAKES RESERVOIR: RECREATION Objective / Location Recreation/Arrow Lakes Reservoir Performance Measure Access Days Units Description MSIC 1) # Access Days
LAKE HURON BEACH STUDY
 LAKE HURON BEACH STUDY A microbiological water quality evaluation of Grand Bend Beach and related pollution sources in 1985 Ministry of the Environment D.A. McTavish Director Southwestern Region Copyright
Recreational Use Attainability Analysis Summary of Findings & Public Comment
 The Neches River Above Lake Palestine, Prairie Creek, Mud Creek, and West Mud Creek Recreational Use Attainability Analysis Summary of Findings & Public Comment Texas Institute for Applied Environmental
IMPACT OF WASTE WATER TREATMENTS ON REMOVAL OF NOROVIRUSES FROM SEWAGE. 1 March 2012
 IMPACT OF WASTE WATER TREATMENTS ON REMOVAL OF NOROVIRUSES FROM SEWAGE 1 March 2012 Impact of wastewater treatments on removal of noroviruses from sewage defra project reference WT0924 Elaine Connolly,
Introduction. The System. Model Limitations, Assumptions, and Parameters. Optional Services Tech Memo
 Optional Services Tech Memo Introduction This technical memo evaluates the impact of a tide gate to be installed at the confluence of the Left Bank Tributary of Thalia Creek and Lake Windsor. Specifically,
Chapter 4.0 Alternatives Analysis
 Chapter 4.0 Alternatives Analysis Chapter 1 accumulated the baseline of existing airport data, Chapter 2 presented the outlook for the future in terms of operational activity, Chapter 3 defined the facilities
Estimating the Risk of a New Launch Vehicle Using Historical Design Element Data
 International Journal of Performability Engineering, Vol. 9, No. 6, November 2013, pp. 599-608. RAMS Consultants Printed in India Estimating the Risk of a New Launch Vehicle Using Historical Design Element
Classifications, Inventory and Level of Service
 Classifications, Inventory and Level of Service Section 3 Kenmore Park, Recreation and Open Space Plan 1 P a g e Classifications and Inventory Park Classifications Kenmore classifies its parks based upon
DRAFT GENERAL IMPLEMENTATION PLAN AND SPECIFIC IMPLEMENTATION PLAN MIDDLETON MUNICIPAL AIRPORT MOREY FIELD. Revised 12/12/03
 DRAFT GENERAL IMPLEMENTATION PLAN AND SPECIFIC IMPLEMENTATION PLAN MIDDLETON MUNICIPAL AIRPORT MOREY FIELD Revised 12/12/03 As recommended for approval by the Plan Commission General Project Description
Draft Concept Alternatives Analysis for the Inaugural Airport Program September 2005
 Section 10 Preferred Inaugural Airport Concept 10.0 Introduction The Preferred Inaugural Airport Concept for SSA was developed by adding the preferred support/ancillary facilities selected in Section 9
PURPOSE AND NEED. Introduction
 Public Scoping: Allocation of Recreation Capacity for Commercial Outfitter Guide Services on North Kruzof Island Trails (Kruzof Island Outfitter Guide) PURPOSE AND NEED Introduction The U.S. Department
U.S. Forest Service National Minimum Protocol for Monitoring Outstanding Opportunities for Solitude
 U.S. Forest Service National Minimum Protocol for Monitoring Outstanding Opportunities for Solitude Element 5 of the 10-Year Wilderness Stewardship Challenge May 15, 2014 1 Solitude Minimum Protocol Version
Pinellas County Environmental Lands
 Pinellas County Environmental Lands In addition to traditional parks and recreation facilities, Pinellas County owns and manages a system of environmental lands that provides specialized resource-based
Welcome KROSNO CREEK DIVERSION PROJECT CLASS ENVIRONMENTAL ASSESSMENT
 Welcome KROSNO CREEK DIVERSION PROJECT PUBLIC INFORMATION CENTRE # 1 Tonight s Presentation Study Overview Background Existing Conditions Alternative Solutions Preliminary Preferred Solution Next Steps
Staff Report of Oakland Bay Activities 10/1/08 to 12/31/08. 1/15/09 Stephanie Kenny. Funded through Consolidated Contract # C14956
 Staff Report of Oakland Bay Activities 10/1/08 to 12/31/08 1/15/09 Stephanie Kenny Funded through Consolidated Contract # C14956 Citizens looking at some of the displays during the Oakland Bay open house
CHAPTER 6 NOISE EXPOSURE
 CHAPTER 6 NOISE EXPOSURE FAA requires that the NEM submitted for review represent the aircraft noise exposure for the year of submittal (in this case 2008) and for a future year (2013 for OSUA). However,
2004 SOUTH DAKOTA MOTEL AND CAMPGROUND OCCUPANCY REPORT and INTERNATIONAL VISITOR SURVEY
 2004 SOUTH DAKOTA MOTEL AND CAMPGROUND OCCUPANCY REPORT and INTERNATIONAL VISITOR SURVEY Prepared By: Center for Tourism Research Black Hills State University Spearfish, South Dakota Commissioned by: South
UNDERSTANDING TOURISM: BASIC GLOSSARY 1
 UNDERSTANDING TOURISM: BASIC GLOSSARY 1 Tourism is a social, cultural and economic phenomenon related to the movement of people to places outside their usual place of residence pleasure being the usual
International Osoyoos Lake Board of Control Annual Report to the International Joint Commission
 International Osoyoos Lake Board of Control 2010 Annual Report to the International Joint Commission TABLE OF CONTENTS ACTIVITIES OF THE BOARD... 1 HYDROLOGIC CONDITIONS IN 2010... 2 Drought Criteria...
Version Isolated & Non-Waters Only 1 of 3
 APPROVED JURISDICTIONAL DETERMINATION FORM U.S. Army Corps of Engineers SECTION I: BACKGROUND INFORMATION A. REPORT COMPLETION DATE FOR APPROVED JURISDICTIONAL DETERMINATION (JD): July 6, 2010. B. DISTRICT
INVESTIGATION OF NONPOINT POLLUTION SOURCES IMPACTING SHELLFISH GROWING AREAS IN TOMALES BAY,
 TOMALES BAY SHELLFISH TECHNICAL ADVISORY COMMITTEE FINAL REPORT: INVESTIGATION OF NONPOINT POLLUTION SOURCES IMPACTING SHELLFISH GROWING AREAS IN TOMALES BAY, 995-96 December 2000 Tomales Bay Shellfish
LESOTHO HIGHLANDS DEVELOPMENT AUTHORITY
 LESOTHO HIGHLANDS DEVELOPMENT AUTHORITY ANNUAL FLOW RELEASES INSTREAM FLOW REQUIREMENT (IFR) IMPLEMENTATION AND MONITORING (October 2004 to September 2005) TOWER ON MALIBAMATŠO RIVER @ KAO REPORT N0.6
COUNTY SANITATION DISTRICT NO. 8 SERVICE CHARGE REPORT FOR FISCAL YEAR
 COUNTY SANITATION DISTRICT NO. 8 SERVICE CHARGE REPORT FOR FISCAL YEAR 2017-18 INTRODUCTION County Sanitation District No. 8 of Los Angeles County encompasses all or portions of the cities of Carson, Compton,
Annex 1 to letter 0426(DPRM.REM)1035 of 16 April I. Articles 28 and 29 of the UPU Convention. Article 28 Terminal dues. General provisions
1035 of 16 April I. Articles 28 and 29 of the UPU Convention. Article 28 Terminal dues. General provisions") Annex 1 to letter 0426(DPRM.REM)1035 of 16 April 2018 I. Articles 28 and 29 of the UPU Convention Article 28 Terminal dues. General provisions 1 Subject to exemptions provided in the Regulations, each
Annex 1 to letter 0426(DPRM.REM)1035 of 16 April 2018 I. Articles 28 and 29 of the UPU Convention Article 28 Terminal dues. General provisions 1 Subject to exemptions provided in the Regulations, each
COUNTY SANITATION DISTRICT NO. 19 SERVICE CHARGE REPORT FOR FISCAL YEAR
 COUNTY SANITATION DISTRICT NO. 19 SERVICE CHARGE REPORT FOR FISCAL YEAR 2018-19 INTRODUCTION County Sanitation District No. 19 of Los Angeles County encompasses all or portions of the cities of Artesia,
Permittees under Sector S are primarily engaged in the following types of activities:
 S. Air Transportation 1. Authorized Stormwater Discharges The requirements in Sector S apply to stormwater discharges associated with industrial activity from air transportation facilities as identified
Hydrology Input for West Souris River IWMP
 Hydrology Input for West Souris River IWMP Prepared by: Mark Lee Manitoba Water Stewardship 1 1 1 Overall view of: drainage area watershed characteristics gauging stations meteorological stations Runoff
Section II. Planning & Public Process Planning for the Baker/Carver Regional Trail began in 2010 as a City of Minnetrista initiative.
 Section II Planning & Public Process Planning for the began in 2010 as a City of initiative. city staff began discussions with the Park District on the possibility of a north/south regional trail connection
CRUISE TABLE OF CONTENTS
 CRUISE FLIGHT 2-1 CRUISE TABLE OF CONTENTS SUBJECT PAGE CRUISE FLIGHT... 3 FUEL PLANNING SCHEMATIC 737-600... 5 FUEL PLANNING SCHEMATIC 737-700... 6 FUEL PLANNING SCHEMATIC 737-800... 7 FUEL PLANNING SCHEMATIC
EU GPP CRITERIA FOR INDOOR CLEANING SERVICES 1. INTRODUCTION
 EU GPP CRITERIA FOR INDOOR CLEANING SERVICES (please note that this document is a compilation of the criteria proposed in the 3 rd Technical Report, which should be consulted for a full understanding of
Technical Report. Aircraft Overflight and Noise Analysis. Brisbane, California. December Prepared by:
 Aircraft Noise Abatement Office Technical Report Aircraft Overflight and Noise Analysis Brisbane, California Prepared by: P.O. Box 8097 San Francisco, California 94128 (650) 821-5100 Introduction In response
COUNTY SANITATION DISTRICT NO. 19 SERVICE CHARGE REPORT FOR FISCAL YEAR
 COUNTY SANITATION DISTRICT NO. 19 SERVICE CHARGE REPORT FOR FISCAL YEAR 2017-18 INTRODUCTION County Sanitation District No. 19 of Los Angeles County encompasses all or portions of the cities of Artesia,
Airport Profile. St. Pete Clearwater International BY THE NUMBERS 818, ,754 $ Enplanements. Passengers. Average Fare. U.S.
 Airport Profile St. Pete Clearwater International St. Pete-Clearwater International Airport (PIE) is located in Pinellas County, Florida about nine miles north of downwn St. Petersburg, seven miles southeast
CHAPTER III: TRAIL DESIGN STANDARDS, SPECIFICATIONS & PERMITS
 CHAPTER III Trail Design Standards, Specifications & Permits This chapter discusses trail standards, preferred surface types for different activities, permits, and other requirements one must consider
ANNUAL REPORT DALLAS LOVE FIELD AIRPORT. April 23, 2008
 ANNUAL REPORT DALLAS LOVE FIELD AIRPORT April 23, 2008 I. INTRODUCTION On August 14, 2006, the Texas Commission on Environmental Quality (TCEQ) signed and published the final version of the Texas Pollutant
ANNUAL REPORT DALLAS LOVE FIELD AIRPORT. March 14, 2006
 ANNUAL REPORT DALLAS LOVE FIELD AIRPORT March 14, 2006 I. INTRODUCTION On August 20, 2001, the Texas Commission on Environmental Quality (TCEQ) signed and published the final version of the Texas Pollutant
Wilderness Areas Designated by the White Pine County bill
 Wilderness Areas Designated by the White Pine County bill SEC. 321. SHORT TITLE. This subtitle may be cited as the `Pam White Wilderness Act of 2006'. SEC. 322. FINDINGS. Congress finds that-- The White
DISTRICT EXPRESS LANES ANNUAL REPORT FISCAL YEAR 2017 JULY 1, 2016 JUNE 30, FloridaExpressLanes.com
 DISTRICT EXPRESS LANES ANNUAL REPORT FISCAL YEAR 2017 JULY 1, 2016 JUNE 30, 2017 FloridaExpressLanes.com This page intentionally left blank. TABLE OF CONTENTS List of Figures... ii List of Tables.... ii
Spatial Distribution and Characteristics of At-Risk Species in the Southeast U.S.
 Nicholas Institute for Environmental Policy Solutions Scoping Document Part 2 Exploratory Analysis of Characteristics and Trends of At-Risk Species in the Southeast U.S. Spatial Distribution and Characteristics