Agenda. 1. Reduce Airline Cost. 2. Develop Airport Related Businesses. 3. Provide Customer Friendly Facilities and Services. 4. Expand Air Service
|
|
|
- Bertina Gibbs
- 5 years ago
- Views:
Transcription
1 O N T
2 Agenda 1. Reduce Airline Cost 2. Develop Airport Related Businesses 3. Provide Customer Friendly Facilities and Services 4. Expand Air Service
3 Agenda 1. Reduce Airline Cost

4 Reduce Airline Cost

5 Reduce Airline Cost
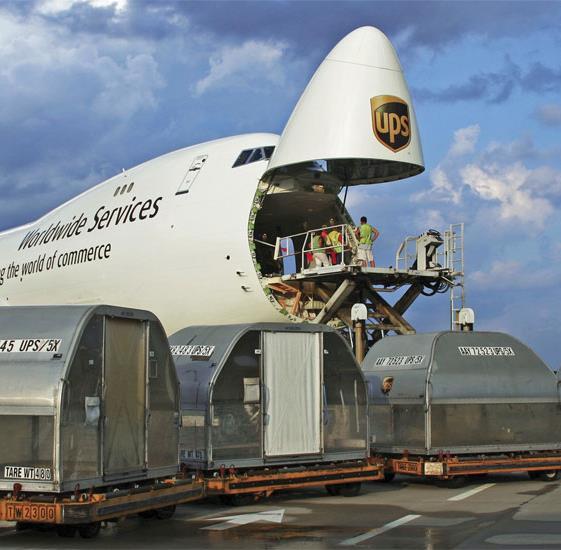
6 Agenda 2. Develop Airport Related Businesses

7 Building a Plan

8 Building a Plan

9 Building a Plan

10 Building a Plan

11 Building a Plan
12 Agenda 3. Provide Customer Friendly Facilities and Services

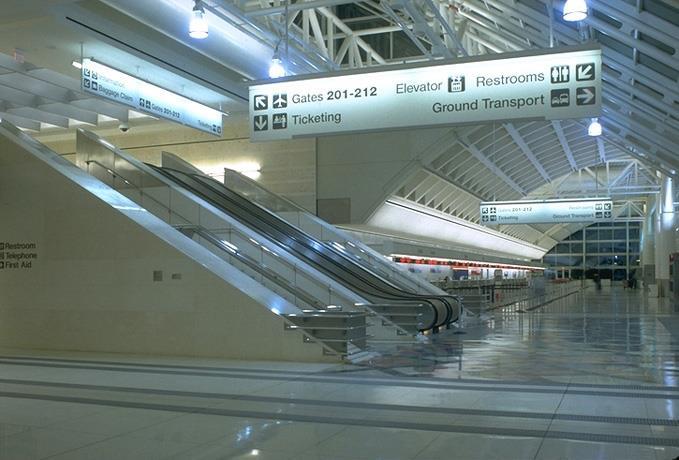


13 Provide Customer Friendly Facilities and Services
14 Agenda 4. Expand Air Service
15 Ontario is the Most Convenient Airport For a Large Part of the Los Angeles Region

16 Over Five Million People Within Two Hours of ONT Live Closer to ONT than Any Other Airport Note: Shaded Area Represents 2 Hour Drive Around ONT Closest to BUR Closest to ONT Closest to LAX Closest to LGB Closest to SNA Population Households Total Households Earning Over $50K Closest to ONT 5.2 Million 1.6 Million 864,000 2 Within Hour 2 hour Drive Drive 18.9 Million 6.1 Million 3.5 Million Closest to SAN Source: U.S. Census Bureau, 2014.
 15.0 12.5 121% Household Income (bil. $) $388.1 $341.1 114% = 500 persons Median Household Income $64,197 $65,676 98% So")
17 The Total Population and Household Income Within 75 Minutes of ONT Significantly Exceeds that of LAX ONT 75-Minute Drive from ONT 60-Minute Drive from LAX LAX ONT LAX ONT % 75 mins. 60 mins. of LAX Population (mil.) % Household Income (bil. $) $388.1 $ % = 500 persons Median Household Income $64,197 $65,676 98% Source: U.S. Bureau of the Census, 2010 survey; Target Pro DriveTime mapping; LAX penalized 15 minutes for airport congestion

18 There are a Significant Number of ONT Passengers who Live Between ONT and LAX LAX ONT = 100 persons Source: YE Q2 2015, U.S DOT O&D Survey and adjusted ARC.
19 Ontario International Airport has been Grossly Underserved
20 Ontario Has Nonstop Service to Only 15 Markets From 7 Airlines SEA PDX SMF OAK SFO SJC LAS SLC DEN MDW ONT Seasonal PHX Note: Southwest starts nonstop service to Portland in August, 2016; Aeromexico serves Mexico City seasonally. Source: Innovata schedules for the week of May 9, GDL MEX DFW IAH Southwest American Alaska United Delta Volaris Airline Aeromexico Total # of Destinations 8* * Weekly Flights * Includes multiple carriers to DEN, GDL and PHX. Weekly Seats 30,926 9,123 4,656 4,588 1, ,333 Seat Share 59% 17% 9% 9% 3% 2% 1%
21 Among Medium Hubs, Ontario s Decline in Seat-Departures was Only Surpassed by Cincinnati Which Lost a Hub 75% 66% Change in Domestic Seat-Departures 2015 Compared to Average 50% 32% 25% 18% 10% 7% 7% 2% 1% 0% -25% -50% -3% -3% -7% -11% -11% -12% -15% -15% -16% -16% -16% -18% -20% -21% -21% -26% -29% -30% -31% -36% -39% -41% -48% -75% -74% -100% Source: Innovata Schedule.
22 -2% -2% -3% -4% -4% -4% -5% -6% -8% -10% -10% -10% -11% -12% As a Result of Capacity Reductions, Among Medium Hubs Ontario s Decline in Domestic O&D Passengers was the Greatest by Far 125% 100% 98% Change in Domestic O&D Passengers 2015 Compared to Average 75% 50% 50% 32% 31% 25% 20% 19% 14% 7% 4% 4% 3% 2% 1% 0% -25% -17% -23% -27% -27% -50% -40% Source: U.S. Domestic O&D Survey.
23 Ontario s MSA Population Alone Would Rank it as the 15 th Largest Metro Area in the U.S Rank Metro Area Population Source: U.S. Census Bureau, New York-Newark, NY-NJ-CT-PA CSA 23,632,722 2 Los Angeles-Long Beach, CA CSA 18,550,288 3 Chicago-Naperville, IL-IN-WI CSA 9,928,044 4 Washington-Baltimore-Arlington, DC-MD-VA-WV-PA CSA 9,546,404 5 San Jose-San Francisco-Oakland, CA CSA 8,607,423 6 Boston-Worcester-Providence, MA-RI-NH-CT CSA 8,099,575 7 Dallas-Fort Worth, TX-OK CSA 7,352,286 8 Philadelphia-Reading-Camden, PA-NJ-DE-MD CSA 7,164,790 9 Houston-The Woodlands, TX CSA 6,686, Miami-Fort Lauderdale-Port St. Lucie, FL CSA 6,561, Atlanta--Athens-Clarke County--Sandy Springs, GA CSA 6,254, Detroit-Warren-Ann Arbor, MI CSA 5,315, Seattle-Tacoma, WA CSA 4,526, Phoenix-Mesa-Scottsdale, AZ Metro Area 4,489, Ontario-Riverside-San Bernardino, CA Metro Area 4,441, Minneapolis-St. Paul, MN-WI CSA 3,835, Cleveland-Akron-Canton, OH CSA 3,497, Denver-Aurora, CO CSA 3,345, San Diego-Carlsbad, CA Metro Area 3,263, Portland-Vancouver-Salem, OR-WA CSA 3,058, Orlando-Deltona-Daytona Beach, FL CSA 3,045, Tampa-St. Petersburg-Clearwater, FL Metro Area 2,915, St. Louis-St. Charles-Farmington, MO-IL CSA 2,910, Pittsburgh-New Castle-Weirton, PA-OH-WV CSA 2,657, Charlotte-Concord, NC-SC CSA 2,537, Sacramento-Roseville, CA CSA 2,513, Salt Lake City-Provo-Orem, UT CSA 2,424, Kansas City-Overland Park-Kansas City, MO-KS CSA 2,409, Columbus-Marion-Zanesville, OH CSA 2,398, Indianapolis-Carmel-Muncie, IN CSA 2,354,902
24 Ontario has by Far the Largest Population per Domestic Flight Among the 20 Largest Metro Areas Population Per Domestic Flight Source: Census Bureau, U.S. DOT T-100 Report, YE December MSA/CSA
25 Ontario has by Far the Largest Population per Domestic Seat Among the 20 Largest Metro Areas Population Per Domestic Seat Source: Census Bureau, U.S. DOT T-100 Report, YE December MSA/CSA
26 Nearly 2 Million Originating Passengers from The Area Closest to ONT Use Other Airports 2,500,000 Airport Choice of Originating Passengers from Area Closest to ONT 2,000,000 1,500,000 1,000, ,000 1,222,178 1,938,203 SNA SAN BUR LGB LAX 0 Source: Adjusted ARC ticketing data. Using ONT Not Using ONT
27 ONT has Significant Growth Potential in the Region While the Other Airports Do Not
28 Ontario has None of the Constraints that Most of the Other Los Angeles Area Airports Face LAX Terminal renovation and consolidation will be occurring over the next several years With terminal and gate constraints, carriers are facing growing CPE s nearing $25 by / Some experts expect LAX s CPE to become the highest in the country by 2023 SNA Through Settlement Agreement 2/ amendments, passengers limited to 10.8 million through 2020, expandable to 11.8 through 2025 and up to 12.5 through 2030 no facility improvements with the latest amendments Capacity allocated annually through Access Plan (Average Daily Departures - ADDs) Limitations on hours of operations Runway limitations impact aircraft performance (virtually one runway to operate from) LGB Noise caps limit the number of larger commercial aircraft flights to 50 (recently revised upward from 41) No FIS facility BUR Pressure to make voluntary noise curfew mandatory Runway length restricts operations Stalled plans to replace the current terminal keeping the current 14 gate maximum at airport 1/ LAWA Board of Airport Commissioners Los Angeles International Airport Fiscal Year 2014 LAX Plan of Finance 2/ Settlement Agreement is between County of Orange, the City of Newport Beach and two community organizations
29 From the February 4, 2016 LAWA Industry Forum Today our (LAX) curbsides, our roadways (and) surrounding neighborhoods suffer from congestion, uncertainty, poor way-finding, and (provide a) poor experience." Deborah Flint Our goal is to fix the traffic gridlock coming in and out of the airport and to connect to sustainable public transportation. BOAC President Sean Burton I imagine that at some point everybody in this crowd has gone through LAX and bemoaned its condition. LA City Councilman Mike Bonin, in whose 11th District LAX sits. They joined Mayor Garcetti in promising to fix LAX by 2023 after spending another $8.5 billion. In the meantime, ONT has a great opportunity to set the standard for the Southern California airports and provide travelers with an attractive alternative. Source: Torrance Daily Breeze, February 5, 2016.
30 Ontario Can Easily Support a Return Back to Passenger Levels and Region Share Ontario Passenger Share of the LA Region Ontario Passengers (millions) 9% 8% 7% 6% 5% 4% 3% 2% 1% 0% 7.6% 8.2% 8.4% 8.3% 8.1% 8.2% 8.0% 8.0% 7.3% 6.2% 5.9% 5.4% 5.0% 4.5% 4.4% 4.3% ONT Share of Region ONT Passengers (millions) Source: Airport statistics.
31 Largest Ontario Markets Without Nonstop Service Passengers Daily Each Way Note: Washington includes BWI, DCA and IAD; New York includes EWR, HPN, ISP, JFK, LGA and SWF; Boston includes BOS, MHT and PVD. Sources: U.S. Domestic O&D Survey, CY 2015, Innovata Schedules.
32 When ONT has Nonstop Service, it Captures Nearly 9% of the Los Angeles Area s O&D Passengers 25% % of Los Angeles Area Using ONT 20% 15% 10% 5% 20.5% 12.6% 9.9% 9.1% 9.0% 7.6% 6.6% 6.5% On average 8.9% use ONT when it has nonstop service 5.8% 4.9% 4.6% 0% When ONT does not have nonstop service, but another area airport does, ONT captures only 4.1% of the traffic Note: Bay Area includes OAK, SFO and SJC; Dallas includes DAL and DFW, Houston includes HOU and IAH, Chicago includes MDW and ORD. Sources: U.S. Domestic O&D Survey, CY 2015, Innovata Schedules.
33 If ONT Captured 8.9% of the Regions O&D Passengers, ONT s Top Unserved Markets are Much Larger Passengers Daily Each Way Currently Use ONT Recapture from Other LA Area Airports if ONT had nonstop service Note: Assumes ONT captures 8.9% of each of the markets where they do not have nonstop service, but another LA Area airport does have a nonstop. Sources: U.S. Domestic O&D Survey, CY 2015, Innovata Schedules.

34 Ontario International Airport 26 domestic gates and 2 international gates Current facility supports 10 million annual passengers Equipped to handle any aircraft Customs facility


35 Ontario International Airport No slot restrictions No curfews, 24/7 operation Two runways (10,200ft and 12,200ft) All-weather operational


36 Why Go Anywhere Else???
37
Lower Income Journey to Work Market Share From American Community Survey
 Lower Income Journey to Work Market Share From American Community Survey 2006-2010 Table 1: Overall National Data Table 2: Car, Truck or Van Table 3: Transit Table 4: Metrics Table 1 Work Trip Market Share:
World Class Airport For A World Class City
 World Class Airport For A World Class City Air Service Update April 2018 2018 Air Service Updates February 2018 Seattle new departure, seasonal, 2x weekly Boston new departure, seasonal, 2x weekly March
World Class Airport For A World Class City
 World Class Airport For A World Class City Air Service Update December 2018 2018 Air Service Updates February 2018 Delta Air Lines Seattle new departure, seasonal, 2x weekly Delta Air Lines Boston new
World Class Airport For A World Class City
 World Class Airport For A World Class City Air Service Update October 2017 2017 Air Service Updates February 2017 Cleveland new destination, 2x weekly Raleigh-Durham new destination, 2x weekly March 2017
Passengers Boarded At The Top 50 U. S. Airports ( Updated April 2
 (Ranked By Passenger Enplanements in 2006) Airport Table 1-41: Passengers Boarded at the Top 50 U.S. Airportsa Atlanta, GA (Hartsfield-Jackson Atlanta International) Chicago, IL (Chicago O'Hare International)
2016 Air Service Updates
 Air Service Update May 2016 2016 Air Service Updates February 2016 Pittsburgh new destination, 2x weekly April 2016 Los Angeles new departure, 1x daily Atlanta new departure, 1x daily Jacksonville new
Access Across America: Transit 2014
 Access Across America: Transit 2014 Final Report CTS 14-11 Prepared by: Andrew Owen David Levinson Accessibility Observatory Department of Civil, Environmental, and Geo- Engineering University of Minnesota
2012 Airfares CA Out-of-State City Pairs -
 2012 Airfares Out-of-State City Pairs - Contracted rates are from July 1, 2012 through June 30, 2013. Please note all fares are designated as () and ( ) in airline computer reservation systems. fares are
World Class Airport For A World Class City
 World Class Airport For A World Class City Air Service Update April 2017 2017 Air Service Updates February 2017 Cleveland new destination, 2x weekly Raleigh-Durham new destination, 2x weekly March 2017
2016 Air Service Updates
 Air Service Update June 2016 2016 Air Service Updates February 2016 Pittsburgh new destination, 2x weekly April 2016 Los Angeles new departure, 1x daily Atlanta new departure, 1x daily Jacksonville new
2016 Air Service Updates
 Air Service Update September 2016 2016 Air Service Updates February 2016 Pittsburgh new destination, 2x weekly April 2016 Los Angeles new departure, 1x daily Atlanta new departure, 1x daily Jacksonville
2016 Air Service Updates
 2016 Air Service Updates February 2016 Pittsburgh new destination, 2x weekly April 2016 Los Angeles new departure, 1x daily Atlanta new departure, 1x daily Jacksonville new destination, 2x weekly Philadelphia
PUBLIC TRANSPORTATION INTRODUCTION
 PUBLIC TRANSPORTATION INTRODUCTION 1 OUTLINE Current Status and Recent Trends Significant Influences A Critical Assessment Arguments Supporting Public Transport Future Influences Ingredients for Future
Higher Education in America s Metropolitan Areas A Statistical Profile
 Higher Education in America s Metropolitan Areas A Statistical Profile MSA Study No.2 Higher Education in America s Metropolitan Areas A Statistical Profile CONTENTS Why Metro Areas? 1 Executive Summary
U.S. Metropolitan Area Exports, 2015
 U.S. Metropolitan Area Exports, 2015 Jeffrey Hall Office of Trade and Economic Analysis Industry and Analysis Department of Commerce International Trade Administration September 2016 U.S. Metro Exports:
The FMR history file contains the following fields, all for 2-bedroom FMRs. It is in EXCEL format for easy use with database or spreadsheet programs.
 The FMR history file contains the following fields, all for 2-bedroom FMRs. It is in EXCEL format for easy use with database or spreadsheet programs. GENERAL NOTES 1. There are no Fiscal Year 1984 FMRs
ECON 166 Lecture 2. J. M. Pogodzinski
 ECON 166 Lecture 2 J. M. Pogodzinski Broad Themes in the Course Measurement Theory Policy 8/27/2014 J. M. Pogodzinski 2 Measurement What is urban? What is the record of urban growth? What is distinct about
Rank Place State Native Hawaiian and Pacific Islander population (alone or in combination
 TABLE 2a: 100 Largest Places Ranked by Number of s (race alone or in *) Living in Hard-to- Census Rank Place State (alone or in 1 Honolulu (CDP) HI 64,196 11,130 17.3 2 New York City NY 14,981 8,211 54.8
1Q 2014 Greater Atlanta HBA Builder Developer Lender Council meeting Information presented by. Atlanta Job Growth
 1Q 2014 Greater Atlanta HBA Builder Developer Lender Council meeting 5-21-2014 Information presented by Eugene James, Regional Director ejames@metrostudy.com 404-510-1080 connect on LinkedIn Atlanta Job
Impact of Hurricane Irma on US Metropolitan Areas
 Impact of Hurricane Irma on US Metropolitan Areas Puerto Ricans in mainland Prepared for: Jorge Restrepo, CEO 2017 EurekaFacts LLC September 29, 2017 Climate refugees from Puerto Rico in US metropolitan
Hector International Airport Fargo, North Dakota
 Hector International Airport Fargo, North Dakota Volume 073 Twelve Months Ended September 2007 January 2008 Airlines Serving Fargo Carried 831 Onboard Passengers Per Day for the Twelve Months Ended September
Hector International Airport Fargo, North Dakota
 Hector International Airport Fargo, North Dakota Volume 072 Twelve Months Ended June 2007 November 2007 Airlines Serving Fargo Carried 830 Onboard Passengers Per Day for the Twelve Months Ended June 2007,
Location, Location, Location. 19 th Annual NIC Conference NIC MAP Data & Analysis Service
 Location, Location, Location 19 th Annual NIC Conference NIC MAP Data & Analysis Service The Great Occupancy Decline 94% Occupancy Trends Majority Nursing Seniors Housing 93% 92% 91% 92.8% 91.0% 90% 89%
Trends Shaping Houston Airports
 Trends Shaping Houston Airports Ian Wadsworth Chief Commercial Officer April 2014 Our mission is to connect Houston with the world Connect the people, businesses, cultures and economies of the world to
ATLANTA HOUSING MARKET Fourth Quarter 2017 Presentation for HBA Builder Developer Lender Council. Expanded. Unemployment Rate (U 6) Official
 Official") Eugene James Senior Regional Director 404-510-1080 ejames@metrostudy.com connect on LinkedIn Mike Overley Business Development Director 770-380-0827 moverley@metrostudy.com To volunteer call 404 408 0716
Eugene James Senior Regional Director 404-510-1080 ejames@metrostudy.com connect on LinkedIn Mike Overley Business Development Director 770-380-0827 moverley@metrostudy.com To volunteer call 404 408 0716
A Decade of Consolidation in Retrospect
 A Decade of Consolidation in Retrospect MARCH 7, 2017 CONSOLIDATION TIMELINE Airlines Announced Closed SOC US Airways- America West Delta- Northwest Frontier- Midwest United- Continental Southwest- AirTran
Population Estimates for U.S. Cities Report 1: Fastest Growing Cities Based on Numeric Increase,
 ulation s for U.S. Cities Report 1: Fastest Growing Cities Based on Numeric Increase, 2015-2015 1 Phoenix AZ 32,113 2.0 1,582,904 1,615,017 167,393 11.6 2 Los Angeles CA 27,173 0.7 3,949,149 3,976,322
79006 AIR TRAVEL SERVICES 2001 AWARD
 Group 79006 AIR TRAVEL SERVICES 2001 AWARD Page 6 Office of General Services - Procurement Services Group Delta Air Lines Albany, NY - Albuquerque, NM ALB - ABQ 901.00 313.00 293.00 420 Delta Air Lines
Hector International Airport Fargo, North Dakota
 Hector International Airport Fargo, North Dakota Volume 081 Twelve Months Ended March 2008 July 2008 Airlines Serving Fargo Carried 838 Onboard Passengers Per Day for the Twelve Months Ended March 2008,
TravelWise Travel wisely. Travel safely.
 TravelWise Travel wisely. Travel safely. The (CATSR), at George Mason University (GMU), conducts analysis of the performance of the air transportation system for the DOT, FAA, NASA, airlines, and aviation
Questions regarding the Incentive Program should be directed to Sara Meess at or by phone at
 Ogden-Hinckley New Entrant Incentive Program Request for Letters of Interest Amendment No. 1 The City of Ogden, Utah (the City ) is seeking Letters of Interest from air carriers not currently serving the
SAMPLE SAMPLE. Metro Housing Starts Forecast Chartbook October
 2.5 Metro Housing Starts Forecast Chartbook 2016-2018 October 2016 2.0 1.5 0.5 1990 1994 1998 2002 2006 2010 2014 2018 www.housingeconomics.com Table of Contents (Metro Housing Starts Forecasts and Economic
Major Metropolitan Area Sales Tax Rates
 August 19, 2010 No. 239 FISCAL FACT Major Metropolitan Area Sales Tax Rates By Lawrence Summers Introduction General sales taxes levied by state, county and city governments in the United States vary greatly,
Brian Ryks Executive Director and CEO
 Brian Ryks Executive Director and CEO MAC Commissioners MAC Finances 2016 Budgeted Operating Revenues Utilities and Other 5% Airline Rates and Charges 34% Rents and Fees 14% Concessions 47% 2016 Budgeted
Per capita carbon emissions from transportation and residential energy use, 2005
 Per capita carbon emissions from transportation and residential energy use, 2005 Metropolitan Area Carbon Footprint Honolulu, HI 1 1.356 Los Angeles-Long Beach-Santa Ana, CA 2 1.413 Portland-Vancouver-Beaverton,
ACI 2008 WORLDWIDE AIRPORT TRAFFIC STATISTICS
 WORLD AIRPORT RANKING BY TOTAL PASSENGERS TOTAL PASSENGERS 1 ATLANTA GA ATL 90 039 280 0.7 2 CHICAGO IL ORD 69 353 876 ( 9.0) 3 LONDON LHR 67 056 379 ( 1.5) 4 TOKYO HND 66 754 829 ( 0.2) 5 PARIS CDG 60
Census Affects Children in Poverty by Professors Donald Hernandez and Nancy Denton State University of New York, Albany
 Phone: (301) 457-9900 4700 Silver Hill Road, Suite 1250-3, Suitland, MD 20746 Fax: (301) 457-9901 Census Affects in Poverty by Professors Donald Hernandez and Nancy Denton State University of New York,
District Match Data Availability
 District Match Data Availability National & State Data Location Available National Data Australia Parliament, Provincial and Territory Assemblies Canada Parliament, Provincial Legislative Assemblies New
Florida's Scheduled Commercial Service Airports
 Florida's Scheduled Commercial Service Airports Volume 154 May 2016 - Domestic Airlines Serving Florida Carried 170,726 Onboard Passengers Per Day for, up 7.7% over the previous 12 months. Highlights in
Chico Municipal Airport. Catchment Area Analysis Results
 Chico Municipal Airport Catchment Area Analysis Results Table of Contents Chico market overview 4 Comparative market analysis 9 Regional airport discussion 14 CIC catchment area results 19 2 Executive
Get Smart Market Insights from Our Research Team Customer Conference
 Get Smart Market Insights from Our Research Team 217 Customer Conference Presenters Amanda Nunnink Amanda Nunnink Steve Steve Guggenmos Guggenmos Sara Steve Hoffman Griffin Steve Sara Griffin Hoffmann
Norwegian's Free Airfare Promotion
 Norwegian's Free Airfare Promotion Start planning your next vacation with 200+ cruises to incredible destinations, including Alaska, Bahamas & Florida, Bermuda, Canada & New England, Caribbean, Mexican
Puget Sound Trends. Executive Board January 24, 2019
 Puget Sound Trends Executive Board January 24, 2019 Overview Topics covered in today s presentation: How many jobs are there? Housing Trends Where do people work? How long does it take to get to work?
Delta and Minnesota. January 29, 2015
 Delta and Minnesota January 29, 2015 Delta & Minnesota: By The Numbers 456 Delta peak-day departures from Minneapolis/St. Paul 2 MSP is Delta s 2 nd largest hub (Seat departures July 2014) 145 Total nonstop
BLACK KNIGHT HPI REPORT
 CONTENTS 1 OVERVIEW 2 NATIONAL OVERVIEW 3 LARGEST STATES AND METROS 4 FEBRUARY S BIGGEST MOVERS 5 20 LARGEST STATES 6 40 LARGEST METROS 7 ADDITIONAL INFORMATION OVERVIEW Each month, the Data & Analytics
Research in Coastal Infrastructure Reliability: Rerouting Intercity Flows in the Wake of a Port Outage
 Research in Coastal Infrastructure Reliability: Rerouting Intercity Flows in the Wake of a Port Outage Megan S. Ryerson, Ph.D Department of City and Regional Planning Department of Electrical and Systems
DEPARTMENT OF HOMELAND SECURITY U.S. CUSTOMS AND BORDER PROTECTION. CBP Dec. No EXPANSION OF GLOBAL ENTRY TO NINE ADDITIONAL AIRPORTS
 This document is scheduled to be published in the Federal Register on 10/04/2016 and available online at https://federalregister.gov/d/2016-23966, and on FDsys.gov 9111-14 DEPARTMENT OF HOMELAND SECURITY
 Snakes & Lattes is currently composed of three corporate owned and operated board game cafes in Toronto, ON. Over the last 7 years these have become renowned as Toronto's premiere board game cafe destinations.
FBI Drug Demand Reduction Coordinators
 FBI Drug Demand Reduction Coordinators Alabama 2121 Building, Room 1400 Birmingham, AL 35203 (205) 252 7705 One St. Louis Centre One St. Louis Street Mobile, AL 36602 (334) 438 3674 Alaska 222 West Seventh
House Price Appreciation by State Percent Change in House Prices Period Ended June 30, 2009
 House Price Appreciation by State Percent Change in House Prices (Estimates use FHFA s Seasonally-Adjusted Purchase-Only House Price Index) State Rank* 1-Yr. Qtr. 5-Yr. Since 1991Q1 North Dakota (ND) 1
The Returns to Single Family Rental Strategies
 The Returns to Single Family Rental Strategies Andrew Demers and Andrea L. Eisfeldt January 2014 Homeownership Rates 70.0% 65.0% 60.0% Home Ownership Rate 55.0% 50.0% 45.0% 40.0% 1890 1895 1900 1905 1910
OB-GYN Workload & Potential Shortages: The Coming U.S. Women s Health Crisis
 OB-GYN Workload & Potential Shortages: The Coming U.S. Women s Health Crisis JULY 2017 Introduction Obstetricians and Gynecologists (OB-GYNs) are a critical part of the health care provider community.
AGENCY: U.S. Customs and Border Protection; Department of Homeland Security.
 This document is scheduled to be published in the Federal Register on 06/25/2013 and available online at http://federalregister.gov/a/2013-15087, and on FDsys.gov 9111-14 DEPARTMENT OF HOMELAND SECURITY
Metropolitan Votes and the 2012 U.S. Election: Population, GDP, Patents and Creative Class
 politan Votes and the 2012 U.S. Election: Population, GDP, Patents and Creative Class Author: Shawn Gilligan, Shawn.Gilligan@rotman.utoronto.ca Zara Matheson, Zara.Matheson@rotman.utoronto.ca Kevin Stolarick,
March Commission Presentation Director s Report
 March Commission Presentation Director s Report Rebecca Hupp A.A.E. Boise Airport Director MARCH 1, 2018 Airport Operations Update FAA certification inspection revealed zero discrepancies We commend you
Airports Council International North America Air Cargo Facilities and Security Survey
 Airports Council International North America 2011 Air Cargo Facilities and Security Survey 2011 ACI NA Air Cargo Committee Air Cargo Conference June, 2011 Contact: Economic Affairs and Research Tel: 202
US Housing Overview. October 7, Toby Morrison. Regional Sales Director MARKET INTELLIGENCE
 US Housing Overview October 7, 2010 Toby Morrison Regional Sales Director 480-415-2578 MARKET INTELLIGENCE www.hanleywood.com www.builderinfostore.com Agenda National Overview Remodel & New Construction
May Commission Presentation Director s Report
 May Commission Presentation Director s Report Rebecca Hupp A.A.E. Boise Airport Director MAY 3, 2018 April Runway Closures April 5: 10R/28L, 10:00 a.m. 11:00 a.m. Lighting maintenance April 11: 10L/28R,
CONCESSIONS FUTURE OPPORTUNITIES
 CONCESSIONS FUTURE OPPORTUNITIES MARCH 14 & 15, 2019 COLORADO S STRONG ECONOMY 2 ABOVE AVERAGE GROWTH 3 19 FORTUNE 1000 COMPANIES Fortune 1000 Companies & Major Relocations and Expansions into Metropolitan
Monthly Employment Watch: Milwaukee and the Nation's Largest Cities
 Monthly Employment Watch: Milwaukee and the Nation's Largest Cities A monthly report on employment trends in the nation s largest cities Prepared by: The University of Wisconsin-Milwaukee Center for Economic
The Airport Credit Outlook
 The Airport Credit Outlook Peter Stettler Ricondo & Associates, Inc. National Federation of Municipal Analysts National Conference April 19, 2012 Las Vegas, Nevada The Outlook for Airports Recent Trends
International migration. Total net migration. Domestic migration
 Indicator Direction Comparables a. Net population migration b. Crime rate (city) c. Housing costs d. Cost-of-living index N.A. e. State & local tax intensity f. Performing arts groups g. Air quality index
Park-Related Total* Expenditure per Resident, by City
 Park-Related Total* per Resident, by City FY 2008 City Population Total Park per Resident Washington, D.C. 591,833 $153,324,830 $259 Seattle 598,541 $150,672,543 $252 Scottsdale 235,371 $50,429,049 $214
June Commission Presentation Director s Report
 June Commission Presentation Director s Report Rebecca Hupp Boise Airport Director JUNE 1, 2017 Airport Operations Update May 9 Airport Operations attended and presented at the 2017 National Weather Service
Monthly Employment Watch: Milwaukee and the Nation's Largest Cities
 Monthly Employment Watch: Milwaukee and the Nation's Largest Cities A monthly report on employment trends in the nation s largest cities Prepared by: The University of Wisconsin-Milwaukee Center for Economic
Peak to Trough Price Decline of less that 10% Peak to Trough Price Decline between 10% and 20%
 Peak to Trough Price Decline of less that 10% Minimal Price Decline Pop. Rank Market Peak to Trough % Decline Current Rebound% 4 Dallas-Fort Worth-Arlington, TX -4.68% 115.17% 35 Austin-Round Rock, TX
Megahubs United States Index 2018
 Published: Sep 2018 Megahubs United States Index 2018 The Most Connected Airports in the US 2018 OAG Aviation Worldwide Limited. All rights reserved About OAG Megahubs US Index 2018 Published alongside
Monthly Employment Watch: Milwaukee and the Nation's Largest Cities
 Monthly Employment Watch: Milwaukee and the Nation's Largest Cities A monthly report on employment trends in the nation s largest cities Prepared by: The University of Wisconsin-Milwaukee Center for Economic
Monthly Employment Watch: Milwaukee and the Nation's Largest Cities
 Monthly Employment Watch: Milwaukee and the Nation's Largest Cities A monthly report on employment trends in the nation s largest cities Prepared by: The University of Wisconsin-Milwaukee Center for Economic
The 156 Arts & Economic Prosperity III Study Regions
 Full-Time Resident Local NATIONAL ESTIMATES OF ECONOMIC IMPACT $63,053,399,000 $103,145,088,000 $166,198,487,000 5,695,361 $104,234,116,000 $7,936,383,000 $9,140,633,000 AK City of Homer A 5,364 $1,248,208
The Face (and Wallet) Behind the Suitcase: Assessing the Customer Base of Tourist Locations
 Behind the Suitcase: Assessing the Customer Base of Tourist Locations") The Face (and Wallet) Behind the Suitcase: Assessing the Customer Base of Tourist Locations Brian J. Schumacher ICSC Research Connections Conference Program Planning Committee Senior Manager, Real Estate
The Face (and Wallet) Behind the Suitcase: Assessing the Customer Base of Tourist Locations Brian J. Schumacher ICSC Research Connections Conference Program Planning Committee Senior Manager, Real Estate
METROPOLITAN STATISTICAL AREA
 Miami-Fort Lauderdale-West Palm Beach METROPOLITAN STATISTICAL AREA Broward County is part of the 8th largest metropolitan statistical area (MSA)() in the country with a population just over 6M in 2016.
RANKING OF THE 100 MOST POPULOUS U.S. CITIES 12/7/ /31/2016
 OVERVIEW OF THE DATA The following information is based on incoming communication to the National Human Trafficking Hotline via phone, email, and online tip report from December 7, 2007 December 31, 2016
ELS Language Centers 2019 USA Pricing
 ELS Language Centers 2019 USA Pricing Tuition and Fees 2019 The 2019 prices are effective for all new applications for 2019 courses received by ELS after September 17, 2018. General Fees General Fees Description
Distance to Jacksonville from Select Cities
 Distance to Jacksonville from Select Cities Source: Mapquest.com, Expedia.com, ManagementReporting.com City Miles Driving Time (Hrs) Atlanta, GA 347 5.75 1 Boston, MA 1,160 18.5 4 Chicago, IL 1,063 17.5
Aviation Insights No. 5
 Aviation Insights Explaining the modern airline industry from an independent, objective perspective No. 5 November 16, 2017 Question: How has air travel in specific metropolitan areas changed in recent
SEPTEMBER 2014 BOARD INFORMATION PACKAGE
 SEPTEMBER 2014 BOARD INFORMATION PACKAGE MEMORANDUM TO: Members of the Airport Authority FROM: Lew Bleiweis, Executive Director DATE: September 19, 2014 Informational Reports: A. July, 2014 Traffic Report
US Cities Over 100,000 Population in 1998 & 1990
 US Cities Over 100,000 Population in 1998 & 1990 Population Ranking Alphabetical Listing Population Change Ranking Percentage Population Change Ranking DEMOGRAPHIA An undertaking of Wendell Cox Consultancy
Associates 2009 Rental Car Satisfaction Study SM (Page 1 of 2)
") Reports: Although Technology May Help Improve the Airport Experience, the Basics Have the Greatest Impact on Passenger Satisfaction Detroit Metropolitan Wayne County, Indianapolis International and Kansas
Reports: Although Technology May Help Improve the Airport Experience, the Basics Have the Greatest Impact on Passenger Satisfaction Detroit Metropolitan Wayne County, Indianapolis International and Kansas
J.D. Power and Associates Reports: Customer Satisfaction with Airports Declines Sharply Amid an Industry Fraught with Flight Delays
 J.D. Power and Associates Reports: Customer Satisfaction with Airports Declines Sharply Amid an Industry Fraught with Flight Delays Philadelphia International, Chicago Midway International and Dallas Love
MAMA Risk Summary Data as of 2008 Q4
 MAMA Risk Summary Data as of 2008 Q4 Table of Contents Contents. 2 Largest 25 Metro Areas based on HMDA originations.. 3 Lowest Risk 25 Metro Areas 4 Highest Risk 25 Metro Areas... 5 Largest 25 States
Bridget Rief, Vice President Planning and Development Metropolitan Airports Commission
 Bridget Rief, Vice President Planning and Development Metropolitan Airports Commission Topics Operations and Air Service Trends Economic Impact Striving for Excellence Planning for the Future Prep for
The O Hare Effect on the System
 The O Hare Effect on the System Diane Boone and Joseph Hollenberg The MITRE Corporation s Center for Advanced Aviation System Development with the Federal Aviation Administration s Managers of Tactical
December Commission Presentation Director s Report
 December Commission Presentation Director s Report Rebecca Hupp Boise Airport Director DECEMBER 7, 2017 Airport Operations Update Annual SMGCS inspection 300 1200 RVR approved 2018 FAA inspection scheduled
Appendix D: Aggregation Error for New England Metro Areas and for Places
 Appendix D: for New England Metro Areas and for Places D-1 Appendix D: s Figure D-1: New England Metro Areas - Summary of Tract s (2000) Metro ID (msapma99) Metro Area Name Census NCDB 1120 Boston, MA-NH
Social Media In Your New & Improved Phoenix Sky Harbor
 Social Media In Your New & Improved Phoenix Sky Harbor AZ Chapter of HSMAI September 19, 2013 It always begins & ends with: skyharbor.com Began Facebook page in October 2010 More than 27,000 people Like
PFC Collection Analysis
 PFC Collection Analysis 8:40 9:30am June 11, 2018 2018 BUSINESS OF AIRPORTS Airport/Airline Business Working Group Analysis of declining trend in PFC-paying passengers Background U.S. Airport Infrastructure
Non-stop Scheduled Passenger Service at Fargo as of October Top 20 Domestic O&D Passenger Markets at Fargo Twelve Months Ended June 2006
 0 5000 10000 15000 20000 25000 30000 35000 40000 45000 50000 Airport Traffic Quarterly Non-stop Scheduled Passenger Service at Fargo as of October 2006 Top 20 Domestic O&D Passenger Markets at Fargo Twelve
Monthly Employment Watch: Milwaukee and the Nation's Largest Cities
 Monthly Employment Watch: Milwaukee and the Nation's Largest Cities A monthly report on employment trends in the nation s largest cities Prepared by: The University of Wisconsin-Milwaukee Center for Economic
University of Denver
 Glenn R. Mueller, Ph.D. Professor University of Denver Franklin L. Burns School of Real Estate & Construction Management & Real Estate Investment Strategist glenn.mueller@du.edu Supply The new supply of
International Convention Badges
 Images may not be the actual size. (Reduced the image sizes to save white space in the catalog) Images provided by Lion Verle Malik Created 07/24/2015. 1923 1924 1925 7th Annual Convention June 26-29,
Who Sprawls the Most?
 SPRAWL AMERICAN STYLE Who Sprawls the Most? Jackie Cutsinger Research Assistant, Center for Urban Studies Wayne State University Measuring Sprawl in Major Metros Regionally stratified, nationally representative
Impact of Advance Purchase and Length-of-Stay on Average Ticket Prices in Top Business Destinations
 Impact of Advance Purchase and Length-of-Stay on Average Ticket Prices in Top Business Destinations Research Summary Average ticket prices continue to trend downward in 2016, but since 2014 there have
Westshore Development Forum April 11, Hillsborough County Aviation Authority
 Westshore Development Forum April 11, 2017 Aviation in Florida Only state with four large hub airports $144 billion in annual economic activity or output Approximately 43.1 million visitors come to Florida
TOP 100. Transit Bus Fleets Agency 35 ft. Over Artic and 35 ft. Total +/- under 0 3, ,426 82
 L.A. Metro-No. 3 1 1 MTA New York City Transit New York City 2 2 New Jersey Transit Corp. Newark, N.J. 3 3 Metro Los Angeles 4 5 Toronto Transit Commission Toronto 5 10 Chicago Transit Authority Chicago
CONNECTICUT INTERSTATE AND INTRASTATE LOCAL REDUCED CITY-PAIR FARES
 PASSENGER TARIFF AND SALES MANUAL CONNECTICUT INTERSTATE AND INTRASTATE LOCAL REDUCED CITY-PAIR S The following section contains city-pair fares that are lower than walkup mileage-based fares. Although
A CORPORATE OR MEDICAL USER OPPORTUNITY WELL-LOCATED OFF THE PA TURNPIKE AM Drive. Quakertown, PA INVESTMENT SUMMARY. Page 1
 A CORPORATE OR MEDICAL USER OPPORTUNITY WELL-LOCATED OFF THE PA TURNPIKE 1900 AM Drive Quakertown, PA INVESTMENT SUMMARY Page 1 EXECUTIVE SUMMARY On behalf of ownership, Avison Young is pleased to offer
PORTLAND INTERNATIONAL AIRPORT
 PORTLAND INTERNATIONAL AIRPORT (PDX) OPERATIONS & CITIES SERVED 2018 (AS OF SEPTEMBER) SCHEDULED ARRIVALS 268 SCHEDULED DEPARTURES 268 NONSTOP CITIES (AIRPORTS) 57 DOMESTIC CITIES 51 INTERNATIONAL CITIES
Agency 35 ft. Over Artic. Trolley 2012 Total and 35 ft. under. 1 1 MTA New York City Transit 0 3, ,344 New York City
 Capital Metro-No. 40 Courtesy Capital Metro 1 1 MTA New York City Transit 0 3,704 640 0 4,344 New York City 2 3 New Jersey Transit Corp. 47 2,263 85 0 2,395 Newark, N.J. 3 2 Metro 50 1,956 378 0 2,384
Real Estate Development Law Update h. February 15 th, Jeff Meyers Principal Meyers LLC (949) x200
 x200") Allen Matkins Real Estate Development Law Update h February 15 th, 2012 Jeff Meyers Principal Meyers LLC (949) 640-0050 x200 JOB TRENDS Job Postings per Capita, 4Q11 Rank (Last Qtr Rank) Metropolitan Area
Allen Matkins Real Estate Development Law Update h February 15 th, 2012 Jeff Meyers Principal Meyers LLC (949) 640-0050 x200 JOB TRENDS Job Postings per Capita, 4Q11 Rank (Last Qtr Rank) Metropolitan Area