Who Sprawls the Most?
|
|
|
- Laura Stewart
- 5 years ago
- Views:
Transcription
1 SPRAWL AMERICAN STYLE Who Sprawls the Most? Jackie Cutsinger Research Assistant, Center for Urban Studies Wayne State University
2 Measuring Sprawl in Major Metros Regionally stratified, nationally representative random sample of 50 of 100 largest US metros Data Sources: 1990 Census data on housing units NLCDB data on land use types 1990 Census Transportation Planning Package (CTPP) data on employment

3 U. S. Census Regions
4 Northeast Region (11 metros) Albany/Schenectady/Troy, NY Allentown/Bethlehem/Easton, PA Boston, MA Buffalo/Niagara Falls, NY New Haven/Meriden, CT Philadelphia, PA Pittsburgh, PA Providence/Fall River/Warwick, RI Rochester, NY Syracuse, NY Worcester, MA
5 Midwest Region (11 metros) Cincinnati, OH Columbus, OH Detroit, MI Fort Wayne, IN Grand Rapids/Muskegon/Holland, MI Indianapolis, IN Milwaukee/Waukesha, WI Minneapolis/St. Paul, MN Omaha, NE St. Louis, MO Youngstown/Warren, OH
6 Southern Region (16 metros) Atlanta, GA Baltimore, MD Baton Rouge, LA Charlotte/Gastonia/Rock Hill, NC Dallas, TX El Paso, TX Houston/Galveston/Brazoria, TX Jacksonville, FL Miami, FL Mobile, AL New Orleans, LA Raleigh/Durham/Chapel Hill, NC San Antonio, TX Tulsa, OK Washington, DC Wilmington/Newark, DE
7 Western Region (12 metros) Denver, CO Fresno, CA Las Vegas, NV Los Angeles/San Bernardino/Riverside, CA Phoenix/Mesa, AZ Portland/Vancouver, OR Salt Lake City/Ogden, UT San Diego, CA San Jose, CA Seattle/Bellevue/Everett, WA Stockton/Lodi, CA Tacoma, WA
8 Appropriate Measurement Area Extended Urban Area The U.S Census Bureau defined urbanized area, plus any additional outlying census tracts in the MSA that has 60 or more residential units and from which at least 30% of its workers commutes to the urbanized area. Developable Land The net land actually available for development in the EUA (excludes bodies of water, wetlands, government protected parklands, unstable soils, and steep slopes).
9 Ranking EUAs by Sprawl 7 measures of land use are calculated for each EUA: Density/Continuity Housing Proximity Job Distribution Mixed Use Housing Centrality Nuclearity Housing Concentration EUAs are scored on each measure (using z-scores) All 7 scores are summed, resulting in a composite sprawl score for each EUA EUAs are then ranked according to these overall sprawl scores
10 Hyper-Sprawled Metros [top 10 overall and in 3 of 7 dimensions] Raleigh-Durham, NC Atlanta, GA Charlotte, NC Baton Rouge, LA Allentown-Bethlehem, PA
11 Severely Sprawled Metros [top 10 overall and in 2 of 7 dimensions] Youngstown, OH Mobile, AL Worcester, MA Detroit, MI Cincinnati, OH
12 Least Sprawled Metros [bottom 10 overall and in 3 dimensions] Las Vegas, NV New Orleans, LA Fresno, CA Miami, FL
13 Conclusions Sprawl is a multi-dimensional phenomenon Dimensions can be measured realistically Metro areas vary greatly in degree to which they sprawl on many dimensions
14 Conclusions Some metros are hypersprawled, with extremely sprawled values on several dimensions Other metros are not sprawled, with extremely non-sprawled values on several dimensions
15 SPRAWL AMERICAN STYLE Sprawl Syndromes Jackie Cutsinger Research Assistant, Center for Urban Studies Wayne State University
16 Our Research Question Can EUAs be classified into smaller, more homogeneous groupings based on their values of sprawl dimensions?
17 The Four Sprawl Syndromes: Leapfrog Dense, Undifferentiated Compact, Core- Dominant Garden Variety
18 Leapfrog Metros high job concentration, BUT: low housing & job density, continuity, housing centrality, housing concentration, housing & housing to job proximity & low mixed use Includes: Allentown, Atlanta, Baton Rouge, Charlotte, Grand Rapids, Mobile, New Haven, Pittsburgh, Raleigh-Durham, Tacoma, Worcester, & Youngstown
19 Dense, Undifferentiated Metros high housing & job density, continuity high mix of jobs & housing; BUT: low nuclearity, job proximity, housing & job concentration Includes: Boston, Denver, Detroit, Los Angeles, Miami, Minneapolis/St. Paul, Omaha, Providence, San Diego, & San Jose
20 Compact, Core-Dominant Metros high nuclearity, housing & job centrality, housing & job concentration, job proximity, housing to job proximity Includes: Fresno, Las Vegas, New Orleans, Rochester, Syracuse, Tulsa, & Washington, DC
21 Garden Variety Metros All dimensions near sample mean Includes: Albany, Baltimore, Buffalo, Cincinnati, Columbus, Dallas, El Paso, Fort Wayne, Houston, Indianapolis, Jacksonville, Milwaukee, Phoenix, Portland, St. Louis, Salt Lake City, San Antonio, Seattle, Stockton, & Wilmington

22 Atlanta Housing Map (leapfrog)

23 Miami Housing Map (dense, undifferentiated)

24 Las Vegas Housing Map (core-dominant)
25 What About Detroit? Classified as Dense, Undifferentiated. But Why? Even distribution of jobs and housing throughout the metro area (most square-miles throughout EUA look alike). Although some leapfrogging does occur on the fringe, Detroit scores highly on job and housing continuity and density and low on job proximity and nuclearity.
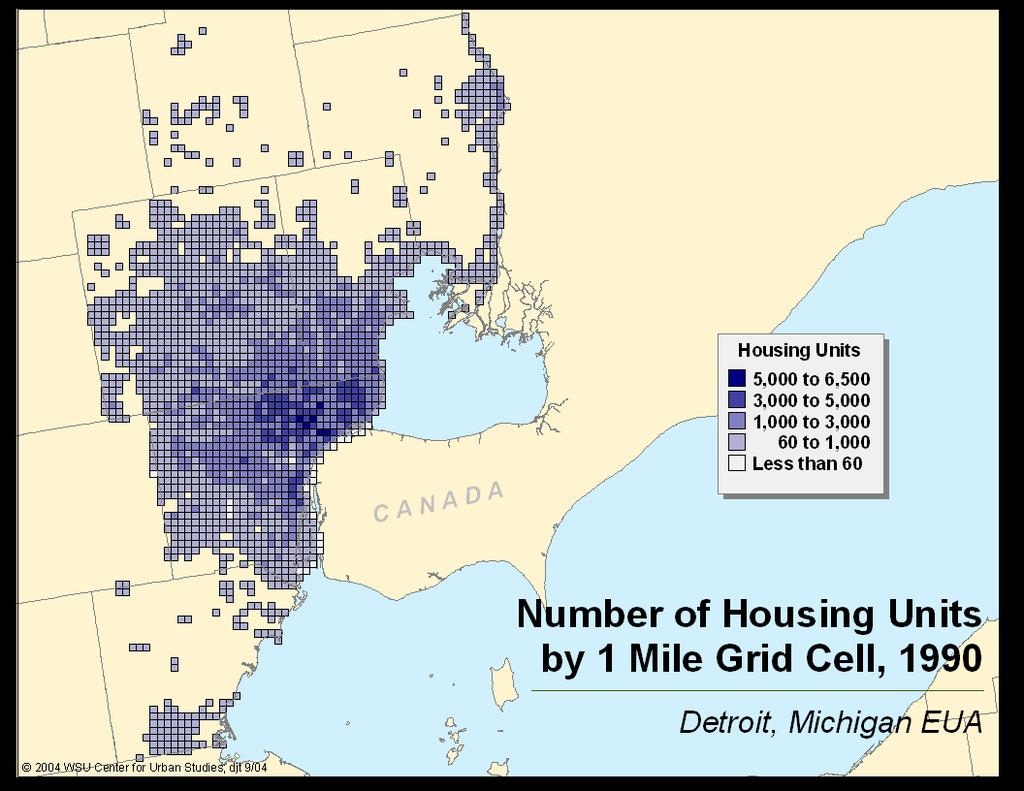
26 Detroit Housing Map (dense/undifferentiated)
27 Detroit Jobs Map (dense/undifferentiated)
28 Conclusions There are 4 sprawl syndromes: Leapfrog Dense, Undifferentiated Compact, Core-Dominant Garden Variety These syndromes are distinct types of sprawl, American style What this all means will be the subject of the next session.
Location, Location, Location. 19 th Annual NIC Conference NIC MAP Data & Analysis Service
 Location, Location, Location 19 th Annual NIC Conference NIC MAP Data & Analysis Service The Great Occupancy Decline 94% Occupancy Trends Majority Nursing Seniors Housing 93% 92% 91% 92.8% 91.0% 90% 89%
Lower Income Journey to Work Market Share From American Community Survey
 Lower Income Journey to Work Market Share From American Community Survey 2006-2010 Table 1: Overall National Data Table 2: Car, Truck or Van Table 3: Transit Table 4: Metrics Table 1 Work Trip Market Share:
Rank Place State Native Hawaiian and Pacific Islander population (alone or in combination
 TABLE 2a: 100 Largest Places Ranked by Number of s (race alone or in *) Living in Hard-to- Census Rank Place State (alone or in 1 Honolulu (CDP) HI 64,196 11,130 17.3 2 New York City NY 14,981 8,211 54.8
Monthly Employment Watch: Milwaukee and the Nation's Largest Cities
 Monthly Employment Watch: Milwaukee and the Nation's Largest Cities A monthly report on employment trends in the nation s largest cities Prepared by: The University of Wisconsin-Milwaukee Center for Economic
Major Metropolitan Area Sales Tax Rates
 August 19, 2010 No. 239 FISCAL FACT Major Metropolitan Area Sales Tax Rates By Lawrence Summers Introduction General sales taxes levied by state, county and city governments in the United States vary greatly,
Monthly Employment Watch: Milwaukee and the Nation's Largest Cities
 Monthly Employment Watch: Milwaukee and the Nation's Largest Cities A monthly report on employment trends in the nation s largest cities Prepared by: The University of Wisconsin-Milwaukee Center for Economic
Census Affects Children in Poverty by Professors Donald Hernandez and Nancy Denton State University of New York, Albany
 Phone: (301) 457-9900 4700 Silver Hill Road, Suite 1250-3, Suitland, MD 20746 Fax: (301) 457-9901 Census Affects in Poverty by Professors Donald Hernandez and Nancy Denton State University of New York,
Population Estimates for U.S. Cities Report 1: Fastest Growing Cities Based on Numeric Increase,
 ulation s for U.S. Cities Report 1: Fastest Growing Cities Based on Numeric Increase, 2015-2015 1 Phoenix AZ 32,113 2.0 1,582,904 1,615,017 167,393 11.6 2 Los Angeles CA 27,173 0.7 3,949,149 3,976,322
Hector International Airport Fargo, North Dakota
 Hector International Airport Fargo, North Dakota Volume 081 Twelve Months Ended March 2008 July 2008 Airlines Serving Fargo Carried 838 Onboard Passengers Per Day for the Twelve Months Ended March 2008,
Metropolitan Votes and the 2012 U.S. Election: Population, GDP, Patents and Creative Class
 politan Votes and the 2012 U.S. Election: Population, GDP, Patents and Creative Class Author: Shawn Gilligan, Shawn.Gilligan@rotman.utoronto.ca Zara Matheson, Zara.Matheson@rotman.utoronto.ca Kevin Stolarick,
Norwegian's Free Airfare Promotion
 Norwegian's Free Airfare Promotion Start planning your next vacation with 200+ cruises to incredible destinations, including Alaska, Bahamas & Florida, Bermuda, Canada & New England, Caribbean, Mexican
Appendix D: Aggregation Error for New England Metro Areas and for Places
 Appendix D: for New England Metro Areas and for Places D-1 Appendix D: s Figure D-1: New England Metro Areas - Summary of Tract s (2000) Metro ID (msapma99) Metro Area Name Census NCDB 1120 Boston, MA-NH
MARKETBEAT U.S. Office
 MARKETBEAT U.S. Office Q3 2018 U.S. OFFICE Employment Indicators Market Indicators (Overall) Office: Net Absorption/Asking Rent 4Q TRAILING AVERAGE Office: Overall Vacancy Q3 17 Q3 18 Total Nonfarm Employment
 Snakes & Lattes is currently composed of three corporate owned and operated board game cafes in Toronto, ON. Over the last 7 years these have become renowned as Toronto's premiere board game cafe destinations.
District Match Data Availability
 District Match Data Availability National & State Data Location Available National Data Australia Parliament, Provincial and Territory Assemblies Canada Parliament, Provincial Legislative Assemblies New
Access Across America: Transit 2014
 Access Across America: Transit 2014 Final Report CTS 14-11 Prepared by: Andrew Owen David Levinson Accessibility Observatory Department of Civil, Environmental, and Geo- Engineering University of Minnesota
Per capita carbon emissions from transportation and residential energy use, 2005
 Per capita carbon emissions from transportation and residential energy use, 2005 Metropolitan Area Carbon Footprint Honolulu, HI 1 1.356 Los Angeles-Long Beach-Santa Ana, CA 2 1.413 Portland-Vancouver-Beaverton,
Higher Education in America s Metropolitan Areas A Statistical Profile
 Higher Education in America s Metropolitan Areas A Statistical Profile MSA Study No.2 Higher Education in America s Metropolitan Areas A Statistical Profile CONTENTS Why Metro Areas? 1 Executive Summary
MANGO MARKET DEVELOPMENT INDEX REPORT
 MANGO MARKET DEVELOPMENT INDEX REPORT 2015-2016 UNDERSTANDING THE MARKET INDEX The Mango Market Development Index is designed to measure and compare mango sales volume relative to population by region
MARKETBEAT U.S. Office
 MARKETBEAT U.S. Office Q4 2018 U.S. OFFICE Employment Indicators Market Indicators (Overall) Office: Net Absorption/Asking Rent 4Q TRAILING AVERAGE Office: Overall Vacancy Q4 17 Q4 18 Total Nonfarm Employment
MARKETBEAT U.S. Office
 MARKETBEAT U.S. Office Q1 2017 U.S. OFFICE Employment Indicators Q1 16 Q1 17 Total Nonfarm Employment 143.4M 145.7M Offi ce-using Employment 30.9M 31.7M Unemployment 4.9% 4.6% Source: BLS Market Indicators
Hector International Airport Fargo, North Dakota
 Hector International Airport Fargo, North Dakota Volume 072 Twelve Months Ended June 2007 November 2007 Airlines Serving Fargo Carried 830 Onboard Passengers Per Day for the Twelve Months Ended June 2007,
Monthly Employment Watch: Milwaukee and the Nation's Largest Cities
 Monthly Employment Watch: Milwaukee and the Nation's Largest Cities A monthly report on employment trends in the nation s largest cities Prepared by: The University of Wisconsin-Milwaukee Center for Economic
Hector International Airport Fargo, North Dakota
 Hector International Airport Fargo, North Dakota Volume 073 Twelve Months Ended September 2007 January 2008 Airlines Serving Fargo Carried 831 Onboard Passengers Per Day for the Twelve Months Ended September
The FMR history file contains the following fields, all for 2-bedroom FMRs. It is in EXCEL format for easy use with database or spreadsheet programs.
 The FMR history file contains the following fields, all for 2-bedroom FMRs. It is in EXCEL format for easy use with database or spreadsheet programs. GENERAL NOTES 1. There are no Fiscal Year 1984 FMRs
Monthly Employment Watch: Milwaukee and the Nation's Largest Cities
 Monthly Employment Watch: Milwaukee and the Nation's Largest Cities A monthly report on employment trends in the nation s largest cities Prepared by: The University of Wisconsin-Milwaukee Center for Economic
PUBLIC TRANSPORTATION INTRODUCTION
 PUBLIC TRANSPORTATION INTRODUCTION 1 OUTLINE Current Status and Recent Trends Significant Influences A Critical Assessment Arguments Supporting Public Transport Future Influences Ingredients for Future
MARKETBEAT U.S. Office
 MARKETBEAT U.S. Office Q2 2017 U.S. OFFICE Employment Indicators Q2 16 Q2 17 Total Nonfarm Employment 143.9M 146.2M Office-using Employment 30.1M 31.8M Unemployment 4.9% 4.4% Source: BLS Market Indicators
Park-Related Total* Expenditure per Resident, by City
 Park-Related Total* per Resident, by City FY 2008 City Population Total Park per Resident Washington, D.C. 591,833 $153,324,830 $259 Seattle 598,541 $150,672,543 $252 Scottsdale 235,371 $50,429,049 $214
MARKETBEAT U.S. Office
 MARKETBEAT U.S. Office Q3 2017 U.S. OFFICE Employment Indicators Net Absorption/Rent 4-QTR TRAILING AVERAGE Q3 16 Q3 17 Total Nonfarm Employment 144.7M 146.6M Office-using Employment 31.3M 31.9M Unemployment
Mango Market Development Index
 Mango Market Development Index 2016-2017 Understanding the Market Index The Mango Market Development Index is designed to measure and compare mango volume sold at retail relative to population by region
OB-GYN Workload & Potential Shortages: The Coming U.S. Women s Health Crisis
 OB-GYN Workload & Potential Shortages: The Coming U.S. Women s Health Crisis JULY 2017 Introduction Obstetricians and Gynecologists (OB-GYNs) are a critical part of the health care provider community.
FBI Drug Demand Reduction Coordinators
 FBI Drug Demand Reduction Coordinators Alabama 2121 Building, Room 1400 Birmingham, AL 35203 (205) 252 7705 One St. Louis Centre One St. Louis Street Mobile, AL 36602 (334) 438 3674 Alaska 222 West Seventh
Monthly Employment Watch: Milwaukee and the Nation's Largest Cities
 Monthly Employment Watch: Milwaukee and the Nation's Largest Cities A monthly report on employment trends in the nation s largest cities Prepared by: The University of Wisconsin-Milwaukee Center for Economic
MARKETBEAT U.S. Office
 MARKETBEAT U.S. Office Q4 2017 U.S. OFFICE Employment Indicators Q4 16 Q4 17 Total Nonfarm Employment 145.2M 147.2M Office-using Employment 31.5M 32.1M Unemployment 4.7% 4.1% Source: BLS Market Indicators
Major US City Preparedness For an Oil Crisis Which Cities and Metro Areas are Best Prepared for $4 a Gallon Gas and Beyond?
 Major US City Preparedness For an Oil Crisis Which Cities and Metro Areas are Best Prepared for $4 a Gallon Gas and Beyond? March 4, 2008 By Warren Karlenzig President Common Current www.commoncurrent.com
Monthly Employment Watch: Milwaukee and the Nation's Largest Cities
 Monthly Employment Watch: Milwaukee and the Nation's Largest Cities A monthly report on employment trends in the nation s largest cities Prepared by: The University of Wisconsin-Milwaukee Center for Economic
MARKETBEAT U.S. Office
 MARKETBEAT U.S. Office Q4 2016 U.S. OFFICE Employment Indicators Market Indicators (Overall) Q4 15 Q4 16 Vacancy Rate 13.5% 13.2% Net Absorption 20.5M 6.9M Under Construction 94.5M 100.2M Weighted Asking
Impact of Hurricane Irma on US Metropolitan Areas
 Impact of Hurricane Irma on US Metropolitan Areas Puerto Ricans in mainland Prepared for: Jorge Restrepo, CEO 2017 EurekaFacts LLC September 29, 2017 Climate refugees from Puerto Rico in US metropolitan
U.S. Metropolitan Area Exports, 2015
 U.S. Metropolitan Area Exports, 2015 Jeffrey Hall Office of Trade and Economic Analysis Industry and Analysis Department of Commerce International Trade Administration September 2016 U.S. Metro Exports:
Charleston, WV 18 Juneau, AK Peoria, IL Jefferson City,
 2004 Ranking Diocese Catholics Diocesan Seminarians 2004 Ratio (Catholics / Seminarians) 2003 Ranking 1 Lincoln, NE 89431 35 2555 2 2 Yakima, WA 68561 20 3428 5 3 Savannah, GA 75987 22 3454 13 4 Cheyenne,
BLACK KNIGHT HPI REPORT
 CONTENTS 1 OVERVIEW 2 NATIONAL OVERVIEW 3 LARGEST STATES AND METROS 4 FEBRUARY S BIGGEST MOVERS 5 20 LARGEST STATES 6 40 LARGEST METROS 7 ADDITIONAL INFORMATION OVERVIEW Each month, the Data & Analytics
Passengers Boarded At The Top 50 U. S. Airports ( Updated April 2
 (Ranked By Passenger Enplanements in 2006) Airport Table 1-41: Passengers Boarded at the Top 50 U.S. Airportsa Atlanta, GA (Hartsfield-Jackson Atlanta International) Chicago, IL (Chicago O'Hare International)
United States Office 2Q 2016
 MARKETBEAT United States Office 2Q 2016 U.S. OFFICE Employment Indicators Market Indicators Net Absorption/Rent 4Q TRAILING AVERAGE Overall Vacancy 2Q 15 2Q 16 Total Nonfarm Employment 141.5M 143.9M Offi
MARKETBEAT U.S. Industrial Snapshot Q4 2015
 MARKETBEAT U.S. Industrial Snapshot Q4 2015 U.S. INDUSTRIAL Employment Indicators Q4 14 Q4 15 Total Nonfarm Employment 140.2M 143.0M Industrial Employment 23.4M 23.6M Unemployment 5.7% 5.0% Market Indicators
U.S. Office Snapshot Q1 2016
 MARKETBEAT U.S. Office Snapshot Q1 2016 U.S. OFFICE Employment Indicators Q1 15 Q1 16 Total Nonfarm Employment 140.8M 143.5M Offi ce-using Employment 30.2M 31.0M Unemployment 5.6% 4.9% Source: BLS Market
CONNECTICUT INTERSTATE AND INTRASTATE LOCAL REDUCED CITY-PAIR FARES
 PASSENGER TARIFF AND SALES MANUAL CONNECTICUT INTERSTATE AND INTRASTATE LOCAL REDUCED CITY-PAIR S The following section contains city-pair fares that are lower than walkup mileage-based fares. Although
World Class Airport For A World Class City
 World Class Airport For A World Class City Air Service Update October 2017 2017 Air Service Updates February 2017 Cleveland new destination, 2x weekly Raleigh-Durham new destination, 2x weekly March 2017
333 W. Campbell Road, Suite 440 Richardson, Texas Cruising for Charity with Randy Limbacher in Tahiti July 28, 2007
 333 W. Campbell Road, Suite 440 Richardson, Texas 75080 972.238.1998 800.952.1998 Cruising for Charity with Randy Limbacher in Tahiti July 28, 2007 Join me for this special annual event to raise money
The Returns to Single Family Rental Strategies
 The Returns to Single Family Rental Strategies Andrew Demers and Andrea L. Eisfeldt January 2014 Homeownership Rates 70.0% 65.0% 60.0% Home Ownership Rate 55.0% 50.0% 45.0% 40.0% 1890 1895 1900 1905 1910
INDIANA INTERSTATE AND INTRASTATE LOCAL REDUCED CITY-PAIR FARES
 The following section contains city-pair fares that are lower than walkup mileage-based fares. Although shown in only one direction, the fares in this section apply in both directions, unless otherwise
2016 Air Service Updates
 Air Service Update May 2016 2016 Air Service Updates February 2016 Pittsburgh new destination, 2x weekly April 2016 Los Angeles new departure, 1x daily Atlanta new departure, 1x daily Jacksonville new
ECON 166 Lecture 2. J. M. Pogodzinski
 ECON 166 Lecture 2 J. M. Pogodzinski Broad Themes in the Course Measurement Theory Policy 8/27/2014 J. M. Pogodzinski 2 Measurement What is urban? What is the record of urban growth? What is distinct about
ILLINOIS INTERSTATE AND INTRASTATE LOCAL REDUCED CITY-PAIR FARES
 The following section contains city-pair fares that are lower than walkup mileage-based fares. Although shown in only one direction, the fares in this section apply in both directions, unless otherwise
World Class Airport For A World Class City
 World Class Airport For A World Class City Air Service Update December 2018 2018 Air Service Updates February 2018 Delta Air Lines Seattle new departure, seasonal, 2x weekly Delta Air Lines Boston new
2016 Air Service Updates
 Air Service Update September 2016 2016 Air Service Updates February 2016 Pittsburgh new destination, 2x weekly April 2016 Los Angeles new departure, 1x daily Atlanta new departure, 1x daily Jacksonville
Parking Rates & Policies Survey. December 2013
 METER OVERVIEW RATE & POLICY PRESENTATION SURVEY / 1 Parking Rates & Policies Survey December 2013 METER OVERVIEW RATE & POLICY PRESENTATION SURVEY / 2 Parking rates and policies survey The purpose of
RANKING OF THE 100 MOST POPULOUS U.S. CITIES 12/7/ /31/2016
 OVERVIEW OF THE DATA The following information is based on incoming communication to the National Human Trafficking Hotline via phone, email, and online tip report from December 7, 2007 December 31, 2016
World Class Airport For A World Class City
 World Class Airport For A World Class City Air Service Update April 2018 2018 Air Service Updates February 2018 Seattle new departure, seasonal, 2x weekly Boston new departure, seasonal, 2x weekly March
International migration. Total net migration. Domestic migration
 Indicator Direction Comparables a. Net population migration b. Crime rate (city) c. Housing costs d. Cost-of-living index N.A. e. State & local tax intensity f. Performing arts groups g. Air quality index
World Class Airport For A World Class City
 World Class Airport For A World Class City Air Service Update April 2017 2017 Air Service Updates February 2017 Cleveland new destination, 2x weekly Raleigh-Durham new destination, 2x weekly March 2017
2012 Airfares CA Out-of-State City Pairs -
 2012 Airfares Out-of-State City Pairs - Contracted rates are from July 1, 2012 through June 30, 2013. Please note all fares are designated as () and ( ) in airline computer reservation systems. fares are
International Convention Badges
 Images may not be the actual size. (Reduced the image sizes to save white space in the catalog) Images provided by Lion Verle Malik Created 07/24/2015. 1923 1924 1925 7th Annual Convention June 26-29,
Beta Radiation in the United States Following the Fukushima Disaster. by Bobby1
 Beta Radiation in the United States Following the Fukushima Disaster by Bobby1 This is a statistical study of beta radiation in the United States following the Fukushima nuclear disaster. Its purpose is
MARKETBEAT U.S. Industrial
 MARKETBEAT U.S. Industrial Q2 2018 U.S. INDUSTRIAL Employment Indicators Q2 17 Q2 18 Total Nonfarm Employment 146.3M 148.7M Industrial Employment 31.6M 32.5M Unemployment 4.3% 3.9% Source: BLS Market Indicators
MARKETBEAT U.S. Industrial
 MARKETBEAT U.S. Industrial Q3 2018 U.S. INDUSTRIAL Employment Indicators Q3 17 Q3 18 Total Nonfarm Employment 146.9M 149.3M Industrial Employment 31.5M 32.3M Unemployment 4.4% 3.9% Source: BLS Market Indicators
1Q 2014 Greater Atlanta HBA Builder Developer Lender Council meeting Information presented by. Atlanta Job Growth
 1Q 2014 Greater Atlanta HBA Builder Developer Lender Council meeting 5-21-2014 Information presented by Eugene James, Regional Director ejames@metrostudy.com 404-510-1080 connect on LinkedIn Atlanta Job
Florida's Scheduled Commercial Service Airports
 Florida's Scheduled Commercial Service Airports Volume 154 May 2016 - Domestic Airlines Serving Florida Carried 170,726 Onboard Passengers Per Day for, up 7.7% over the previous 12 months. Highlights in
SAMPLE SAMPLE. Metro Housing Starts Forecast Chartbook October
 2.5 Metro Housing Starts Forecast Chartbook 2016-2018 October 2016 2.0 1.5 0.5 1990 1994 1998 2002 2006 2010 2014 2018 www.housingeconomics.com Table of Contents (Metro Housing Starts Forecasts and Economic
(See Note 1) Solar Energy Factor (SEF D ) Solar Fraction (SF D ) Estimated Energy Savings SYSTEM DETAILS
 Solar Energy Factor (SEF D ) Solar Fraction (SF D ) Estimated Energy Savings SYSTEM DETAILS") OG-300 ICC-SRCC TM CERTIFIED SOLAR SYSTEM # SYSTEM INFORMATION Pumped Internal Backup: Gas Tank Collector Type: Glazed Flat Plate Solar Tank Volume: 379 liter (100 gal) Collector Heat Transfer Fluid: GRAS
OG-300 ICC-SRCC TM CERTIFIED SOLAR SYSTEM # SYSTEM INFORMATION Pumped Internal Backup: Gas Tank Collector Type: Glazed Flat Plate Solar Tank Volume: 379 liter (100 gal) Collector Heat Transfer Fluid: GRAS
MARKETBEAT U.S. Industrial
 MARKETBEAT U.S. Industrial Q2 2017 U.S. INDUSTRIAL Employment Indicators Q2 16 Q2 17 Total Nonfarm Employment 143.9M 146.2M Industrial Employment 25.2M 25.6M Unemployment 4.9% 4.4% Source: BLS Market Indicators
Real Estate Development Law Update h. February 15 th, Jeff Meyers Principal Meyers LLC (949) x200
 x200") Allen Matkins Real Estate Development Law Update h February 15 th, 2012 Jeff Meyers Principal Meyers LLC (949) 640-0050 x200 JOB TRENDS Job Postings per Capita, 4Q11 Rank (Last Qtr Rank) Metropolitan Area
Allen Matkins Real Estate Development Law Update h February 15 th, 2012 Jeff Meyers Principal Meyers LLC (949) 640-0050 x200 JOB TRENDS Job Postings per Capita, 4Q11 Rank (Last Qtr Rank) Metropolitan Area
MARKETBEAT U.S. Industrial
 MARKETBEAT U.S. Industrial Q4 2018 U.S. INDUSTRIAL Employment Indicators Market Indicators Net Absorption/Rent NNN 4-QTR TRAILING AVERAGE Overall Vacancy Q4 17 Q4 18 Total Nonfarm Employment 147.4M 149.9M
2016 Air Service Updates
 Air Service Update June 2016 2016 Air Service Updates February 2016 Pittsburgh new destination, 2x weekly April 2016 Los Angeles new departure, 1x daily Atlanta new departure, 1x daily Jacksonville new
2016 Air Service Updates
 2016 Air Service Updates February 2016 Pittsburgh new destination, 2x weekly April 2016 Los Angeles new departure, 1x daily Atlanta new departure, 1x daily Jacksonville new destination, 2x weekly Philadelphia
STATE OF UTAH "BEST VALUE" COOPERATIVE CONTRACT CONTRACT NUMBER: AR2270 November 14, 2016
 Item: Contracted Airline Fares Purchasing Agent: Chad Hinds Phone #: (801) 538-1287 Email: chinds@utah.gov Vendor: 112932A Internet Homepage: Delta Air Lines, Inc. 1030 Delta Blvd. Atlanta, GA 30354 www.statetravel.utah.gov
TOP 100. Transit Bus Fleets Agency 35 ft. Over Artic and 35 ft. Total +/- under 0 3, ,426 82
 L.A. Metro-No. 3 1 1 MTA New York City Transit New York City 2 2 New Jersey Transit Corp. Newark, N.J. 3 3 Metro Los Angeles 4 5 Toronto Transit Commission Toronto 5 10 Chicago Transit Authority Chicago
University of Denver
 Glenn R. Mueller, Ph.D. Professor University of Denver Franklin L. Burns School of Real Estate & Construction Management & Real Estate Investment Strategist glenn.mueller@du.edu Supply The new supply of
TOP 100 Bus Fleets Agency 35 ft. and Over Artic under 35 ft. Total. 18 < metro magazine SEPTEMBER/OCTOBER 2018 metro-magazine.
 1 1 MTA New York City Transit/MTA Bus Co. 0 4,860 951 5,811 New York City 2 3 New Jersey Transit Corp. 418 2,879 85 3,382 Newark, N.J. 3 2 Los Angeles County Metropolitan Transportation Authority 50 1,882
Agency 35 ft. Over Artic. Trolley 2012 Total and 35 ft. under. 1 1 MTA New York City Transit 0 3, ,344 New York City
 Capital Metro-No. 40 Courtesy Capital Metro 1 1 MTA New York City Transit 0 3,704 640 0 4,344 New York City 2 3 New Jersey Transit Corp. 47 2,263 85 0 2,395 Newark, N.J. 3 2 Metro 50 1,956 378 0 2,384
MARKETBEAT U.S. Industrial
 MARKETBEAT U.S. Industrial Q3 2016 U.S. INDUSTRIAL Employment Indicators Market Indicators Net Absorption/Rent NNN 4-QTR TRAILING AVERAGE Overall Vacancy Q3 15 Q3 16 Total Nonfarm Employment 142.2M 144.6M
The 156 Arts & Economic Prosperity III Study Regions
 Full-Time Resident Local NATIONAL ESTIMATES OF ECONOMIC IMPACT $63,053,399,000 $103,145,088,000 $166,198,487,000 5,695,361 $104,234,116,000 $7,936,383,000 $9,140,633,000 AK City of Homer A 5,364 $1,248,208
United States Industrial 2Q 2016
 MARKETBEAT United States Industrial 2Q 2016 U.S. INDUSTRIAL Employment Indicators 2Q 15 2Q 16 Total Nonfarm Employment 141.5M 143.9M Industrial Employment 24.8M 25.2M Unemployment 5.4% 4.9% Source: BLS
MARKETBEAT U.S. Industrial
 MARKETBEAT U.S. Industrial Q4 2017 U.S. INDUSTRIAL Employment Indicators Q4 16 Q4 17 Total Nonfarm Employment 145.2M 147.2M Industrial Employment 25.4M 25.9M Unemployment 4.7% 4.1% Source: BLS Market Indicators
REGIONALLY FOCUSED. GLOBALLY COMPETITIVE.
 ABOUT EDC WHO WE ARE Mission: San Diego Regional Economic Development Corporation s mission is to maximize the region s economic prosperity and global competitiveness. Vision: The San Diego Region will
Greater Orlando Aviation Authority Orlando International Airport Destinations by Airline December 2017
 Aer Lingus Dublin, Ireland 3 3 0 0 Aeromexico Mexico City, Mexico 19 4 19 4 0 Air Canada Halifax, Nova Scotia 2 2 Montreal/Dorval, Quebec 12 1 Ottawa, Ontario 5 3 1 Toronto, Ontario 20 1 Vancouver, British
Non-stop Scheduled Passenger Service at Fargo as of October Top 20 Domestic O&D Passenger Markets at Fargo Twelve Months Ended June 2006
 0 5000 10000 15000 20000 25000 30000 35000 40000 45000 50000 Airport Traffic Quarterly Non-stop Scheduled Passenger Service at Fargo as of October 2006 Top 20 Domestic O&D Passenger Markets at Fargo Twelve
PAMA Energy Study II Webinar
 PAMA Energy Study II Webinar 1 The Professional Awning Manufacturers Association (PAMA) is the trade association committed to supporting the awning industry in the United States. Membership is open to
Appendix A TRIP Urban Roads Report 2018
 Appendix A TRIP Urban Roads Report 2018 Pavement Conditions and Extra Vehicle Operating Costs for Urban Areas with Population of 500K or More Akron OH 49% 12% 14% 25% $837 Albany Schenectady Troy NY 15%
Millennials and the City Wherein Metro Areas In Larger Central Cities Outperformed the Suburbs (2010/15) What Happened in 2016?
 What Happened in 2016?") Millennials and the City Wherein Metro Areas In Larger Central Cities Outperformed the Suburbs (2010/15) What Happened in 2016? Robert W. Burchell, Ph.D., Emeritus Prior Director, Center for Urban Policy
Millennials and the City Wherein Metro Areas In Larger Central Cities Outperformed the Suburbs (2010/15) What Happened in 2016? Robert W. Burchell, Ph.D., Emeritus Prior Director, Center for Urban Policy
MARKETBEAT U.S. Industrial
 MARKETBEAT U.S. Industrial Q1 2017 U.S. INDUSTRIAL Employment Indicators Q1 16 Q1 17 Total Nonfarm Employment 143.4M 145.7M Industrial Employment 25.3M 25.6M Unemployment 4.9% 4.6% 12-Month Forecast Economy
A COMPARISON OF THE MILWAUKEE METROPOLITAN AREA TO ITS PEERS
 KRY/WJS/EDL #222377 (PDF: #223479) 1/30/15 PRELIMINARY DRAFT Memorandum Report A COMPARISON OF THE MILWAUKEE METROPOLITAN AREA TO ITS PEERS EXECUTIVE SUMMARY This memorandum report provides a statistical
U.S. Regional Outlook
 U.S. Regional Outlook Presented by: Mark McMullen Director of Government Consulting FTA Revenue Estimating Conference September 18, 26 Widespread Pattern of Economic Expansion Based on employment and industrial
Get Smart Market Insights from Our Research Team Customer Conference
 Get Smart Market Insights from Our Research Team 217 Customer Conference Presenters Amanda Nunnink Amanda Nunnink Steve Steve Guggenmos Guggenmos Sara Steve Hoffman Griffin Steve Sara Griffin Hoffmann
Planning, Engineering & Construction Department September 2017
 Planning, Engineering & Construction Department September 2017 More frequent routes (next bus arrival 15 minutes or less) More reliable service 7 day a week service More options for connections METRO s
Innovation Clusters in the Decade of the 1990s
 Innovation Clusters in the Decade of the 1990s TARGET MISSOURI January 2002 Additional information is available on-line at: http://www.missourieconomy.org Innovation Clusters in the Decade of the 1990s
Regional Outlook STEVEN G. COCHRANE, MANAGING DIRECTOR
 Regional Outlook STEVEN G. COCHRANE, MANAGING DIRECTOR Differences Narrow; Southeast Vies for Lead Employment, % change yr ago 3.5 3.0 Southwest 2.5 2.0 1.5 East South Central South Atlantic Northeast
PENNSYLVANIA INTERSTATE AND INTRASTATE LOCAL REDUCED CITY-PAIR FARES
 PASSENGER TARIFF AND SALES MANUAL PENNSYLVANIA INTERSTATE AND INTRASTATE LOCAL REDUCED CITY-PAIR S The following section contains city-pair fares that are lower than walkup mileage-based fares. Although
2007 AWS CWI SEMINAR and EXAM SCHEDULE
 2007 AWS CWI SEMIR and EXAM SCHEDULE For information on any of our seminars and certification programs, visit our website at: www.aws.org or contact AWS at (800/305) 443-9353, ext. 273 for Certification
Alabama Y Y Birmingham-Hoover, AL Y Y. Alaska N/A. Arizona N Y Phoenix-Mesa-Scottsdale, AZ N Y Tucson, AZ N Y
 - requires bidders to obtain out of state Alabama Y Y Birmingham-Hoover, AL Y Y Alaska Arizona N Y Phoenix-Mesa-Scottsdale, AZ N Y Tucson, AZ N Y Arkansas Y N Little Rock-North Little Rock, AR Y N Memphis,