Social Media In Your New & Improved Phoenix Sky Harbor
|
|
|
- Junior Nash
- 5 years ago
- Views:
Transcription


1 Social Media In Your New & Improved Phoenix Sky Harbor AZ Chapter of HSMAI September 19, 2013


2 It always begins & ends with: skyharbor.com

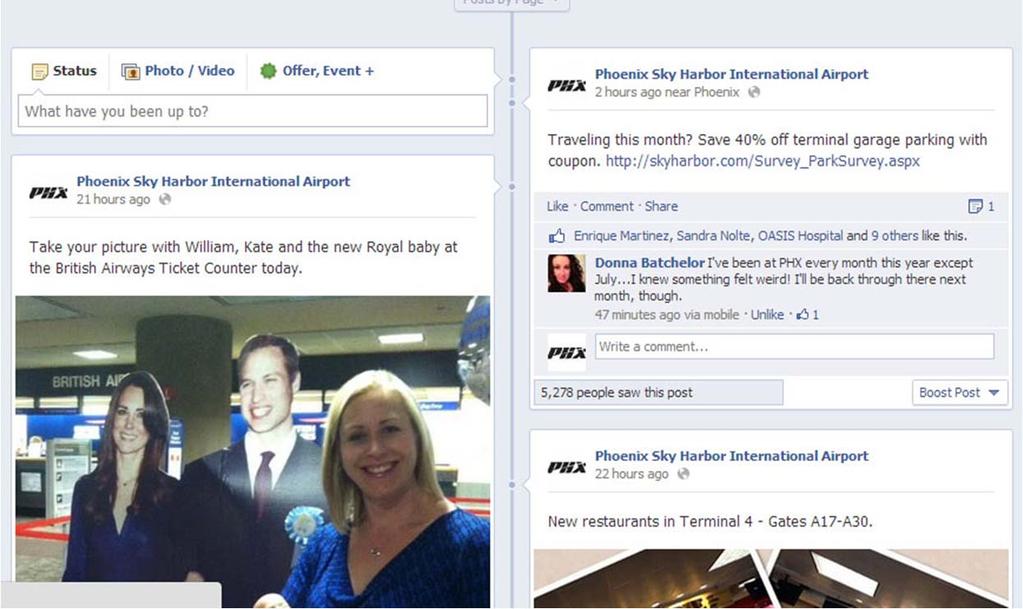
3 Began Facebook page in October 2010 More than 27,000 people Like us Post Airport updates directing fans back to skyharbor.com Address customer service issues via Facebook page
4 Facebook


5 Facebook: BA Plane Under Taxiway
6 Facebook

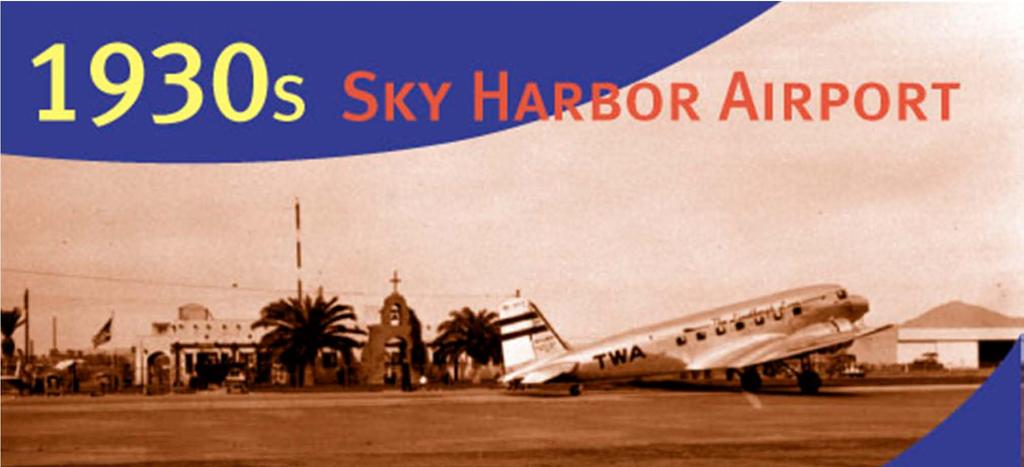
7 How much did the city of Phoenix pay for PHX Sky Harbor in 1935? Do You Know?

8 $100,000
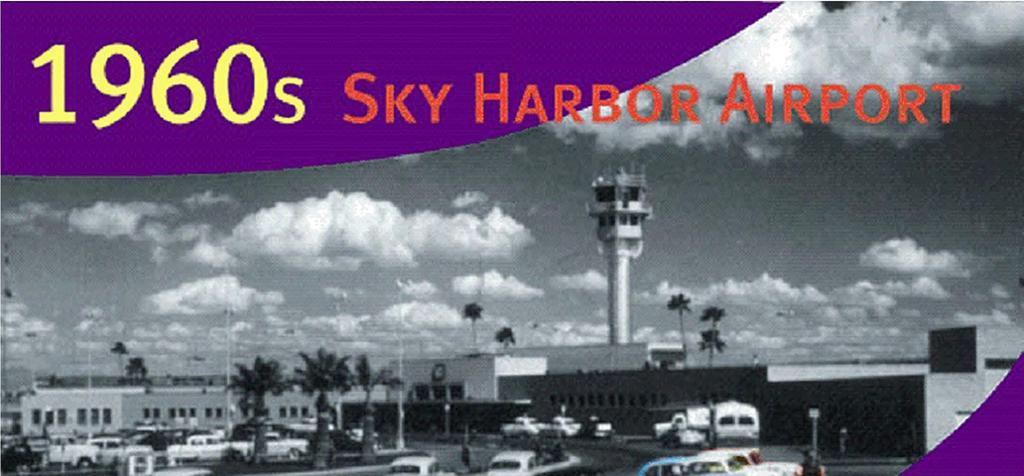
9 Phoenix Sky Harbor Airport Update PHX: Then and Now HSMAI Arizona Chapter September 19, 2013 Pointe Hilton Squaw Peak Resort

10

11

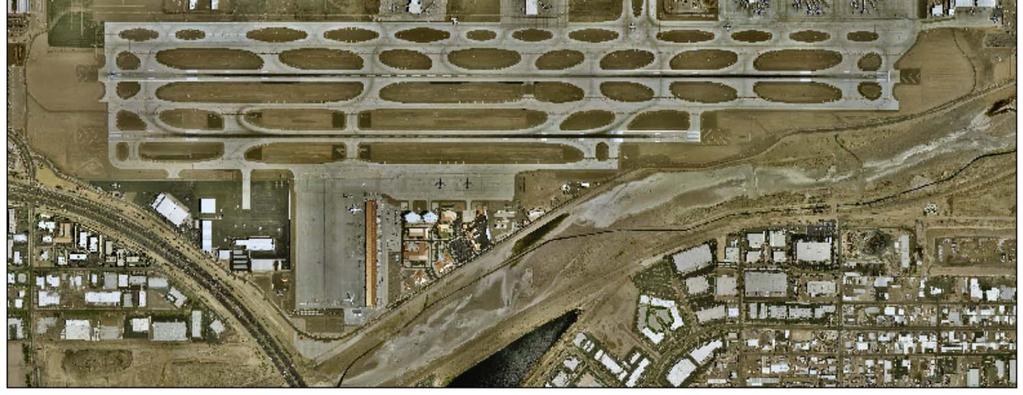
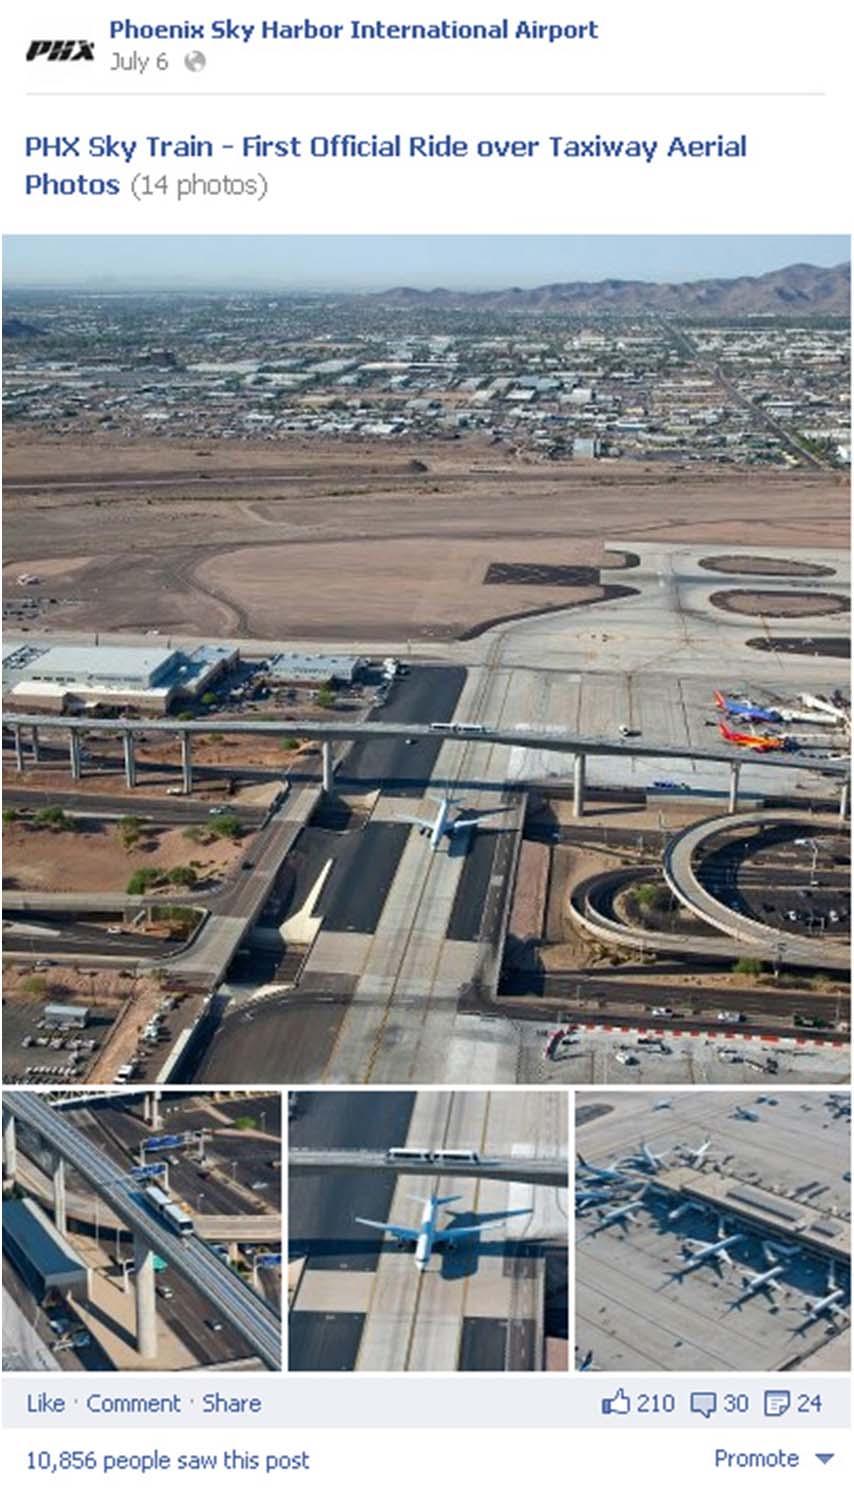
12 Today: A View from Above

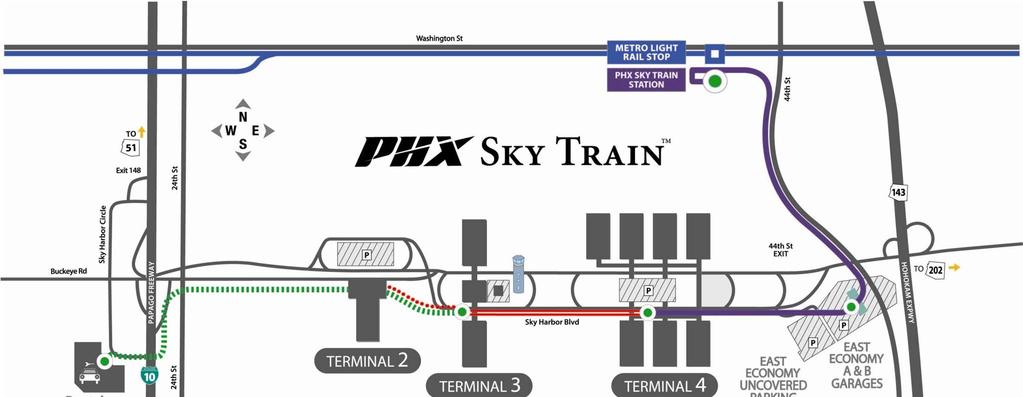
13 PHX Sky Train Top 10 in U.S. $90M Impact 600 cargo tons 1,200 flights
14 103 Nonstop Destinations Served Anchorage Edmonton Honolulu Kona Vancouver Portland Seattle Spokane Calgary Saskatoon Regina Winnipeg Montrėal Minneapolis/ Boise Manchester St. Paul Toronto Buffalo Boston Milwaukee Detroit Sacramento Des Moines Cleveland Providence New York-JFK San Francisco Reno Salt Lake City Pittsburgh Columbus Newark San Jose Omaha Chicago-ORD/MDW Philadelphia Oakland Grand Junction Baltimore Monterey Fresno Denver Kansas City Indianapolis Cincinnati Las Vegas Washington IAD/DCA San Luis Obispo St. Louis Louisville Santa Barbara Bakersfield Page Durango Burbank Raleigh/Durham Los Angeles Ontario Flagstaff Tulsa Memphis Charlotte Long Beach Nashville Maui Orange County Palm Springs Oklahoma City San Diego Albuquerque Lihue Yuma Show Low Little Rock Tucson Birmingham Atlanta Dallas/Ft. Worth El Paso Hermosillo Austin Guaymas New Orleans Orlando Houston-IAH/HOU Tampa San Antonio Ft. Lauderdale Miami London-LHR Los Cabos Mazatlan Guadalajara Puerto Vallarta Manzanillo Mexico City Cancun 82 Domestic 21 International Ixtapa/Zihuatanejo Acapulco Year Round Seasonal San Jose, CR Source: OAG, April 2011


15 Airlines with Nonstop International Flights San Juan, CR Aeromexico Air Canada British Airways US Airways Volaris WestJet


16 Phoenix Sky Harbor Airport Update PHX Sky Train AZ Society of Association Executives August 1, 2013 Double Tree Resort
17


18 44 th Street Station


19 44 th Street Station 24/7 Security Early Bag Check-In Cell Phone Lot Local Art Pet Park Metro Tickets Boarding Passes
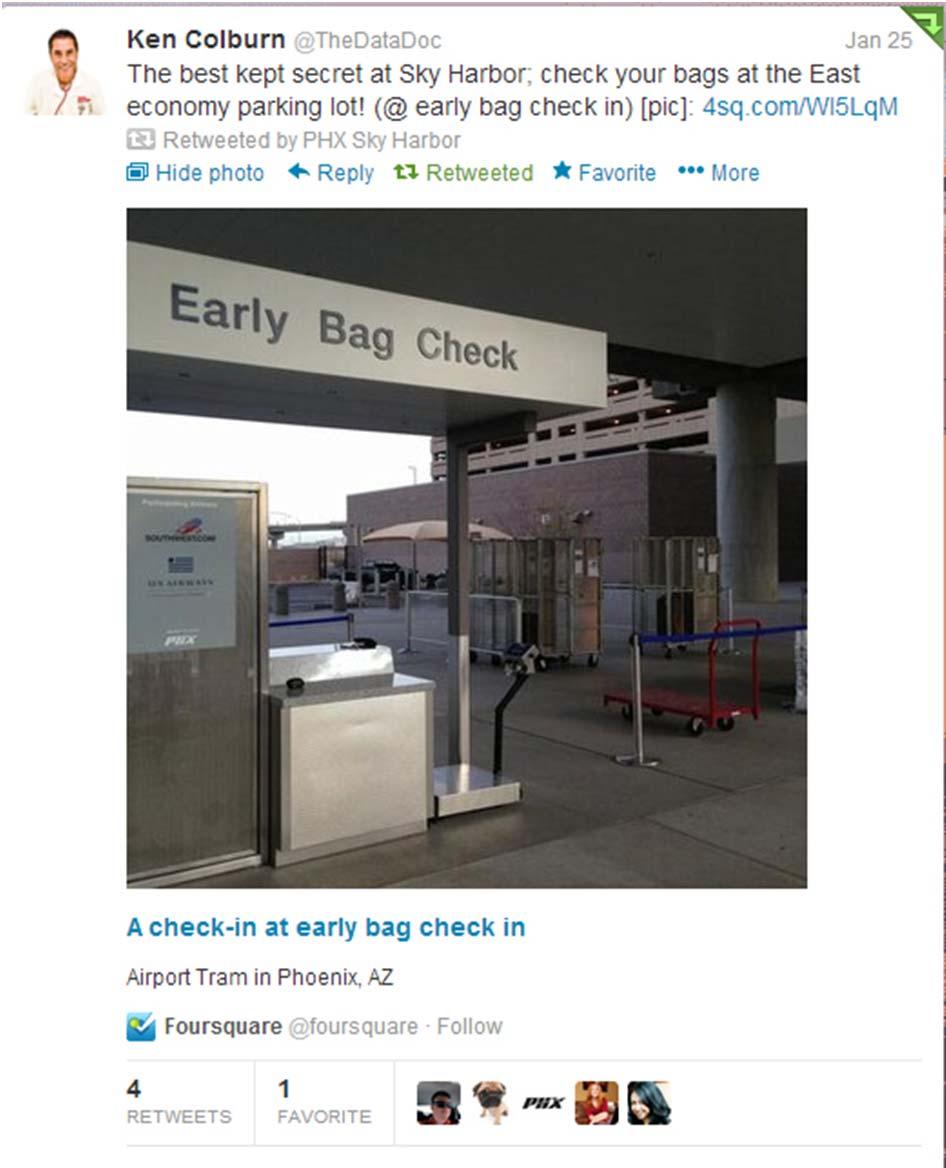

20 Twitter Compliments: Early Bag Check

21 Twitter Compliments: Early Bag Check


22 East Economy Station

23 East Economy Parking Early Bag Check-In Family Friendly Parking Pet Park Shuttle Boarding Passes

24 4,000 PV Panels Equivalent to Meet the Power Needs of 185 Homes 57%-62% Energy Offset East Economy Station

25 Operational Characteristics Travel time: 5 minutes Frequency: 3-4 minutes Passenger capacity: 2-, 3- or even 4-car trains

26 Amenities 53 PAX Capacity 8 Seats Audio Announcements Wheelchair Area Air-Conditioning

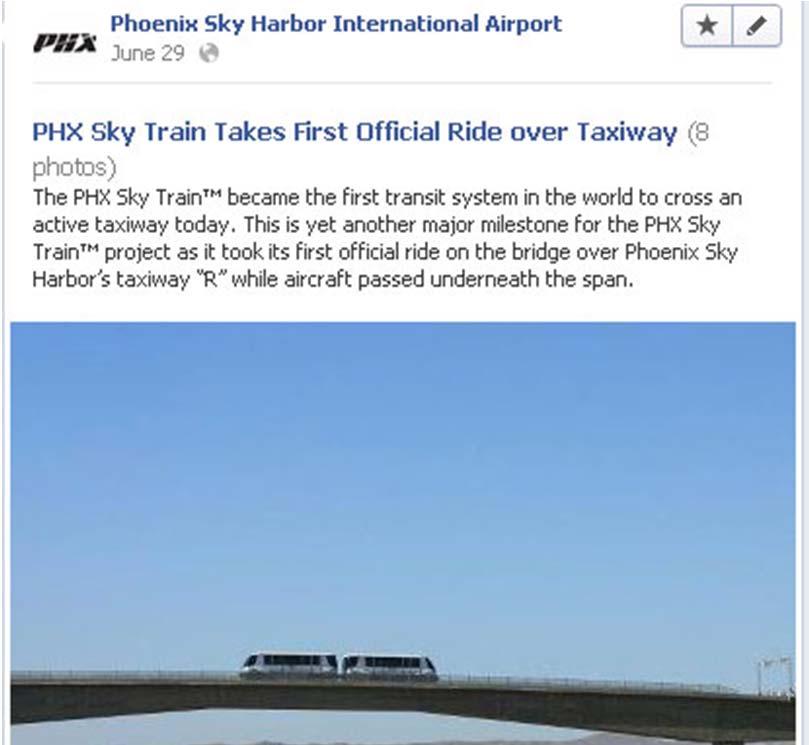
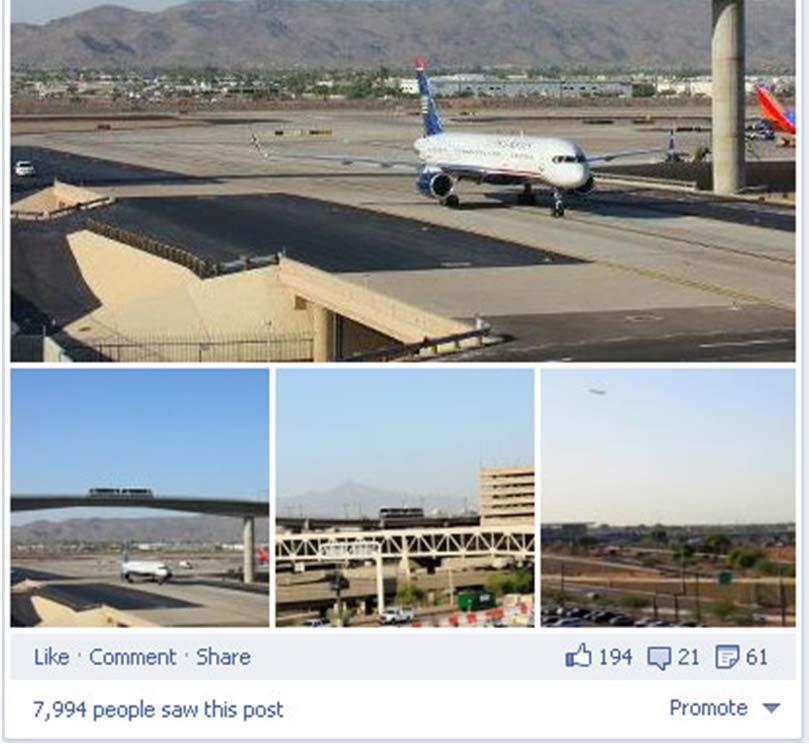
27 PHX Sky Train Taxiway Crossing

28 Navigators are here to help

29 Do You Know? PHX Sky Train How many Navigators does Sky Harbor have on staff?
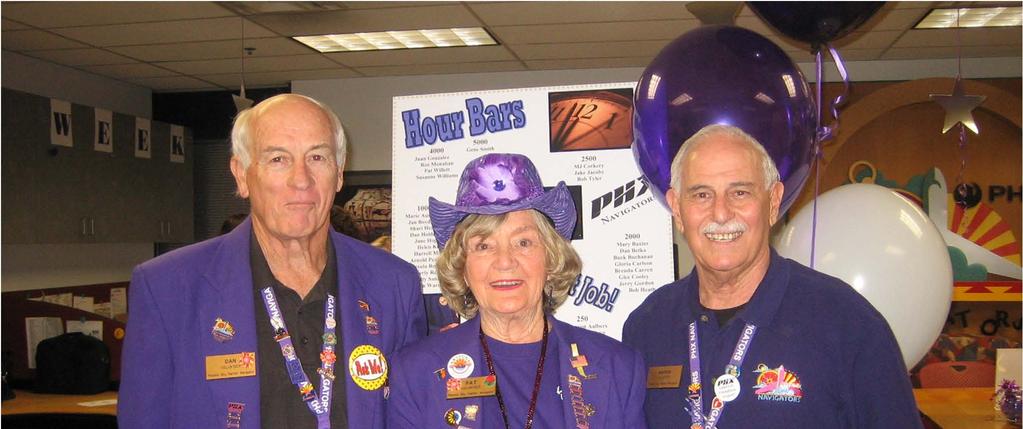

30 400


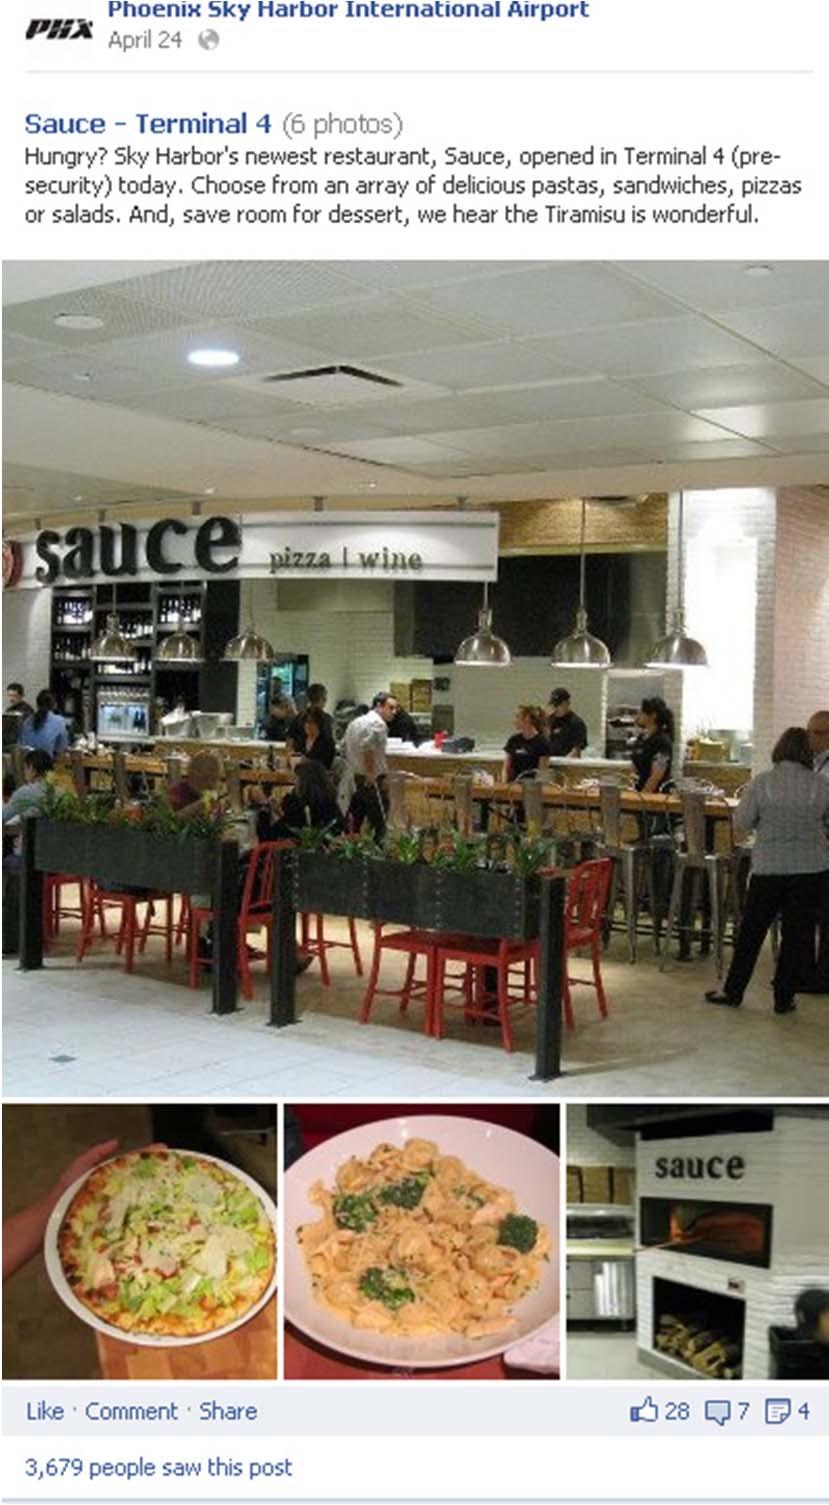
31 New Food and Beverage at Terminal 4 42 New Food/Beverage Concessions Street Pricing New Opportunities for Local Businesses Strong local presence

32 Facebook
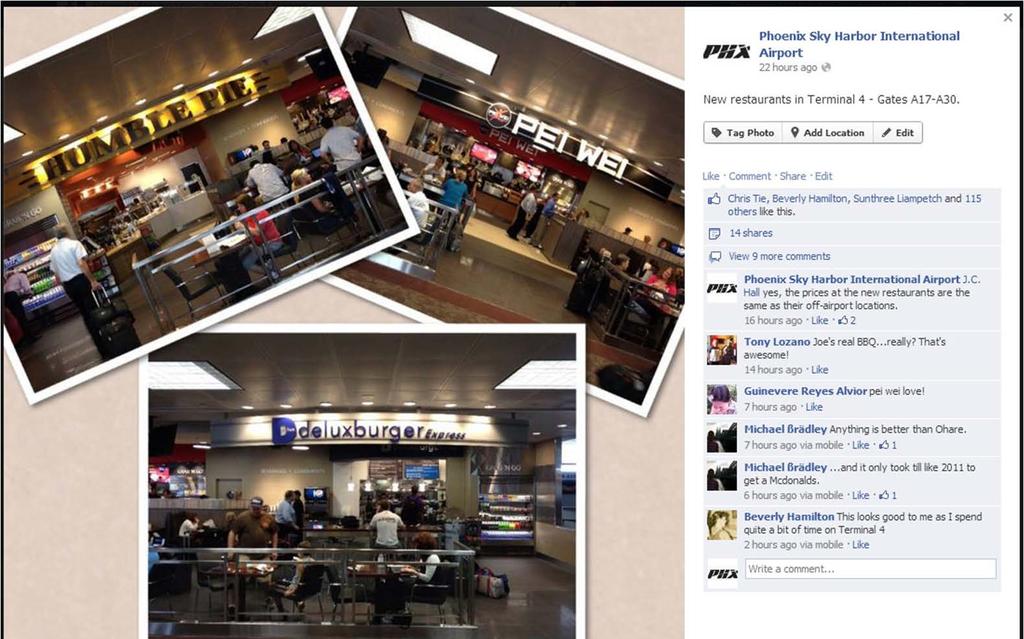

33 Facebook

34 Facebook Promoting Airport Restaurants


35 Phoenix Airport Museum


36 Facebook Airport Art


37


38 Pet Parks

39 Do You Know? How much of an economic impact did PHX generate in 2011?


40 $28.7 Billion


41 Lose your car? Need a jump? Misplace your keys?


42 Credit Card Express


43 Facebook Questions & Answers


44 Facebook Customer Service Issues

45 Facebook

46 Started tweeting occasionally in November/December 2008 Regular tweets began in February 2009 More than 10,000 followers Post Airport updates directing fans back to skyharbor.com Address customer service issues

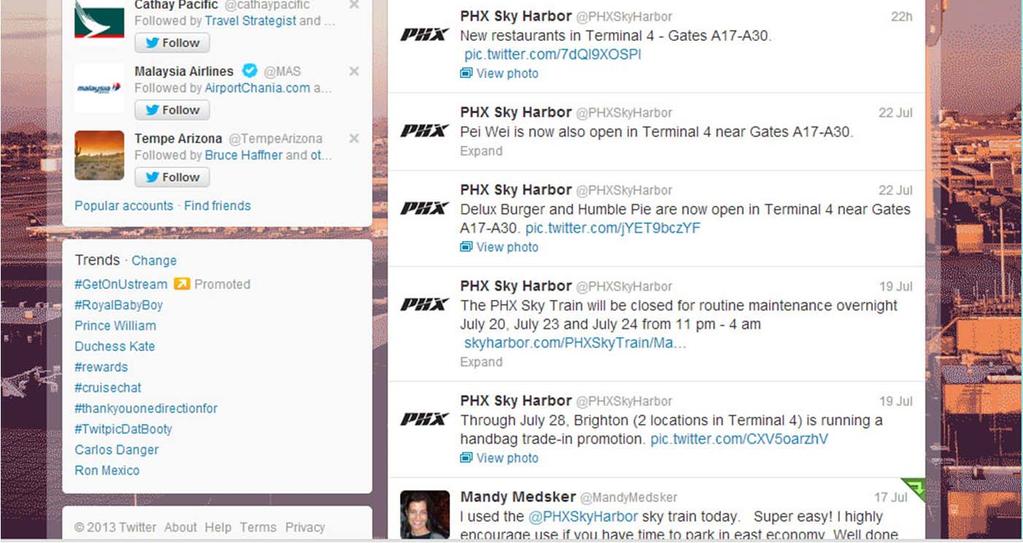
47 Twitter


48 Twitter - Compliments

49 Twitter - Compliments


50 How many PAX flew through PHX in 2012?
51 million Passenger Trends and Forecast Phoenix Sky Harbor International Airport Historic Current Projected Year 2001 Year Million Annual Passsengers (MAP)


52 Customer Service through Twitter

53 Twitter Communication During Incidents Impacting Travelers

54 Google + Nearly 400 followers have us in their circles

55 Pinterest


56 Instagram
57 LISTSERV


58 YouTube


59 Traditional News Media Follow Our Social Media Channels

60 Websites Also Follow Our Social Media
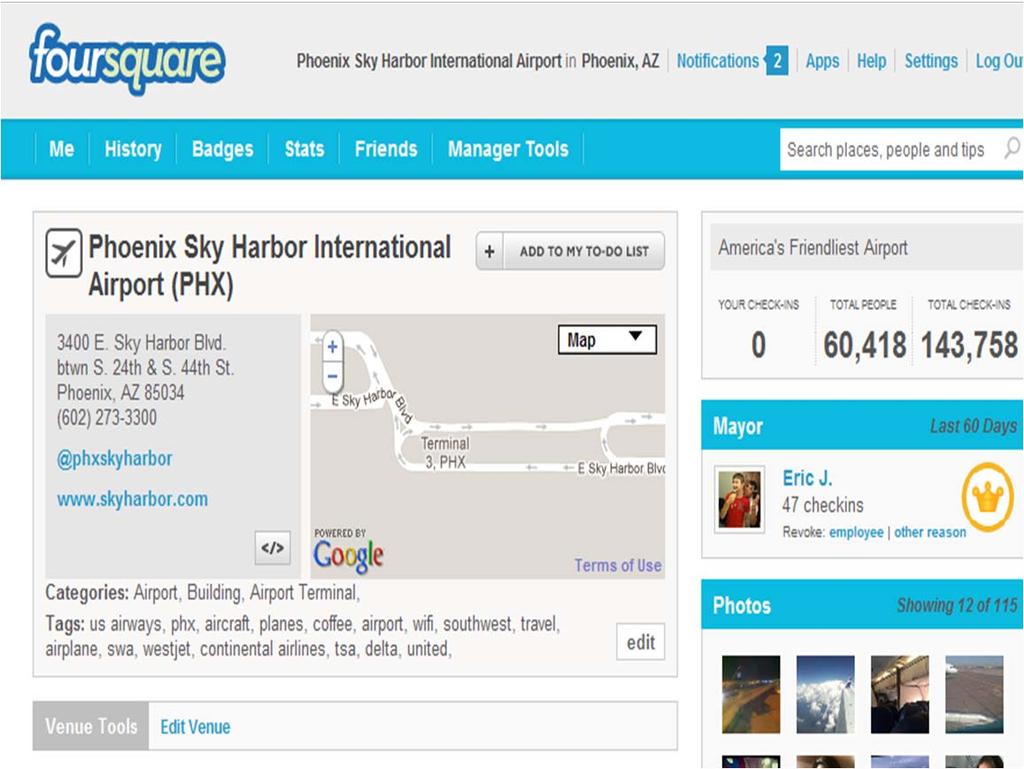
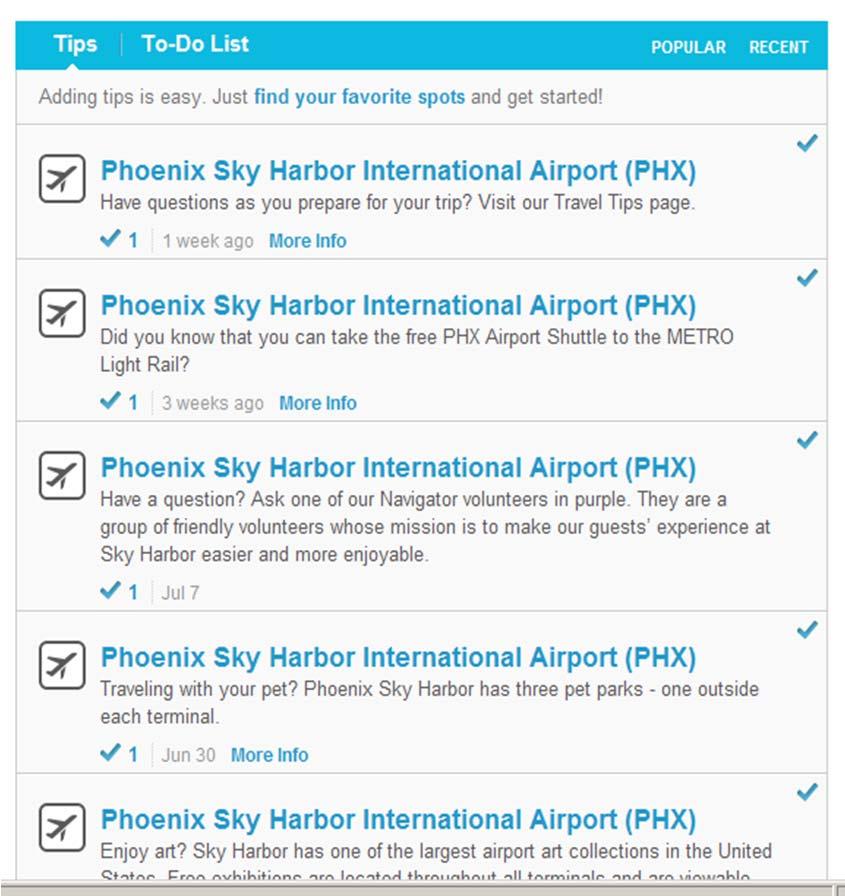
61 Foursquare


62 Monitor and Update Other Websites & Apps

63 Questions?
Monthly Employment Watch: Milwaukee and the Nation's Largest Cities
 Monthly Employment Watch: Milwaukee and the Nation's Largest Cities A monthly report on employment trends in the nation s largest cities Prepared by: The University of Wisconsin-Milwaukee Center for Economic
Monthly Employment Watch: Milwaukee and the Nation's Largest Cities
 Monthly Employment Watch: Milwaukee and the Nation's Largest Cities A monthly report on employment trends in the nation s largest cities Prepared by: The University of Wisconsin-Milwaukee Center for Economic
PORTLAND INTERNATIONAL AIRPORT
 PORTLAND INTERNATIONAL AIRPORT (PDX) OPERATIONS & CITIES SERVED 2018 (AS OF SEPTEMBER) SCHEDULED ARRIVALS 268 SCHEDULED DEPARTURES 268 NONSTOP CITIES (AIRPORTS) 57 DOMESTIC CITIES 51 INTERNATIONAL CITIES
October 2018 October 2017 Change
 AIR TRAFFIC REPORT SUMMARY: OCTOBER PASSENGERS October October Change Domestic Passengers 1,969,141 1,861,225 5.8% International Passengers 89,328 74,157 20.5% Total Passengers 2,058,469 1,935,382 6.4%
Hector International Airport Fargo, North Dakota
 Hector International Airport Fargo, North Dakota Volume 072 Twelve Months Ended June 2007 November 2007 Airlines Serving Fargo Carried 830 Onboard Passengers Per Day for the Twelve Months Ended June 2007,
Monthly Employment Watch: Milwaukee and the Nation's Largest Cities
 Monthly Employment Watch: Milwaukee and the Nation's Largest Cities A monthly report on employment trends in the nation s largest cities Prepared by: The University of Wisconsin-Milwaukee Center for Economic
Portland International Airport (PDX)
") Portland International Airport (PDX) Portland International Airport (PDX) is currently served by 14 international and domestic airlines offering more than 210 scheduled passenger arrivals and departures
Portland International Airport (PDX) Portland International Airport (PDX) is currently served by 14 international and domestic airlines offering more than 210 scheduled passenger arrivals and departures
Hector International Airport Fargo, North Dakota
 Hector International Airport Fargo, North Dakota Volume 073 Twelve Months Ended September 2007 January 2008 Airlines Serving Fargo Carried 831 Onboard Passengers Per Day for the Twelve Months Ended September
Norwegian's Free Airfare Promotion
 Norwegian's Free Airfare Promotion Start planning your next vacation with 200+ cruises to incredible destinations, including Alaska, Bahamas & Florida, Bermuda, Canada & New England, Caribbean, Mexican
Westshore Development Forum April 11, Hillsborough County Aviation Authority
 Westshore Development Forum April 11, 2017 Aviation in Florida Only state with four large hub airports $144 billion in annual economic activity or output Approximately 43.1 million visitors come to Florida
Monthly Employment Watch: Milwaukee and the Nation's Largest Cities
 Monthly Employment Watch: Milwaukee and the Nation's Largest Cities A monthly report on employment trends in the nation s largest cities Prepared by: The University of Wisconsin-Milwaukee Center for Economic
Monthly Employment Watch: Milwaukee and the Nation's Largest Cities
 Monthly Employment Watch: Milwaukee and the Nation's Largest Cities A monthly report on employment trends in the nation s largest cities Prepared by: The University of Wisconsin-Milwaukee Center for Economic
Park-Related Total* Expenditure per Resident, by City
 Park-Related Total* per Resident, by City FY 2008 City Population Total Park per Resident Washington, D.C. 591,833 $153,324,830 $259 Seattle 598,541 $150,672,543 $252 Scottsdale 235,371 $50,429,049 $214
Lower Income Journey to Work Market Share From American Community Survey
 Lower Income Journey to Work Market Share From American Community Survey 2006-2010 Table 1: Overall National Data Table 2: Car, Truck or Van Table 3: Transit Table 4: Metrics Table 1 Work Trip Market Share:
Hector International Airport Fargo, North Dakota
 Hector International Airport Fargo, North Dakota Volume 081 Twelve Months Ended March 2008 July 2008 Airlines Serving Fargo Carried 838 Onboard Passengers Per Day for the Twelve Months Ended March 2008,
Rank Place State Native Hawaiian and Pacific Islander population (alone or in combination
 TABLE 2a: 100 Largest Places Ranked by Number of s (race alone or in *) Living in Hard-to- Census Rank Place State (alone or in 1 Honolulu (CDP) HI 64,196 11,130 17.3 2 New York City NY 14,981 8,211 54.8
333 W. Campbell Road, Suite 440 Richardson, Texas Cruising for Charity with Randy Limbacher in Tahiti July 28, 2007
 333 W. Campbell Road, Suite 440 Richardson, Texas 75080 972.238.1998 800.952.1998 Cruising for Charity with Randy Limbacher in Tahiti July 28, 2007 Join me for this special annual event to raise money
Appendix D: Aggregation Error for New England Metro Areas and for Places
 Appendix D: for New England Metro Areas and for Places D-1 Appendix D: s Figure D-1: New England Metro Areas - Summary of Tract s (2000) Metro ID (msapma99) Metro Area Name Census NCDB 1120 Boston, MA-NH
RANKING OF THE 100 MOST POPULOUS U.S. CITIES 12/7/ /31/2016
 OVERVIEW OF THE DATA The following information is based on incoming communication to the National Human Trafficking Hotline via phone, email, and online tip report from December 7, 2007 December 31, 2016
MANGO MARKET DEVELOPMENT INDEX REPORT
 MANGO MARKET DEVELOPMENT INDEX REPORT 2015-2016 UNDERSTANDING THE MARKET INDEX The Mango Market Development Index is designed to measure and compare mango sales volume relative to population by region
Monthly Employment Watch: Milwaukee and the Nation's Largest Cities
 Monthly Employment Watch: Milwaukee and the Nation's Largest Cities A monthly report on employment trends in the nation s largest cities Prepared by: The University of Wisconsin-Milwaukee Center for Economic
University of Denver
 Glenn R. Mueller, Ph.D. Professor University of Denver Franklin L. Burns School of Real Estate & Construction Management & Real Estate Investment Strategist glenn.mueller@du.edu Supply The new supply of
2012 Airport Ground Transportation
 212 Airport Ground Transportation Fees and Fares Survey Summary March 212 AGTA 212 Airport Fees and Fares Survey Summary Survey Respondents Atlantic City International Airport Gulfport-Biloxi International
Mango Market Development Index
 Mango Market Development Index 2016-2017 Understanding the Market Index The Mango Market Development Index is designed to measure and compare mango volume sold at retail relative to population by region
Fort Lauderdale August 8, 2017
 Fort Lauderdale August 8, 2017 8/10/2017 TAP Software Analytics Division Brian Finucane TAP Reports Jeff Eastman TAP Hotel Reports Jeanne Eastman TAP Data Source Jeff Eastman Cloud Database Numerous Data
District Match Data Availability
 District Match Data Availability National & State Data Location Available National Data Australia Parliament, Provincial and Territory Assemblies Canada Parliament, Provincial Legislative Assemblies New
Location, Location, Location. 19 th Annual NIC Conference NIC MAP Data & Analysis Service
 Location, Location, Location 19 th Annual NIC Conference NIC MAP Data & Analysis Service The Great Occupancy Decline 94% Occupancy Trends Majority Nursing Seniors Housing 93% 92% 91% 92.8% 91.0% 90% 89%
Transborder Air Services Since 1994
 Tri-Airport Open Skies Initiative Transborder Air Services Since 1994 strategic transportation & tourism solutions Prepared for Aéroports de Montréal, The Greater Toronto Airport Authority, and the Vancouver
TOP 100. Transit Bus Fleets Agency 35 ft. Over Artic and 35 ft. Total +/- under 0 3, ,426 82
 L.A. Metro-No. 3 1 1 MTA New York City Transit New York City 2 2 New Jersey Transit Corp. Newark, N.J. 3 3 Metro Los Angeles 4 5 Toronto Transit Commission Toronto 5 10 Chicago Transit Authority Chicago
Agency 35 ft. Over Artic. Trolley 2012 Total and 35 ft. under. 1 1 MTA New York City Transit 0 3, ,344 New York City
 Capital Metro-No. 40 Courtesy Capital Metro 1 1 MTA New York City Transit 0 3,704 640 0 4,344 New York City 2 3 New Jersey Transit Corp. 47 2,263 85 0 2,395 Newark, N.J. 3 2 Metro 50 1,956 378 0 2,384
Emerging Trends in Real Estate Sustaining Momentum but Taking Nothing for Granted
 Emerging Trends in Real Estate 2015 Sustaining Momentum but Taking Nothing for Granted PwC-ULI Outlook on trends 36th edition 368 interviews 1,055 survey responses 1,400+ participants, a record Who? District
Census Affects Children in Poverty by Professors Donald Hernandez and Nancy Denton State University of New York, Albany
 Phone: (301) 457-9900 4700 Silver Hill Road, Suite 1250-3, Suitland, MD 20746 Fax: (301) 457-9901 Census Affects in Poverty by Professors Donald Hernandez and Nancy Denton State University of New York,
TOP 100 Bus Fleets Agency 35 ft. and Over Artic under 35 ft. Total. 18 < metro magazine SEPTEMBER/OCTOBER 2018 metro-magazine.
 1 1 MTA New York City Transit/MTA Bus Co. 0 4,860 951 5,811 New York City 2 3 New Jersey Transit Corp. 418 2,879 85 3,382 Newark, N.J. 3 2 Los Angeles County Metropolitan Transportation Authority 50 1,882
Aviation Insights No. 5
 Aviation Insights Explaining the modern airline industry from an independent, objective perspective No. 5 November 16, 2017 Question: How has air travel in specific metropolitan areas changed in recent
Major Metropolitan Area Sales Tax Rates
 August 19, 2010 No. 239 FISCAL FACT Major Metropolitan Area Sales Tax Rates By Lawrence Summers Introduction General sales taxes levied by state, county and city governments in the United States vary greatly,
2012 Airfares CA Out-of-State City Pairs -
 2012 Airfares Out-of-State City Pairs - Contracted rates are from July 1, 2012 through June 30, 2013. Please note all fares are designated as () and ( ) in airline computer reservation systems. fares are
Pre-Response Meeting RLI # AV-01 Food & Beverage Service Terminals 1 & 2
 Pre-Response Meeting RLI #20120821-AV-01 Food & Beverage Service Terminals 1 & 2 January 17, 2013 FLL in Perspective 2011- FLL ranked as the 21 st busiest airport in the U.S. with 23,349,835 total passengers
Factors Influencing Visitor's Choices of Urban Destinations in North America
 Factors Influencing Visitor's Choices of Urban Destinations in North America Ontario Ministry of Tourism and Recreation May 21, 2004 Study conducted by Global Insight Inc. Executive Summary A. Introduction:
Greater Orlando Aviation Authority Orlando International Airport Destinations by Airline December 2017
 Aer Lingus Dublin, Ireland 3 3 0 0 Aeromexico Mexico City, Mexico 19 4 19 4 0 Air Canada Halifax, Nova Scotia 2 2 Montreal/Dorval, Quebec 12 1 Ottawa, Ontario 5 3 1 Toronto, Ontario 20 1 Vancouver, British
World Class Airport For A World Class City
 World Class Airport For A World Class City Air Service Update October 2017 2017 Air Service Updates February 2017 Cleveland new destination, 2x weekly Raleigh-Durham new destination, 2x weekly March 2017
World Class Airport For A World Class City
 World Class Airport For A World Class City Air Service Update April 2018 2018 Air Service Updates February 2018 Seattle new departure, seasonal, 2x weekly Boston new departure, seasonal, 2x weekly March
Non-stop Scheduled Passenger Service at Fargo as of October Top 20 Domestic O&D Passenger Markets at Fargo Twelve Months Ended June 2006
 0 5000 10000 15000 20000 25000 30000 35000 40000 45000 50000 Airport Traffic Quarterly Non-stop Scheduled Passenger Service at Fargo as of October 2006 Top 20 Domestic O&D Passenger Markets at Fargo Twelve
Airport development within VINCI
 Airport development within VINCI 1 The airport sector: a development goal since 1995 VINCI Concessions: a portfolio of outstanding airport concessions 22 airports in Mexico 2 airports in Cambodia: Phnom
Required Navigation Performance at Alaska Airlines
 Required Navigation Performance at Alaska Airlines Sarah Dalton Director, Airspace and Technology Kotzebue Nome Barrow Prudhoe Bay Adak Bethel Dillingham Dutch King Salmon Fairbanks Anchorage Cordova Harbor
Parking Property Advisors and Parkopedia present: TOP 40 US CITIES PARKING INDEX
 Parking Property Advisors and Parkopedia present: TOP 40 US CITIES PARKING INDEX 2018 Parking Property Advisors and Parkopedia proudly present this 2018 Top 40 US Cities Parking Index. Whether you are
Union Pacific Update September 22, 2016 North East Association of Rail Shippers Conference
 Union Pacific Update September 22, 2016 North East Association of Rail Shippers Conference I Sam Calabro Assistant Vice President Domestic Intermodal Sales 1 Seattle Eastport Portland Twin Cities Duluth
World Class Airport For A World Class City
 World Class Airport For A World Class City Air Service Update December 2018 2018 Air Service Updates February 2018 Delta Air Lines Seattle new departure, seasonal, 2x weekly Delta Air Lines Boston new
San Francisco Travel Association Selling in a Seller s Market DMO Perspective. May 21, 2014
 San Francisco Travel Association Selling in a Seller s Market DMO Perspective May 21, 2014 Agenda Discussion Themes 1. Meetings Are Important 2. Market Meetings Pace 3. Occupancy & Rate 4. Booking Windows
World Class Airport For A World Class City
 World Class Airport For A World Class City Air Service Update April 2017 2017 Air Service Updates February 2017 Cleveland new destination, 2x weekly Raleigh-Durham new destination, 2x weekly March 2017
Hotel Valuation and Transaction Trends for the U.S. Lodging Industry
 Hotel Valuation and Transaction Trends for the U.S. Lodging Industry June 2010 Presented by Steve Rushmore, MAI, FRICS, CHA srushmore@hvs.com - 1 - Value Trend for a Typical U.S. Hotel 1987 1988 1989 1990
Hotel Valuation and Transaction Trends For the U.S. Lodging Industry
 Hotel Valuation and Transaction Trends For the U.S. Lodging Industry Stephen Rushmore, CHA, MAI President and Founder HVS International 372 Willis Avenue Mineola, NY 11501 516-248-8828 ext. 204 srushmore@hvsinternational.com
Greater Orlando Aviation Authority Orlando International Airport Airlines by Destination April 2017
 s by Destination Aguadilla, PR JetBlue 7 Akron/Canton, OH Southwest 1 4 Spirit 7 7 Albany, NY JetBlue 7 Southwest 20 1 1 Albuquerque, NM Southwest 1 1 Aruba, Netherlands Antilles Southwest 7 Atlanta, GA
STATE OF UTAH "BEST VALUE" COOPERATIVE CONTRACT CONTRACT NUMBER: AR2270 November 14, 2016
 Item: Contracted Airline Fares Purchasing Agent: Chad Hinds Phone #: (801) 538-1287 Email: chinds@utah.gov Vendor: 112932A Internet Homepage: Delta Air Lines, Inc. 1030 Delta Blvd. Atlanta, GA 30354 www.statetravel.utah.gov
FBI Drug Demand Reduction Coordinators
 FBI Drug Demand Reduction Coordinators Alabama 2121 Building, Room 1400 Birmingham, AL 35203 (205) 252 7705 One St. Louis Centre One St. Louis Street Mobile, AL 36602 (334) 438 3674 Alaska 222 West Seventh
Passengers Boarded At The Top 50 U. S. Airports ( Updated April 2
 (Ranked By Passenger Enplanements in 2006) Airport Table 1-41: Passengers Boarded at the Top 50 U.S. Airportsa Atlanta, GA (Hartsfield-Jackson Atlanta International) Chicago, IL (Chicago O'Hare International)
MARKETBEAT U.S. Office
 MARKETBEAT U.S. Office Q4 2018 U.S. OFFICE Employment Indicators Market Indicators (Overall) Office: Net Absorption/Asking Rent 4Q TRAILING AVERAGE Office: Overall Vacancy Q4 17 Q4 18 Total Nonfarm Employment
Welcome Central Florida Expressway Authority
 Welcome Central Florida Expressway Authority Central Florida Expressway Authority Phil Brown Executive Director Greater Orlando Aviation Authority November 12, 2015 In the Beginning The Orlando Experience
Greater Orlando Aviation Authority Orlando International Airport Airlines by Destination December 2017
 s by Destination Aguadilla, PR JetBlue 7 2 Akron/Canton, OH Southwest 1 Spirit 6 1 Albany, NY JetBlue 7 Southwest 14 1 Aruba, Netherlands Antilles Southwest 7 Atlanta, GA Delta 112 1 3 Frontier s 7 Southwest
Interest Bearing. Availability Schedule. April For Encoded Cash Letter Deposits received in Miami. Instructions. Schedule
 Instructions Schedule Bank of America OnUs Supplemental Interest Bearing Availability Schedule For Encoded Cash Letter Deposits received in Miami April 2011 Schedule 01 Availability Schedule for Corporate
USA/Canada Lions. Leadership Forum Pins
 USA/Canada Lions Leadership Forum Pins USA/Canada Lions Leadership Pins CONTENTS USA/Canada Lions Leadership Loca ons USA/Canada Lions Leadership Theme Pins USA/Canada Lions Leadership Anniversary Pins
Higher Education in America s Metropolitan Areas A Statistical Profile
 Higher Education in America s Metropolitan Areas A Statistical Profile MSA Study No.2 Higher Education in America s Metropolitan Areas A Statistical Profile CONTENTS Why Metro Areas? 1 Executive Summary
DIRECT FASTENING. 20V MAX * Cordless Concrete Nailer
 DIRECT FASTENING 20V MAX * Cordless INTERCHANGEABLE CONTACT TRIPS Drywall and Mechanical contact trips for application versatility Removable; tool-free ADJUSTABLE POWER 3 settings for pin depth adjustment
 Snakes & Lattes is currently composed of three corporate owned and operated board game cafes in Toronto, ON. Over the last 7 years these have become renowned as Toronto's premiere board game cafe destinations.
RTIA HIGHLIGHTS. Facts & Figures. History. Airlines Scheduled Service: Alaska American/ American Eagle Delta Southwest United US Airways
 A Publication of Reno-Tahoe International Airport Airlines Scheduled Service: Alaska American/ American Eagle Delta Southwest United US Airways Charter Service: Allegiant Air Air-Cargo Capital Cargo Intl.
HORIZON EDITION MAGAZINE HORIZON EDITION MAGAZINE MEDIA KIT
 MEDIA 2018 KIT Unique, Thoughtful and Capable Travelers Affluent Stay longer, spend more Frequent travelers Living fuller lives through outdoor adventure, exotic locales, live music Well-educated Always
Air Service at GMIA. ASQ Milwaukee. January 21, 2013
 Air Service at GMIA ASQ Milwaukee January 21, 2013 Airlines that have served MKE GMIA Airlines 2002 to 2013 GMIA Total Passengers - Enplaned & Deplaned 10,000,000 9,000,000 8,000,000 7,000,000
Greater Orlando Aviation Authority - Orlando International Airport Destinations by Airline November 2018
 Aer Lingus Dublin, Ireland 4 -- 1 4 0 1 Aeromexico Mexico City, Mexico 14 -- -1 14 0-1 Air Canada Halifax, Nova Scotia 1 1 1 Montreal/Dorval, Quebec 12-2 -- Ottawa, Ontario 1-1 -1 Toronto, Ontario 21 --
MARKETBEAT U.S. Office
 MARKETBEAT U.S. Office Q4 2017 U.S. OFFICE Employment Indicators Q4 16 Q4 17 Total Nonfarm Employment 145.2M 147.2M Office-using Employment 31.5M 32.1M Unemployment 4.7% 4.1% Source: BLS Market Indicators
AUGUST 2018 MONTHLY STATISTICAL REPORT
 AUGUST 2018 MONTHLY STATISTICAL REPORT Monthly Statistical Report To: Russell J. Handy, Aviation Director From: Brian Pratte, Air Service Administrator Copies: San Antonio Regional Stakeholders Subject:
Population Estimates for U.S. Cities Report 1: Fastest Growing Cities Based on Numeric Increase,
 ulation s for U.S. Cities Report 1: Fastest Growing Cities Based on Numeric Increase, 2015-2015 1 Phoenix AZ 32,113 2.0 1,582,904 1,615,017 167,393 11.6 2 Los Angeles CA 27,173 0.7 3,949,149 3,976,322
Access Across America: Transit 2014
 Access Across America: Transit 2014 Final Report CTS 14-11 Prepared by: Andrew Owen David Levinson Accessibility Observatory Department of Civil, Environmental, and Geo- Engineering University of Minnesota
High-Speed Rail: Realizing the Potential of Megaregion Economies
 High-Speed Rail: Realizing the Potential of Megaregion Economies Petra Todorovich Director, America 2050 Regional Plan Association May 4, 2010 Rayburn House Office Building 1 2 1 Where High-Speed Rail
MARKETBEAT U.S. Office
 MARKETBEAT U.S. Office Q3 2017 U.S. OFFICE Employment Indicators Net Absorption/Rent 4-QTR TRAILING AVERAGE Q3 16 Q3 17 Total Nonfarm Employment 144.7M 146.6M Office-using Employment 31.3M 31.9M Unemployment
U.S. Lodging Industry Update
 U.S. Lodging Industry Update First Watch on a Long Voyage R. MARK WOODWORTH AMERICAS RESEARCH AGENDA THE ECONOMY WHAT COULD END THE CURRENT CYCLE? LABOR COSTS OUR FORECASTS SHARING ECONOMY UPDATE First
ANDREW WATTERSON Vice President Planning and Revenue Management
 ANDREW WATTERSON Vice President Planning and Revenue Management Safe Harbor Statement The following information contains certain forward looking statements that reflect the Company s current views with
MARKETBEAT U.S. Office
 MARKETBEAT U.S. Office Q2 2017 U.S. OFFICE Employment Indicators Q2 16 Q2 17 Total Nonfarm Employment 143.9M 146.2M Office-using Employment 30.1M 31.8M Unemployment 4.9% 4.4% Source: BLS Market Indicators
November Air Traffic Statistics. Prepared by the Office of Corporate Risk and Strategy
 November 214 Air Traffic Statistics Prepared by the Office of Corporate Risk and Strategy Air Traffic Statistics Table of Contents Summary Air Traffic Summary... 1 SH&E Air Traffic Schedule Activity...
MARKETBEAT U.S. Shopping Center Q4 2018
 MARKETBEAT U.S. Shopping Center Q4 2018 U.S. SHOPPING CENTER Economic Indicators Market Indicators Rent Rate vs. Overall Vacancy Availability by Type Q4 17 Q4 18 Vacancy Rates 6.7% 6.3% Net Absorption
International Convention Badges
 Images may not be the actual size. (Reduced the image sizes to save white space in the catalog) Images provided by Lion Verle Malik Created 07/24/2015. 1923 1924 1925 7th Annual Convention June 26-29,
Rent Monitor. First Quarter Vol. 83 % GROWTH IN NATIONAL RENTS BY SECTOR NATIONAL EFFECTIVE RENTS BY SECTOR TOP 5 MARKETS GAINING MOMENTUM**
 Rent Monitor TM Asking Rents Vol. 83... Effective Rents... Concessions NATIONAL EFFECTIVE RENTS BY SECTOR 5 YEARS % GROWTH IN NATIONAL RENTS BY SECTOR 12 MONTHS 110 105 100 95 INDEX 1Q 2001 = 100 +4. +4.
Greater Orlando Aviation Authority - Orlando International Airport Airlines by Destination July 2018
 s by Destination Aguadilla, PR JetBlue 14 -- -- Akron/Canton, OH Albany, NY Southwest 8-1 -- Albuquerque, NM Frontier s 3 -- 3 Southwest 2 -- -5 Amsterdam, Netherlands Delta 7 -- 7 Aruba, Netherlands Antilles
Major US City Preparedness For an Oil Crisis Which Cities and Metro Areas are Best Prepared for $4 a Gallon Gas and Beyond?
 Major US City Preparedness For an Oil Crisis Which Cities and Metro Areas are Best Prepared for $4 a Gallon Gas and Beyond? March 4, 2008 By Warren Karlenzig President Common Current www.commoncurrent.com
MARKETBEAT U.S. Office
 MARKETBEAT U.S. Office Q3 2018 U.S. OFFICE Employment Indicators Market Indicators (Overall) Office: Net Absorption/Asking Rent 4Q TRAILING AVERAGE Office: Overall Vacancy Q3 17 Q3 18 Total Nonfarm Employment
2016 Air Service Updates
 Air Service Update May 2016 2016 Air Service Updates February 2016 Pittsburgh new destination, 2x weekly April 2016 Los Angeles new departure, 1x daily Atlanta new departure, 1x daily Jacksonville new
August Air Traffic Statistics. Prepared by the Office of Corporate Risk and Strategy
 August 215 Air Traffic Statistics Prepared by the Office of Corporate Risk and Strategy Metropolitan Washington Airports Authority Air Traffic Statistics Table of Contents Summary Air Traffic Summary...
2016 Air Service Updates
 Air Service Update June 2016 2016 Air Service Updates February 2016 Pittsburgh new destination, 2x weekly April 2016 Los Angeles new departure, 1x daily Atlanta new departure, 1x daily Jacksonville new
Per capita carbon emissions from transportation and residential energy use, 2005
 Per capita carbon emissions from transportation and residential energy use, 2005 Metropolitan Area Carbon Footprint Honolulu, HI 1 1.356 Los Angeles-Long Beach-Santa Ana, CA 2 1.413 Portland-Vancouver-Beaverton,
MARKETBEAT U.S. Industrial Snapshot Q4 2015
 MARKETBEAT U.S. Industrial Snapshot Q4 2015 U.S. INDUSTRIAL Employment Indicators Q4 14 Q4 15 Total Nonfarm Employment 140.2M 143.0M Industrial Employment 23.4M 23.6M Unemployment 5.7% 5.0% Market Indicators
A COMPARISON OF THE MILWAUKEE METROPOLITAN AREA TO ITS PEERS
 KRY/WJS/EDL #222377 (PDF: #223479) 1/30/15 PRELIMINARY DRAFT Memorandum Report A COMPARISON OF THE MILWAUKEE METROPOLITAN AREA TO ITS PEERS EXECUTIVE SUMMARY This memorandum report provides a statistical
Office Markets Beginning to Show Signs of Bottoming Out
 OFFiCE north america HIGHLIGHTS Office Markets Beginning to Show Signs of Bottoming Out MarKet indicators Relative to prior period VaCanCY net absorption ConstrUCtion Q2 Q3 * ross J. Moore Chief Economist
NORTH AMERICA CBD PARKING RATE SURVEY HIGHLIGHTS
 COLLIERS INTERNATIONAL l 2007 NORTH AMERICA CBD PARKING RATE SURVEY HIGHLIGHTS Parking Rates Creep Still Higher Colliers 7th annual North America Parking Rate Survey indicates the cost to park continues
UNITED STATES OF AMERICA NORTH AMERICA TOP 10 DAILY PARKING RATES Parking Rates Median (US$) Chicago, IL.
 Chicago, IL.") C O L L I E R S I N T E R N A T I O N A L N O R T H A M E R I C A Parking Rates C B D P A R K I N G R A T E S U R V E Y 2 0 0 9 GLOBAL COMPARISON TOP 25 MONTHLY UNRESERVED PARKING RATES MEDIAN (US$) London
C O L L I E R S I N T E R N A T I O N A L N O R T H A M E R I C A Parking Rates C B D P A R K I N G R A T E S U R V E Y 2 0 0 9 GLOBAL COMPARISON TOP 25 MONTHLY UNRESERVED PARKING RATES MEDIAN (US$) London
MARKETBEAT U.S. Office
 MARKETBEAT U.S. Office Q1 2017 U.S. OFFICE Employment Indicators Q1 16 Q1 17 Total Nonfarm Employment 143.4M 145.7M Offi ce-using Employment 30.9M 31.7M Unemployment 4.9% 4.6% Source: BLS Market Indicators
INDIANA INTERSTATE AND INTRASTATE LOCAL REDUCED CITY-PAIR FARES
 The following section contains city-pair fares that are lower than walkup mileage-based fares. Although shown in only one direction, the fares in this section apply in both directions, unless otherwise
Metropolitan Votes and the 2012 U.S. Election: Population, GDP, Patents and Creative Class
 politan Votes and the 2012 U.S. Election: Population, GDP, Patents and Creative Class Author: Shawn Gilligan, Shawn.Gilligan@rotman.utoronto.ca Zara Matheson, Zara.Matheson@rotman.utoronto.ca Kevin Stolarick,
Greater Orlando Aviation Authority Orlando International Airport Airlines by Destination February 2018
 s by Destination Aguadilla, PR JetBlue 7 Akron/Canton, OH Southwest 1 Spirit 7 Albany, NY JetBlue 7 Southwest 18 5 3 Aruba, Netherlands Antilles Southwest 7 Atlanta, GA Delta 113 1 Frontier s 7 Southwest
Get Smart Market Insights from Our Research Team Customer Conference
 Get Smart Market Insights from Our Research Team 217 Customer Conference Presenters Amanda Nunnink Amanda Nunnink Steve Steve Guggenmos Guggenmos Sara Steve Hoffman Griffin Steve Sara Griffin Hoffmann
PUBLIC TRANSPORTATION INTRODUCTION
 PUBLIC TRANSPORTATION INTRODUCTION 1 OUTLINE Current Status and Recent Trends Significant Influences A Critical Assessment Arguments Supporting Public Transport Future Influences Ingredients for Future
DEPARTMENT OF HOMELAND SECURITY U.S. CUSTOMS AND BORDER PROTECTION. CBP Dec. No EXPANSION OF GLOBAL ENTRY TO NINE ADDITIONAL AIRPORTS
 This document is scheduled to be published in the Federal Register on 10/04/2016 and available online at https://federalregister.gov/d/2016-23966, and on FDsys.gov 9111-14 DEPARTMENT OF HOMELAND SECURITY
MARKETBEAT U.S. Office
 MARKETBEAT U.S. Office Q4 2016 U.S. OFFICE Employment Indicators Market Indicators (Overall) Q4 15 Q4 16 Vacancy Rate 13.5% 13.2% Net Absorption 20.5M 6.9M Under Construction 94.5M 100.2M Weighted Asking