Westshore Development Forum April 11, Hillsborough County Aviation Authority
|
|
|
- Piers York
- 5 years ago
- Views:
Transcription
1 Westshore Development Forum April 11, 2017

2 Aviation in Florida Only state with four large hub airports $144 billion in annual economic activity or output Approximately 43.1 million visitors come to Florida each year on commercial airlines Supports more than 1.3 million jobs 4


3 TPA: An Economic Engine 7,500 people employed by airport and its tenants 81,471 jobs supported Generates $7.8 billion in economic activity each year 3
4 Air Service Update

5 Total Passengers TPA expects to match its record of 19.3 million passengers in FY2017 Total Annual TPA Passengers (millions) 8


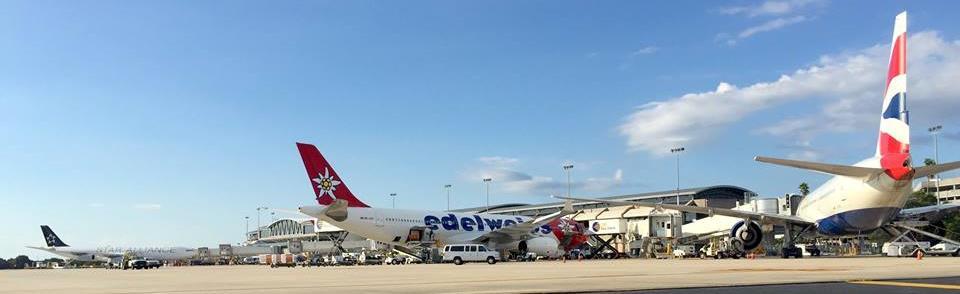
6 New Nonstop International Service London, England Daily service on British Airways Cuba Service to three cities, commercial flights to Havana began Dec. 12 Zurich, Switzerland Edelweiss launched flights in 2011 Panama City, Panama Copa Airlines launched flights in 2013 Bahamas Silver launched Marsh Harbour in 2015; Nassau service began May 26 Frankfurt, Germany Lufthansa service began September 2015 Grand Cayman Seasonal daily service on Cayman Airways in July and August 6
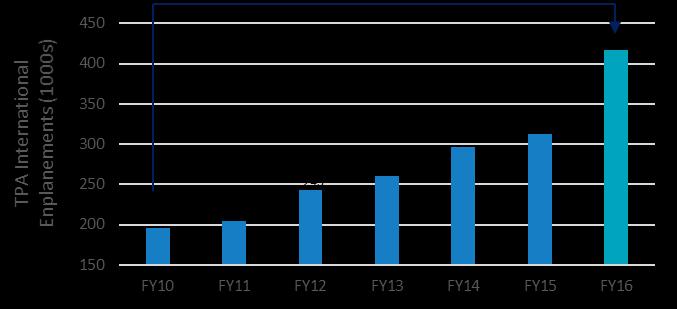
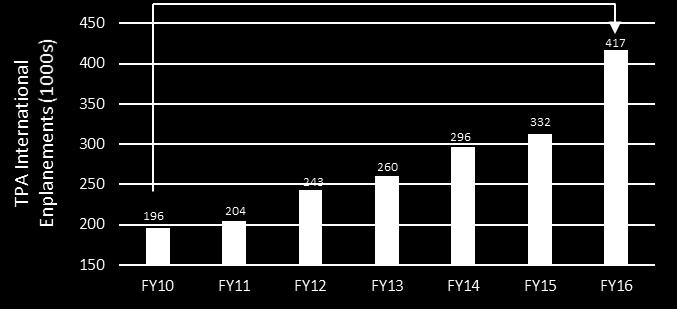
7 International Enplanements More than doubled in FY16 compared to FY % 7

8 8

9 TPA route portfolio includes nonstop service to 86 destinations 18 international and 68 domestic 223 daily departures Seattle San Francisco Las Vegas Los Angeles Denver Ottawa Manchester Minneapolis Toronto Albany Boston Grand Rapids Rochester Hartford Providence Flint Milwaukee Buffalo New York-Long Island ClevelandPittsburgh Newark New York-JFK, LGA Detroit Trenton Latrobe Westchester Co. Chicago-ORD,MDW Columbus Akron Philadelphia Wilmington Indianapolis Baltimore Atlantic City Kansas City Dayton Washington-IAD, DCA Cincinnati Norfolk St. Louis Louisville Nashville Memphis Charlotte Montreal Raleigh/Durham Halifax St. John Reykjavík London Gatwick Frankfurt Zurich Phoenix Dallas-DAL,DFW Birmingham Atlanta Charleston Source: DIIO MI YE Apr new announced service Austin San Antonio Houston-IAH, HOU Pensacola Tallahassee Jacksonville Panama City New Orleans Tampa West Palm Beach Ft. Lauderdale Marsh Harbor Miami Nassau Key West Havana Santa Clara Cancun Havana San Juan Grand Cayman Is. Holguín Panama City 9

10 Master Plan Update


11 Rental Car Center - $315 million October 2015 February


12 ConRAC APM Station Future Westshore Connection Westshore Station ConRAC APM Station Initial Buildout Elevators to Curbside ConRAC APM Station Westshore Station Integration 25


13 SkyConnect - $415 million 21

14 SkyConnect - APM 22


15 Taxiway J - $36 million October 2015 November


16 Main Terminal Expansion - $142 million January 2015 February


17 26
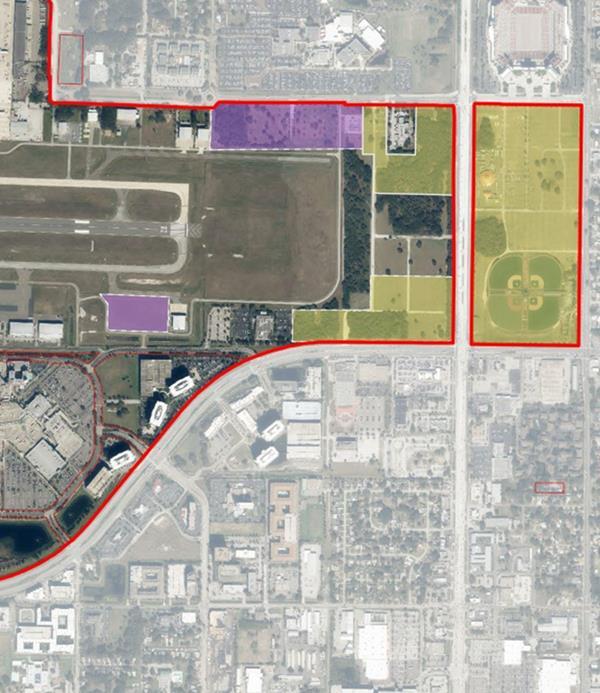
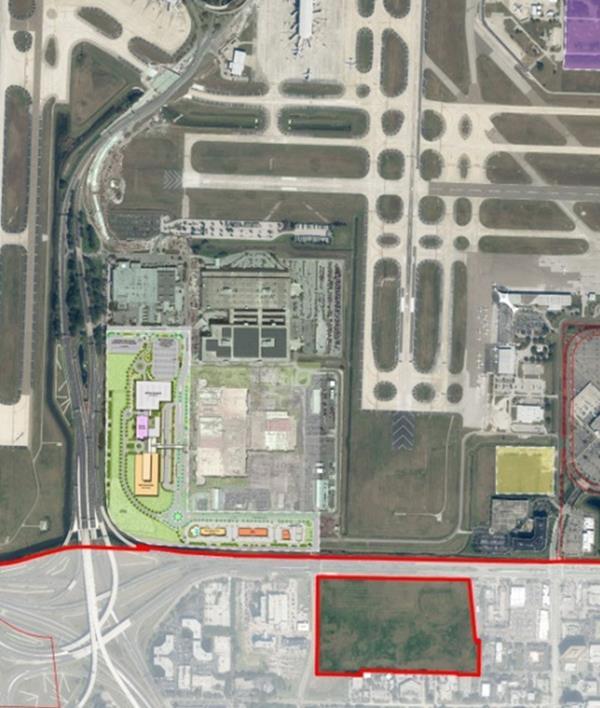
18 Real Estate Update 18

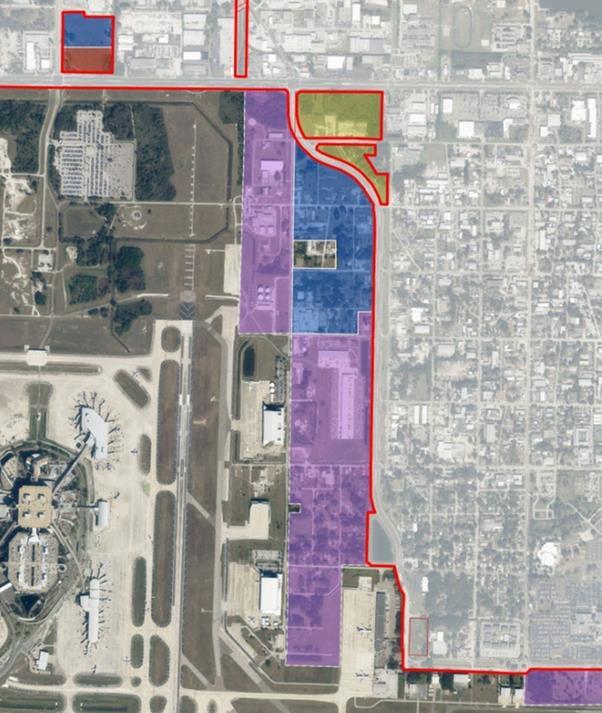
19 Tampa International Airport Our first priority is to be a great airport Heavily regulated environment 3,300 acres acres of future development Very patient approach
20 Tampa International Airport

21 Tampa International Airport


22 Top honors for Customer Satisfaction #2 in North America #2 Favorite U.S. Airport #4 Rated U.S. Airport #2 in North America #1 Large Hub U.S. Airport #3 Best U.S. Airport 22
23 Westshore Development Forum April 11, 2017
Welcome Central Florida Expressway Authority
 Welcome Central Florida Expressway Authority Central Florida Expressway Authority Phil Brown Executive Director Greater Orlando Aviation Authority November 12, 2015 In the Beginning The Orlando Experience
August Air Traffic Statistics. Prepared by the Office of Corporate Risk and Strategy
 August 215 Air Traffic Statistics Prepared by the Office of Corporate Risk and Strategy Metropolitan Washington Airports Authority Air Traffic Statistics Table of Contents Summary Air Traffic Summary...
Pre-Response Meeting RLI # AV-01 Food & Beverage Service Terminals 1 & 2
 Pre-Response Meeting RLI #20120821-AV-01 Food & Beverage Service Terminals 1 & 2 January 17, 2013 FLL in Perspective 2011- FLL ranked as the 21 st busiest airport in the U.S. with 23,349,835 total passengers
November Air Traffic Statistics. Prepared by the Office of Corporate Risk and Strategy
 November 214 Air Traffic Statistics Prepared by the Office of Corporate Risk and Strategy Air Traffic Statistics Table of Contents Summary Air Traffic Summary... 1 SH&E Air Traffic Schedule Activity...
Social Media In Your New & Improved Phoenix Sky Harbor
 Social Media In Your New & Improved Phoenix Sky Harbor AZ Chapter of HSMAI September 19, 2013 It always begins & ends with: skyharbor.com Began Facebook page in October 2010 More than 27,000 people Like
Greater Orlando Aviation Authority Orlando International Airport Destinations by Airline December 2017
 Aer Lingus Dublin, Ireland 3 3 0 0 Aeromexico Mexico City, Mexico 19 4 19 4 0 Air Canada Halifax, Nova Scotia 2 2 Montreal/Dorval, Quebec 12 1 Ottawa, Ontario 5 3 1 Toronto, Ontario 20 1 Vancouver, British
World Class Airport For A World Class City
 World Class Airport For A World Class City Air Service Update October 2017 2017 Air Service Updates February 2017 Cleveland new destination, 2x weekly Raleigh-Durham new destination, 2x weekly March 2017
MANGO MARKET DEVELOPMENT INDEX REPORT
 MANGO MARKET DEVELOPMENT INDEX REPORT 2015-2016 UNDERSTANDING THE MARKET INDEX The Mango Market Development Index is designed to measure and compare mango sales volume relative to population by region
Lower Income Journey to Work Market Share From American Community Survey
 Lower Income Journey to Work Market Share From American Community Survey 2006-2010 Table 1: Overall National Data Table 2: Car, Truck or Van Table 3: Transit Table 4: Metrics Table 1 Work Trip Market Share:
World Class Airport For A World Class City
 World Class Airport For A World Class City Air Service Update April 2017 2017 Air Service Updates February 2017 Cleveland new destination, 2x weekly Raleigh-Durham new destination, 2x weekly March 2017
University of Denver
 Glenn R. Mueller, Ph.D. Professor University of Denver Franklin L. Burns School of Real Estate & Construction Management & Real Estate Investment Strategist glenn.mueller@du.edu Supply The new supply of
World Class Airport For A World Class City
 World Class Airport For A World Class City Air Service Update April 2018 2018 Air Service Updates February 2018 Seattle new departure, seasonal, 2x weekly Boston new departure, seasonal, 2x weekly March
Mango Market Development Index
 Mango Market Development Index 2016-2017 Understanding the Market Index The Mango Market Development Index is designed to measure and compare mango volume sold at retail relative to population by region
World Class Airport For A World Class City
 World Class Airport For A World Class City Air Service Update December 2018 2018 Air Service Updates February 2018 Delta Air Lines Seattle new departure, seasonal, 2x weekly Delta Air Lines Boston new
2016 Air Service Updates
 Air Service Update September 2016 2016 Air Service Updates February 2016 Pittsburgh new destination, 2x weekly April 2016 Los Angeles new departure, 1x daily Atlanta new departure, 1x daily Jacksonville
2016 Air Service Updates
 Air Service Update May 2016 2016 Air Service Updates February 2016 Pittsburgh new destination, 2x weekly April 2016 Los Angeles new departure, 1x daily Atlanta new departure, 1x daily Jacksonville new
Greater Orlando Aviation Authority Orlando International Airport Airlines by Destination April 2017
 s by Destination Aguadilla, PR JetBlue 7 Akron/Canton, OH Southwest 1 4 Spirit 7 7 Albany, NY JetBlue 7 Southwest 20 1 1 Albuquerque, NM Southwest 1 1 Aruba, Netherlands Antilles Southwest 7 Atlanta, GA
December Air Traffic Statistics. Prepared by the Office of Marketing & Consumer Strategy
 December 217 Air Traffic Statistics Prepared by the Office of Marketing & Consumer Strategy 1 This report includes only data submitted by airlines as of the date of publication: February 2, 217. Reports
Appendix D: Aggregation Error for New England Metro Areas and for Places
 Appendix D: for New England Metro Areas and for Places D-1 Appendix D: s Figure D-1: New England Metro Areas - Summary of Tract s (2000) Metro ID (msapma99) Metro Area Name Census NCDB 1120 Boston, MA-NH
TOP 100. Transit Bus Fleets Agency 35 ft. Over Artic and 35 ft. Total +/- under 0 3, ,426 82
 L.A. Metro-No. 3 1 1 MTA New York City Transit New York City 2 2 New Jersey Transit Corp. Newark, N.J. 3 3 Metro Los Angeles 4 5 Toronto Transit Commission Toronto 5 10 Chicago Transit Authority Chicago
Pinellas Tourist Development Council
 Network USA 2013 Air Service Development Conference St. Pete Pride Parade National Tourism Week Tony Jannus Aviation Summit - 2013 Tampa International Airport Volunteer Ambassadors Air Service Development
Greater Orlando Aviation Authority Orlando International Airport Airlines by Destination December 2017
 s by Destination Aguadilla, PR JetBlue 7 2 Akron/Canton, OH Southwest 1 Spirit 6 1 Albany, NY JetBlue 7 Southwest 14 1 Aruba, Netherlands Antilles Southwest 7 Atlanta, GA Delta 112 1 3 Frontier s 7 Southwest
TOP 100 Bus Fleets Agency 35 ft. and Over Artic under 35 ft. Total. 18 < metro magazine SEPTEMBER/OCTOBER 2018 metro-magazine.
 1 1 MTA New York City Transit/MTA Bus Co. 0 4,860 951 5,811 New York City 2 3 New Jersey Transit Corp. 418 2,879 85 3,382 Newark, N.J. 3 2 Los Angeles County Metropolitan Transportation Authority 50 1,882
2016 Air Service Updates
 Air Service Update June 2016 2016 Air Service Updates February 2016 Pittsburgh new destination, 2x weekly April 2016 Los Angeles new departure, 1x daily Atlanta new departure, 1x daily Jacksonville new
2016 Air Service Updates
 2016 Air Service Updates February 2016 Pittsburgh new destination, 2x weekly April 2016 Los Angeles new departure, 1x daily Atlanta new departure, 1x daily Jacksonville new destination, 2x weekly Philadelphia
Greater Orlando Aviation Authority Orlando International Airport Airlines by Destination February 2018
 s by Destination Aguadilla, PR JetBlue 7 Akron/Canton, OH Southwest 1 Spirit 7 Albany, NY JetBlue 7 Southwest 18 5 3 Aruba, Netherlands Antilles Southwest 7 Atlanta, GA Delta 113 1 Frontier s 7 Southwest
August Air Traffic Statistics. Prepared by the Office of Marketing & Consumer Strategy
 August 218 Air Traffic Statistics Prepared by the Office of Marketing & Consumer Strategy This report includes only data submitted by airlines as of the date of publication: October 17, 218. Reports are
Agency 35 ft. Over Artic. Trolley 2012 Total and 35 ft. under. 1 1 MTA New York City Transit 0 3, ,344 New York City
 Capital Metro-No. 40 Courtesy Capital Metro 1 1 MTA New York City Transit 0 3,704 640 0 4,344 New York City 2 3 New Jersey Transit Corp. 47 2,263 85 0 2,395 Newark, N.J. 3 2 Metro 50 1,956 378 0 2,384
Greater Orlando Aviation Authority - Orlando International Airport Airlines by Destination July 2018
 s by Destination Aguadilla, PR JetBlue 14 -- -- Akron/Canton, OH Albany, NY Southwest 8-1 -- Albuquerque, NM Frontier s 3 -- 3 Southwest 2 -- -5 Amsterdam, Netherlands Delta 7 -- 7 Aruba, Netherlands Antilles
Norwegian's Free Airfare Promotion
 Norwegian's Free Airfare Promotion Start planning your next vacation with 200+ cruises to incredible destinations, including Alaska, Bahamas & Florida, Bermuda, Canada & New England, Caribbean, Mexican
air traffic statistics
 December 213 air traffic statistics Prepared by the Office of Finance Department of Internal Controls, Compliance and Financial Strategy Commercial Total Dom Int'l Passengers % Change Air Traffic Summary
March Raymond James Institutional Investors Conference
 March 2009 Raymond James Institutional Investors Conference Safe Harbor Certain of the statements contained herein should be considered forward-looking statements, including within the meaning of the Private
Hector International Airport Fargo, North Dakota
 Hector International Airport Fargo, North Dakota Volume 072 Twelve Months Ended June 2007 November 2007 Airlines Serving Fargo Carried 830 Onboard Passengers Per Day for the Twelve Months Ended June 2007,
October Air Traffic Statistics. Prepared by the Office of Corporate Risk and Strategy
 October 214 Air Traffic Statistics Prepared by the Office of Corporate Risk and Strategy Metropolitan Washington Airports Authority Air Traffic Statistics Table of Contents Summary Air Traffic Summary...
Monthly Employment Watch: Milwaukee and the Nation's Largest Cities
 Monthly Employment Watch: Milwaukee and the Nation's Largest Cities A monthly report on employment trends in the nation s largest cities Prepared by: The University of Wisconsin-Milwaukee Center for Economic
Hector International Airport Fargo, North Dakota
 Hector International Airport Fargo, North Dakota Volume 073 Twelve Months Ended September 2007 January 2008 Airlines Serving Fargo Carried 831 Onboard Passengers Per Day for the Twelve Months Ended September
September Air Traffic Statistics. Prepared by the Office of Corporate Risk and Strategy
 September 214 Air Traffic Statistics Prepared by the Office of Corporate Risk and Strategy Air Traffic Summary September 214 Commercial Total Dom Int'l Passengers % Change Passenger Activity (in Millions)
February Air Traffic Statistics. Prepared by the Office of Corporate Risk and Strategy
 February 215 Air Traffic Statistics Prepared by the Office of Corporate Risk and Strategy Commercial Total Dom Int'l Passengers % Change Air Traffic Summary February 215 Passenger Activity (in Millions)
September Air Traffic Statistics. Prepared by the Office of Marketing & Consumer Strategy
 September 217 Air Traffic Statistics Prepared by the Office of Marketing & Consumer Strategy This report includes only data submitted by airlines as of the date of publication: November 15, 217. Reports
Greater Orlando Aviation Authority - Orlando International Airport Destinations by Airline November 2018
 Aer Lingus Dublin, Ireland 4 -- 1 4 0 1 Aeromexico Mexico City, Mexico 14 -- -1 14 0-1 Air Canada Halifax, Nova Scotia 1 1 1 Montreal/Dorval, Quebec 12-2 -- Ottawa, Ontario 1-1 -1 Toronto, Ontario 21 --
333 W. Campbell Road, Suite 440 Richardson, Texas Cruising for Charity with Randy Limbacher in Tahiti July 28, 2007
 333 W. Campbell Road, Suite 440 Richardson, Texas 75080 972.238.1998 800.952.1998 Cruising for Charity with Randy Limbacher in Tahiti July 28, 2007 Join me for this special annual event to raise money
Passengers Boarded At The Top 50 U. S. Airports ( Updated April 2
 (Ranked By Passenger Enplanements in 2006) Airport Table 1-41: Passengers Boarded at the Top 50 U.S. Airportsa Atlanta, GA (Hartsfield-Jackson Atlanta International) Chicago, IL (Chicago O'Hare International)
Florida's Scheduled Commercial Service Airports
 Florida's Scheduled Commercial Service Airports Volume 154 May 2016 - Domestic Airlines Serving Florida Carried 170,726 Onboard Passengers Per Day for, up 7.7% over the previous 12 months. Highlights in
July air traffic statistics. Prepared by the Office of Corporate Risk and Strategy
 July 214 air traffic statistics Prepared by the Office of Corporate Risk and Strategy Air Traffic Statistics Table of Contents Summary Air Traffic Summary... 1 SH&E Air Traffic Schedule Activity... 3 Passenger
January Air Traffic Statistics. Prepared by the Office of Marketing & Consumer Strategy
 January 218 Air Traffic Statistics Prepared by the Office of Marketing & Consumer Strategy This report includes only data submitted by airlines as of the date of publication: March 21, 218. Reports are
September Air Traffic Statistics. Prepared by the Office of Marketing & Consumer Strategy
 September 2018 Air Traffic Statistics Prepared by the Office of Marketing & Consumer Strategy This report includes only data submitted by airlines as of the date of publication: November 14, 2017. Reports
August air traffic statistics. Prepared by the Office of Corporate Risk and Strategy
 August 214 air traffic statistics Prepared by the Office of Corporate Risk and Strategy Metropolitan Washington Airports Authority Air Traffic Statistics Table of Contents Summary Air Traffic Summary...
Location, Location, Location. 19 th Annual NIC Conference NIC MAP Data & Analysis Service
 Location, Location, Location 19 th Annual NIC Conference NIC MAP Data & Analysis Service The Great Occupancy Decline 94% Occupancy Trends Majority Nursing Seniors Housing 93% 92% 91% 92.8% 91.0% 90% 89%
air traffic statistics
 October 213 air traffic statistics Prepared by the Office of Finance Department of Internal Controls, Compliance and Financial Strategy Metropolitan Washington Airports Authority Air Traffic Statistics
June Air Traffic Statistics. Prepared by the Office of Corporate Risk and Strategy
 June 214 Air Traffic Statistics Prepared by the Office of Corporate Risk and Strategy Air Traffic Statistics Table of Contents Summary Air Traffic Summary... 1 SH&E Air Traffic Schedule Activity... 3 Passenger
Hector International Airport Fargo, North Dakota
 Hector International Airport Fargo, North Dakota Volume 081 Twelve Months Ended March 2008 July 2008 Airlines Serving Fargo Carried 838 Onboard Passengers Per Day for the Twelve Months Ended March 2008,
Transborder Air Services Since 1994
 Tri-Airport Open Skies Initiative Transborder Air Services Since 1994 strategic transportation & tourism solutions Prepared for Aéroports de Montréal, The Greater Toronto Airport Authority, and the Vancouver
Westshore Development Forum Presented by: Alice J. Price, AICP, Senior Project Director
 Presented by: Alice J. Price, AICP, Senior Project Director Back In Time: 1946 Drew Field 1952 Main Terminal 1963 Study Terminal Design Goals: Human Values Airline economics Airport financial considerations
2012 Airport Ground Transportation
 212 Airport Ground Transportation Fees and Fares Survey Summary March 212 AGTA 212 Airport Fees and Fares Survey Summary Survey Respondents Atlantic City International Airport Gulfport-Biloxi International
Delta Already Has Access to 79 Percent of U.S.-Rome Traffic with Its JFK Service
 Already Has Access to 79 Percent of U.S.-Rome Traffic with Its Service Philadelphia R-103 (Rebuttal to -103) Seattle Portland Salt Lake City Denver Chicago Detroit Cleveland Columbus Dayton Pittsburgh
Fort Lauderdale August 8, 2017
 Fort Lauderdale August 8, 2017 8/10/2017 TAP Software Analytics Division Brian Finucane TAP Reports Jeff Eastman TAP Hotel Reports Jeanne Eastman TAP Data Source Jeff Eastman Cloud Database Numerous Data
October 2018 October 2017 Change
 AIR TRAFFIC REPORT SUMMARY: OCTOBER PASSENGERS October October Change Domestic Passengers 1,969,141 1,861,225 5.8% International Passengers 89,328 74,157 20.5% Total Passengers 2,058,469 1,935,382 6.4%
SEPTEMBER 2014 BOARD INFORMATION PACKAGE
 SEPTEMBER 2014 BOARD INFORMATION PACKAGE MEMORANDUM TO: Members of the Airport Authority FROM: Lew Bleiweis, Executive Director DATE: September 19, 2014 Informational Reports: A. July, 2014 Traffic Report
Monthly Employment Watch: Milwaukee and the Nation's Largest Cities
 Monthly Employment Watch: Milwaukee and the Nation's Largest Cities A monthly report on employment trends in the nation s largest cities Prepared by: The University of Wisconsin-Milwaukee Center for Economic
Escape the Conventional. Air Access Report January 2014 to March 2014
 Escape the Conventional Air Access Report January 2014 to March 2014 PUERTO RICO S MAIN AIRPORTS Luis Muñoz Marín International Airport (SJU) in Carolina/San Juan metro area (main airport) - Owned by the
Air Service at GMIA. ASQ Milwaukee. January 21, 2013
 Air Service at GMIA ASQ Milwaukee January 21, 2013 Airlines that have served MKE GMIA Airlines 2002 to 2013 GMIA Total Passengers - Enplaned & Deplaned 10,000,000 9,000,000 8,000,000 7,000,000
Airport development within VINCI
 Airport development within VINCI 1 The airport sector: a development goal since 1995 VINCI Concessions: a portfolio of outstanding airport concessions 22 airports in Mexico 2 airports in Cambodia: Phnom
air traffic statistics
 September 213 air traffic statistics Prepared by the Office of Finance Department of Internal Controls, Compliance and Financial Strategy Commercial Total Int'l Dom Passengers % Change Air Traffic Summary
INDIANA INTERSTATE AND INTRASTATE LOCAL REDUCED CITY-PAIR FARES
 The following section contains city-pair fares that are lower than walkup mileage-based fares. Although shown in only one direction, the fares in this section apply in both directions, unless otherwise
Park-Related Total* Expenditure per Resident, by City
 Park-Related Total* per Resident, by City FY 2008 City Population Total Park per Resident Washington, D.C. 591,833 $153,324,830 $259 Seattle 598,541 $150,672,543 $252 Scottsdale 235,371 $50,429,049 $214
CONNECTICUT INTERSTATE AND INTRASTATE LOCAL REDUCED CITY-PAIR FARES
 PASSENGER TARIFF AND SALES MANUAL CONNECTICUT INTERSTATE AND INTRASTATE LOCAL REDUCED CITY-PAIR S The following section contains city-pair fares that are lower than walkup mileage-based fares. Although
Managing in a High Cost Energy World
 Arne Haak, AirTran Holdings, Inc. Managing in a High Cost Energy World Insert your Company Safe Harbor Certain of the statements contained herein should be considered forward-looking statements, including
High-Speed Rail: Realizing the Potential of Megaregion Economies
 High-Speed Rail: Realizing the Potential of Megaregion Economies Petra Todorovich Director, America 2050 Regional Plan Association May 4, 2010 Rayburn House Office Building 1 2 1 Where High-Speed Rail
Communicating the Importance of Seaports. Bringin It Home. Presented to AAPA Annual Convention Galveston, TX October 27, 2009
 Communicating the Importance of Seaports Bringin It Home Presented to AAPA Annual Convention Galveston, TX October 27, 2009 Jim Kruse Director, Center for Ports & Waterways Texas Transportation Institute
February Air Traffic Statistics. Prepared by the Office of Marketing & Consumer Strategy
 February 218 Air Traffic Statistics Prepared by the Office of Marketing & Consumer Strategy 1 This report includes only data submitted by airlines as of the date of publication: April 18, 218. Reports
Monthly Employment Watch: Milwaukee and the Nation's Largest Cities
 Monthly Employment Watch: Milwaukee and the Nation's Largest Cities A monthly report on employment trends in the nation s largest cities Prepared by: The University of Wisconsin-Milwaukee Center for Economic
International Convention Badges
 Images may not be the actual size. (Reduced the image sizes to save white space in the catalog) Images provided by Lion Verle Malik Created 07/24/2015. 1923 1924 1925 7th Annual Convention June 26-29,
Access Across America: Transit 2014
 Access Across America: Transit 2014 Final Report CTS 14-11 Prepared by: Andrew Owen David Levinson Accessibility Observatory Department of Civil, Environmental, and Geo- Engineering University of Minnesota
Higher Education in America s Metropolitan Areas A Statistical Profile
 Higher Education in America s Metropolitan Areas A Statistical Profile MSA Study No.2 Higher Education in America s Metropolitan Areas A Statistical Profile CONTENTS Why Metro Areas? 1 Executive Summary
79006 AIR TRAVEL SERVICES 2001 AWARD
 Group 79006 AIR TRAVEL SERVICES 2001 AWARD Page 6 Office of General Services - Procurement Services Group Delta Air Lines Albany, NY - Albuquerque, NM ALB - ABQ 901.00 313.00 293.00 420 Delta Air Lines
U.S. Lodging Industry Update
 U.S. Lodging Industry Update First Watch on a Long Voyage R. MARK WOODWORTH AMERICAS RESEARCH AGENDA THE ECONOMY WHAT COULD END THE CURRENT CYCLE? LABOR COSTS OUR FORECASTS SHARING ECONOMY UPDATE First
Union Pacific Update September 22, 2016 North East Association of Rail Shippers Conference
 Union Pacific Update September 22, 2016 North East Association of Rail Shippers Conference I Sam Calabro Assistant Vice President Domestic Intermodal Sales 1 Seattle Eastport Portland Twin Cities Duluth
Rank Place State Native Hawaiian and Pacific Islander population (alone or in combination
 TABLE 2a: 100 Largest Places Ranked by Number of s (race alone or in *) Living in Hard-to- Census Rank Place State (alone or in 1 Honolulu (CDP) HI 64,196 11,130 17.3 2 New York City NY 14,981 8,211 54.8
Trends Shaping Houston Airports
 Trends Shaping Houston Airports Ian Wadsworth Chief Commercial Officer April 2014 Our mission is to connect Houston with the world Connect the people, businesses, cultures and economies of the world to
Parking Property Advisors and Parkopedia present: TOP 40 US CITIES PARKING INDEX
 Parking Property Advisors and Parkopedia present: TOP 40 US CITIES PARKING INDEX 2018 Parking Property Advisors and Parkopedia proudly present this 2018 Top 40 US Cities Parking Index. Whether you are
Interest Bearing. Availability Schedule. April For Encoded Cash Letter Deposits received in Miami. Instructions. Schedule
 Instructions Schedule Bank of America OnUs Supplemental Interest Bearing Availability Schedule For Encoded Cash Letter Deposits received in Miami April 2011 Schedule 01 Availability Schedule for Corporate
 Snakes & Lattes is currently composed of three corporate owned and operated board game cafes in Toronto, ON. Over the last 7 years these have become renowned as Toronto's premiere board game cafe destinations.
Aviation Insights No. 5
 Aviation Insights Explaining the modern airline industry from an independent, objective perspective No. 5 November 16, 2017 Question: How has air travel in specific metropolitan areas changed in recent
A CORPORATE OR MEDICAL USER OPPORTUNITY WELL-LOCATED OFF THE PA TURNPIKE AM Drive. Quakertown, PA INVESTMENT SUMMARY. Page 1
 A CORPORATE OR MEDICAL USER OPPORTUNITY WELL-LOCATED OFF THE PA TURNPIKE 1900 AM Drive Quakertown, PA INVESTMENT SUMMARY Page 1 EXECUTIVE SUMMARY On behalf of ownership, Avison Young is pleased to offer
ILLINOIS INTERSTATE AND INTRASTATE LOCAL REDUCED CITY-PAIR FARES
 The following section contains city-pair fares that are lower than walkup mileage-based fares. Although shown in only one direction, the fares in this section apply in both directions, unless otherwise
MARKETBEAT U.S. Office
 MARKETBEAT U.S. Office Q4 2018 U.S. OFFICE Employment Indicators Market Indicators (Overall) Office: Net Absorption/Asking Rent 4Q TRAILING AVERAGE Office: Overall Vacancy Q4 17 Q4 18 Total Nonfarm Employment
MARKETBEAT U.S. Office
 MARKETBEAT U.S. Office Q2 2017 U.S. OFFICE Employment Indicators Q2 16 Q2 17 Total Nonfarm Employment 143.9M 146.2M Office-using Employment 30.1M 31.8M Unemployment 4.9% 4.4% Source: BLS Market Indicators
Monthly Employment Watch: Milwaukee and the Nation's Largest Cities
 Monthly Employment Watch: Milwaukee and the Nation's Largest Cities A monthly report on employment trends in the nation s largest cities Prepared by: The University of Wisconsin-Milwaukee Center for Economic
Monthly Employment Watch: Milwaukee and the Nation's Largest Cities
 Monthly Employment Watch: Milwaukee and the Nation's Largest Cities A monthly report on employment trends in the nation s largest cities Prepared by: The University of Wisconsin-Milwaukee Center for Economic
Distance to Jacksonville from Select Cities
 Distance to Jacksonville from Select Cities Source: Mapquest.com, Expedia.com, ManagementReporting.com City Miles Driving Time (Hrs) Atlanta, GA 347 5.75 1 Boston, MA 1,160 18.5 4 Chicago, IL 1,063 17.5
AGENCY: U.S. Customs and Border Protection; Department of Homeland Security.
 This document is scheduled to be published in the Federal Register on 06/25/2013 and available online at http://federalregister.gov/a/2013-15087, and on FDsys.gov 9111-14 DEPARTMENT OF HOMELAND SECURITY
Population Estimates for U.S. Cities Report 1: Fastest Growing Cities Based on Numeric Increase,
 ulation s for U.S. Cities Report 1: Fastest Growing Cities Based on Numeric Increase, 2015-2015 1 Phoenix AZ 32,113 2.0 1,582,904 1,615,017 167,393 11.6 2 Los Angeles CA 27,173 0.7 3,949,149 3,976,322
MARKETBEAT U.S. Office
 MARKETBEAT U.S. Office Q3 2018 U.S. OFFICE Employment Indicators Market Indicators (Overall) Office: Net Absorption/Asking Rent 4Q TRAILING AVERAGE Office: Overall Vacancy Q3 17 Q3 18 Total Nonfarm Employment
RANKING OF THE 100 MOST POPULOUS U.S. CITIES 12/7/ /31/2016
 OVERVIEW OF THE DATA The following information is based on incoming communication to the National Human Trafficking Hotline via phone, email, and online tip report from December 7, 2007 December 31, 2016
16,000 50,000 WALKATHON CITIES WALKERS MILES
 WALKATHON 54 USA ARIZONA Phoenix ARKANSAS Little Rock CALIFORNIA Fresno Los Angeles Sacramento San Diego San Francisco San Jose CONNECTICUT Hartford DELAWARE New Castle FLORIDA Miami Orlando Tampa GEORGIA
Rent Monitor. First Quarter Vol. 83 % GROWTH IN NATIONAL RENTS BY SECTOR NATIONAL EFFECTIVE RENTS BY SECTOR TOP 5 MARKETS GAINING MOMENTUM**
 Rent Monitor TM Asking Rents Vol. 83... Effective Rents... Concessions NATIONAL EFFECTIVE RENTS BY SECTOR 5 YEARS % GROWTH IN NATIONAL RENTS BY SECTOR 12 MONTHS 110 105 100 95 INDEX 1Q 2001 = 100 +4. +4.
District Match Data Availability
 District Match Data Availability National & State Data Location Available National Data Australia Parliament, Provincial and Territory Assemblies Canada Parliament, Provincial Legislative Assemblies New
MARKETBEAT U.S. Office
 MARKETBEAT U.S. Office Q4 2017 U.S. OFFICE Employment Indicators Q4 16 Q4 17 Total Nonfarm Employment 145.2M 147.2M Office-using Employment 31.5M 32.1M Unemployment 4.7% 4.1% Source: BLS Market Indicators
FBI Drug Demand Reduction Coordinators
 FBI Drug Demand Reduction Coordinators Alabama 2121 Building, Room 1400 Birmingham, AL 35203 (205) 252 7705 One St. Louis Centre One St. Louis Street Mobile, AL 36602 (334) 438 3674 Alaska 222 West Seventh
Greater Orlando Aviation Authority - Orlando International Airport Airlines by Destination November 2018
 s by Destination Aguadilla, PR JetBlue 7 -- 2 Spirit 7 1 7 Akron/Canton, OH Spirit 6 1 -- Albany, NY Frontier s 3 -- 3 JetBlue 7 -- -- Southwest 14 6 -- Albuquerque, NM Frontier s 2 -- 2 Amsterdam, Netherlands