MONTHLY REPORT DECEMBER 2017
|
|
|
- Leslie Stafford
- 5 years ago
- Views:
Transcription


1 & MONTHLY REPORT DECEMBER 2017
2 SECTION Sun Tran & Sun Van Monthly Operations Report Table of Contents December 2017 PAGE I.System Highlights and Accomplishments 3-12 II.Sun Tran a.ridership 13 b.revenue 14 c.pass Sales 15 d.summary of Expenses 16 e.system Summary 17 f.annual Ridership 18 g.performance Indicators h.route Performance Profile 30 i.route Passenger Per Hour Ranking 31 j.customer Satisfaction 32 III.Sun Van a.ridership & Revenue Collection 33 b.summary of Expenses 34 c.system Summary d.annual Ridership 37 e.performance Indicators f.customer Satisfaction 44 IV.Glossaries
3 Sun Tran & Sun Van Strategic Goals Progress Update December 2017 In addition to highlighting major accomplishments and programs each month, this section communicates Sun Tran and Sun Van s ongoing efforts to achieve FY 2018 system goals and objectives. Provide Excellent Customer Service Sun Tran Customer Service Sun Tran s Customer Service Center answered 94 percent of the total number of calls received, a 2 percent increase over the previous month and a 2 percent increase from December Sun Tran experienced a 4.5 percent decrease in compliments, when compared to the previous month. The number of complaints during the month decreased by 14.9 percent when compared to the previous month and increased by 36.2 percent when compared to the same time last year. Customer Service Representatives met the established goal of answering at least 85.0 percent of total calls, keeping the average ring time at 14 seconds or less and keeping the calls at 90 seconds or less. These goals are to help ensure better service for the thousands of passengers who phone the call center. Sun Van Customer Calls Sun Van s Dispatch answered 88.5 percent of calls received during the month of December, a decrease of 1.0 percent from November 2017, reaching their goal, and a 0.5 percent increase from December Reservations answered 96.1 percent of calls during the month of December, a decrease of 0.7 percent from the previous month, and a 0.5 increase when compared to December Spanish Reservations answered 95.3 percent of the calls received, a 0.6 percent increase from November 2017, and a 0.2 percent increase from December
4 Sun Tran & Sun Van Strategic Goals Progress Update December 2017 Dispatch answered 15,589 calls. Reservations answered 15,646. Reservations Spanish answered 888 calls. In December 2016, Sun Van staff answered 17,553 in Dispatch, 16,893 in Reservations, and 879 in Spanish Reservations. The percentage of abandoned calls to Dispatch was 2.5 percent, not reaching the goal of less than 2.5 percent. Reservations abandoned calls were 1.6 percent, reaching their goal, but Spanish Reservations abandoned calls were 2.6 percent, not reaching their goal. On-time performance for the month of December 2017 averaged 94.8 percent, not reaching our goal of 96 percent. Special Services Office Activity The Special Services staff assisted approximately 3,525 customers during the month of December. The daily average was 207 customers compared to 205 for the prior month of November The daily average for December 2016 was 213. Staff issued a total of 2,014 SunGO ID & Cards during the month of December 2017, compared to 2,376 issued in November 2017 and 2,463 issued in December 2016 (prior year). Specifically, the cards issued in December 2017 were as follows: 1,356 low-income (427 replacements), 468 disabled (304 replacements), and 190 senior (54 replacements). Agents answered 2,833 calls on the English line or 88.2 percent calls answered, with 309 calls abandoned. The percent calls answered for English in December was higher than the prior month, which was 87.4 percent, and was higher by 4.3 percent from December Agents also answered 53 calls on the Spanish line with 91.4 percent calls answered with one call abandoned. The percent calls answered for Spanish in December was lower than the prior month in November 2017, which was 92.6 percent, and lower than in December 2016, which was 91.5 percent. We continue to monitor staffing needs to improve call statistics and decrease abandoned calls and wait times. Ensure an Efficient and Effective Operation Sun Tran Maintenance Goals A total of 131 preventative maintenance inspections of Sun Tran buses were completed, with 100 percent on-time 4
5 Sun Tran & Sun Van Strategic Goals Progress Update December 2017 performance. A total of 18 preventative maintenance inspections of support vehicles were completed, with 94.4 percent ontime performance, and 41 A/C inspections of buses were completed, with 100 percent on-time performance. A total of 18 Quality Assurance Inspections were performed by Maintenance Managers and Supervisors. The active fleet for Garage 1 (South Yard) is 121 buses and the active fleet at Garage 2 (NW Facility) is 125 buses. The total active fleet for the month remains the same as the previous month at 246. Warranty Goal For Fiscal Year 2018, the goal is to reduce cumulative un-recovered warranty by $70,000. The monthly goal is $5, Warranty recovered during the month of December was $16, The cumulative warranty recovered through December was $73, The monthly and the cumulative FY 2018 goal were met. Workforce Compliance On 12/3/2017, staff prepared for the new Minimum Wage for Arizona. The wage increases to $10.50 an hour. The change only affects four people at Sun Van. No employees at Sun Tran are affected. Employee and Labor Relations On 12/1/2017, open enrollment started for Bargaining Unit employees 401(k) and Administrative employees 457(b) retirement plans. On 12/5/2017, a staff meeting was held at Sun Van to discuss on-time performance, passenger no-shows and staffing. On 12/7/2017, HR and representatives from Health Net met to discuss and plan out 2018 Wellness Program for Bargaining Unit and Administrative employees at Sun Van and Administrative employees at Sun Tran. On 12/12/2017, HR attended a Job Fair at the Double Tree Hotel sponsored by Jobertising.com. HR was able to get numerous applications for the current open positions, including Coach and Van Operators. 5
6 Sun Tran & Sun Van Strategic Goals Progress Update December 2017 On 12/13/17, Sun Van sponsored a Holiday party for all Bargaining Unit employees. A portion was catered and the rest was Pot Luck with the participation of Administrative and Bargaining Unit employees. On 12/14/2017, Sun Tran sponsored a Holiday Party for all Bargaining Unit employees at both the North Yard and South yard at Sun Tran. The meals were catered and desserts were Pot Luck with the participation of Administrative and Bargaining Unit employees. On 12/15/2017, several Sun Tran employees volunteered their time to collect toys at Walmart for the Stuff the Bus event. On 12/18/17, seven Coach Operator Trainees were promoted to full time Coach Operators. On 12/18/2017, HR and IT held a meeting at Sun Van to discuss the processing and implementation of the new employee badges. Training was given to the key HR employees who will be taking the new pictures. On 12/19/2017, three trainee Van Operators were promoted to part time Van Operators at Sun Van. On 12/19/17, a Christmas Pot Luck was held at Sun Tran for all the Administrative employees. Cost Saving Measures & Efficient Facilities During the month of December, Sun Tran s Northwest Facility produced 9,370 kwh of electricity from the solar panels. This provides a cost avoidance of approximately $937 for the electricity generated and a Tucson Electric Power solar credit reimbursement to the City of Tucson s Department of Transportation of $1,499. Transit Task Force (TTF) At the general meeting of the Transit Task Force (TTF) on 12/4, staff presented information on the 90-day trial of expanded hours for the Special Services Office. Sun Tran staff continues to participate in a TTF subcommittee meeting to help the group develop a draft of Goals & Objectives for their 5 Year Strategic Transit Plan. Sun Tran is taking the lead on developing the first draft of the 5 year transit strategic plan and will present it to the TTF subcommittee in January. 6
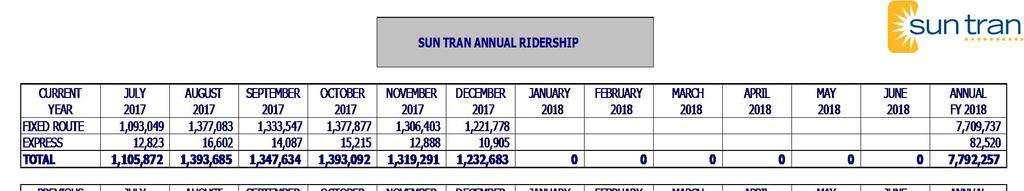
7 Sun Tran & Sun Van Strategic Goals Progress Update December 2017 Transit Center Beautification Project Sun Tran s Marketing Department is initiating projects related to the usefulness and aesthetics of the three Transit Centers. Staff continued developing posters for the kiosks bays of the three Transit Centers to promote the routes that connect riders to popular Tucson destinations/attractions. Staff reached out to destinations on a Sun Tran route for photos for the posters. The Tucson destinations are pleased to be considered and featured at the transit centers and staff should have the first draft of the posters soon. Community Event Calendar Sun Tran completed 75 events for 2017 and updated a 2018 Community Events Calendar to assist Marketing with communicating more effectively, internally and externally, about upcoming community events, route detours and service changes. Improve Safety and Security Safety Recognition Sun Tran recognized 131 drivers with 5-10 years and 52 drivers with 10+ years of driving with no preventable accidents. Trainings In December, RATP DEV provided Accident Investigation training to forty-one Sun Tran and Sun Van supervisors. The primary goals of the training sessions were to emphasize the importance of collecting evidence and data, analyzing evidence and data to determine a root cause, and developing preventative strategies to prevent recurrence. As a guiding principle, accident investigators should remember that our primary goal is to prevent an accident or incident from happening again. Increase Ridership Sun Tran Ridership Passenger ridership for December totaled 1,232,683. This is a decrease of 143,711 or 10.4 percent when compared with the prior year and is under the budgeted level by 237,767 or 16.2 percent. 7
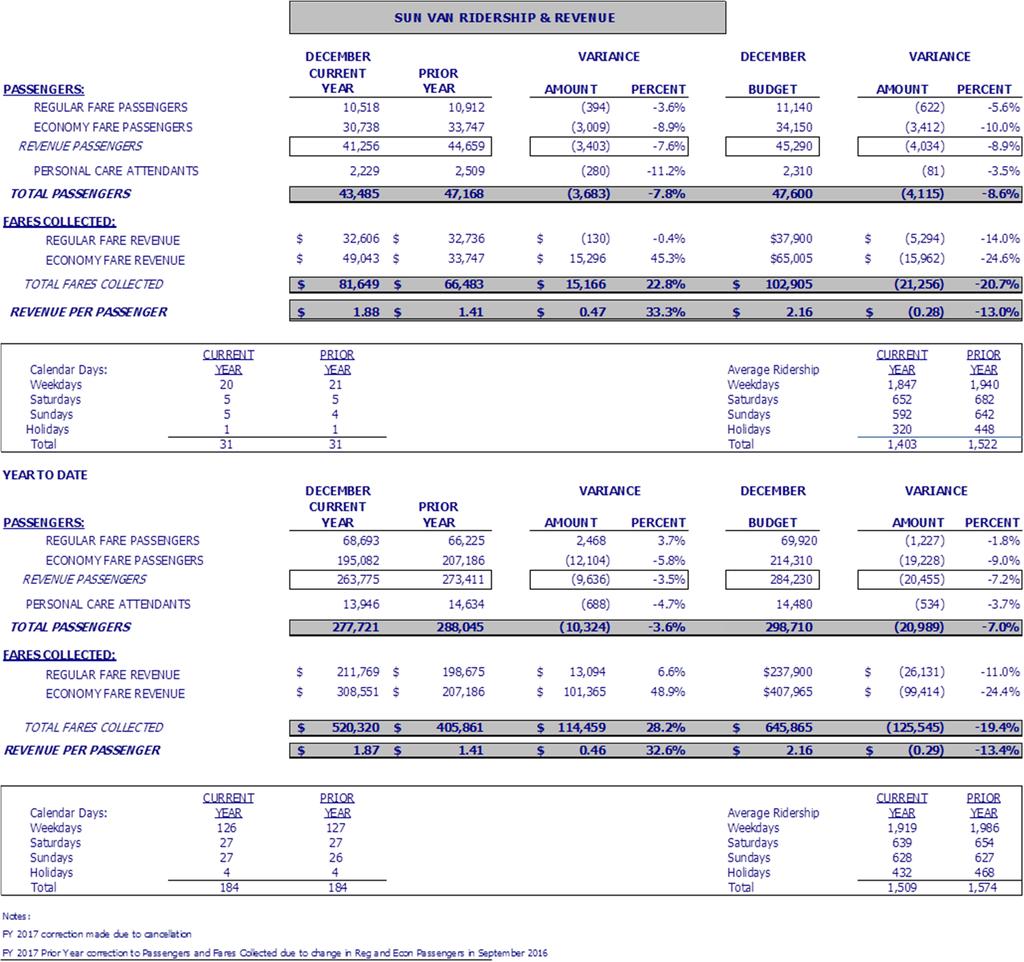
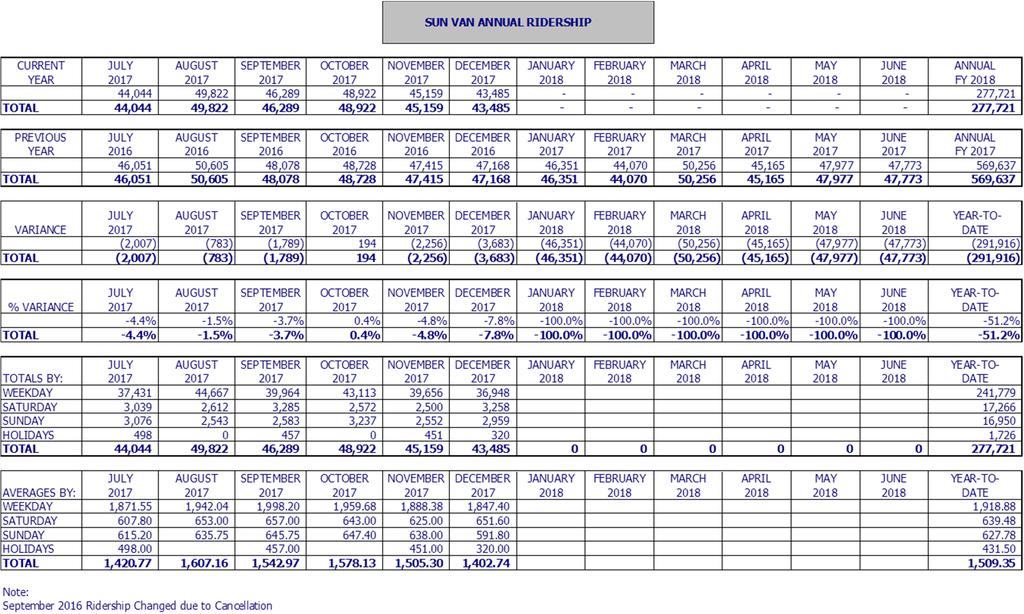
8 Sun Tran & Sun Van Strategic Goals Progress Update December 2017 Passenger revenue for December was $918,013. This is an increase of $34,848 or 3.9 percent when compared to the prior year. Sun Tran s December pass sales were $521,716 after allocating Sun Link and Sun Shuttle s pass sales revenue share of $141,229 and $16,994 respectively. Current month passenger revenue is under budget by $94,547 or 9.3 percent. Revenue per passenger boarding in December was $.75 cents compared to $.64 cents last year for the same time period. The overall farebox recovery ratio for December is 15.1 percent, while YTD average is 19 percent. Sun Van Ridership Sun Van ridership for December totaled 43,485. This is a decrease of 3,683 or 7.8 percent when compared to December Revenue passengers, excluding Personal Care Attendants (PCA) decreased by 3,403 passengers or 7.6 percent. Total passenger ridership year to date is 277,721. This is a decrease of 10,324 or 3.6 percent when compared to last fiscal year. Revenue passengers, excluding Personal Care Attendants (PCA), decreased by 9,636 passengers or 3.5 percent. Productivity was 1.91 passengers per hour, due to cancellations and program closures. In December, Sun Van and Teamsters Local 104 representatives approved a three-year labor contract. Sun Link In partnership with KXCI Community Radio, Sun Tran developed promotional materials for The Pueblo Express to Santa, a festive sing-along ride on the Sun Link streetcar, which took place on Sunday, December 17th. Staff from KXCI brought singers aboard the streetcar to sing carols with Sun Link passengers traveling from the Mercado San Agustin to Main Gate Square. Sun Tran staff created posters to promote the event which were displayed in the streetcar, at the shelters, and at local businesses within the five districts. Staff also promoted the event via social media, the Sun Link website, and a press release. KXCI radio promoted the event on-air and on the KXCI website. 8
9 Sun Tran & Sun Van Strategic Goals Progress Update December 2017 Sun Link provided extended service hours until 2 a.m. on New Year s Eve. Sun Tran staff developed communications to inform the general public of the temporary service change, including a press release, and social media posts. Messaging focused on Sun Link being a designated driver for those celebrating the New Year in the districts along the streetcar route. In December, Marketing staff promoted riding the streetcar to the following community events: the Fourth Avenue Winter Street Fair, Second Saturday, Tucson Roadrunners games, Parade of Lights, Mercado Holiday Bazaar, Downtown Tucson Partnership events at Jacome Plaza, and the Arizona Bowl game. Staff from Sun Tran met with representatives from Sun Link and TDOT in communications planning meetings focusing on issues such as the Roadrunners partnership collaboration, transit fare change, winter service hours, the Pueblo Express to Santa, New Year s Eve service hours, holiday schedule, and social media planning for large Tucson events. Marketing campaigns related to Sun Tran and Sun Link ridership Frequent Transit Network: Sun Tran staff met with AdVision Outdoor to continue running ads on bus shelters and bus benches to promote commuting on routes of the Frequent Transit Network (FTN). Staff specified advertising locations with AdVision Outdoor at major destinations along routes of the FTN. Staff also met with representatives from TucsonNewsNow.com (KOLD) in December to discuss and improve upon performance of the digital ads running to encourage employees to use Sun Tran for their commute. The digital ads are served to online users working at specific Travel Reduction Program employers located near FTN routes to encourage commuting by transit. Public relations ads: Staff previously conducted a photoshoot with several Sun Tran drivers to be used in public relations ads, displaying Sun Tran staff as helpful and cooperative as a way to connect with the public and promote ridership. Staff reviewed photos to use in advertisements including the February 2018 Ride Guide. In early 2018, there will be an additional photoshoot with more drivers for an additional aspect of the public relations campaign. 9
10 Sun Tran & Sun Van Strategic Goals Progress Update December Day Pass: Staff maintained fliers at Sun Link stops, and posters in Sun Link and Sun Tran vehicles, and promoted the 3-Day Pass in social media. Sun Tran is conducting a mini survey for riders purchasing the 3-Day Pass at Sales Outlets. This is a second run on the survey that will run through February 15th. The survey will provide demographics data of those who purchased the 3-Day Pass, which could be used in a Title VI analysis, if the 3-Day Pass is chosen to be considered as a permanent pass option. Get on Board program: Sun Tran brainstormed ways to expand the Get on Board program as a means of increasing ridership. Staff met with Banner University Medical Center to recruit them for the Get on Board program in U-Pass sales: Posters for kiosk ads were developed for three locations at University of Arizona near the Sun Link streetcar route. Provide information for riders and potential riders Special Services Hours: Sun Tran staff completed the distribution of communication materials for Special Services Office modified hours on the December 1st start date. Materials included posters, transit center monitors, social media posts, website slider, a press release, and an memo to Sales Outlets and Get On Board organizations. Staff delivered posters to libraries, Parks & Recreation sales outlets, Armory Park senior center, and the Pima Council on Aging. Holiday Schedules: Sun Tran staff sent a press release and published social media posts of transit schedules on Christmas Day and New Year s Day. Sun Shuttle to Sabino Canyon: Sun Tran staff developed posters for the free Sun Shuttle service to Sabino Canyon from Udall Park, December 26th - January 1st. Staff displayed the posters at Sabino Canyon, Udall Park, and in nearby hotels. Social media posts and a website button were also created. 10
11 Sun Tran & Sun Van Strategic Goals Progress Update December 2017 Service to Salvation Army Christmas Dinner: Sun Tran provided free service on Christmas Day to the Salvation Army s Annual Christmas Dinner. Sun Tran staff included times and route information in the press release for Christmas Day s transit schedule. Ride Guide: Sun Tran staff began executing the task list for the next Ride Guide edition, including updating maps, schedules, fares and pass options. Staff continued to monitor supplies of the current ride guide distributed on buses, at organizations and sales outlets. Staff also began drafting a survey intended to determine riders usage of the ride guide. Communications for FY 2018 Fare Change The Marketing Department printed and delivered multiple communications materials for Sun Tran, Sun Express, Sun Link, Sun Shuttle and Sun Van to be implemented prior to the fare change. Print and digital materials include posters, stripcards, decals for TVMs and fareboxes, webpages, digital displays, social media posts, media releases, etc. to inform riders and the general public of the fare change expected to take effect January 1, Internal communications were also sent to all Operators, Customer Service Representatives and Special Services Office clerks. Community Outreach On 12/14/2017, staff led a Sun Tran Accessible Rider Training (START) session at Hohokam Elementary School for 17 special needs students. On 12/15/2017, Sun Tran staff participated in the Annual Stuff-the-Bus Toy Drive, at Walmart on Speedway and Kolb, benefiting the Salvation Army. Two buses were completely filled with toys for youth, and altogether over 18,000 toys were gathered at the event. Expansion of Sales Outlets: Sun Tran and Bashas Inc/Food City signed an agreement in December, and Food City will become a SunGO Sales Outlet in early
12 Sun Tran & Sun Van Strategic Goals Progress Update December 2017 Sun Tran communicated with Green Valley/Sahuarita Chamber of Commerce about possibly becoming a SunGO Sales Outlet. Collaborations: Sun Tran staff met with AdVision Outdoor and Lamar Advertising about PSA ads on Sun Tran buses, bus benches and bus shelters. Online Passenger Tools Sun Tran s Facebook page had 514 page views in December. Sun Tran s most popular post, on December 29, announced free Sun Shuttle service to Sabino Canyon during the holidays. The post reached 1,078 people, earning 35 reactions and 12 shares, compared to an average of 339 people reached per post. Sun Tran s Twitter audience is 1,786 followers which is a 0.2 percent increase when compared to the previous month, and a 5.8 percent increase when compared to the same time last year. Sun Tran s Twitter page had 14.4 thousand impressions, a decrease of 11.1 percent when compared to the previous month. On December 8, the top tweet announced the new 2018 transit fares and earned 2,709 impressions. Sun Tran s website had 108,114 page views, a decrease of 7.0 percent when compared to the previous month. The website had a total of 84,681 unique page views, a decrease of 7.1 percent from the previous month. The average time on a page by a user is 3 minutes 25 seconds, an increase of 0.8 percent from the previous month. In December, 80.4 percent of sessions were from a mobile device (56,737), and 66,592 users navigated to the Routes & Times page. The Routes & Times page continues to be the most popular page on the Sun Tran website. There were 30,977 new users in December, a decrease of 5.2 percent from the previous month. GoTucson Mobile App The GoTucson mobile app has continued to be promoted during the month of December 2017 through placed advertising, social media and online. The number of individuals utilizing the GoTucson mobile app to ride transit throughout the community was 5,314 compared to 6,564 in November
 -9.2% 609,280 (103,524) -17.0% EXPRESS FARE 12,918 14,483 (1,565) -10.8% 15,240 (2,322) -15.2% DAY PASS 76,162 78,321 (2,159) -2.8% 81,220 (5,058) -6.")
13 SUN TRAN RIDERSHIP DECEMBER VARIANCE DECEMBER VARIANCE ROUTE PASSENGERS: CURRENT YEAR PRIOR YEAR AMOUNT PERCENT BUDGET AMOUNT PERCENT FULL FARE 339, ,004 (44,875) -11.7% 404,140 (65,011) -16.1% ECONOMY FARE 505, ,986 (51,230) -9.2% 609,280 (103,524) -17.0% EXPRESS FARE 12,918 14,483 (1,565) -10.8% 15,240 (2,322) -15.2% DAY PASS 76,162 78,321 (2,159) -2.8% 81,220 (5,058) -6.2% OTHER 70,479 67,183 3, % 70,710 (231) -0.3% ROUTE REVENUE PASSENGERS 1,004,444 1,100,977 (96,533) -8.8% 1,180,590 (176,146) -14.9% TRANSFER PASSENGERS 201, ,519 (41,425) -17.1% 255,240 (54,146) -21.2% CHILDREN =<5 26,459 32,040 (5,581) -17.4% 33,720 (7,261) -21.5% PCA (172) -20.0% 900 (214) -23.8% FREE RIDE DAY % % OTHER ROUTE PASSENGERS 228, ,417 (47,178) -17.1% 289,860 (61,621) -21.3% TOTAL PASSENGERS 1,232,683 1,376,394 (143,711) -10.4% 1,470,450 (237,767) -16.2% (1,232,683) (1,376,394) (1,470,450) CURRENT YEAR PRIOR YEAR CURRENT YEAR Calendar Days School Days Average Route Ridership CURRENT PRIOR Weekdays YEAR YEAR Weekdays 51,078 55,193 Saturdays Saturday 24,487 25,497 Sundays 5 4 Sunday 15,902 16,579 Holidays 1 1 Holidays 9,183 23,550 Total Total 39,764 44,400 YEAR TO DATE DECEMBER VARIANCE DECEMBER VARIANCE ROUTE PASSENGERS: CURRENT YEAR PRIOR YEAR AMOUNT PERCENT BUDGET AMOUNT PERCENT FULL FARE 2,150,356 2,395,389 (245,033) -10.2% 2,521,080 (370,724) -14.7% ECONOMY FARE 3,185,877 3,341,191 (155,314) -4.6% 3,634,760 (448,883) -12.3% EXPRESS FARE 96, ,067 (10,535) -9.8% 112,690 (16,158) -14.3% DAY PASS 520, ,186 15, % 524,560 (4,530) -0.9% OTHER 413, ,227 (30,296) -6.8% 467,520 (53,589) -11.5% ROUTE REVENUE PASSENGERS 6,366,726 6,792,060 (425,334) -6.3% 7,260,610 (893,884) -12.3% TRANSFER PASSENGERS 1,252,634 1,508,512 (255,878) -17.0% 1,587,670 (335,036) -21.1% CHILDREN =<5 168, ,803 (19,773) -10.5% 197,660 (29,630) -15.0% PCA 4,867 4, % 4,920 (53) -1.1% FREE RIDE DAY % % OTHER ROUTE PASSENGERS 1,425,531 1,701,002 (275,471) -16.2% 1,790,250 (364,719) -20.4% TOTAL PASSENGERS 7,792,257 8,493,062 (700,805) -8.3% 9,050,860 (1,258,603) -13.9% (7,792,257) (8,493,062) (9,050,860) Calendar Days CURRENT YEAR PRIOR YEAR School Days Average Route Ridership CURRENT YEAR Weekdays CURRENT YEAR PRIOR YEAR Weekdays 52,663 56,773 Saturdays Saturday 24,261 27,035 Sundays Sunday 16,502 18,402 Holidays 4 4 Holidays 14,020 18,615 PRIOR YEAR PRIOR YEAR Total Total 42,349 46,158 13
14 SUN TRAN REVENUE DECEMBER CURRENT YEAR ` DECEMBER VARIANCE PRIOR YEAR AMOUNT PERCENT BUDGET AMOUNT PERCENT ROUTE PASSENGER REVENUE: FULL FARE $ 570,398 $ 546,088 $ 24, % $ 626,340 $ (55,942) -8.9% ECONOMY FARE 220, ,581 26, % 222,200 (2,098) -0.9% EXPRESS FARE 29,952 31,354 (1,402) -4.5% 35,420 (5,468) -15.4% DAY PASS 46,002 57,593 (11,591) -20.1% 66,040 (20,039) -30.3% OTHER 51,560 54,550 (2,990) -5.5% 62,560 (11,000) -17.6% TOTAL ROUTE PASSENGER REVENUE $ 918,013 $ 883,165 $ 34, % $ 1,012,560 $ (94,547) -9.3% (918,013) (883,165) YEAR TO DATE DECEMBER VARIANCE DECEMBER VARIANCE CURRENT YEAR VARIANCE PRIOR YEAR AMOUNT PERCENT BUDGET AMOUNT PERCENT ROUTE PASSENGER REVENUE: FULL FARE $ 3,582,786 $ 3,294,146 $ 288, % $ 4,084,800 $ (502,014) -12.3% ECONOMY FARE 1,193,150 1,051, , % 1,177,280 15, % EXPRESS FARE 246, ,325 (272,400) -52.5% 270,110 (23,185) -8.6% DAY PASS 327, ,148 43, % 325,770 1, % OTHER 295, ,126 (73,946) -20.0% 423,780 (128,600) -30.3% TOTAL ROUTE PASSENGER REVENUE $ 5,645,410 $ 5,517,998 $ 127, % 6,281,740 $ (636,330) -10.1% $ (5,645,410) $ (5,517,998) Notes: YTD Fiscal Year 2017 was adjusted due to formula corrections. YTD pass revenue has been reduced by $141,229 for Sun Link's YTD Fiscal Year 2018 revenue share 141,229 YTD pass revenue has been reduced by $16,994 for Sun Shuttle's YTD Fiscal Year 2018 revenue share 16,994 14
15 SUN TRAN PASSES SOLD AND PASS REVENUE PASSES SOLD PASS REVENUE DECEMBER VARIANCE DECEMBER VARIANCE CURRENT PRIOR AMOUNT PERCENT CURRENT PRIOR AMOUNT PERCENT MONTHLY 8450 DAY PASS 5,994 6,870 (876) -12.8% 22,478 24,045 ($1,568) -6.5% 8459 DISCOUNTED DAY PASS 11,762 19,170 (7,408) -38.6% 23,524 33,548 ($10,024) -29.9% DAY FULL FARE PASS % 1,980 0 $1, % 8450 FULL FARE 7 DAY % 0 0 $0 0.0% 8450 FULL FARE MONTHLY 4,586 4, % 201, ,185 30, % 8451 ECONOMY MONTHLY 8,277 8,473 (196) -2.3% 146, ,869 21, % 8452 EXPRESS MONTHLY (62) -14.2% 21,717 23,416 (1,699) -7.3% 8455 ANNUAL % 1,304 0 $1, % 8453 COLLEGE PASS % 24,219 21,408 $2, % 8453 COLLEGE PASS EXPRESS % 5,135 3,096 $2, % 8454 SUMMERGO YOUTH PASS 0 (3) % - (129) $ % SUBTOTAL: 31,377 39,289 (7,912) -20.1% $ 448,614 $ 401,438 $ 47, % STORED VALUE 8450 FULL FARE STORED VALUE 30,500 20,636 9, % 45,750 30,954 14, % 8451 ECONOMY STORED VALUE 41,473 68,231 (26,758) -39.2% 24,884 34,116 (9,232) -27.1% 8452 EXPRESS STORED VALUE 1, % 2,468 1, % SUBTOTAL: 73,070 89,763 (16,693) -18.6% $ 73,102 $ 66,862 $ 6, % TOTAL 104, ,052 (24,605) -19.1% $ 521, ,300 $ 53, % (521,716) (468,300) YEAR TO DATE PASSES SOLD PASS REVENUE DECEMBER VARIANCE DECEMBER VARIANCE CURRENT PRIOR AMOUNT PERCENT CURRENT PRIOR AMOUNT PERCENT MONTHLY 8450 DAY PASS 33,276 27,649 5, % 124,785 96,772 28, % 8459 DISCOUNTED DAY PASS 101, ,072 (5,780) -5.4% 202, ,376 15, % DAY FULL FARE PASS % 9, , % 8450 FULL FARE 7 DAY 0 6 (6) % 0 59 (59) % 8450 FULL FARE MONTHLY 24,443 22,486 1, % 1,071, , , % 8451 ECONOMY MONTHLY 41,429 44,216 (2,787) -6.3% 733, ,674 81, % 8452 EXPRESS MONTHLY 2,469 2,863 (394) -13.8% 142, ,346 (10,542) -6.9% 8455 ANNUAL % 15,373 (1,893) 17, % 8453 COLLEGE PASS 1,801 2,163 (362) -16.7% 196, ,894 (220,852) -53.0% 8453 COLLEGE PASS EXPRESS % 273,254 74, , % 8454 SUMMERGO YOUTH PASS 2 43 (41) -95.3% 87 1,797 (1,710) -95.2% SUBTOTAL: 205, ,693 (721) -0.3% $ 2,768,926 $ 2,498,970 $ 269, % STORED VALUE 8263 FULL FARE STORED VALUE 191, ,206 84, % 287, , , % 8450 ECONOMY STORED VALUE 250, ,726 (96,259) -27.8% 150, ,363 (23,083) -13.3% 8452 EXPRESS STORED VALUE 6,676 6, % 15,021 12,614 2, % SUBTOTAL: 448, ,239 (11,672) -2.5% $ 452,437 $ 346,786 $ 105, % TOTAL 654, ,932 (12,393) -1.9% $ 3,221,363 $ 2,845,756 $ 375, % (3,221,363) (2,845,756) Note: FY17 A fare change tool effect on January 3,2017 YTD pass revenue has been reduced by $141,229 for Sun Link's YTD Fiscal Year 2018 revenue share 141,229 YTD pass revenue has been reduced by $16,994 for Sun Shuttle's YTD Fiscal Year 2018 revenue share 16,994 15
16 SUMMARY OF EXPENSES DECEMBER DECEMBER VARIANCE MONTHLY VARIANCE CURRENT YEAR PRIOR YEAR AMOUNT PERCENT BUDGET AMOUNT PERCENT OPERATOR WAGES $ 1,523,968 $ 1,550,417 $ 26, % $ 1,448,365 $ (75,603) -5.2% MAINTENANCE WAGES 388, ,625 35, % 392,192 3, % SALARIES 490, ,179 (38,967) -8.0% 350,468 (139,678) -39.9% FRINGE BENEFITS 1,102, ,285 (172,410) -15.6% 1,017,981 (84,714) -8.3% SERVICES 352, ,956 29, % 452, , % UTILITIES 76,653 58,503 (18,150) -23.7% 69,517 (7,136) -10.3% VEHICLE MAINTENANCE 1,197, ,686 (803,822) -67.1% 413,036 (784,472) % MATERIALS AND SUPPLIES 72,243 57,865 (14,378) -19.9% 128,903 56, % CNG FUEL 39,580 47,763 8, % 60,808 21, % DIESEL FUEL 636, ,286 (304,468) -47.8% 442,764 (193,989) -43.8% UNLEADED FUEL 8,093 6,642 (1,451) -17.9% 7,638 (456) -6.0% CAPITAL OUTLAY % % INSURANCE 192, ,958 (32,828) -17.0% 149,823 (42,963) -28.7% LABOR CREDITS/EXP TRANSFERS (10,908) (10,826) % 59,074 69, % TOTAL EXPENSES $ 6,070,532 $ 4,784,339 $ (1,286,193) -26.9% $ 4,993,395 $ (1,077,137) -21.6% DECEMBER DECEMBER YEAR TO DATE CURRENT PRIOR VARIANCE ANNUAL BUDGET BALANCE YEAR YEAR AMOUNT PERCENT BUDGET AMOUNT PERCENT OPERATOR WAGES $ 9,197,562 $ 8,574,234 $ (623,328) -6.8% $ 17,380,380 $ 8,182, % MAINTENANCE WAGES 2,408,752 2,429,131 20, % 4,706,300 2,297, % SALARIES 2,338,779 2,157,342 (181,437) -7.8% 4,205,620 1,866, % FRINGE BENEFITS 6,460,335 5,958,161 (502,174) -7.8% 12,215,770 5,755, % SERVICES 2,085,973 2,085,471 (502) 0.0% 5,426,830 3,340, % UTILITIES 500, ,557 (101,074) -20.2% 834, , % VEHICLE MAINTENANCE 2,900,740 1,872,522 (1,028,218) -35.4% 4,956,430 2,055, % MATERIALS AND SUPPLIES 334, ,469 76, % 1,546,840 1,212, % CNG FUEL 247, ,645 50, % 729, , % DIESEL FUEL 2,231,252 1,867,178 (364,074) -16.3% 5,313,170 3,081, % UNLEADED FUEL 57,740 43,188 (14,552) -25.2% 91,650 33, % CAPITAL OUTLAY 15, , , % 7,090 (8,164) % INSURANCE 915, ,634 43, % 1,797, , % LABOR CREDITS/EXP TRANSFERS (30,578) (34,136) (3,558) 11.6% 708, , % TOTAL EXPENSES $ 29,663,804 $ 27,154,502 $ (2,509,303) -9.2% $ 59,920,740 $ 30,256, % Note: Starting November, 2017 payroll and fuel expenses are only accrued at year-end. 16
17 SUN TRAN SYSTEM SUMMARY DECEMBER VARIANCE DECEMBER VARIANCE CURRENT YEAR PRIOR YEAR AMOUNT PERCENT BUDGET AMOUNT PERCENT RIDERSHIP: TOTAL ROUTE PASSENGERS 1,232,683 1,376,394 (143,711) -10.4% 1,470,450 (237,767) -16.2% REVENUE: TOTAL ROUTE PASSENGER REVENUE $ 918,013 $ 883,165 $ 34, % 1,012,560 (94,547) -9.3% EXPENSES: TOTAL EXPENSES $ 6,070,532 $ 4,784,339 $ (1,286,193) -26.9% $ 4,986,938 $ (1,083,594) -21.7% MILES: REVENUE MILES 693, ,314 6, % 692,851 (170) 0.0% DEADHEAD MILES 96,835 99,094 (2,259) -2.3% 95,249 (1,586) -1.7% TOTAL SERVICE MILES 789, ,408 4, % 788,101 (1,755) -0.2% NON-ROUTE MILES 15,849 13,997 1, % 7,550 (8,299) % TOTAL MILES 805, ,405 6, % 795,651 (10,054) -1.3% REVENUE HOURS 57,922 56,901 1, % 57, % SERVICE HOURS 62,249 61,095 1, % 62, % YEAR TO DATE DECEMBER VARIANCE DECEMBER VARIANCE CURRENT YEAR PRIOR YEAR AMOUNT PERCENT BUDGET AMOUNT PERCENT RIDERSHIP: TOTAL ROUTE PASSENGERS 7,792,257 8,493,062 (700,805) -8.3% 9,050,860 (1,258,603) -13.9% REVENUE: TOTAL ROUTE PASSENGER REVENUE $ 5,645,255 $ 5,517,998 $ 127, % $ 6,281,740 $ (636,485) -10.1% EXPENSES: TOTAL EXPENSES $ 29,663,804 $ 27,154,502 $ (2,509,302) -9.2% $ 29,921,632 $ 257, % MILES: REVENUE MILES 4,228,341 4,080, , % 4,228, % DEADHEAD MILES 607, ,322 10, % 600,831 (6,399) -1.1% TOTAL SERVICE MILES 4,835,571 4,676, , % 4,829,660 (5,911) -0.1% NON-ROUTE MILES 53,028 60,368 (7,340) -12.2% 51,300 (1,728) -3.4% TOTAL MILES 4,888,599 4,736, , % 4,880,960 (7,639) -0.2% REVENUE HOURS 353, ,984 17, % 353, % SERVICE HOURS 379, ,688 19, % 379,661 (144) 0.0% Notes: Fiscal Year 2017 Miles and Hours were adjusted due to corrections. 17


18 18
19 SUN TRAN PERFORMANCE INDICATORS DECEMBER 2017 SYSTEM INDICATOR CURRENT MONTH BUDGET AVG YTD 1. RIDERSHIP 1,232,683 1,443,710 1,311, PASSENGER REVENUE $ 918,013 $ 907,830 $ 945, PASSENGER PER TOTAL MILE PASSENGER PER HOUR REVENUE PER PASSENGER $ 0.75 $ 0.66 $ REVENUE PER TOTAL MILE $ 1.16 $ 1.24 $ REVENUE PER HOUR $ $ $ FAREBOX RECOVERY RATIO 15.1% 20.2% 19.0% 9. TOTAL COST PER PASSENGER $ 4.92 $ 3.39 $ TOTAL COST PER MILE $ 7.53 $ 6.13 $ TOTAL COST PER SERVICE HOUR $ $ $ MILES BETWEEN ROAD CALLS 13,208 8,200 12, MILES BETWEEN BUS INSPECTION 5,919 6,300 5, TOTAL VEHICLE ACCIDENTS PER 100,000 MILES TOTAL COMPLAINTS PER 100,000 PASSENGER VEHICLES OPERATED IN MAXIMUM SERVICE
20 FY 17 FY 18 Budget Sun Tran Performance Indicators Fiscal Year 2018 Ridership (in millions) Passenger Revenue (in 100 thousands) Jul Aug Sep Oct Nov Dec Jan Feb Mar Apr May Jun 0 Jul Aug Sep Oct Nov Dec Jan Feb Mar Apr May Jun 20
21 FY 17 FY 18 Budget Sun Tran Performance Indicators Fiscal Year 2018 Passengers per Total Mile Passengers per Hour Jul Aug Sep Oct Nov Dec Jan Feb Mar Apr May Jun 0 Jul Aug Sep Oct Nov Dec Jan Feb Mar Apr May Jun 21
22 FY 17 FY 18 Budget Sun Tran Performance Indicators Fiscal Year 2018 Revenue per Passenger Revenue per Total Mile Jul Aug Sep Oct Nov Dec Jan Feb Mar Apr May Jun 0 Jul Aug Sep Oct Nov Dec Jan Feb Mar Apr May Jun 22
23 FY 17 FY 18 Budget Sun Tran Performance Indicators Fiscal Year 2018 Revenue per Hour Farebox Recovery Ratio Jul Aug Sep Oct Nov Dec Jan Feb Mar Apr May Jun 0 Jul Aug Sep Oct Nov Dec Jan Feb Mar Apr May Jun 23
24 FY 17 FY 18 Budget Sun Tran Performance Indicators Fiscal Year 2018 Total Cost per Passenger Total Cost per Mile Jul Aug Sep Oct Nov Dec Jan Feb Mar Apr May Jun Jul Aug Sep Oct Nov Dec Jan Feb Mar Apr May Jun 0 Jul Aug Sep Oct Nov Dec Jan Feb Mar Apr May Jun 24
25 FY 17 FY 18 Budget Sun Tran Performance Indicators Fiscal Year 2018 Total Cost per Mile Total Cost per Service Hour Jul Aug Sep Oct Nov Dec Jan Feb Mar Apr May Jun 0 Jul Aug Sep Oct Nov Dec Jan Feb Mar Apr May Jun 25
26 FY 17 FY 18 Budget Sun Tran Performance Indicators Fiscal Year 2018 Miles Between Road Calls Miles Between Inspections Jul Aug Sep Oct Nov Dec Jan Feb Mar Apr May Jun Revenue vehicle system failures are defined as mechanical problems that cause a vehicle not to complete its scheduled revenue trip, or does not start its next scheduled revenue trip. *Per NTD guidelines Jul Aug Sep Oct Nov Dec Jan Feb Mar Apr May Jun Acceptable range is + or 10% 26
27 FY 17 FY 18 Budget Sun Tran Performance Indicators Fiscal Year 2018 Vehicle Accidents per 100,000 Miles 3.5 Complaints per 100,000 Passengers Jul Aug Sep Oct Nov Dec Jan Feb Mar Apr May Jun 0 Jul Aug Sep Oct Nov Dec Jan Feb Mar Apr May Jun 27
28 Sun Tran Performance Indicators Fiscal Year ,200 2,100 2,000 1,900 1,800 1,700 1,600 1,500 1,400 1,300 1,200 1,100 1, SunGO Issues SunGO Issues Resolved June May April March February January December November October September August July * The SunGO issues are in addition to 15 COM Reports (complaints, inquiries and compliments) that are included in the Sun Tran complaint totals. 28


29 FY 17 FY 18 Sun Tran Performance Indicators Fiscal Year
30 ` SUN TRAN ROUTE PERFORMANCE PROFILE DECEMBER 2017 ROUTE TOTAL ROUTE PASSENGERS ROUTE REVENUE TOTAL SERVICE MILES TOTAL SERVICE HOURS TOTAL COST ALLOCATION NET COST PER HOUR PASSENGER PER MILE PASSENGER PER HOUR REVENUE PER MILE REVENUE PER HOUR SUBSIDY PER PASSENGER 1 36,220 $ 29,978 20,022 1,731 $ 164,754 $ $ 1.63 $ $ ,952 16,115 20,105 1, , ,514 48,164 46,779 3, , ,135 75,149 54,394 4, , ,548 15,705 17,504 1, , ,020 34,666 18,754 2, , ,416 49,536 43,161 3, , ,962 82,984 53,683 4, , ,979 33,114 36,410 2, , ,587 17,987 14,523 1, , ,335 58,790 50,653 4, , ,996 21,867 18,774 1, , ,174 24,595 25,754 2, , ,235 70,402 43,906 3, , ,788 45,969 42,533 3, , ,916 49,634 23,932 2, , ,925 18,676 9,461 1,046 94, ,651 8,703 10, , ,890 8,491 10, , ,398 21,662 19,346 1, , ,770 10,064 7, , ,537 26,420 22,860 1, , ,207 13,252 16,564 1, , ,099 15,822 21,113 1, , ,610 22,276 20,140 1, , ,427 43,436 34,487 2, , ,387 11,545 14,918 1, , ,618 10,392 5, , ,481 9,913 11, , TOTAL FIXED ROUTE 1,221, , ,149 59,701 5,773,148 $ $ 1.35 $ $ 3.99 TOTAL ROUTE ROUTE TOTAL SERVICE TOTAL SERVICE TOTAL COST NET COST PASSENGER PASSENGER REVENUE REVENUE SUBSIDY PER ROUTE PASSENGERS REVENUE MILES HOURS ALLOCATION PER HOUR PER MILE PER TRIP PER MILE PER HOUR PASSENGER 101X 1,353 $ 3,033 4, $ 21,536 $ $ 2.09 $ $ X 1,169 2,205 3, , X 578 1,342 1, , X 536 1,182 3, , X 995 1,940 2, , X 1,193 2,418 9, , X 1,106 2,259 4, , X 550 1,112 3, , X 997 2,045 5, , X 676 1,296 4, , X 1,033 2,251 7, , X 717 1,625 6, , TOTAL EXPRESS ROUTE 10,905 22,707 56,407 2, ,385 $ $ 0.72 $ 8.91 $ TOTAL SERVICE 1,232, , ,555 62,249 6,070,533 $ $ 1.32 $ $ 4.18 Notes: 1) Service miles denotes Scheduled Vehicle Revenue and Deadhead Miles (less Lost Miles) per Route. 2) Effective March 2014: The passenger per hour metric has been replaced with passenger per trip for express route service. Passenger per trip is a better measurement of productivity for express service. 3) Routes 110X is bi-directional express service. 31
31 SUN TRAN RANKING OF ROUTES - ROUTE PASSENGERS PER HOUR DECEMBER 2017 RANKING ROUTE NUMBER ROUTE DESCRIPTION PASSENGERS PER HOUR 1 18 S. 6TH AVENUE ORACLE / INA STONE TH AVENUE BROADWAY TH / 12TH AVENUE FLOWING WELLS AJO EUCLID/ NORTH FIRST AVENUE SPEEDWAY S. PARK AVENUE GLENN/SWAN ALVERNON CRAYCROFT / FT LOWELL VALENCIA ND STREET COUNTRY CLUB / 29TH STREET BENSON HIGHWAY MISSION ROAD TH STREET / WILMOT GRANT ROAD MIDVALE PARK WEST CONGRESS / SILVERBELL LA CHOLLA GRANDE CHERRYBELL CAMPBELL AVENUE PIMA STREET / WEST SPEEDWAY PANTANO 11.9 FIXED ROUTE SYSTEM AVERAGE 20.5 RANKING ROUTE NUMBER ROUTE DESCRIPTION PASSENGERS PER TRIP 1 102X INA ROAD EXPRESS X GOLF LINKS EXPRESS X ORO VALLEY/AEROPARK EXPRESS X MARANA EXPRESS X TANQUE VERDE EXPRESS X SUNRISE EXPRESS X ORO VALLEY/DOWNTOWN EXPRESS X SPEEDWAY/AEROPARK EXPRESS X BROADWAY EXPRESS X NW / AEROPARK EXPRESS X OLDFATHER EXPRESS X RITA RANCH/DOWNTOWN EXPRESS 2.6 EXPRESS ROUTE SYSTEM AVERAGE
32 CUSTOMER INFORMATION CENTER The customer service information and call center answered 16,832 phone calls in December That is a 5% decrease from the 17,637 calls answered in November 2017 and a 25% decrease from the 22,354 calls answered in December Sun Tran s website customer feedback response center received 89 s in December That is a 3% decrease over the 92 s received November 2017 and a 5% increase from the 85 s received in December SERVICE REPORTS COMPARISON DECEMBER 2017 DECEMBER 2016 % Increase/Decrease Total Service Reports: % Inquiries % Compliments % Complaints % Chargeable % Non-chargeable % Pending SAME Incomplete % SERVICE REPORTS COMPARISON DECEMBER 2017 November 2017 % Increase/Decrease Total Service Reports: % Inquiries SAME Compliments % Complaints % Chargeable % Non-chargeable % Pending % Incomplete % Notes: 1) Complaints deemed non chargeable were investigated, and the results indicated Sun Tran was not at fault. (Example: bus did not show, bus was early or late, etc.) 2) Incomplete are service reports with incomplete information that did not allow Sun Tran to finish an investigation. 3) Incomplete service reports are held in the event additional facts are provided to finish the investigation. 4) Inquiries are customer questions that are not complaints, but focus on service issues, and are more informational based in the response back to the consumer. 32
33 33
34 34
35 35
36 36
37 37
38 38

39 FY 17 FY 18 Budget Sun Van Performance Indicators Fiscal Year

40 FY 17 FY 18 Budget Sun Van Performance Indicators Fiscal Year

41 FY 17 FY 18 Budget Sun Van Performance Indicators Fiscal Year

42 FY 17 FY 18 Budget Sun Van Performance Indicators Fiscal Year


43 FY 17 FY 18 Sun Van Performance Indicators Fiscal Year
44 44
45 Sun Tran Glossary of Terms Ridership (Unlinked Passenger Trips) The number of passengers who board public transportation vehicles. Passengers are counted each time they board vehicles no matter how many vehicles they use to travel from their origin to their destination. Total Cost per Passenger Equals total expenditures divided by total passengers. Passenger per Mile Equals total passengers divided by total miles. Passenger per Service Hour Equals total ridership divided by total service hours. Passenger Revenue Equals revenue collected from passengers (includes farebox revenue and revenue from pass sales). Revenue Miles and Hours The miles and hours that vehicles travel while in revenue service. Vehicle revenue miles and hours (VRM and VRH) include: layover / recovery time. But exclude: deadhead, operator training and maintenance testing, as well as school bus and charter services. Revenue per Mile Equals total passenger revenue divided by total miles. Revenue per Passenger Equals total passenger revenue divided by total passengers Revenue per Service Hour Equals passenger revenue divided by service hours Deadhead Miles and Hours Miles and hours that a vehicle travels when out of revenue service. Deadhead includes: leaving or returning to the garage or yard facility, changing routes, or when there is no expectation of carrying revenue passengers. However, deadhead does not include: charter service, school bus service, operator training, maintenance training. Service Miles and Hours Miles and hours that vehicles travel while in revenue service plus deadhead miles and hours. But exclude: charter and school bus service, operator training, and maintenance testing. Total Cost per Mile Equals total expenditures divided by total miles. Cost per Mile Equals total expenditures less Operating Grant Funds divided by total miles. Cost per Service Hour Equals total expenditures less Operating Grant Funds divided by total service hours. Total Complaints per 100,000 passengers Equals total complaints divided by total passengers times 100,000. On-Time As defined by the Short Range Transit Plan, a bus may be up to 5 minutes late, but less than 1 minute early. Road Calls Equals total chargeable road calls. A road call is defined as a mechanical failure of a bus in revenue service that necessitates removing the bus from service until repairs are made.. 45
46 Sun Van Glossary of Terms Ridership (Unlinked Passenger Trips) - Equals total Passengers actually transported. A one-way trip taken by an ADA Paratransiteligible passenger, a personal care attendant (PCA) or companions from the pick-up point to the destination. Passengers Per Revenue Hour - Equals Ridership divided by Revenue hours. Total Demand - Total number of passenger trips requested. Denial An ADA-eligible trip requested that is not scheduled by Sun Van within the permissible scheduled window of on hour before or one hour after the requested pick-up time. Passengers Per Service Hour - Equals Ridership divided by Service hours. Revenue Per Trip Total Passenger Revenue divided by Trips. Cancellations - Occurs when the passenger or the passenger s representative cancels the reservation two (2) or more hours prior to the beginning of the scheduled pick-up time. Total Cost Per Trip Total Expenses divided by total Trips. No-Shows - Occurs when the passenger does not board the Sun Van vehicle when the vehicle arrives at the pick-up location within the pick up window and the driver waits two (2) minutes, or when the customer does not cancel the reservation within two (2) hours of the reservation. Trip Time - The percentage of ADA Trips with a trip time less than the comparable Sun Tran fixed route trip. Optional ADA Passenger trips beyond the ¾ mile corridors and beyond times available on a Sun Tran fixed route, a same-day request, and will calls. Trip A one-way trip taken by an ADA-Paratransit-eligible passenger from the pick-up point to the destination (excludes PCAs and companions). Revenue Miles All miles operated from pick-up point to destination. Trip Time 110%+5 Minutes Occurs when an ADA trip length exceeds 110% + 5 minutes of the comparable Sun Tran regular fixed route trip. On Time Pick Ups - The number of on time vehicle trips. The van is considered on time if it arrives between 15 minutes before or 15 minutes after the requested pick-up time. Pick Ups before Significantly Late - Pick Ups 30 minutes outside the original pick up window. Deadhead Miles Miles operated not providing specific revenue service. 46
MONTHLY REPORT SEPTEMBER 2017
 & MONTHLY REPORT SEPTEMBER 2017 SECTION Sun Tran & Sun Van Monthly Operations Report Table of Contents September 2017 PAGE I.System Highlights and Accomplishments 3-10 II.Sun Tran a.ridership 11 b.revenue
MONTHLY REPORT MAY 2017
 & MONTHLY REPORT MAY 2017 SECTION Sun Tran & Sun Van Monthly Operations Report Table of Contents May 2017 PAGE I.System Highlights and Accomplishments 3-10 II.Sun Tran a.ridership 11 b.revenue 12 c.pass
MONTHLY REPORT JUNE 2017
 & MONTHLY REPORT JUNE 2017 SECTION Sun Tran & Sun Van Monthly Operations Report Table of Contents June 2017 PAGE I.System Highlights and Accomplishments 3-10 II.Sun Tran a.ridership 11 b.revenue 12 c.pass
MONTHLY REPORT OCTOBER 2017
 & MONTHLY REPORT OCTOBER SECTION Sun Tran & Sun Van Monthly Operations Report Table of Contents October PAGE I.System Highlights and Accomplishments 3-11 II.Sun Tran a.ridership 12 b.revenue 13 c.pass
MONTHLY REPORT AUGUST 2017
 & MONTHLY REPORT AUGUST SECTION Sun Tran & Sun Van Monthly Operations Report Table of Contents August PAGE I.System Highlights and Accomplishments 3-10 II.Sun Tran a.ridership 11 b.revenue 12 c.pass Sales
MONTHLY OPERATIONS REPORT DECEMBER 2015
 MONTHLY OPERATIONS REPORT DECEMBER 215 Table of Contents DECEMBER 215 Section Page December Highlights... 3 Strategic Goals Progress Update... 4 Ridership... 6 Revenue... 9 Expenses... 1 System Summary...
MONTHLY OPERATIONS REPORT SEPTEMBER 2015
 MONTHLY OPERATIONS REPORT SEPTEMBER 215 Table of Contents SEPTEMBER 215 Section Page September Highlights... 3 Strategic Goals Progress Update... 4 Ridership... 6 Revenue... 9 Expenses... 1 System Summary...
MONTHLY REPORT SEPTEMBER 2017
 MONTHLY REPORT 2017 SUN SHUTTLE RIDERSHIP ROUTE PASSENGERS: CURRENT YEAR PRIOR YEAR AMOUNT PERCENTAGE BUDGET AMOUNT PERCENTAGE TOTAL PASSENGERS 17,250 20,318 (3,068) -15.1% 18,231 (981) -5.4% CALENDAR
Att. A, AI 46, 11/9/17
 Total s San Diego Metropolitan Transit System POLICY 42 PERFORMANCE MONITORING REPORT Page 1 of 6 Date: 11/8/17 OBJECTIVE Develop a Customer-Focused and Competitive System The following measures of productivity
Sound Transit Operations December 2014 Service Performance Report. Ridership
 Ridership Total Boardings by Mode Mode Dec-13 Dec-14 % YTD-13 YTD-14 % ST Express 1,266,130 1,396,787 10.3% 16,605,299 17,661,976 6.4% Sounder 248,710 285,016 14.6% 3,035,735 3,361,317 10.7% Tacoma Link
Board Box. October Item # Item Staff Page 1. Key Performance Indicators Sep 2018 M. Mungia Financial Report Aug 2018 H.
 Board Box October 2018 Item # Item Staff Page 1. Key Performance Indicators Sep 2018 M. Mungia 2-10 2. Financial Report Aug 2018 H. Rodriguez 11-15 ITEM 1 October 31, 2018 TO: FROM: RE: BOARD OF DIRECTORS
Date: 11/6/15. Total Passengers
 Total San Diego Metropolitan Transit System POLICY 42 PERFORMANCE MONITORING REPORT Page 1 of 6 OBJECTIVE Develop a Customer-Focused and Competitive System The following measures of productivity and service
PERFORMANCE REPORT NOVEMBER 2017
 PERFORMANCE REPORT NOVEMBER 2017 Note: New FY2018 Goal/Target/Min or Max incorporated in the Fixed Route and Connection Dashboards. Keith A. Clinkscale Performance Manager INTRODUCTION/BACKGROUND In June
VCTC Transit Ridership and Performance Measures Quarterly Report
 VCTC Transit Ridership and Performance Measures Quarterly Report Overview Quarter 2 Fiscal Year 2018-2019 This report provides performance measures for VCTC Intercity Bus Service covering the FY 2018-19
PERFORMANCE REPORT DECEMBER 2017
 PERFORMANCE REPORT DECEMBER 2017 Note: New FY2018 Goal/Target/Min or Max incorporated in the Fixed Route and Connection Dashboards. Keith A. Clinkscale Performance Manager INTRODUCTION/BACKGROUND Keith
Sound Transit Operations March 2018 Service Performance Report. Ridership
 March 218 Service Performance Report Ridership Total Boardings by Mode Mar-17 Mar-18 % YTD-17 YTD-18 % ST Express 1,622,116 1,47,79-4.6% 4,499,798 4,428,14-1.6% Sounder 393,33 39,6.% 1,74,96 1,163,76 8.3%
METRO OPERATIONS COMMITTEE
 Los Angeles County Metropolitan Transportation Authority Item 1 CHIEF OPERATIONS OFFICER S S REPORT METRO OPERATIONS COMMITTEE Lonnie Mitchell Chief Operations Officer May 19, 20 1 Employee Recognition
2017/ Q1 Performance Measures Report
 2017/2018 - Q1 Performance Measures Report Contents Ridership & Revenue... 1 Historical Revenue & Ridership... 1 Revenue Actual vs. Planned... 3 Mean Distance Between Failures... 5 Maintenance Cost Quarter
Existing Services, Ridership, and Standards Report. June 2018
 Existing Services, Ridership, and Standards Report June 2018 Prepared for: Prepared by: Contents Overview of Existing Conditions... 1 Fixed Route Service... 1 Mobility Bus... 34 Market Analysis... 41 Identification/Description
Sound Transit Operations August 2015 Service Performance Report. Ridership
 Ridership Total Boardings by Mode Mode Aug-14 Aug-15 % YTD-14 YTD-15 % ST Express 1,534,241 1,553,492 1.3% 11,742,839 12,354,957 5.2% Sounder 275,403 326,015 18.4% 2,139,086 2,463,422 15.2% Tacoma Link
Sound Transit Operations January 2017 Service Performance Report. Ridership. Total Boardings by Mode
 January 217 Service Performance Report Ridership ST Express Sounder Tacoma Link Link Paratransit Jan-16 Jan-17 % 1,433,7 1,3,33 4.9% 331,27 7,121 98,411 3,633 Total Boardings by Mode 363,6 74,823 1,76,914
Sound Transit Operations January 2014 Service Performance Report. Ridership
 Ridership Total Boardings by Mode Mode Jan-13 Jan-14 % YTD-13 YTD-14 % ST Express 1,343,290 1,426,928 6.2% 1,343,290 1,426,928 6.2% Sounder 245,135 256,775 4.7% 245,135 256,775 4.7% Tacoma Link 86,229
Transit Performance Report FY (JUNE 30, 2007)
") Transit Performance Report FY 2006-2007 (JUNE 30, 2007) J ANUARY 2008 TRANSIT PERFORMANCE REPORT FY 2006 2007 (JUNE 30, 2007) Transit Performance Report I SSUED: JANUARY 2008 The Transit Performance Report
Transit Performance Report FY 2006-2007 (JUNE 30, 2007) J ANUARY 2008 TRANSIT PERFORMANCE REPORT FY 2006 2007 (JUNE 30, 2007) Transit Performance Report I SSUED: JANUARY 2008 The Transit Performance Report
Board of Directors Information Summary
 Regional Public Transportation Authority 302 N. First Avenue, Suite 700, Phoenix, Arizona 85003 602-262-7433, Fax 602-495-0411 Board of Directors Information Summary Agenda Item #6 Date July 11, 2008 Subject
PERFORMANCE REPORT DECEMBER Performance Management Office
 PERFORMANCE REPORT DECEMBER 2018 Performance Management Office INTRODUCTION/BACKGROUND Performance Management Office FIXED ROUTE DASHBOARD FY 2019 Safety Max Target Goal Preventable Collisions per 100k
Board Box. February Item # Item Staff Page 1. Key Performance Indicators M. Thompson Financial Report for Dec H.
 Board Box February 2016 Item # Item Staff Page 1. Key Performance Indicators M. Thompson 2-8 2. Financial Report for Dec. 2015 H. Rodriguez 9-13 ITEM 1 February 15, 2016 TO: FROM: RE: BOARD OF DIRECTORS
RIDERSHIP TRENDS. October 2017
 RIDERSHIP TRENDS October 2017 Prepared by the Division of Strategic Capital Planning December 2017 Table of Contents Executive Summary...1 Ridership...3 Estimated Passenger Trips by Line...3 Estimated
Sound Transit Operations June 2016 Service Performance Report. Ridership
 Ridership Total Boardings by Mode Mode Jun-15 Jun-16 % YTD-15 YTD-16 % ST Express 1,622,222 1,617,420-0.3% 9,159,934 9,228,211 0.7% Sounder 323,747 361,919 11.8% 1,843,914 2,099,824 13.9% Tacoma Link 75,396
METROBUS SERVICE GUIDELINES
 METROBUS SERVICE GUIDELINES In the late 1990's when stabilization of bus service was accomplished between WMATA and the local jurisdictional bus systems, the need for service planning processes and procedures
Sound Transit Operations March 2017 Service Performance Report. Ridership. Total Boardings by Mode
 March 217 Service Performance Report Ridership ST Express Sounder Tacoma Link Link Paratransit Mar-16 Mar-17 % 1,83,4 1,621,49 2.4% 37,496 82,631 1,264,47 3,821 Total Boardings by Mode 389,98 87,39 1,89,43,297
Performance Measures Year End Updated-
 Performance Measures Year End 2017 -Updated- Priorities and Objectives 1. Earn and Retain the Community s Trust 2. Provide Excellent Customer Service 3. Enable Organizational Success 4. Exemplify Financial
Bristol Virginia Transit
 Bristol Virginia Transit 1 Transit Overview Bristol Virginia Transit (BVT) is a Federally Funded and certified urban area transit system. BVT began operation in its current form in 1982. In Fiscal Year
Sound Transit Operations January 2018 Service Performance Report. Ridership
 January 218 Service Performance Report Ridership Total Boardings by Mode Jan-17 Jan-18 % YTD-17 YTD-18 % ST Express 1,3,33 1,7,91.3% 1,3,33 1,7,91.3% Sounder 367,33 416,8 13.3% 367,33 416,8 13.3% Tacoma
PERFORMANCE REPORT JANUARY Keith A. Clinkscale Performance Manager
 PERFORMANCE REPORT JANUARY 2018 Keith A. Clinkscale Performance Manager INTRODUCTION/BACKGROUND Keith A. Clinkscale Performance Manager FIXED ROUTE DASHBOARD JANUARY 2018 Safety Max Target Goal Preventable
Establishes a fare structure for Tacoma Link light rail, to be implemented in September 2014.
 RESOLUTION NO. R2013-24 Establish a Fare Structure and Fare Level for Tacoma Link MEETING: DATE: TYPE OF ACTION: STAFF CONTACT: PHONE: Board 09/26/2013 Final Action Ric Ilgenfritz, Executive Director,
Service Cost Estimate for Route 10 only
 2009-2011 Service Cost Estimate for Route 10 only The City of Ashland buys down the fare on Route 10 for each passenger riding in Ashland, therefore service cost estimates are based on recent ridership
Administrative Operations Report
 Fiscal Year 2017/18 Administrative Operations Report November 1, 2018 Prepared by: El Dorado County Transit Authority 6565 Commerce Way Diamond Springs, CA 95619 (530) 642-5383 www.eldoradotransit.com
Sound Transit Operations February 2018 Service Performance Report. Ridership
 February 218 Service Performance Report Ridership Total Boardings by Mode Feb-17 Feb-18 % YTD-17 YTD-18 % ST Express 1,373,96 1,372,88 -.1% 2,877,294 2,88,719.1% Sounder 314,96 32,187 11.9% 681,923 768,69
2017/2018 Q3 Performance Measures Report. Revised March 22, 2018 Average Daily Boardings Comparison Chart, Page 11 Q3 Boardings figures revised
 2017/2018 Q3 Performance Measures Report Revised March 22, 2018 Average Daily Boardings Comparison Chart, Page 11 Q3 Boardings figures revised Contents Ridership & Revenue... 1 Historical Revenue & Ridership...
RIDERSHIP TRENDS. August 2018
 RIDERSHIP TRENDS August Prepared by the Division of Strategic Capital Planning October Table of Contents Executive Summary...1 Ridership...3 Estimated Passenger Trips by Line...3 Estimated Passenger Trips
With the completion of this project, we would like to follow-up on the projections as well as highlight a few other items:
 TO: FROM: Mayor and Council Interim City Manager Rebecca Underhill, Director of Finance DATE: February 28, 2014 SUBJECT: Water Meter Project Analysis On March 28, 2012, Acting City Manager Mike Loftin
FIXED ROUTE DASHBOARD JULY 2018
 FIXED ROUTE DASHBOARD JULY 2018 Safety Max Target Goal Preventable Collisions per 100k Miles Non-Preventable Collisions per 100k Miles Total Incidents per 10,000 Boardings 1.6 1.3 0.8 2.63 2.1 2.0 1.60
General Issues Committee Item Transit Operating Budget Ten Year Local Transit Strategy
 General Issues Committee Item 4.1 2017 Transit Operating Budget Ten Year Local Transit Strategy January 27, 2017 Presentation Outline 2017 Operating Budget Overview Ten Year Local Transit Strategy 2 2017
RIDERSHIP TRENDS. January 2018
 RIDERSHIP TRENDS January 2018 Prepared by the Division of Strategic Capital Planning March 2018 Table of Contents Executive Summary...1 Ridership...3 Estimated Passenger Trips by Line...3 Estimated Passenger
TRANSPORTATION SERVICE Actual
 PERFORMANCE REPORT-THIRD QUARTER VISION TO DELIVER REGIONAL MULTI-MODAL TRANSPORTATION SERVICES AND INFRASTRUCTURE IMPROVEMENTS THAT SIGNIFICANTLY AND CONTINUALLY INCREASE TRANSIT MARKET SHARE. MISSION
Quarterly Report Transit Bureau, Local Transit Operations. First Quarter, Fiscal Year 2015 (July 2014 September 2014) ART & STAR
 ART & STAR") Quarterly Report Transit Bureau, Local Transit Operations First Quarter, Fiscal Year 2015 (July 2014 September 2014) ART & STAR A Arlington Transit ART 1) Introduction The purpose of ART is to provide
Quarterly Report Transit Bureau, Local Transit Operations First Quarter, Fiscal Year 2015 (July 2014 September 2014) ART & STAR A Arlington Transit ART 1) Introduction The purpose of ART is to provide
ATTACHMENT A.7. Transit Division Performance Measurements Report Fiscal Year Fourth Quarter
 TTCHMENT.7 Transit Division Performance Measurements Report Fiscal Year 2012-13 Fourth Quarter Introduction The Orange County Transportation uthority (OCT) operates a countywide network of local, community,
Factors that Affect Fixed-Route Ridership Frequency Connections and accessibility Travel time Travel cost Service area coverage Reliability
 The transit industry defines ridership as the number of passengers who board public transportation vehicles called unlinked passenger trips. Ridership measures transit utilization at the system, route,
Chapter 3. Burke & Company
 Chapter 3 Burke & Company 3. WRTA RIDERSHIP AND RIDERSHIP TRENDS 3.1 Service Overview The Worcester Regional Transit Authority (WRTA) provides transit service to over half a million people. The service
About This Report GAUGE INDICATOR. Red. Orange. Green. Gold
 ATTACHMENT A About This Report The Orange County Transportation Authority (OCTA) operates a countywide network of local, community, rail connector, and express bus routes serving over 6, bus stops. OCTA
Metra Board of Directors. Board Meeting November 11, 2011
 Metra Board of Directors Board Meeting November 11, 2011 State of Metra Operations Metra Board of Directors November 11, 2011 Presented by George Hardwidge Deputy Executive Director Operations System On-Time
Driving Ridership Strategic Partnerships
 Driving Ridership Strategic Partnerships Feb 29, 2012 Presented by Priya Bhasin-Singh, Strategic Marketing Associate priya.bhasin-singh@edmonton.ca 2012 APTA Marketing & Communications Conference About
Public Meeting. December 19 th, 2018
 Public Meeting December 19 th, 2018 AGENDA Welcome Market Analysis Existing Services Peer Evaluation Outreach Summary Recommendations Discussion Next Steps MARKET ANALYSIS 3 Demographics 50% of population
September 2014 Prepared by the Department of Finance & Performance Management Sub-Regional Report PERFORMANCE MEASURES
 September 2014 Prepared by the Department of Finance & Performance Management 2013 Sub-Regional Report PERFORMANCE MEASURES REGIONAL PERFORMANCE MEASURES RTA staff has undertaken the development of a performance
YOSEMITE AREA REGIONAL TRANSPORTATION SYSTEM
 YOSEMITE AREA REGIONAL TRANSPORTATION SYSTEM Short Range Transit Plan Prepared for the Merced County Association of Governments/YARTS Prepared by LSC Transportation Consultants, Inc. YOSEMITE AREA REGIONAL
Annual Transit Ridership Monitoring Report Fiscal Year
 Annual Transit Monitoring Report Fiscal Year 214-15 May 2, 216 Metropolitan Transportation Planning Organization for the Gainesville Urbanized Area Annual Transit Monitoring Report Fiscal Year 214-15
FY Transit Needs Assessment. Ventura County Transportation Commission
 FY 18-19 Transit Needs Assessment Ventura County Transportation Commission Contents List of Figures and Appendices.. 2 Appendices... 1 Chapter 1: Introduction What is the Ventura County Transportation
DRT Performance Measurement: the U.S. Experience
 DRT Performance Measurement: the U.S. Experience FOR ANYBODY GOING ANYWHER IN LA HABRA International Conference on Demand Responsive Transportation Breckenridge, Colorado September 2016 DRT Performance
SAMTRANS TITLE VI STANDARDS AND POLICIES
 SAMTRANS TITLE VI STANDARDS AND POLICIES Adopted March 13, 2013 Federal Title VI requirements of the Civil Rights Act of 1964 were recently updated by the Federal Transit Administration (FTA) and now require
St. Johns County Transit Development Plan Update
 St. Johns County Transit Development Plan Update 2012-2021 Demographic Information Population 190,000 people in 2010 51% increase from 2000 Employment 64% over age 16 in labor force St. Augustine, Ponte
Current Operations CHAPTER II INTRODUCTION DESCRIPTION OF TRANSPORTATION SERVICES
 Chapter II CHAPTER II Current Operations INTRODUCTION This chapter provides an overview of Centre Area Transportation Authority (CATA). CATA is a joint municipal authority formed under the Municipal Authorities
January 2018 Air Traffic Activity Summary
 January 2018 Air Traffic Activity Summary Jan-2018 Jan-2017 CY-2018 CY-2017 Passengers 528,947 505,421 4.7% 528,947 505,421 4.7% Passengers 537,332 515,787 4.2% 537,332 515,787 4.2% Passengers 1,066,279
DISTRICT EXPRESS LANES ANNUAL REPORT FISCAL YEAR 2017 JULY 1, 2016 JUNE 30, FloridaExpressLanes.com
 DISTRICT EXPRESS LANES ANNUAL REPORT FISCAL YEAR 2017 JULY 1, 2016 JUNE 30, 2017 FloridaExpressLanes.com This page intentionally left blank. TABLE OF CONTENTS List of Figures... ii List of Tables.... ii
BUSINESS BAROMETER December 2018
 Credit: Chris Orange BUSINESS BAROMETER December Credit: Nigel Moore 1 Contents Summary of findings 3 Annual monthly performance: visitor attractions..4 Visit Herts Team update 5 National context.8 Visitor
Bus Operations Report
 Third Quarter FY 216 (January 1 - March 31, 216) Wednesday April 27, 216 Operations Ridership: 783,194 passengers used in the third quarter. This represents a 2% increase over the same period in FY 215.
WESTERN EL DORADO COUNTY SHORT AND LONG-RANGE TRANSIT PLAN Executive Summary
 WESTERN EL DORADO COUNTY SHORT AND LONG-RANGE TRANSIT PLAN Executive Summary Prepared for the El Dorado County Transportation Commission Prepared by The El Dorado County Transportation Commission (EDCTC)
October REGIONAL ROUTE PERFORMANCE ANALYSIS
 October 2018 2017 REGIONAL ROUTE PERFORMANCE ANALYSIS The Council s mission is to foster efficient and economic growth for a prosperous metropolitan region Metropolitan Council Members Alene Tchourumoff
_VER1 CC_ PC_5000 FA_21500 C </CELL ><CELL> HO_ADJ 2015.P02 GL_6290 _VER1 GL_6010 PC_5000 FA_21500 C
 < EVDRE ID="Head count Roll Forward 001-00001"/>< EVDRE ID="BPC- CYB 004-00001"/>< EVDRE ID="BPC- CYB 001-00001"/>< EVDRE ID="BPC- CYF 004-00001"/>< EVDRE
SUB-REGIONAL PERFORMANCE MEASURES
 SUB-REGIONAL PERFORMANCE MEASURES 29 REPORT Overall regional performance is a function of five major areas: Service Coverage - monitors both how much service is available to people in the region (in terms
ESCAMBIA COUNTY AREA TRANSIT MTAC REPORT
 ESCAMBIA COUNTY AREA TRANSIT MTAC REPORT November 8, 2017 Meeting Escambia County Area Transit 1515 W. Fairfield Drive Pensacola, FL 32501 850-595-3228 INTRODUCTION 2 Summary Background MTAC ECAT Benchmarks
Peer Performance Measurement February 2019 Prepared by the Division of Planning & Market Development
 2017 Regional Peer Review Peer Performance Measurement February 2019 Prepared by the Division of Planning & Market Development CONTENTS EXECUTIVE SUMMARY... 3 SNAPSHOT... 5 PEER SELECTION... 6 NOTES/METHODOLOGY...
COMO Bus Service Evaluation DRAFT COA. September 19, 2016
 DRAFT COA September 19, 2016 Chapter 1 Introduction Introduction The City of Columbia Missouri unveiled COMO Connect in 2013 with the goal of changing how public transportation options were delivered in
FIXED ROUTE Operating Statistics For Periods Ending 9/30/2008 & 9/30/2009
 FIXED ROUTE Operating Statistics For Periods Ending 9/30/2008 & 9/30/2009 CURRENT MONTH YEAR TO DATE Actual Actual Variance Actual Actual Variance 2008 2009 2008 to 2009 2008 2009 2008 to 2009 Service
North Central Regional Transit District. Quick Facts. Our Mission Statement:
 North Central Regional Transit District Our Mission Statement: The mission of the North Central Regional Transit District is to provide safe, secure and effective public transportation within North Central
RACINE COUNTY PUBLIC TRANSIT PLAN:
 RACINE COUNTY PUBLIC TRANSIT PLAN: 2013-2017 Recommended Transit Service Improvement Plan NEWSLETTER 3 SEPTEMBER 2013 This newsletter describes the final recommended public transit plan for the City of
D_HO_V ER1 GL_ P03 GL_6030
 < EVDRE ID="BPC- CYB 001-00001"/>< EVDRE ID="BPC- CYF 004-00001"/>< EVDRE ID="BPC- CYF 001-00001"/>< C C_500377 6013-40.00000 00 6018-10.00000
Analysts and Investors conference call. Q results. 15 May 2013
 Analysts and Investors conference call Q1 2013 results 15 May 2013 Management summary Key messages of Q1 2013 +6% +9% +3.3%p. Q1 2013 operational KPIs are in line with 109.7 116.2 6.5 7.1 82.3 85.6 expectations,
Capital Metropolitan Transportation Authority. Monthly Performance Report
 Capital Metropolitan Transportation Authority Monthly Performance Report SEPTEMBER 2010 Ridership Report Budget to Actual Ridership Budget Target: 2,335,906 Actual: 2,291,235 Ridership Comparison Fiscal
Auckland Transport Quarterly Indicators Report 2018/19
 Attachment 1 Auckland Transport ly Indicators Report 218/19 September 218 Table of Contents Page 2. 1. Executive summary 2. External indicators 3. Performance by Key Priority 3.1 Deliver an efficient and
SAMTRANS SERVICE PLAN
 Agenda Overview Part I: Key Findings Market Assessment Service Evaluation Part II: Service Development Framework Metrics Criteria Part III: Next Steps SAMTRANS SERVICE PLAN Preliminary Analysis and Criteria
Situational Analysis. Issue: 1. Date: November 2017
 20 Issue: 1 Date: November 20 This report was written and prepared by the Royal Society for the Prevention of Accidents (RoSPA) and approved by the steering group of Water Safety Scotland. 2 Executive
2014 STATEWIDE COMPREHENSIVE OUTDOOR RECREATION PLAN
 2014 STATEWIDE COMPREHENSIVE OUTDOOR RECREATION PLAN SUSTAINING COLORADO S OUTDOOR RECREATION FUTURE SECTION 1: INTRODUCTORY INFORMATION WHAT IS THE SCORP? The SCORP update is required every five years
Scorecard Key Performance Indicators
 Scorecard Key Performance Indicators 1 st Quarter 2013 NICE Bus Fixed Route NICE Bus Fixed Route Definitions Scheduled Revenue Hours Full Trip Revenue Hours Lost Runs Missed Revenue Hours Lost Actual Hours
METRO FLEET FUNDING HUMAN RESOURCES
 2018 FACT SHEET METRO FLEET METRO s overall revenue-producing fleet totals 235 vehicles: 144 large buses and 91 smaller paratransit buses. Some passenger vehicles are equipped with a hydraulic lift to
PTN-128 Reporting Manual Data Collection and Performance Reporting
 2016 PTN-128 Reporting Manual Data Collection and Performance Reporting Sponsored by the Texas Department of Transportation Table of Contents PTN-128 WHAT, WHY AND WHO... 6 What is the PTN-128... 13 Why
Regional Fare Change Overview. Nick Eull Senior Manager of Revenue Operations Metro Transit
 Regional Fare Change Overview Nick Eull Senior Manager of Revenue Operations Metro Transit Committee of the Whole April 5 th, 2017 Today s Presentation Fare change goals and considerations Public engagement
Manual vs. Automatic Operation and Operational Restrictions
 Customer Services, Operations, and Safety Committee Board Information Item IV-B March 11, 2010 Manual vs. Automatic Operation and Operational Restrictions Page 81 of 91 Washington Metropolitan Area Transit
Title VI Service Equity Analysis
 Pierce Transit Title VI Service Equity Analysis Pursuant to FTA Circular 4702.1B NE Tacoma Service May 2016 Pierce Transit Transit Development Dept. PIERCE TRANSIT TITLE VI SERVICE EQUITY ANALYSIS TABLE
APPENDIX B COMMUTER BUS FAREBOX POLICY PEER REVIEW
 APPENDIX B COMMUTER BUS FAREBOX POLICY PEER REVIEW APPENDIX B COMMUTER BUS FAREBOX POLICY PEER REVIEW The following pages are excerpts from a DRAFT-version Fare Analysis report conducted by Nelson\Nygaard
COLTS Complementary ADA Paratransit Service. Special Efforts Accessibility Transportation Service (SEATS) SEATS Trip Tips (570)
 SEATS Trip Tips (570)") COLTS Complementary ADA Paratransit Service Special Efforts Accessibility Transportation Service (SEATS) SEATS Trip Tips (570) 963-6795 June, 2016 1 Welcome to SEATS!!! COLTS provides Complementary ADA
COLTS Complementary ADA Paratransit Service Special Efforts Accessibility Transportation Service (SEATS) SEATS Trip Tips (570) 963-6795 June, 2016 1 Welcome to SEATS!!! COLTS provides Complementary ADA
CWC LA - Cash Balance (January 2012)
") CWC LA - Cash Balance 2012-13 (January 2012) 1,200,000 Cash Balance 1,000,000 800,000 ($1,000s) 600,000 400,000 200,000 - CWC LA - Actuals/Projected CWC LA - ed (Nov) 1 1 CWC Hollywood - Financial Dashboard
CWC LA - Cash Balance 2012-13 (January 2012) 1,200,000 Cash Balance 1,000,000 800,000 ($1,000s) 600,000 400,000 200,000 - CWC LA - Actuals/Projected CWC LA - ed (Nov) 1 1 CWC Hollywood - Financial Dashboard
Capital Metropolitan Transportation Authority. Monthly Performance Report
 Capital Metropolitan Transportation Authority Monthly Performance Report AUGUST 2010 Ridership Report August 23, 2010 Budget to Actual Ridership Budget Target: 2,290,590 Actual: 2,300,796 Ridership Comparison
Tallulah Gorge State Park Business Plan. Table of Contents
 Tallulah Gorge State Park Business Plan Table of Contents 2 Georgia State Parks and Historic Sites Executive Summary Site Name Tallulah Gorge State Park Site Manager Danny Tatum Region Manager Joe Yeager
2018 Accomplishments
 CY2018 ANNUAL REPORT Vision The Chippewa Valley Regional Airport will provide our users with a safe, efficient and welcoming operation while striving to meet the current and future needs of the community
Corporate presentation CIBC Whistler Institutional Investor Conference January 21, 2010
 Corporate presentation CIBC Whistler Institutional Investor Conference January 21, 2010 Forwardlooking statement Certain information in this presentation and statements made during this presentation, including
PUBLIC NOTICE The Greater Boise Auditorium District will hold a Regular Board Meeting on Thursday, December 20, 2018 at 2 p.m. Boise Centre West Room
 PUBLIC NOTICE The Greater Boise Auditorium District will hold a Regular Board Meeting on Thursday, December 20, 2018 at 2 p.m. Boise Centre West Room 200 GREATER BOISE AUDITORIUM DISTRICT REGULAR BOARD
GREATER BOISE AUDITORIUM DISTRICT REGULAR BOARD MEETING OF THE BOARD OF DIRECTORS. AGENDA Revised. September 20, 2016
 GREATER BOISE AUDITORIUM DISTRICT REGULAR BOARD MEETING OF THE BOARD OF DIRECTORS AGENDA Revised September 20, 2016 BOISE CENTRE Willows Room 2:00 p.m. I. Call to Order II. III. IV. Changes or Additions
Appendix A: Regional Fare Policy, SANDAG
 cover Appendix A: Regional Fare Policy, SANDAG BOARD POLICY NO. 029 REGIONAL FARE POLICY AND COMPREHENSIVE FARE ORDINANCE Purpose: To establish guidelines for setting a uniform, fair, and equitable areawide
Paratransit Bus Services Guide
 Roseville Transit 1 Paratransit Bus Services Guide Effective November 19, 2014 About Roseville Americans with Disabilities Act (ADA) Paratransit Service Roseville ADA Paratransit service operates as a
Mobile Farebox Repair Program: Setting Standards & Maximizing Regained Revenue
 Mobile Farebox Repair Program: Setting Standards & Maximizing Regained Revenue Michael J. Walk, Chief Performance Officer Larry Jackson, Directory of Treasury Maryland Transit Administration March 2012