Metra Board of Directors. Board Meeting November 11, 2011
|
|
|
- William Wilcox
- 5 years ago
- Views:
Transcription

1 Metra Board of Directors Board Meeting November 11, 2011
2 State of Metra Operations Metra Board of Directors November 11, 2011 Presented by George Hardwidge Deputy Executive Director Operations
3 System On-Time Performance October 2011
4 Metra System On-Time Performance Oct 2011 vs Oct 2010 & 5-year Average 5-year Oct Oct Average Weekday Peak 95.5% 96.0% 95.0% Weekday Off-Peak 96.4% 96.7% 94.0% Weekend 95.3% 95.0% 88.9% Total 95.9% 96.2% 93.7% 2 Note: Due to changes in calculation methodology, on-time performance figures from May 2011 onward are not exactly comparable to prior months' figures.
5 Metra System On-Time Performance Oct 2011 Delays by Duration % Minutes Delays Total % % % % Annulled 10 1% 1, % 3
6 Metra System On-Time Performance Major Incidents In October 2011 Freight Mechanical Track Construction Right-of-Way Accidents 118 delays 100 delays 186 delays 54 delays 4
7 Holiday Service Plan Mag. Mile Lights Festival (Sat. Nov. 19 th ) Extra service on the BNSF & UP Northwest Additional seating capacity Pre-Thanksgiving (Wed. Nov. 23 rd ) Modified service on all lines Thanksgiving (Thur. Nov 24 th ) Sunday/Holiday Schedule Friday after Thanksgiving (Fri. Nov. 25 th ) Extra service on the BNSF 5
8 CN Derailment at Spaulding November 3,

9 Elgin Coach Yard Milwaukee West Line Tracks Spaulding Interlocking - CN crosses Metra 7

10 Milwaukee West Line Tracks Spaulding Interlocking - CN crosses Metra CN Track CN Train Direction of Travel 8

11 9 CN Derailment at Spaulding

12 CN Derailment at Spaulding Milwaukee West Line Tracks 10

13 11 CN Derailment at Spaulding

14 12 CN Derailment at Spaulding

15 13 CN Derailment at Spaulding


16 14 CN Derailment at Spaulding

17 15 CN Derailment at Spaulding


18 16 CN Derailment at Spaulding


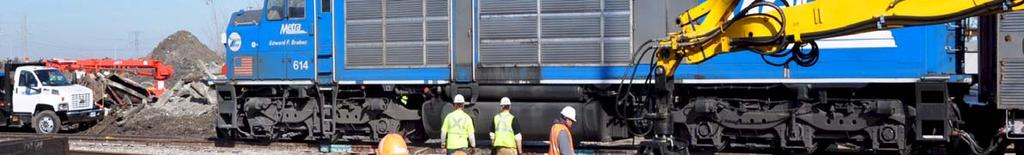


19 17 CN Derailment at Spaulding
20 18 Winter Plan 2011


21 19 Metra Command Center

22 20 Service Advisories


23 21 Emergency Fueling


24 22 Train De-icing Equipment


25 23 Snow Removal at Elgin Station
26 24 Signal Department

27 25 Western Ave.

28 26 Switch Heaters

29 27 Snow Jet Equipment

30 28 Blizzard of 2011

31 29 Blizzard of 2011


32 30 Blizzard of 2011


33 31 Blizzard of 2011

34 32 Blizzard of 2011
35
36 Finance Presentation Metra Board of Directors November 11, 2011 Presented by Jim Mickus Director, Budget
37 September 2011 Budget vs. Actual (000's) Actual vs Actual Budget Budget Operating revenue Passenger revenue $ 21,709 $ 20,426 $ 1,282 Other revenue 5,104 4, Total operating revenue $ 26,813 $ 25,385 $ 1,427 Operating expense Transportation $ 17,418 $ 17,576 $ 158 Maintenance of Way 10,407 10,031 (376) Maintenance of Equipment 11,602 10,637 (965) Administration & Regional Services 6,305 5,680 (625) Diesel Fuel 6,116 4,373 (1,743) Motive Power (25) Claims, Insur. & Risk Mgmt , Downtown Stations 1,194 1, Total operating expense $ 54,314 $ 51,330 $ (2,984) Operating Deficit $ 27,501 $ 25,945 $ (1,556) Revenue Recovery Ratio 53.5% 55.0% -1.5% 2 37
38 September Year To Date 2011 Budget vs. Actual (000's) Actual vs Actual Budget Budget Operating revenue Passenger revenue $ 184,642 $ 182,809 $ 1,832 Other revenue 40,559 41,449 (890) Total operating revenue $ 225,200 $ 224,258 $ 942 Operating expense Transportation $ 153,534 $ 155,022 $ 1,488 Maintenance of Way 93,303 93, Maintenance of Equipment 101, ,199 (484) Administration & Regional Services 49,852 51,580 1,728 Diesel Fuel 56,754 43,915 (12,839) Motive Power 5,898 6, Claims, Insur. & Risk Mgmt. 10,213 11,664 1,451 Downtown Stations 10,813 10,751 (63) Total operating expense $ 482,050 $ 474,025 $ (8,026) Operating Deficit $ 256,850 $ 249,766 $ (7,083) Revenue Recovery Ratio 54.1% 55.1% -1.0% 3
39 Average Monthly Diesel Fuel Prices Average Cost Per Gallon $3.40 $3.20 $3.00 $2.80 $2.60 $2.40 $2.20 $ Sep Oct Nov Dec Jan Feb Mar Apr May Jun Jul Aug Sep Oct Nov Dec Budget Actual 4

40 Diesel Fuel Lock Prices versus Market $3.80 $3.70 $3.60 $3.50 $3.40 $3.30 $3.20 $ Month 18 Month Market Forecast 50% 1/1/12 Lock 25% 1/1/12 Lock $3.00 $2.90 $2.80 $2.70 8/4 8/11 8/18 8/25 9/1 9/8 9/15 9/22 9/29 10/6 10/13 10/20 10/27 11/3 11/10 11/17 11/25 5
41

42 2012 Fare Increase Samples of Public Information Metra Board of Directors November 11, 2011 Presented by Sharon Austin Senior Corporate Director Customer Affairs and Workforce Training Police & Emergency Preparedness
43 Ten-Ride Ticket Stockpiling 300, , ,000 Jan 1996 stockpiling Jan 2002 stockpiling Jan 2006 stockpiling Jan 2008 stockpiling 150, ,000 50, Feb 1996 fare increase (5.5% overall) Feb 2002 fare increase (5% overall) Feb 2006 fare increase (5% overall) Feb 2008 fare increase (10% overall)
44 Ten-Ride Ticket Stockpiling (cont.) In January 2008, there was a 67% increase (or 104,000 tickets) sold compared to January 2007 prior to the 10% increase effective February 1, 2008 Given the larger fare increase proposed, the estimated revenue loss could be $1.6 M to $2.7 M assuming an increase of 150,000 to 250,000 tickets for stockpiling 3
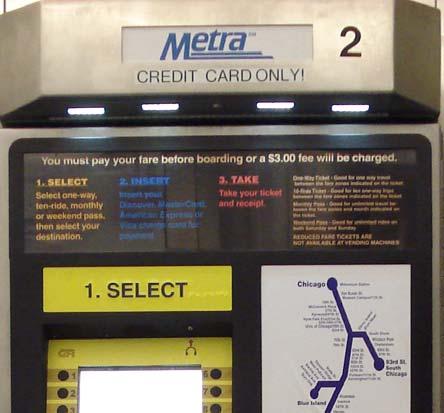
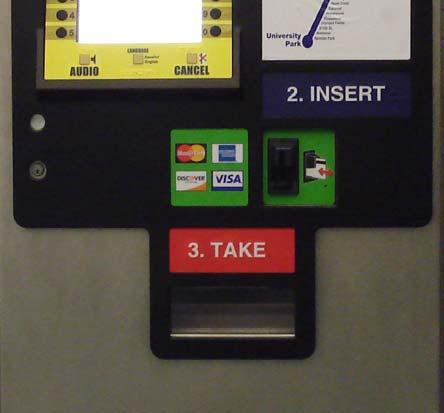
45 Peer Research on Ticket Stockpiling Peers have experienced ticket stockpiling before a fare increase Most peers have not implemented stockpiling countermeasures Ten-ride ticket valid periods for peers much shorter than Metra s (typically 6 months) NJ Transit implemented a 25% fare increase in May 2010 and experienced stockpiling of tickets in April 2010 One-way ticket sales were 16% higher than the year-year trend of the prior 6 months; Ten-Trip tickets were 57% higher Ticket window transactions were limited to ten tickets (but riders could re-enter the queue to buy another ten) Ticket vending machine sales already limited to ten ticket limit per transaction, plus a daily limit on number of transactions for any single credit card to protect against card theft 4
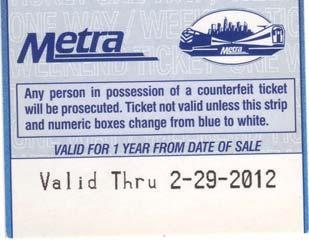
46 5 Commuter Poster
47 6 Customer Notice & Fare Chart
48 7 Agent Window Tent Card & Vending Machine Sticker

49 8 Ticket-by-Mail and Ticket-by-Internet Insert


50 9 Agent Stamps on One-Way Tickets


51 10 Agent Stamps on Ten-Ride Tickets


52 11 Credit Card Vending Machine One Way & Ten-Ride


53 Cash Vending Machine Temporary Ticket Note: When sold as a one way or ten-ride ticket, this ticket is no longer valid for use after February 29, All fares and refunds subject to prevailing rules and regulations listed on 12
54 13 Thank you
55
RIDERSHIP TRENDS. January 2018
 RIDERSHIP TRENDS January 2018 Prepared by the Division of Strategic Capital Planning March 2018 Table of Contents Executive Summary...1 Ridership...3 Estimated Passenger Trips by Line...3 Estimated Passenger
RIDERSHIP TRENDS. August 2018
 RIDERSHIP TRENDS August Prepared by the Division of Strategic Capital Planning October Table of Contents Executive Summary...1 Ridership...3 Estimated Passenger Trips by Line...3 Estimated Passenger Trips
RIDERSHIP TRENDS. October 2017
 RIDERSHIP TRENDS October 2017 Prepared by the Division of Strategic Capital Planning December 2017 Table of Contents Executive Summary...1 Ridership...3 Estimated Passenger Trips by Line...3 Estimated
Sound Transit Operations June 2016 Service Performance Report. Ridership
 Ridership Total Boardings by Mode Mode Jun-15 Jun-16 % YTD-15 YTD-16 % ST Express 1,622,222 1,617,420-0.3% 9,159,934 9,228,211 0.7% Sounder 323,747 361,919 11.8% 1,843,914 2,099,824 13.9% Tacoma Link 75,396
January 2018 Air Traffic Activity Summary
 January 2018 Air Traffic Activity Summary Jan-2018 Jan-2017 CY-2018 CY-2017 Passengers 528,947 505,421 4.7% 528,947 505,421 4.7% Passengers 537,332 515,787 4.2% 537,332 515,787 4.2% Passengers 1,066,279
Sound Transit Operations March 2018 Service Performance Report. Ridership
 March 218 Service Performance Report Ridership Total Boardings by Mode Mar-17 Mar-18 % YTD-17 YTD-18 % ST Express 1,622,116 1,47,79-4.6% 4,499,798 4,428,14-1.6% Sounder 393,33 39,6.% 1,74,96 1,163,76 8.3%
Sound Transit Operations December 2014 Service Performance Report. Ridership
 Ridership Total Boardings by Mode Mode Dec-13 Dec-14 % YTD-13 YTD-14 % ST Express 1,266,130 1,396,787 10.3% 16,605,299 17,661,976 6.4% Sounder 248,710 285,016 14.6% 3,035,735 3,361,317 10.7% Tacoma Link
Sound Transit Operations August 2015 Service Performance Report. Ridership
 Ridership Total Boardings by Mode Mode Aug-14 Aug-15 % YTD-14 YTD-15 % ST Express 1,534,241 1,553,492 1.3% 11,742,839 12,354,957 5.2% Sounder 275,403 326,015 18.4% 2,139,086 2,463,422 15.2% Tacoma Link
Sound Transit Operations January 2014 Service Performance Report. Ridership
 Ridership Total Boardings by Mode Mode Jan-13 Jan-14 % YTD-13 YTD-14 % ST Express 1,343,290 1,426,928 6.2% 1,343,290 1,426,928 6.2% Sounder 245,135 256,775 4.7% 245,135 256,775 4.7% Tacoma Link 86,229
Sound Transit Operations January 2017 Service Performance Report. Ridership. Total Boardings by Mode
 January 217 Service Performance Report Ridership ST Express Sounder Tacoma Link Link Paratransit Jan-16 Jan-17 % 1,433,7 1,3,33 4.9% 331,27 7,121 98,411 3,633 Total Boardings by Mode 363,6 74,823 1,76,914
Sound Transit Operations March 2017 Service Performance Report. Ridership. Total Boardings by Mode
 March 217 Service Performance Report Ridership ST Express Sounder Tacoma Link Link Paratransit Mar-16 Mar-17 % 1,83,4 1,621,49 2.4% 37,496 82,631 1,264,47 3,821 Total Boardings by Mode 389,98 87,39 1,89,43,297
Sound Transit Operations February 2018 Service Performance Report. Ridership
 February 218 Service Performance Report Ridership Total Boardings by Mode Feb-17 Feb-18 % YTD-17 YTD-18 % ST Express 1,373,96 1,372,88 -.1% 2,877,294 2,88,719.1% Sounder 314,96 32,187 11.9% 681,923 768,69
Sound Transit Operations January 2018 Service Performance Report. Ridership
 January 218 Service Performance Report Ridership Total Boardings by Mode Jan-17 Jan-18 % YTD-17 YTD-18 % ST Express 1,3,33 1,7,91.3% 1,3,33 1,7,91.3% Sounder 367,33 416,8 13.3% 367,33 416,8 13.3% Tacoma
SYSTEM BRIEF DAILY SUMMARY
 SYSTEM BRIEF SUMMARY * ANNUAL (PEAK HOURS 7:00 AM TO 10:00 PM MON-SAT) MaxTemp NEL (MWH) Hr Ending Hr Ending LOAD ENERGY (MWH) INCREMENTAL COST DAY DATE Civic TOTAL MAXIMUM @Max MINIMUM @Min FACTOR ON
HOTEL INDUSTRY OVERVIEW. Texas
 HOTEL INDUSTRY OVERVIEW Texas DEMAND GROWTH STRONG BALANCED OCC & ADR GROWTH % Change Room Supply* 149M 1.3% Room Demand* 92M 5.6% Occupancy 61.6% 4.3% A.D.R. $90 4.4% RevPAR $55 8.9% Room Revenue* $8.3B
MONTHLY OPERATIONS REPORT SEPTEMBER 2015
 MONTHLY OPERATIONS REPORT SEPTEMBER 215 Table of Contents SEPTEMBER 215 Section Page September Highlights... 3 Strategic Goals Progress Update... 4 Ridership... 6 Revenue... 9 Expenses... 1 System Summary...
Capital Metropolitan Transportation Authority. Monthly Performance Report
 Capital Metropolitan Transportation Authority Monthly Performance Report SEPTEMBER 2010 Ridership Report Budget to Actual Ridership Budget Target: 2,335,906 Actual: 2,291,235 Ridership Comparison Fiscal
Board Box. October Item # Item Staff Page 1. Key Performance Indicators Sep 2018 M. Mungia Financial Report Aug 2018 H.
 Board Box October 2018 Item # Item Staff Page 1. Key Performance Indicators Sep 2018 M. Mungia 2-10 2. Financial Report Aug 2018 H. Rodriguez 11-15 ITEM 1 October 31, 2018 TO: FROM: RE: BOARD OF DIRECTORS
Airline industry outlook remains fragile
 Airline industry outlook remains fragile June 2009 www.iata.org/economics To represent, lead and serve the airline industry Airline industry outlook remains fragile Green shoots starting to appear Recovery
Monthly SunPass Transponder Sales Inception to June 2012
 Monthly SunPass Transponder Sales Inception to June 2012 This graph shows the monthly SunPass transponder sales since inception. The significant increase in transponder sales during March 2004 is attributed
2017/ Q1 Performance Measures Report
 2017/2018 - Q1 Performance Measures Report Contents Ridership & Revenue... 1 Historical Revenue & Ridership... 1 Revenue Actual vs. Planned... 3 Mean Distance Between Failures... 5 Maintenance Cost Quarter
MONTHLY OPERATIONS REPORT DECEMBER 2015
 MONTHLY OPERATIONS REPORT DECEMBER 215 Table of Contents DECEMBER 215 Section Page December Highlights... 3 Strategic Goals Progress Update... 4 Ridership... 6 Revenue... 9 Expenses... 1 System Summary...
METRO OPERATIONS COMMITTEE
 Los Angeles County Metropolitan Transportation Authority Item 1 CHIEF OPERATIONS OFFICER S S REPORT METRO OPERATIONS COMMITTEE Lonnie Mitchell Chief Operations Officer May 19, 20 1 Employee Recognition
STAR CRUISES SUPER STAR LIBRA 01 NIGHT CRUISE
 STAR CRUISES SUPER STAR LIBRA EX PENANG: SUPERSTAR LIBRA Sailing: 01 December, 2016 30 December, 2017 Duration: 1 NIGHT CRUISE SUN - THU 01 NIGHT CRUISE 1 Nt. Regular Cruise (Sun Thu Dep) DAY 1 Penang
Managing And Understand The Impact Of Of The Air Air Traffic System: United Airline s Perspective
 Managing And Understand The Impact Of Of The Air Air Traffic System: United Airline s Perspective NEXTOR NEXTOR Moving Moving Metrics: Metrics: A Performance-Oriented View View of of the the Aviation Aviation
DTTAS Quarterly Aviation Statistics Snapshot Quarter Report
 Contents DTTAS Quarterly Aviation Statistics Snapshot Quarter 4 2015 Report 1.1 Dublin Airport Key Statistics... 1 1.2 Cork Airport Key Statistics... 3 1.3 Shannon Airport Key Statistics... 5 1.4 Total
DTTAS Quarterly Aviation Statistics Snapshot Quarter Report
 Contents DTTAS Quarterly Aviation Statistics Snapshot Quarter 3 2018 Report 1.1 Dublin Airport Key Statistics... 1 1.2 Cork Airport Key Statistics... 3 1.3 Shannon Airport Key Statistics... 5 1.4 Total
DTTAS Quarterly Aviation Statistics Snapshot Quarter Report
 Contents DTTAS Quarterly Aviation Statistics Snapshot Quarter 1 2018 Report 1.1 Dublin Airport Key Statistics... 1 1.2 Cork Airport Key Statistics... 3 1.3 Shannon Airport Key Statistics... 5 1.4 Total
Billings Area COC. For the Month of December 2010 Date Created: Jan 18, 2011
 1 United Kingdom United States Blue Fin Building 735 East Main Street 110 Southwark Street Hendersonville London SE1 0TA TN 37075 Phone: +44 (0)20 7922 1930 Phone: +1 (615) 824 8664 Fax: +44 (0)20 7922
SAN LUIS OBISPO COUNTY REGIONAL AIRPORT ANNUAL AIRLINE PASSENGER SUMMARY SUMMARY BY YEAR AND MONTH 4/11/2018
 ANNUAL AIRLINE PASSENGER SUMMARY SUMMARY BY YEAR AND MONTH 4/11/ JAN FEB MAR IL E Y T 35,023 36,435 38,282 38,390 37,848 35,589 38,325 37,433 32,324 31,169 32,771 33,627 30,978 24,586 23,382 2017 24,586
SAS Group Presentation Carnegie, May 22, 2012 Sture Stölen, Head of IR
 SAS Group Presentation Carnegie, May 22, 2012 Sture Stölen, Head of IR 1 This is the SAS Group 128 destinations 27,2 million passengers 28 new routes to be launched 2012 1,085 daily flights Revenues 2011,
VCTC Transit Ridership and Performance Measures Quarterly Report
 VCTC Transit Ridership and Performance Measures Quarterly Report Overview Quarter 2 Fiscal Year 2018-2019 This report provides performance measures for VCTC Intercity Bus Service covering the FY 2018-19
2017/2018 Q3 Performance Measures Report. Revised March 22, 2018 Average Daily Boardings Comparison Chart, Page 11 Q3 Boardings figures revised
 2017/2018 Q3 Performance Measures Report Revised March 22, 2018 Average Daily Boardings Comparison Chart, Page 11 Q3 Boardings figures revised Contents Ridership & Revenue... 1 Historical Revenue & Ridership...
Manual vs. Automatic Operation and Operational Restrictions
 Customer Services, Operations, and Safety Committee Board Information Item IV-B March 11, 2010 Manual vs. Automatic Operation and Operational Restrictions Page 81 of 91 Washington Metropolitan Area Transit
PERFORMANCE REPORT DECEMBER Performance Management Office
 PERFORMANCE REPORT DECEMBER 2018 Performance Management Office INTRODUCTION/BACKGROUND Performance Management Office FIXED ROUTE DASHBOARD FY 2019 Safety Max Target Goal Preventable Collisions per 100k
September 2010 Brian Pearce To represent, lead and serve the airline industry
 Cycle turns up but risks and structural challenges remain September 2010 Brian Pearce www.iata.org/economics To represent, lead and serve the airline industry Confidence was still high in July survey Airline
Inter-Office Memo Reno-Tahoe Airport Authority
 Inter-Office Memo Reno-Tahoe Airport Authority Date: November 30, 2009 To: Statistics Recipients From: Krys T. Bart, A.A.E., President/CEO Subject: RENO-TAHOE INTERNATIONAL AIRPORT PASSENGER STATISTICS
DISTRICT EXPRESS LANES ANNUAL REPORT FISCAL YEAR 2017 JULY 1, 2016 JUNE 30, FloridaExpressLanes.com
 DISTRICT EXPRESS LANES ANNUAL REPORT FISCAL YEAR 2017 JULY 1, 2016 JUNE 30, 2017 FloridaExpressLanes.com This page intentionally left blank. TABLE OF CONTENTS List of Figures... ii List of Tables.... ii
PREMIUM TRAFFIC MONITOR MARCH 2009
 PREMIUM TRAFFIC MONITOR MARCH 2009 KEY POINTS The fall in passenger numbers slowed in March, to a decline of 9.3% following February s 9.6% fall. However, this slowdown was entirely due to February s fall
Yukon Bureau of Statistics
 Yukon Bureau of Statistics 2 9 # 1 $ > 0-2 + 6 & ± 8 < 3 π 7 5 9 1 ^ 1 Retail Motor Fuel Prices in the Yukon Average prices as of May 20 th, 2009 Self-serve regular premium diesel Whitehorse 99.5 105.9
PERFORMANCE REPORT DECEMBER 2017
 PERFORMANCE REPORT DECEMBER 2017 Note: New FY2018 Goal/Target/Min or Max incorporated in the Fixed Route and Connection Dashboards. Keith A. Clinkscale Performance Manager INTRODUCTION/BACKGROUND Keith
The Beach Club D103 -
 The Beach Club D103 - Summary 2 Bedroom 2 Bath Beach Front Condo Description This condo is above the rest. Each room is custom decorated with a very rustic but contemporary style. The kitchen has all stainless
Damon Hylton Vice President
 ACI-NA Commissioners Conference Air Service Development in a Tough Market Damon Hylton Vice President May 19, 2008 Today s Agenda Background Now What? Questions and Answers 2 Background 3 Current Industry
OSHA/EHSM Courses. Metropolitan Community College Universal, Kansas City, MO. Class/Class # Date Days Times Location Contact
 OSHA/EHSM Courses Metropolitan Community College - 1775 Universal, Kansas City, MO Class/Class # Date Days Times Location Contact OSHA 500 Trainer Course in Standards the Construction Industry - $757 60996
25 th Avenue Grade Separation. September 13, 2017
 25 th Avenue Grade Separation September 13, 2017 Agenda I. Overview II. III. IV. Project Description Project Benefits Project Construction V. Next Steps VI. Questions 2 Overview Project Location 4 E. 25
STAR CRUISES. 3 Nts. Penang / Phuket / Krabi Cruise (Sunday dep.) DAY PORT ETA ETD SAILING DATES Sun Penang Jan:
 DAY PORT ETA ETD SAILING DATES Sun Penang Jan:") STAR CRUISES EX- PENANG: SUPERSTAR LIBRA Sailing: 27 January, 2013 23 March, 2014 Duration: 03 NIGHTS CRUISE (SUNDAY SAILING) 3 Nts. Penang / Phuket / Krabi Cruise (Sunday dep.) DAY PORT ETA ETD SAILING
STAR CRUISES EX- PENANG: SUPERSTAR LIBRA Sailing: 27 January, 2013 23 March, 2014 Duration: 03 NIGHTS CRUISE (SUNDAY SAILING) 3 Nts. Penang / Phuket / Krabi Cruise (Sunday dep.) DAY PORT ETA ETD SAILING
PASSENGER FARE TARIFF AND SALES MANUAL
 PREMIUMS AND TAXES TABLE OF CONTENTS Flex Fare Mark-Up Table... 5.2 Trips Terminal Surcharge Pricing... 5.3 Legacy STANDARD and Weekend and Holiday Premium... 5.4 Legacy STANDARD Holiday Premium Pricing...
PERFORMANCE REPORT NOVEMBER 2017
 PERFORMANCE REPORT NOVEMBER 2017 Note: New FY2018 Goal/Target/Min or Max incorporated in the Fixed Route and Connection Dashboards. Keith A. Clinkscale Performance Manager INTRODUCTION/BACKGROUND In June
Number of tourism trips of residents increased namely for leisure
 Tourism Demand of Residents 1 st Quarter 2018 25 July 2018 Number of tourism trips of residents increased namely for leisure In the 1 st quarter 2018, residents in Portugal took a total of 4.5 million
Existing Services, Ridership, and Standards Report. June 2018
 Existing Services, Ridership, and Standards Report June 2018 Prepared for: Prepared by: Contents Overview of Existing Conditions... 1 Fixed Route Service... 1 Mobility Bus... 34 Market Analysis... 41 Identification/Description
Performance Measures Year End Updated-
 Performance Measures Year End 2017 -Updated- Priorities and Objectives 1. Earn and Retain the Community s Trust 2. Provide Excellent Customer Service 3. Enable Organizational Success 4. Exemplify Financial
Driving Ridership Strategic Partnerships
 Driving Ridership Strategic Partnerships Feb 29, 2012 Presented by Priya Bhasin-Singh, Strategic Marketing Associate priya.bhasin-singh@edmonton.ca 2012 APTA Marketing & Communications Conference About
Total trail movements for the period 1,569,597
 Queenstown Trail Visitation Executive Summary for Period - October 18, 2012 to January 31, 2015 trail movements for the period 1,569,597 352,718 trail journeys since opening Sunday is the busiest day of
December 2011 Passenger and Cargo Traffic Statistics Reno-Tahoe International Airport
 December 2011 Passenger and Cargo Traffic Statistics Reno-Tahoe International Airport January 27, 2012 U.S. DOMESTIC INDUSTRY OVERVIEW FOR DECEMBER 2011 All RNO Carriers Systemwide year over year comparison
How Russians Spend Abroad 2010
 Russia Consumer research How Russians Spend Abroad Citibank s Annual Research of Credit Card Transactions Abroad August Spend Abroad Dynamics Share of spend abroad (as % of total spend over one year) 20%
December 2013 Passenger and Cargo Traffic Statistics Reno-Tahoe International Airport
 December 2013 Passenger and Cargo Traffic Statistics Reno-Tahoe International Airport January 24, 2014 U.S. DOMESTIC INDUSTRY OVERVIEW FOR DECEMBER 2013 All RNO Carriers Domestic Systemwide year over year
Memorandum. DATE: May 9, Board of Directors. Jim Derwinski, CEO/Executive Director. Fare Structure Study Fare Pilot Program
 Memorandum DATE: May 9, 2018 TO: FROM: SUBJECT: Board of Directors Jim Derwinski, CEO/Executive Director Fare Structure Study Fare Pilot Program RECOMMENDATION Board action is requested to approve an ordinance
Measures & Projections October 31, GoToBermuda.com
 Measures & Projections October 31, 2015 GoToBermuda.com October Total Vacation Visitor Arrivals Vacation Arrivals Oct-14 Oct-15 2015 Air Vacation 9,203 10,344 1,141 12.40 126,842 127,044 202 0.16 Cruise
25 th Avenue Grade Separation. December 13, 2017
 25 th Avenue Grade Separation December 13, 2017 Agenda I. Overview II. III. IV. Project Description Project Benefits Project Construction V. Next Steps VI. Questions 2 Overview Project Location 4 E. 25
Annual Weather Book RECORDED BY NW RESEARCH & OUTREACH CTR. By: Michael Leiseth
 Annual Weather Book RECORDED BY NW RESEARCH & OUTREACH CTR. By: Michael Leiseth Table I II 1 2 3 4 5 6 7 8 9, 10 11, 12 13, 14 15, 16 17 18 An average year in Crookston, MN. Seasonal extremes in Crookston,
Fort Irwin Ticket Office Fort Irwin, CA BLDG P21 - Phone Tuesday Saturday Hotel Prices
 Fort Irwin Ticket Office Fort Irwin, CA BLDG P21 - Phone-760-380-4767 Tuesday Saturday 1100-2000 Hotel Prices (O/517) Holiday Inn - Buena Park $128.00 per day Tel (714) 522-7000 (rate code ILVDM )...1
Providing public transportation since 1999 between Washington and Milwaukee Counties
 Providing public transportation since 1999 between Washington and Milwaukee Counties Background Information Started in 1999, funded by a three-year CMAQ grant. Employers and fare revenue covered local
SIA GROUP FINANCIAL RESULTS
 FINANCIAL RESULTS For Ended 30 June 2018 197200078R Operating Result Q1 Q1 Better/ FY18/19 FY17/18 R1 (Worse) ($M) ($M) (%) Total Revenue 3,844 3,864 (0.5) Q1 Better/ FY17/18 R2 (Worse) ($M) (%) 3,689
Annual Fuel Price Report 2010
 Annual Fuel Price Report 20 The RACQ publishes comprehensive monthly analysis of petrol price movements for major capital city markets and Queensland regional centres. This report draws on that information
Report for Jan-Nov-2006 pdf. General Statistics
 Report for Jan-Nov-006 pdf Time range: /8/006 07:3:37 - /3/006 3:50:6 Generated on Mon Jan 0, 007-9:3:5 General Statistics Summary Summary Hits Total Hits 97,06 Average Hits per Day 89 Average Hits per
AirportInfo. Economic Indicators & Traffic
 AirportInfo Economic Indicators & Traffic March 2012 U.S. & Canadian GDP Economic Focus 6% 4% US Canada 2% 0% -2% -4% -6% -8% -10% GDP growth improved slightly for both the U.S. and Canada in the third
Hard Labor Creek State Park Business Plan. Table of Contents
 Hard Labor Creek State Park Business Plan Table of Contents Georgia State Parks and Historic Sites Executive Summary Site Name Site Manager Region Manager Hard Labor Creek State Park Daniel Schay Eric
International Visitation to the Northern Territory. Year ending December 2017
 International Visitation to the Northern Territory Year ending December 2017 The following is a summary of information relevant to the Northern Territory (NT) tourism industry including visitation results
ATM Network Performance Report
 ATM Network Performance Report 2018. Page 1 of 16 Table of contents Summary... 3 Network Wide Performance... 4 Airborne delay... 4 Sydney... 6 Airborne delay... 6 Notable events... 6 Melbourne... 9 Airborne
ER1 The Best View at Copper Mountain!
 ER1 The Best View at Copper Mountain! Summary 1 BR 2 Bath Condo - sleeps up to 4 Description EK1 Elk Run -- Only 200 Yards to Super Bee Lift -- Private Heated Garage -- Platinum Rated Town Home -- Private
FIXED ROUTE DASHBOARD JULY 2018
 FIXED ROUTE DASHBOARD JULY 2018 Safety Max Target Goal Preventable Collisions per 100k Miles Non-Preventable Collisions per 100k Miles Total Incidents per 10,000 Boardings 1.6 1.3 0.8 2.63 2.1 2.0 1.60
6 Days Grand Melbourne
 6 Days Grand Melbourne (2 FULL DAY + HALF DAY) Valid Till 31 Mar 2019 DAY 1 DAY 2 DAY 3 DAY 4 & DAY 5 DAY 6 Arrival (No Meet & Greet) SIC Transfer from Melbourne Airport To Melbourne CBD Hotel Choose either
Prices are Starting From MARINER OF THE SEAS VOYAGER CLASS TONNAGE :
 MARINER OF THE SEAS SAILING ON MARCH 2018 1-Mar-18 5-Mar-18 9-Mar-18 12-Mar-18 16-Mar-18 19-Mar-18 29-Mar-18 2-Apr-18 6-Apr-18 4 NIGHTS 4 NIGHTS 3 NIGHTS 4 NIGHTS 3 NIGHTS 3 NIGHTS 4 NIGHTS 4 NIGHTS 3
BaltimoreLink Implementation Status Report
 BaltimoreLink Implementation Status Report February 218 Joint Chairmen s Report JH1 Executive Summary BaltimoreLink, implemented on June 18, 217, is the complete overhaul and rebranding of the core transit
TOURISM PERFORMANCE 2017
 4 th QUARTER TOURISM PERFORMANCE 2017 TOTAL STAYOVER ARRIVALS 105,658 TOTAL CRUISE ARRIVALS 224,212 TOTAL VISITOR NIGHTS AVERAGE HOTEL OCCUPANCY 935,402 71.7% ECONOMIC IMPACT $142.6 million HOW WAS OUR
Visit Loudoun 2016 Lodging Market Research
 2016 Lodging Market Research Prepared for: Loudoun County Lodging Market Research & Analysis Study Conducted: November December 2016 Final Report Submitted: December 2016 2016 Lodging Market Analysis Summary
Billings Area COC. For the Month of April 2017 Date Created: May 17, 2017
 United Kingdom United States Blue Fin Building 735 East Main Street 110 Southwark Street Hendersonville London SE1 0TA TN 37075 Phone: +44 (0)20 7922 1930 Phone: +1 (615) 824 8664 Fax: +44 (0)20 7922 1931
December 2012 Passenger and Cargo Traffic Statistics Reno-Tahoe International Airport
 December 2012 Passenger and Cargo Traffic Statistics Reno-Tahoe International Airport January 29, 2013 U.S. DOMESTIC INDUSTRY OVERVIEW FOR DECEMBER 2012 All RNO Carriers Systemwide year over year comparison
Greater Portland Transit District
 Greater Portland Transit District TO: FROM: Freeport Town Council Greg Jordan - Metro General Manager DATE: September 10, 2014 SUBJECT: Metro Request to Pursue Grant Funding for Trial Express Bus Service
Multiple Listing Service of Southern Arizona Monthly Statistics February 2018
 For Immediate Release: March 8, 18 CONTACT: Judith Grammond MLSSAZ President (5) 71-18 Sean Murphy Executive Vice President (5) 8-87 Randy Rogers CEO, MLSSAZ (5) 7-18 Multiple Listing Service of Southern
November 2013 Passenger and Cargo Traffic Statistics Reno-Tahoe International Airport
 November 2013 Passenger and Cargo Traffic Statistics Reno-Tahoe International Airport December 26, 2013 U.S. DOMESTIC INDUSTRY OVERVIEW FOR NOVEMBER 2013 All RNO Carriers Domestic Systemwide year over
Passenger and Cargo Statistics Report
 Passenger and Cargo Statistics Report Reno-Tahoe International Airport December 2014 U.S. DOMESTIC INDUSTRY OVERVIEW FOR DECEMBER 2014 All RNO Carriers Domestic Systemwide year over year comparison Average
Passenger Traffic Achieves Strong Growth of 4.8% for the Month of August
 Passenger Traffic Achieves Strong Growth of 4.8% for the Month of August Montréal, 7 October Passenger traffic experienced a slight surge in growth to almost +5% for August compared to previous months
AUCKLAND DESTINATION OVERVIEW
 AUCKLAND DESTINATION OVERVIEW October 218 An in-depth overview of Auckland s visitor economy from the latest arrival, accommodation, spend, cruise and event data through to past five- commentary. Prepared
AUCKLAND DESTINATION OVERVIEW
 AUCKLAND DESTINATION OVERVIEW September 218 An in-depth overview of Auckland s visitor economy from the latest arrival, accommodation, spend, cruise and event data through to past five- commentary. Prepared
January 2014 Passenger and Cargo Traffic Statistics Reno-Tahoe International Airport
 January 2014 Passenger and Cargo Traffic Statistics Reno-Tahoe International Airport March 12, 2014 U.S. DOMESTIC INDUSTRY OVERVIEW FOR DECEMBER 2013 All RNO Carriers Domestic Systemwide year over year
Kathleen Llewellyn-Thomas, Commissioner of Transportation Services
 Transportation Services Department MEMORANDUM TO: FROM: Transportation Services Committee Kathleen Llewellyn-Thomas, Commissioner of Transportation Services DATE: January 21, 2011 RE: December 2010 Transit
Performance monitoring report 2017/18
 Performance monitoring report /18 Gatwick Airport Limited 1. Introduction Date of issue: 20 July 2018 This report provides an update on performance at Gatwick in the financial year /18, ending 31 March
STAR CRUISES 02 NIGHTS CRUISE. 2 Nts. High Seas Cruise (Friday dep) DAY PORT ETA ETD SAILING DATES
 DAY PORT ETA ETD SAILING DATES") STAR CRUISES 02 NIGHTS CRUISE EX- SINGAPORE: SUPERSTAR GEMINI Sailing: 27 March 2016 to 28 October 2016 Duration: 02 NIGHTS CRUISE (FRIDAY SAILING) 2 Nts. High Seas Cruise (Friday dep) DAY PORT ETA ETD
STAR CRUISES 02 NIGHTS CRUISE EX- SINGAPORE: SUPERSTAR GEMINI Sailing: 27 March 2016 to 28 October 2016 Duration: 02 NIGHTS CRUISE (FRIDAY SAILING) 2 Nts. High Seas Cruise (Friday dep) DAY PORT ETA ETD
2007/08 Full Year Results Investor Briefing
 2007/08 Full Year Results Investor Briefing Highlights of Result Profit before tax up 46% to $1,408 million Up 36% on the reported result Margin improvement $3 billion of Sustainable Future Benefits achieved
Oct-17 Nov-17. Travel is expected to grow over the coming 6 months; at a slower rate
 Analysis provided by TRAVEL TRENDS INDEX OCTOBER 2018 CTI reading of 51.6 in October 2018 indicates that travel to or within the U.S. grew 3.2% in October 2018 compared to October 2017. LTI predicts travel
U.S. DOMESTIC INDUSTRY OVERVIEW FOR MARCH
 Inter-Office Memo Reno-Tahoe Airport Authority Date: April 30, 2009 To: Statistics Recipients From: Krys T. Bart, A.A.E., President/CEO Subject: RENO-TAHOE INTERNATIONAL AIRPORT PASSENGER STATISTICS U.S.
Weekly Performance Update
 Pr. Rupert Vancouver Grain Monitoring Program Weekly Performance Update January, 19 For (1-19 CY) Summary 1. Stocks in Store (' tonnes) Country Elevators % of Working T his Week Last Week Var. fro m Last
May 2011 Passenger and Cargo Traffic Statistics Reno-Tahoe International Airport
 May 2011 Passenger and Cargo Traffic Statistics Reno-Tahoe International Airport July 5, 2011 U.S. DOMESTIC INDUSTRY OVERVIEW FOR MAY 2011 All RNO Carriers Systemwide year over year comparison Average
Statistics Report. June Page 1
 Statistics Report June 214 Page 1 TABLE OF CONTENTS PUBLIC TRANSPORT... 3 1. HIGHLIGHTS... 3 2. PUBLIC TRANSPORT PATRONAGE... 4 3. PUBLIC TRANSPORT SERVICE PERFORMANCE... 14 4. SPECIAL EVENT PUBLIC TRANSPORT
ACI-NA Small Airports Committee Meeting June 4, Tom Rafter, A.A.E.
 ACI-NA Small Airports Committee Meeting June 4, 2017 Tom Rafter, A.A.E. Nantucket Memorial Airport Today s Discussion Nantucket Overview The Island The Airport Unique Air Service Characteristics Impacts
Passenger and Cargo Statistics Report
 Passenger and Cargo Statistics Report RenoTahoe International Airport September 2018 U.S. DOMESTIC INDUSTRY OVERVIEW FOR SEPTEMBER 2018 Systemwide RNO Carriers Domestic Flights year over year comparison
Chattanooga & Hamilton Co. Tourism Trends & Economic Outlook
 Chattanooga & Hamilton Co. Tourism Trends & Economic Outlook How Tourism Works for Chattanooga, TN January 21, 2010 Presentation by: Steve Morse, Ph.D. Director & Economist, Tourism Institute University
Statistics Report. May Page 1
 Statistics Report May 214 Page 1 TABLE OF CONTENTS PUBLIC TRANSPORT... 3 1. HIGHLIGHTS... 3 2. PUBLIC TRANSPORT PATRONAGE... 4 3. PUBLIC TRANSPORT SERVICE PERFORMANCE... 14 4. SPECIAL EVENT PUBLIC TRANSPORT
STAR CRUISES SUPER STAR VIRGO 05 NIGHTS CRUISE
 STAR CRUISES SUPER STAR VIRGO 05 NIGHTS CRUISE EX GUANGZHOU (NANSHA) SUPERSTAR VIRGO Sailing: 03 January, 2016 30 October, 2016 Duration: 05 NIGHTS CRUISE (SUNDAY SAILING) 5 Nts. High Seas Halong Bay Sanya