Board of Directors Information Summary
|
|
|
- Dana Carter
- 5 years ago
- Views:
Transcription
 Update")

1 Regional Public Transportation Authority 302 N. First Avenue, Suite 700, Phoenix, Arizona , Fax Board of Directors Information Summary Agenda Item #6 Date July 11, 2008 Subject Regional Office Center (ROC) Update Summary On June 23, 2008, the Regional Office Center Working Group met to discuss the two existing buildings being considered for purchase to co-locate the agencies. In addition, the group explored a revised and re-scoped plan for a new ROC building. Following the Executive Session, the Working Group voted to pursue the 210 East Earll building and continue negotiations for the purchase of that building. Also following the Executive Session, the Working Group voted to ask the Board of Directors of MAG, Valley Metro RPTA, Valley METRO Rail, and the Arizona Municipal Water Users Association (AMWUA) to consider the purchase of the 210 East Earll building. The other two options were removed from consideration. A meeting of the ROC Task Force has been set for July 28 at which time the representatives of each organization will report the decision reached by their organization. Those four decisions will be used to determine whether to continue negotiations for the purchase of the 210 E. Earll building. Having the four organizations, MAG, Valley Metro RPTA, Valley METRO Rail, and the Arizona Municipal Water Users Association (AMWUA), in the same office complex is thought to be financially advantageous and constructive since the groups all work together closely, and have similar interests and constituents. On June 18, the two existing buildings being considered at that time, 111 West Monroe and 210 East Earll, were toured after the MAG consultant, Parsons/3DI, had conducted inspections and assessments of the buildings. The 210 East Earll building, also referred to as the Internal Revenue Service (IRS) Building, is located outside the downtown Phoenix redevelopment area on Third Street at Earll. It is approximately three blocks from the Thomas Light Rail station and two blocks from the Park Central Mall shopping and restaurant area. Originally constructed in 1992, the six-story, 158,249 gross square foot commercial office building includes a 1
2 199,936 gross square foot garage accommodating approximately 655 spaces. There have been no significant renovations since this building was constructed. Consultant replacement recommendations in the initial five years are replacement of roof coverings because the warranty expires in 2012, cooling towers, air handling units and air distribution infrastructure, parking garage lighting fixtures, interior lighting fixtures and circuits, concrete roadway at loading dock apron, core area wall, floor, and ceiling finishes, and exit and emergency lighting systems with battery powered fixtures. Further financial and other details about these buildings were restricted to a confidential memo distributed to those who attended an executive session. If the Board desires such information on the 210 E. Earll building, it is appropriate that the Board enter into Executive Session as allowed under ARS Section A.3 and A.7 to discuss negotiations for the purchase of real property. Fiscal Impact At this point, when a final cost is negotiated for the purchase price of the building and the agencies involved in the purchase are finalized, this item will be brought back to the Board for a decision. The fiscal impact including the actual lease to purchase costs will be discussed at that time or in Executive Session. Considerations Following the late July ROC Working Group meeting, an updated report will be provided. Recommendations It is recommended that the Board of Directors approve further exploration and consideration of the 210 East Earll building as a possible site for a Regional Office Center (ROC) with MAG, METRO, and AMWUA. Contact Person Christopher F. Curcio Deputy Executive Director of Finance (602) Attachments None 2
 J ANUARY")
3 Transit Performance Report FY (JUNE 30, 2007) J ANUARY 2008
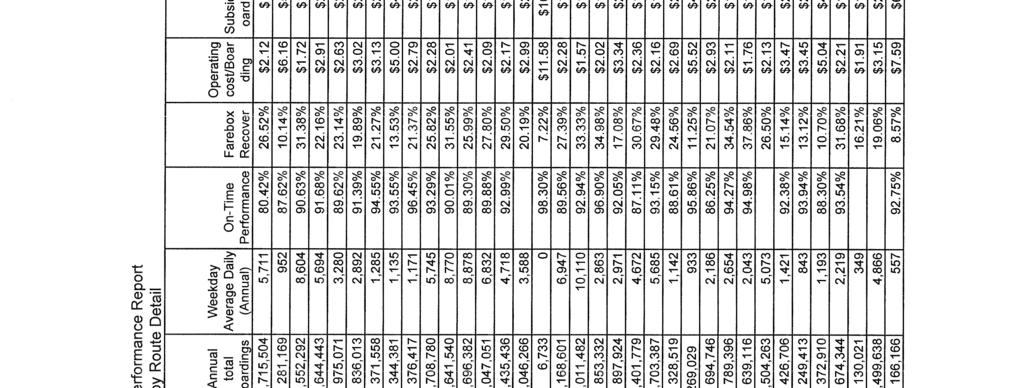
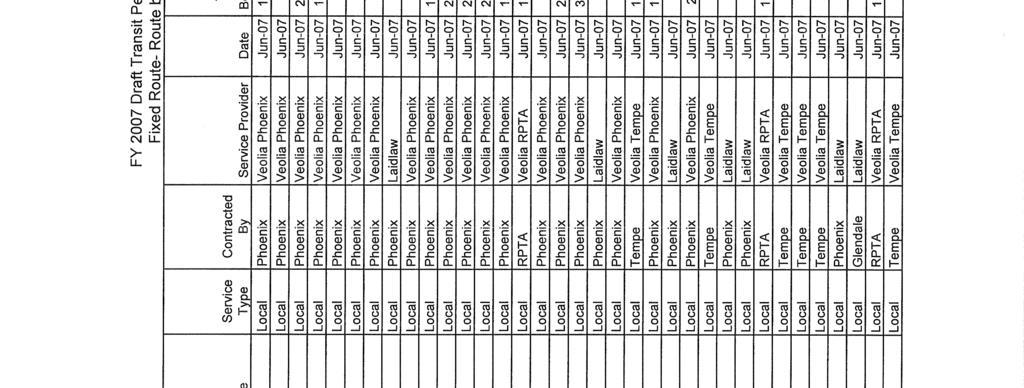
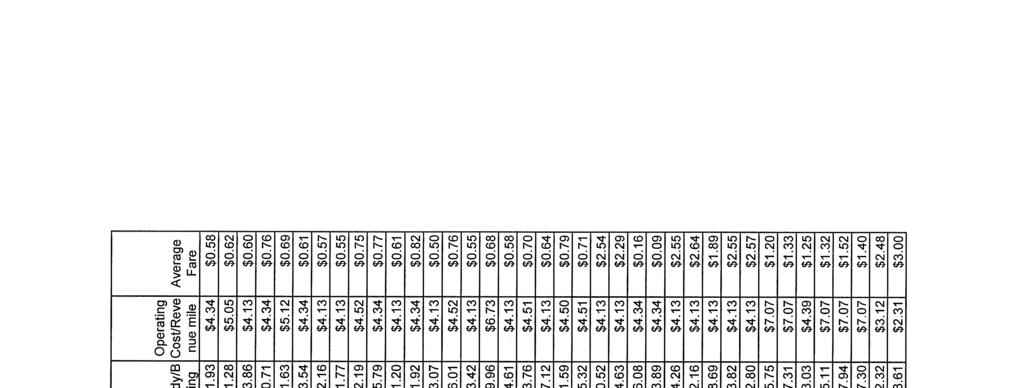
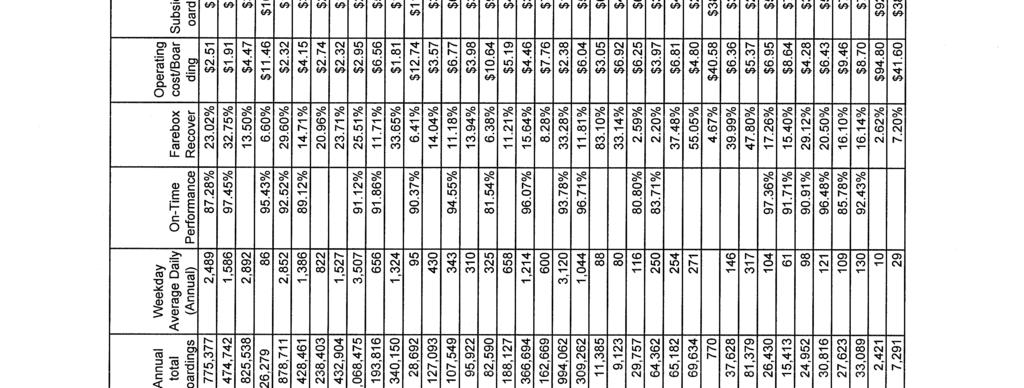
4 TRANSIT PERFORMANCE REPORT FY (JUNE 30, 2007) Transit Performance Report I SSUED: JANUARY 2008 The Transit Performance Report (TPR) is prepared and updated annually by Valley Metro Regional Public Transportation Authority (RPTA). This report is developed using input from, and reviewed by, member agencies and the RPTA Board. The TPR serves as input to Maricopa Association of Governments (MAG) Regional Transportation Plan (RTP) updates. In 2006 RPTA hired a consultant to conduct a Service Efficiency and Effectiveness Study (SEES). One task of this study was to develop a series of performance measures. Transit service in the region is made possible and supported by many funding sources including local city taxes in many cases. The SEES performance measures support the auditing requirements of Proposition 400 legislation. Proposition 400 authorizes a half-cent sales tax approved by voters in 2004 that goes toward freeway, street, transit and light rail improvements. In addition, the SEES developed initial performance targets that will allow comparison between performance expectations and actual performance. These performance measures and performance targets have been incorporated into the TPR. In future years these targets will be reviewed, refined and indexed to inflation as appropriate. The 2007 TPR continues to transition between the previous Performance Management Analysis System (PMAS) format and the new TPR and is based on the findings from the SEES and the data available at the time. In the future, the TPR will serve as a report card indicating the performance of each mode and service category at the system and route level as defined in the SEES. Modes covered by future TPRs will include fi xed route, paratransit, vanpool, and light rail. This report reflects data as reported to RPTA by member agencies. In fiscal year (July 1, 2006 to June 30, 2007), there were many changes affecting data collection and reporting. Some of these changes include service providers transitioning to new fareboxes and light rail construction along major transit routes. Also as part of transitioning towards a new TPR, data definitions and measurements have changed from previous reporting years. Table of Contents DEFINITIONS... 3 FIXED ROUTE BUS... 4 PARATRANSIT... 8 VANPOOL SYSTEM SUMMARY
5 Definitions Average Fare: Average fare is the average price a person pays for a transit trip. It is equal to total fare revenue collected divided by total boardings. Boarding: A boarding is known as an unlinked passenger trip. Every time a person boards a vehicle it is counted as a boarding. For example, if a person makes a trip involving one transfer, this trip is counted as two boardings. Consumer Price Index (CPI): This index is used to measure changes in prices from one period to another. The CPI is frequently used to adjust base payments to reflect changes in prices. In this Report, the CPI for all Urban Consumers (CPI-U) which is averaged for all U.S. Cities, not adjusted for seasonal changes, for transportation items with a base period of =100 was used. The average annual index for FY and FY were calculated using the average monthly index from each fiscal year. The change from the average FY index to FY index is 0.79 percent. Farebox Recovery Ratio: This is the percentage of total operating cost that is covered by fares collected. It is equal to total fare revenue collected divided by total operating costs. Mechanical Failures: Mechanical failure is a failure of some mechanical element of the revenue vehicle that prevents the vehicle from completing a scheduled revenue trip or from starting the next scheduled revenue trip. In addition, mechanical failures include failures from mechanical element of the revenue vehicle, because of local agency policy, prevents the vehicle from completing a scheduled revenue trip or starting the next revenue trip even though the vehicle is physically able to continue in revenue service. Net Vanpool Starts: Calculated by subtracting number of deleted vanpools from the number of new vanpools started. Operating Cost: The total cost to operate and maintain a transit system including labor, fuel, and maintenance, 3 and administration. TRANSIT PERFORMANCE REPORT FY (JUNE 30, 2007) Revenue Hour: A revenue hour is an hour that one vehicle in revenue service is available to pick up revenue passengers. If ten vehicles are in service for two hours each, they collectively perform twenty revenue hours of service. Revenue Mile: A revenue mile is a mile traveled by one vehicle in revenue service that is available to pick up revenue passengers. If ten vehicles are in service for two miles each, they collectively perform twenty revenue miles of service. Revenue Service: Revenue service occurs when a vehicle is available to the general public and there is an expectation of carrying passengers who pay the required fare. Vehicles operated in fare-free service are also considered in revenue service. Revenue service includes layover/ recovery time, but does not include deadhead (i.e. travel from garage to the start point of a route), or vehicle maintenance testing. Safety Incident: Safety incidents only include major safety incidents that involve a transit vehicle or occur on transit-controlled property. Some conditions that apply to a major indecent involve property damage equal or exceeding $25,000, fatality or major injuries for two or more people. Security Incident: Security incidents are crimes (e.g. injuries or deaths resulting from assaults, arson, homicide) and the consequences of security incidents. Security incidents only include major incidents which involve a fatality, two or more injures or property damage over $25,000. Subsidy per Boarding: Also known as net operating cost per boarding, this is the operating cost per boarding minus the fare revenue per boarding. This number indicates the amount of public funding that is used to make up the difference between the cost of providing transportation service and the revenue generated by this service on a per boarding basis.
 Includes")

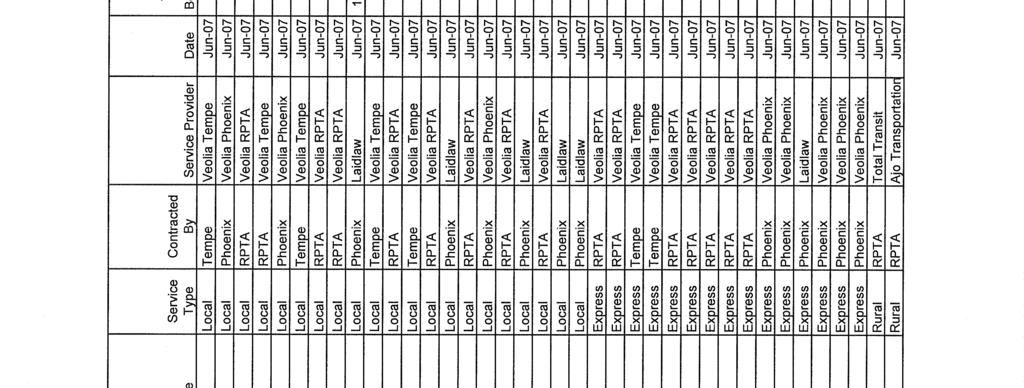
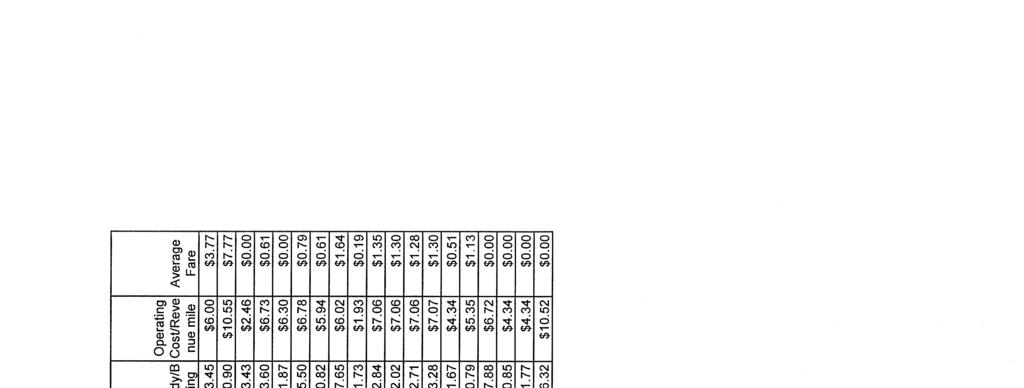
6 FIXED ROUTE BUS (SYSTEM-WIDE) Includes local, Express/BRT, shuttle/circulator and rural routes.
7 TRANSIT PERFORMANCE REPORT FY (JUNE 30, 2007) FIXED ROUTE BUS (SYSTEM-WIDE) The service categories and modes being measured in this interim report, and their accompanying criteria, are as follows: Subject Target Source of Target COST EFFICIENCY/EFFECTIVENESS Farebox Recovery Ratio 25% Regional Fare Policy recommendation approved by Board on September 20, Operating Cost per Boarding $2.34 Baseline from FY05-06 Fixed Route average* Subsidy per Boarding $1.76 Baseline from FY05-06 Fixed Route average* Operating Cost per Revenue Mile $5.00 Baseline from FY05-06 Fixed Route average* Average Fare $0.68 Five year timeframe starting in FY08* SERVICE EFFECTIVENESS Annual Increase in Total Boardings 3% Service Efficiency and Effectiveness Study - Board approved Annual Increase in Boardings, Weekday, Saturday, Sunday 3% Service Efficiency and Effectiveness Study - Board approved Avg. Boardings per Revenue Mile 2.1 Baseline from FY05-06 Fixed Route average* Detailed data supporting the charts on the following pages is available from the RPTA upon request. *Infl ated based on Consumer Price Index (CPI). 5
8 TRANSIT PERFORMANCE REPORT FY (JUNE 30, 2007) FIXED ROUTE BUS PERFORMANCE RESULTS (SYSTEM-WIDE) COST EFFICIENCY/EFFECTIVENESS Farebox Recovery Ratio Operating Cost per Boarding Target $ % 23.67% 24.24% Target 25% $2.23 $2.29 $2.62 The percentage of operating cost covered by fare revenue increased slightly from FY Fare revenue increased faster than operating cost in part because newer service continues to mature and schedules and routes were adjusted. Operating cost increased while boardings decreased slightly. Rising fuel costs and labor contributed to the increase in operating cost. Subsidy per Boarding Operating Cost per Revenue Mile $1.65 $1.75 $1.99 Target $1.76 $6.00 $4.71 $4.90 $5.28 Target $5.00 The net operating cost per boarding increased from last year and exceeds the target. Operating cost per revenue mile increased from last year and exceeds the target. Average Fare Target $0.68 $0.58 $0.54 $0.64 * FY 2005 was the last full year operated without the benefit of Proposition 400 funds. Fare revenue increased by $0.10 per boarding but fell slightly short of the target. 6
9 TRANSIT PERFORMANCE REPORT FY (JUNE 30, 2007) FIXED ROUTE BUS PERFORMANCE RESULTS (SYSTEM-WIDE) SERVICE EFFECTIVENESS Total Fixed Route Boardings (Includes shuttles/circulators) 59,070,596 Annual Increase/Decrease in Total Boardings Annual Increase/Decrease in Weekday Boardings 58,858,166 58,184,595 Target 3% Target 3% This includes local, express/brt, shuttle/circulator, and rural routes % Boardings decreased slightly from FY % The previous report measured total weekday boardings. Boardings on a typical weekday decreased slightly from the previous year. Annual Increase/Decrease in Saturday Boardings Annual Increase/Decrease in Sunday Boardings Boardings per Revenue Mile Target 2.1 Target 3% Target 3% -2.66% The previous report measured total Saturday boardings. Boardings on a typical Saturday decreased from the previous year % The previous report measured total Sunday boardings. Boardings on a typical Sunday decreased slightly from the previous year. Boardings per Revenue Mile decreased slightly. * FY 2005 was the last full year operated without the benefit of Proposition 400 funds. 7


10 PARATRANSIT
11 TRANSIT PERFORMANCE REPORT FY (JUNE 30, 2007) PARATRANSIT The service categories and modes being measured in this interim report, and their accompanying criteria, are as follows: Subject Target Source of Target COST EFFICIENCY/EFFECTIVENESS Farebox Recovery Ratio 5% Baseline from FY05-06 Dial-a-Ride system average* Operating Cost per Boarding $28.78 Baseline from FY05-06 Dial-a-Ride system average* Subsidy per Boarding $27.37 Baseline from FY05-06 Dial-a-Ride system average* Operating Cost per Revenue Hour $50.70 Baseline from FY05-06 Dial-a-Ride system average* SERVICE EFFECTIVENESS Annual Increase in Total Boardings 3% Service Efficiency and Effectiveness Study Boardings per Revenue Hour 1.76 Baseline from FY05-06 PMAS Dial-a-Ride system average* ADA On-time Performance 90% Service Efficiency and Effectiveness Study Detailed data supporting the charts on the following pages is available from the RPTA upon request. *Infl ated based on Consumer Price Index (CPI). 9
12 TRANSIT PERFORMANCE REPORT FY (JUNE 30, 2007) PARATRANSIT PERFORMANCE RESULTS COST EFFICIENCY/EFFECTIVENESS Farebox Recovery Ratio 4.81% Target 4.41% Operating Cost per Boarding $31.97 Target $28.78 This ratio decreased slightly from the previous year and still is below the target. Operating costs increased while boardings decreased. Subsidy per Boarding Operating Cost per Revenue Hour $30.56 Target $27.37 $55.46 Target $50.70 The net operating cost to transport each passenger increased from the previous year. The operating cost per revenue hour increased slightly from the previous year and was above the target. * FY 2005 was the last full year operated without the benefi t of Proposition 400 funds. 10
13 TRANSIT PERFORMANCE REPORT FY (JUNE 30, 2007) PARATRANSIT PERFORMANCE RESULTS SERVICE EFFECTIVENESS Annual Increase/Decrease in Total Boardings Boardings per Revenue Hour 6% 5% 4% 3% 2% 1% 1.73 Target % -1% -1.71% -2% Boardings per revenue hour decreased slightly and was slightly below the target Total boardings decreased by almost two percent. ADA On-Time Performance 93.5% 89.8% 95.39% The Americans with Disabilities Act (ADA) of 1990 is federal law which prohibits discrimination against persons with disabilities in many areas, including public transportation. On-time performance measures how many ADA boardings occurred within 30 minutes of the pick-up time given to the passenger at the time of their reservation. Performance exceeded the target by over 5 percent. * FY 2005 was the last full year operated without the benefi t of Proposition 400 funds. 11


14 VANPOOL
15 TRANSIT PERFORMANCE REPORT FY (JUNE 30, 2007) VANPOOL The service categories and modes being measured in this interim report, and their accompanying criteria, are as follows: Subject Target Source of Target COST EFFICIENCY/EFFECTIVENESS Farebox Recovery Ratio 100% Baseline from fiscal year PMAS Vanpool average* Operating Cost per Boarding $1.71 Baseline from fiscal year PMAS Vanpool average* Subsidy per Boarding $0 Baseline from fiscal year PMAS Vanpool average* Operating Cost per Revenue Mile $0.46 Baseline from fiscal year PMAS Vanpool average* Average Fare $1.85 Baseline from fiscal year PMAS Vanpool average* SERVICE EFFECTIVENESS Boardings per Revenue Mile.27 Baseline from fiscal year PMAS Vanpool average* Annual Increase in Total Boardings 0% Baseline from fiscal year PMAS Vanpool average* Number of new Vanpools started Regional Transportation Plan Detailed data supporting the charts on the following pages is available from the RPTA upon request. *Infl ated based on Consumer Price Index (CPI). 13
16 TRANSIT PERFORMANCE REPORT FY (JUNE 30, 2007) VANPOOL PERFORMANCE RESULTS COST EFFICIENCY/EFFECTIVENESS Farebox Recovery Ratio Operating Cost per Boarding % % % 115% $1.72 $1.70 $1.68 $1.70 Target $ % $ % % % % % $1.64 $1.62 $1.60 $1.66 $ % % Target 100% $1.58 Farebox recovery ratio increased from the previous year. That is, fare revenue exceeded operating cost at a greater percentage. Operating cost per boarding decreased compared to last reporting year and is below the target. Subsidy per Boarding Operating Cost per Revenue Mile $0.30 $0.20 $0.10 $0.00 Target $0.00 -$0.10 -$0.20 -$ $0.44 $0.46 $0.44 Target $0.46 Subsidy per boarding continues to decrease. This means that fare revenue exceeded operating cost. Operating cost per revenue mile decreased from the previous year and was below the target. Total Vanpool Boardings Net Vanpool Starts 1.5 million 1,418, million 1.3 million 1,270, million 1.1 million 1,025, million Vanpool boardings continued to increase Target 24 Fewer vanpools started than in the previous year and didn t make the target number. In FY 2006, a Start a vanpool and get one month free promotion was held. * FY 2005 was the last full year operated without the benefi t of Proposition 400 funds. 14


17 TRANSIT PERFORMANCE P REPORT R RT FY (JUNE J 30, 2007) SYSTEM SUMMARY Performance Indicator Fixed Route Paratransit Vanpool System Total Farebox Recovery 24.24% 4.41% 115% 22.20% Operating Cost per Boarding $2.62 $31.97 $1.63 $3.05 Subsidy per Boarding $1.998 $ $0.24 $2.37 Operating Cost per Revenue Mile $5.28 $0.44 $5.40 Average Fare $0.64 $1.41 $1.87 $0.68 Total Boardings 58,184, ,790 1,418,466 60,525,851 Boardings per Revenue Mile For questions or detailed data supporting this document, please call (602) and request the Transit Performance Report Support data. 15
18
19
20
21
22
23
24
25
26
27
28
29
30
31
32
33
34
35
36
37
38 PRELIMINARY DRAFT Efficiency and Effectiveness Performance Measures Targets--Board Approved June 2007 FIXED ROUTE BUS, SYSTEMWIDE TARGET ASSUMPTIONS Cost Efficiency/Effectiveness Farebox Recovery Ratio 25% Regional Fare Policy recommendation to Board Operating Cost per Boarding $2.32 Baseline from FY05-06 PMAS FR average Subsidy (Net Opg Cost) per Boarding $1.75 Baseline from FY05-06 PMAS FR average Cost per Revenue Mile $4.96 Baseline from FY05-06 PMAS FR average Average Fare $0.67 Five year timeframe starting in FY08 Service Effectiveness Total Boardings 3%* Matches 3% CPI increase; Subject to service increases Boardings Avg. Weekday, Sat., Sun. 3%* Matches 3% CPI increase; Subject to service increases Boardings per Revenue Mile 2.1 Baseline from FY05-06 PMAS FR average Safety Incidents per 100,000 Vehicle Miles 1.2 Baseline from FY05-06 PMAS FR average Security Incidents per "x" Boardings 0 Ultimate goal, 0 was achieved by RPTA Veolia for entire 2006 Complaints per "x" Boardings 28 Low end of current RPTA "C" range; meets Phoenix current complaints On-time Performance 90% Meets both RPTA and Phoenix current performance Miles between Mechanical Failures 23,400 Baseline from CY06 RPTA data (weighted average across fleets). Phoenix OK with target. Need to move to Miles between Mechanical Failures over time with next contract negotiations. Number will go down some, bcs there are more Mech. Failures than Roadcalls. Customer Satisfaction 89% Customer satisfaction index based on March survey - Combination of "very satisfied" and "somewhat satisfied" with overall service FIXED ROUTE BUS, ROUTE LEVEL TARGET ASSUMPTIONS Cost Efficiency/Effectiveness Farebox Recovery Ratio 25% Regional Fare Policy recommendation to Board Operating Cost per Boarding $2.32 Baseline from FY05-06 PMAS FR average Subsidy (Net Opg Cost) per Boarding $1.75 Baseline from FY05-06 PMAS FR average Cost per Revenue Mile $4.96 Baseline from FY05-06 PMAS FR average Service Effectiveness Total Boardings 3%* Matches 3% CPI increase; Subject to service increases Boardings Avg. Weekday, Sat., Sun. 3%* Matches 3% CPI increase; Subject to service increases Boardings per Revenue Mile 2.1 Baseline from FY05-06 PMAS FR average; peer average Boardings per Revenue Hour (Express Bus) TBD Challenge: Phoenix does not currently break out this data. On-time Performance 90% Meets both RPTA and Phoenix current performance Miles between Mechanical Failures 23,400 Baseline from CY06 RPTA data (weighted average across fleets). Need to move to Miles between Mechanical Failures over time with next contract negotiations. Number will go down some, bcs there are more Mech. Failures than Roadcalls. PARATRANSIT TARGET ASSUMPTIONS Cost Efficiency/Effectiveness Farebox Recovery Ratio 5% Baseline from FY05-06 PMAS DAR system average Operating Cost per Boarding $28.55 Baseline from FY05-06 PMAS DAR system average Subsidy (Net Opg Cost) per Boarding $27.16 Baseline from FY05-06 PMAS DAR system average Operating Cost per Revenue Hour $50.30 Baseline from FY05-06 PMAS DAR system average Average Fare TBD No goal currently. Set by each agency Service Effectiveness Total Boardings 3%* Matches 3% CPI increase; Subject to service increases Boardings Avg. Weekday, Sat., Sun. 3%* Matches 3% CPI increase; Subject to service increases Boardings per Revenue Hour 1.76 Baseline from FY05-06 PMAS DAR system average; close to low of peers Percent No Shows 5% Phoenix does not have a target for "no shows", but has seen 5.3% from July-Dec Paratransit consultant/rpta recommended 5%. The Glendale target is 10%. On-time Performance 90% Glendale target. Phoenix's performance standard is also 90% or above Miles between Mechanical Failures TBD Set by each agency (Phoenix tracks miles per 100,000 service miles) Customer Satisfaction 90% Glendale and Phoenix (Satisfied and Very Satisfied; every 2-5 yrs).
39 PRELIMINARY DRAFT RAIL TARGET ASSUMPTIONS Cost Efficiency/Effectiveness Farebox Recovery Ratio 25% Regional Fare Policy recommendation to Board Operating Cost per Boarding TBD To be provided in Spring, 2008 as part of VMR Budget process Subsidy (Net Opg Cost) per Boarding TBD To be provided in Spring, 2008 as part of VMR Budget process Cost per Revenue Mile TBD To be provided in Spring, 2008 as part of VMR Budget process Average Fare TBD To be provided in Spring, 2008 as part of VMR Budget process Service Effectiveness Total Boardings 7,827,000 FY 2010 Based on FTA formula for annualizing Avg. Weekday Boardings Boardings Avg. Weekday 26,090 Based on FFGA New Starts Boardings Avg. Sat. N/A Not available Boardings Avg. Weekday Sun./Holiday N/A Not available Boardings per Vehicle Revenue Mile 3.94 Rail. Based on 2,184,000 car miles in 2010 (Financial Plan). Boardings per Revenue Mile 8.04 Rail. Based on 1,071,000 car miles in 2010 (Financial Plan). Safety Incidents per 100,000 Vehicle Miles N/A To be provided in Spring, 2008 as part of VMR Budget process Security Incidents per "x" Boardings N/A To be provided in Spring, 2008 as part of VMR Budget process On-time Performance 95% Rail (Peer data is 98%) Miles between Failures 25,000 Rail (Peer data shows 35,000 with outliers excluded) Customer Satisfaction 89% Estimate index number based on bus targets Other Rail Measures in New Starts but not in RPTA Measures Framework Capital cost Annual vehicle miles Annual hours of service Frequency by route Operating days and hours Frequency and type of service affected by implementation of rail Aggregate level of service provided Capacity of service provided Transit service area Vehicle revenue miles required to operate service Vehicle revenue hours required to operate service Rail boardings by station New trips using New Start Ridership on tranist routes effected by the project Ridership on the transit system as a whole New riders on transit Systemwide fare revenue
Transit Performance Report FY (JUNE 30, 2007)
") Transit Performance Report FY 2006-2007 (JUNE 30, 2007) J ANUARY 2008 TRANSIT PERFORMANCE REPORT FY 2006 2007 (JUNE 30, 2007) Transit Performance Report I SSUED: JANUARY 2008 The Transit Performance Report
Transit Performance Report FY 2006-2007 (JUNE 30, 2007) J ANUARY 2008 TRANSIT PERFORMANCE REPORT FY 2006 2007 (JUNE 30, 2007) Transit Performance Report I SSUED: JANUARY 2008 The Transit Performance Report
Date: 11/6/15. Total Passengers
 Total San Diego Metropolitan Transit System POLICY 42 PERFORMANCE MONITORING REPORT Page 1 of 6 OBJECTIVE Develop a Customer-Focused and Competitive System The following measures of productivity and service
Att. A, AI 46, 11/9/17
 Total s San Diego Metropolitan Transit System POLICY 42 PERFORMANCE MONITORING REPORT Page 1 of 6 Date: 11/8/17 OBJECTIVE Develop a Customer-Focused and Competitive System The following measures of productivity
MONTHLY REPORT SEPTEMBER 2017
 MONTHLY REPORT 2017 SUN SHUTTLE RIDERSHIP ROUTE PASSENGERS: CURRENT YEAR PRIOR YEAR AMOUNT PERCENTAGE BUDGET AMOUNT PERCENTAGE TOTAL PASSENGERS 17,250 20,318 (3,068) -15.1% 18,231 (981) -5.4% CALENDAR
TRANSPORTATION SERVICE Actual
 PERFORMANCE REPORT-THIRD QUARTER VISION TO DELIVER REGIONAL MULTI-MODAL TRANSPORTATION SERVICES AND INFRASTRUCTURE IMPROVEMENTS THAT SIGNIFICANTLY AND CONTINUALLY INCREASE TRANSIT MARKET SHARE. MISSION
SUB-REGIONAL PERFORMANCE MEASURES
 SUB-REGIONAL PERFORMANCE MEASURES 29 REPORT Overall regional performance is a function of five major areas: Service Coverage - monitors both how much service is available to people in the region (in terms
Sound Transit Operations January 2018 Service Performance Report. Ridership
 January 218 Service Performance Report Ridership Total Boardings by Mode Jan-17 Jan-18 % YTD-17 YTD-18 % ST Express 1,3,33 1,7,91.3% 1,3,33 1,7,91.3% Sounder 367,33 416,8 13.3% 367,33 416,8 13.3% Tacoma
Sound Transit Operations March 2018 Service Performance Report. Ridership
 March 218 Service Performance Report Ridership Total Boardings by Mode Mar-17 Mar-18 % YTD-17 YTD-18 % ST Express 1,622,116 1,47,79-4.6% 4,499,798 4,428,14-1.6% Sounder 393,33 39,6.% 1,74,96 1,163,76 8.3%
September 2014 Prepared by the Department of Finance & Performance Management Sub-Regional Report PERFORMANCE MEASURES
 September 2014 Prepared by the Department of Finance & Performance Management 2013 Sub-Regional Report PERFORMANCE MEASURES REGIONAL PERFORMANCE MEASURES RTA staff has undertaken the development of a performance
MONTHLY OPERATIONS REPORT SEPTEMBER 2015
 MONTHLY OPERATIONS REPORT SEPTEMBER 215 Table of Contents SEPTEMBER 215 Section Page September Highlights... 3 Strategic Goals Progress Update... 4 Ridership... 6 Revenue... 9 Expenses... 1 System Summary...
Sound Transit Operations December 2014 Service Performance Report. Ridership
 Ridership Total Boardings by Mode Mode Dec-13 Dec-14 % YTD-13 YTD-14 % ST Express 1,266,130 1,396,787 10.3% 16,605,299 17,661,976 6.4% Sounder 248,710 285,016 14.6% 3,035,735 3,361,317 10.7% Tacoma Link
October REGIONAL ROUTE PERFORMANCE ANALYSIS
 October 2018 2017 REGIONAL ROUTE PERFORMANCE ANALYSIS The Council s mission is to foster efficient and economic growth for a prosperous metropolitan region Metropolitan Council Members Alene Tchourumoff
YOSEMITE AREA REGIONAL TRANSPORTATION SYSTEM
 YOSEMITE AREA REGIONAL TRANSPORTATION SYSTEM Short Range Transit Plan Prepared for the Merced County Association of Governments/YARTS Prepared by LSC Transportation Consultants, Inc. YOSEMITE AREA REGIONAL
Capital Metropolitan Transportation Authority. Monthly Performance Report
 Capital Metropolitan Transportation Authority Monthly Performance Report AUGUST 2010 Ridership Report August 23, 2010 Budget to Actual Ridership Budget Target: 2,290,590 Actual: 2,300,796 Ridership Comparison
MONTHLY OPERATIONS REPORT DECEMBER 2015
 MONTHLY OPERATIONS REPORT DECEMBER 215 Table of Contents DECEMBER 215 Section Page December Highlights... 3 Strategic Goals Progress Update... 4 Ridership... 6 Revenue... 9 Expenses... 1 System Summary...
PERFORMANCE REPORT DECEMBER 2017
 PERFORMANCE REPORT DECEMBER 2017 Note: New FY2018 Goal/Target/Min or Max incorporated in the Fixed Route and Connection Dashboards. Keith A. Clinkscale Performance Manager INTRODUCTION/BACKGROUND Keith
PERFORMANCE REPORT NOVEMBER 2017
 PERFORMANCE REPORT NOVEMBER 2017 Note: New FY2018 Goal/Target/Min or Max incorporated in the Fixed Route and Connection Dashboards. Keith A. Clinkscale Performance Manager INTRODUCTION/BACKGROUND In June
DRT Performance Measurement: the U.S. Experience
 DRT Performance Measurement: the U.S. Experience FOR ANYBODY GOING ANYWHER IN LA HABRA International Conference on Demand Responsive Transportation Breckenridge, Colorado September 2016 DRT Performance
Transit System Performance Update
 Clause 5 in Report No. 4 of Committee of the Whole was adopted, without amendment, by the Council of The Regional Municipality of York at its meeting held on March 29, 2018. 5 2017 Transit System Performance
Sound Transit Operations January 2014 Service Performance Report. Ridership
 Ridership Total Boardings by Mode Mode Jan-13 Jan-14 % YTD-13 YTD-14 % ST Express 1,343,290 1,426,928 6.2% 1,343,290 1,426,928 6.2% Sounder 245,135 256,775 4.7% 245,135 256,775 4.7% Tacoma Link 86,229
Sound Transit Operations June 2016 Service Performance Report. Ridership
 Ridership Total Boardings by Mode Mode Jun-15 Jun-16 % YTD-15 YTD-16 % ST Express 1,622,222 1,617,420-0.3% 9,159,934 9,228,211 0.7% Sounder 323,747 361,919 11.8% 1,843,914 2,099,824 13.9% Tacoma Link 75,396
SAMTRANS TITLE VI STANDARDS AND POLICIES
 SAMTRANS TITLE VI STANDARDS AND POLICIES Adopted March 13, 2013 Federal Title VI requirements of the Civil Rights Act of 1964 were recently updated by the Federal Transit Administration (FTA) and now require
Sound Transit Operations January 2017 Service Performance Report. Ridership. Total Boardings by Mode
 January 217 Service Performance Report Ridership ST Express Sounder Tacoma Link Link Paratransit Jan-16 Jan-17 % 1,433,7 1,3,33 4.9% 331,27 7,121 98,411 3,633 Total Boardings by Mode 363,6 74,823 1,76,914
Bristol Virginia Transit
 Bristol Virginia Transit 1 Transit Overview Bristol Virginia Transit (BVT) is a Federally Funded and certified urban area transit system. BVT began operation in its current form in 1982. In Fiscal Year
Sound Transit Operations March 2017 Service Performance Report. Ridership. Total Boardings by Mode
 March 217 Service Performance Report Ridership ST Express Sounder Tacoma Link Link Paratransit Mar-16 Mar-17 % 1,83,4 1,621,49 2.4% 37,496 82,631 1,264,47 3,821 Total Boardings by Mode 389,98 87,39 1,89,43,297
Sound Transit Operations August 2015 Service Performance Report. Ridership
 Ridership Total Boardings by Mode Mode Aug-14 Aug-15 % YTD-14 YTD-15 % ST Express 1,534,241 1,553,492 1.3% 11,742,839 12,354,957 5.2% Sounder 275,403 326,015 18.4% 2,139,086 2,463,422 15.2% Tacoma Link
With the completion of this project, we would like to follow-up on the projections as well as highlight a few other items:
 TO: FROM: Mayor and Council Interim City Manager Rebecca Underhill, Director of Finance DATE: February 28, 2014 SUBJECT: Water Meter Project Analysis On March 28, 2012, Acting City Manager Mike Loftin
Sound Transit Operations February 2018 Service Performance Report. Ridership
 February 218 Service Performance Report Ridership Total Boardings by Mode Feb-17 Feb-18 % YTD-17 YTD-18 % ST Express 1,373,96 1,372,88 -.1% 2,877,294 2,88,719.1% Sounder 314,96 32,187 11.9% 681,923 768,69
Chapter 3. Burke & Company
 Chapter 3 Burke & Company 3. WRTA RIDERSHIP AND RIDERSHIP TRENDS 3.1 Service Overview The Worcester Regional Transit Authority (WRTA) provides transit service to over half a million people. The service
About This Report GAUGE INDICATOR. Red. Orange. Green. Gold
 ATTACHMENT A About This Report The Orange County Transportation Authority (OCTA) operates a countywide network of local, community, rail connector, and express bus routes serving over 6, bus stops. OCTA
Board Box. February Item # Item Staff Page 1. Key Performance Indicators M. Thompson Financial Report for Dec H.
 Board Box February 2016 Item # Item Staff Page 1. Key Performance Indicators M. Thompson 2-8 2. Financial Report for Dec. 2015 H. Rodriguez 9-13 ITEM 1 February 15, 2016 TO: FROM: RE: BOARD OF DIRECTORS
PERFORMANCE REPORT DECEMBER Performance Management Office
 PERFORMANCE REPORT DECEMBER 2018 Performance Management Office INTRODUCTION/BACKGROUND Performance Management Office FIXED ROUTE DASHBOARD FY 2019 Safety Max Target Goal Preventable Collisions per 100k
Operational Performance
 Customer Services, Operations, and Safety Committee Board Action/Information Item III-A January 10, 2008 Operational Washington Metropolitan Area Transportation Authority Board Action/Information Summary
FY Transit Needs Assessment. Ventura County Transportation Commission
 FY 18-19 Transit Needs Assessment Ventura County Transportation Commission Contents List of Figures and Appendices.. 2 Appendices... 1 Chapter 1: Introduction What is the Ventura County Transportation
METROBUS SERVICE GUIDELINES
 METROBUS SERVICE GUIDELINES In the late 1990's when stabilization of bus service was accomplished between WMATA and the local jurisdictional bus systems, the need for service planning processes and procedures
RACINE COUNTY PUBLIC TRANSIT PLAN:
 RACINE COUNTY PUBLIC TRANSIT PLAN: 2013-2017 Recommended Transit Service Improvement Plan NEWSLETTER 3 SEPTEMBER 2013 This newsletter describes the final recommended public transit plan for the City of
TTI REVIEW OF FARE POLICY: PRELIMINARY FINDINGS
 TTI REVIEW OF FARE POLICY: PRELIMINARY FINDINGS December 2014 STATUS: TTI REVIEW OF FARE POLICY Goal: Identify and evaluate different options for a revised fare structure, including pricing strategies
ATTACHMENT A.7. Transit Division Performance Measurements Report Fiscal Year Fourth Quarter
 TTCHMENT.7 Transit Division Performance Measurements Report Fiscal Year 2012-13 Fourth Quarter Introduction The Orange County Transportation uthority (OCT) operates a countywide network of local, community,
Bus Operations Report
 Third Quarter FY 216 (January 1 - March 31, 216) Wednesday April 27, 216 Operations Ridership: 783,194 passengers used in the third quarter. This represents a 2% increase over the same period in FY 215.
Matt Miller, Planning Manager Margaret Heath-Schoep, Paratransit & Special Projects Manager
 DATE May 2, 218 Item #12 TO FROM GCTD Board of Directors Matt Miller, Planning Manager Margaret Heath-Schoep, Paratransit & Special Projects Manager MS SUBJECT I. EXECUTIVE SUMMARY This quarterly report
Fiscal Management and Control Board. Fare Policy October 16, Draft for Discussion & Policy Purposes Only
 Fiscal Management and Control Board Fare Policy October 16, 2015 1 Components of Fares Fare Level Different types of pricing by: By mode By time of day By distance By rider type (reduced fare) Subscription
MERRIMACK VALLEY REGIONAL TRANSIT AUTHORITY (MVRTA) PERFORMANCE MEASURES: FIXED ROUTE
 PERFORMANCE MEASURES: FIXED ROUTE") PERFORMANCE MEASURES: FIXED ROUTE IT IS OUR GOAL TO IMPROVE FIXED ROUTE SERVICE ON ALL LEVELS, ON A CONTINUOUS BASIS. IN ORDER TO DO THIS, WE HAVE ESTABLISHED BENCHMARKS TO MEASURE PERFORMANCE. THIS INFORMATION
PERFORMANCE MEASURES: FIXED ROUTE IT IS OUR GOAL TO IMPROVE FIXED ROUTE SERVICE ON ALL LEVELS, ON A CONTINUOUS BASIS. IN ORDER TO DO THIS, WE HAVE ESTABLISHED BENCHMARKS TO MEASURE PERFORMANCE. THIS INFORMATION
APPENDIX B COMMUTER BUS FAREBOX POLICY PEER REVIEW
 APPENDIX B COMMUTER BUS FAREBOX POLICY PEER REVIEW APPENDIX B COMMUTER BUS FAREBOX POLICY PEER REVIEW The following pages are excerpts from a DRAFT-version Fare Analysis report conducted by Nelson\Nygaard
MONTHLY REPORT JUNE 2017
 & MONTHLY REPORT JUNE 2017 SECTION Sun Tran & Sun Van Monthly Operations Report Table of Contents June 2017 PAGE I.System Highlights and Accomplishments 3-10 II.Sun Tran a.ridership 11 b.revenue 12 c.pass
APPENDIX B. Arlington Transit Peer Review Technical Memorandum
 APPENDIX B Arlington Transit Peer Review Technical Memorandum Arlington County Appendix B December 2010 Table of Contents 1.0 OVERVIEW OF PEER ANALYSIS PROCESS... 2 1.1 National Transit Database...2 1.2
Mobile Farebox Repair Program: Setting Standards & Maximizing Regained Revenue
 Mobile Farebox Repair Program: Setting Standards & Maximizing Regained Revenue Michael J. Walk, Chief Performance Officer Larry Jackson, Directory of Treasury Maryland Transit Administration March 2012
PTN-128 Reporting Manual Data Collection and Performance Reporting
 2016 PTN-128 Reporting Manual Data Collection and Performance Reporting Sponsored by the Texas Department of Transportation Table of Contents PTN-128 WHAT, WHY AND WHO... 6 What is the PTN-128... 13 Why
MONTHLY REPORT SEPTEMBER 2017
 & MONTHLY REPORT SEPTEMBER 2017 SECTION Sun Tran & Sun Van Monthly Operations Report Table of Contents September 2017 PAGE I.System Highlights and Accomplishments 3-10 II.Sun Tran a.ridership 11 b.revenue
VCTC Transit Ridership and Performance Measures Quarterly Report
 VCTC Transit Ridership and Performance Measures Quarterly Report Overview Quarter 2 Fiscal Year 2018-2019 This report provides performance measures for VCTC Intercity Bus Service covering the FY 2018-19
Service Performance 2013 Networked Family of Services
 Service Performance 2013 Networked Family of Services Overview RTD s Mission is: "To meet our constituents' present and future public transit needs by offering safe, clean, reliable, courteous, accessible
Existing Services, Ridership, and Standards Report. June 2018
 Existing Services, Ridership, and Standards Report June 2018 Prepared for: Prepared by: Contents Overview of Existing Conditions... 1 Fixed Route Service... 1 Mobility Bus... 34 Market Analysis... 41 Identification/Description
1 DEMAND RESPONSE OVERVIEW
 1 DEMAND RESPONSE OVERVIEW Forty-nine transit agencies in Ohio operate demand response service, not including demand response services operated as part of the transit service provided in conjunction with
Ozaukee County Transit Development Plan
 Ozaukee County Transit Development Plan Record of Public Comments and Recommended Transit Service Plan June 5, 2018 Kevin Muhs Deputy Director #242846 Status of the Transit Development Plan Existing Conditions
MONTHLY REPORT MAY 2017
 & MONTHLY REPORT MAY 2017 SECTION Sun Tran & Sun Van Monthly Operations Report Table of Contents May 2017 PAGE I.System Highlights and Accomplishments 3-10 II.Sun Tran a.ridership 11 b.revenue 12 c.pass
ESCAMBIA COUNTY AREA TRANSIT MTAC REPORT
 ESCAMBIA COUNTY AREA TRANSIT MTAC REPORT November 8, 2017 Meeting Escambia County Area Transit 1515 W. Fairfield Drive Pensacola, FL 32501 850-595-3228 INTRODUCTION 2 Summary Background MTAC ECAT Benchmarks
December 2018 Monthly Performance Report
 Date: January 16, 2019 To: From: Subject: General Manager Board of Directors Timothy Kea Budget & Grants Department December 2018 Monthly Performance Report The monthly systemwide ridership decreased 1.4%
* Data for prior months has been updated to reflect error corrections from missing passenger count data
 LANE TRANSIT DISTRICT September 2016 Performance Report * 29-November-2016 Prior Performance Current Year's % Current Previous % Current Prior % Measure Month Month Change Y-T-D Y-T-D Change 12 Month 12
January 2019 Monthly Performance Report
 Date: February 19, 2019 To: From: Subject: General Manager Board of Directors Timothy Kea Budget & Grants Department January 2019 Monthly Performance Report The monthly systemwide ridership decreased 0.5%
Regional Fare Change Overview. Nick Eull Senior Manager of Revenue Operations Metro Transit
 Regional Fare Change Overview Nick Eull Senior Manager of Revenue Operations Metro Transit Committee of the Whole April 5 th, 2017 Today s Presentation Fare change goals and considerations Public engagement
Fixed-Route Operational and Financial Review
 Chapter II CHAPTER II Fixed-Route Operational and Financial Review Chapter II presents an overview of route operations and financial information for KeyLine Transit. This information will be used to develop
Establishes a fare structure for Tacoma Link light rail, to be implemented in September 2014.
 RESOLUTION NO. R2013-24 Establish a Fare Structure and Fare Level for Tacoma Link MEETING: DATE: TYPE OF ACTION: STAFF CONTACT: PHONE: Board 09/26/2013 Final Action Ric Ilgenfritz, Executive Director,
Greater Portland Transit District
 Greater Portland Transit District TO: FROM: Freeport Town Council Greg Jordan - Metro General Manager DATE: September 10, 2014 SUBJECT: Metro Request to Pursue Grant Funding for Trial Express Bus Service
Quarterly Report Transit Bureau, Local Transit Operations. First Quarter, Fiscal Year 2015 (July 2014 September 2014) ART & STAR
 ART & STAR") Quarterly Report Transit Bureau, Local Transit Operations First Quarter, Fiscal Year 2015 (July 2014 September 2014) ART & STAR A Arlington Transit ART 1) Introduction The purpose of ART is to provide
Quarterly Report Transit Bureau, Local Transit Operations First Quarter, Fiscal Year 2015 (July 2014 September 2014) ART & STAR A Arlington Transit ART 1) Introduction The purpose of ART is to provide
Scorecard Key Performance Indicators
 Scorecard Key Performance Indicators 1 st Quarter 2013 NICE Bus Fixed Route NICE Bus Fixed Route Definitions Scheduled Revenue Hours Full Trip Revenue Hours Lost Runs Missed Revenue Hours Lost Actual Hours
Proposition E: Municipal Transportation Quality Review
 Proposition E: Municipal Transportation Quality Review July 1, 2006 June 30, 2008 FINAL REPORT Nelson Nygaard c o n s u l t i n g a s s o c i a t e s Table of Contents Introduction... 1 Summary... 1 Background...
Performance Measurement:
 Regional Transportation Authority Performance Measurement: Peer Reporting Transport Chicago June 7, 2013 1 RTA Performance Measurement Program 2008 RTA Act amendment Purpose: Transparency & accountability
RTA ScoreCard December 2009
 Background and Context RTA ScoreCard December 2009 Chapter 25 of the Acts of 2009 modernized the transportation systems of the Commonwealth and created the new MassDOT. Section 6 of this law established
Transport Indicators Report June 2018
 Transport Indicators Report June 2018 Board Meeting 21 August 2018 Recommendation That the Board: i. Receives this report. Executive summary 1. The attached Monthly and Quarterly Indicator Reports provide
SAMTRANS SERVICE PLAN
 Agenda Overview Part I: Key Findings Market Assessment Service Evaluation Part II: Service Development Framework Metrics Criteria Part III: Next Steps SAMTRANS SERVICE PLAN Preliminary Analysis and Criteria
SRTA Year End Fixed Route Ridership Analysis: FY 2018
 SRTA Year End Fixed Route Ridership Analysis: FY 2018 2018 Contents Introduction... 1 A. Key Terms Used in this Report... 1 Key Findings... 2 A. Ridership... 2 B. Fare Payment... 4 Performance Analysis
MONTHLY REPORT AUGUST 2017
 & MONTHLY REPORT AUGUST SECTION Sun Tran & Sun Van Monthly Operations Report Table of Contents August PAGE I.System Highlights and Accomplishments 3-10 II.Sun Tran a.ridership 11 b.revenue 12 c.pass Sales
Why we re here: For educational purposes only
 Transportation 2050 Why we re here: For educational purposes only Transportation 2050 Bus Elements PUBLIC TRANSIT DEPARTMENT City of Phoenix Citizens Committee on the Future of Phoenix Transportation (CCFPT)
FIXED ROUTE DASHBOARD JULY 2018
 FIXED ROUTE DASHBOARD JULY 2018 Safety Max Target Goal Preventable Collisions per 100k Miles Non-Preventable Collisions per 100k Miles Total Incidents per 10,000 Boardings 1.6 1.3 0.8 2.63 2.1 2.0 1.60
Maryland Department of Transportation The Secretary's Office
 December 13, 2013 Maryland Department of Transportation The Secretary's Office Martin O'Malley Govemor Anthony G. Brown Lt. Govemor James T. Smith, Jr. Secretary The Honorable Edward J. Kasemeyer Chair,
Administrative Operations Report
 Fiscal Year 2017/18 Administrative Operations Report November 1, 2018 Prepared by: El Dorado County Transit Authority 6565 Commerce Way Diamond Springs, CA 95619 (530) 642-5383 www.eldoradotransit.com
PERFORMANCE REPORT JANUARY Keith A. Clinkscale Performance Manager
 PERFORMANCE REPORT JANUARY 2018 Keith A. Clinkscale Performance Manager INTRODUCTION/BACKGROUND Keith A. Clinkscale Performance Manager FIXED ROUTE DASHBOARD JANUARY 2018 Safety Max Target Goal Preventable
COUNCIL AGENDA REPORT
 COUNCIL AGENDA REPORT Meeting Date: 6 June 2016 Subject: Boards Routed Through: 2017 Airdrie Transit s Community Services Advisory Board Date: 9 May 2016 Issue: Council is being asked to endorse the 2017
YRT/VIVA PROPOSED FARE INCREASE
 Report No. 7 of the Transportation Services Committee Regional Council Meeting of September 22, 1 2012 YRT/VIVA PROPOSED FARE INCREASE The Transportation Services Committee recommends: 1. Receipt of the
Service Performance 2010 Networked Family of Services
 Service Performance 2010 Networked Family of Services Overview RTD s Mission is: "To meet our constituents' present and future public transit needs by offering safe, clean, reliable, courteous, accessible
EL PASO COUNTY REGIONAL TRANSIT INSTITUTIONAL OPTIONS ASSESSMENT STUDY
 EL PASO COUNTY REGIONAL TRANSIT INSTITUTIONAL OPTIONS ASSESSMENT STUDY Sponsored by: El Paso County Funding Support: Texas Department of Transportation Technical Assistance to the County: Texas A&M Transportation
Capital Metropolitan Transportation Authority. Monthly Performance Report
 Capital Metropolitan Transportation Authority Monthly Performance Report SEPTEMBER 2010 Ridership Report Budget to Actual Ridership Budget Target: 2,335,906 Actual: 2,291,235 Ridership Comparison Fiscal
CURRENT SHORT-RANGE TRANSIT PLANNING PRACTICE. 1. SRTP -- Definition & Introduction 2. Measures and Standards
 CURRENT SHORT-RANGE TRANSIT PLANNING PRACTICE Outline 1. SRTP -- Definition & Introduction 2. Measures and Standards 3. Current Practice in SRTP & Critique 1 Public Transport Planning A. Long Range (>
Follow-up to Proposed Fare Changes for FY2013
 Finance & Administration Committee Information Item I-A January 19, 2012 Follow-up to Proposed Fare Changes for FY2013 1 of 22 Washington Metropolitan Area Transit Authority Board Action/Information Summary
Current Operations CHAPTER II INTRODUCTION DESCRIPTION OF TRANSPORTATION SERVICES
 Chapter II CHAPTER II Current Operations INTRODUCTION This chapter provides an overview of Centre Area Transportation Authority (CATA). CATA is a joint municipal authority formed under the Municipal Authorities
Board Box. October Item # Item Staff Page 1. Key Performance Indicators Sep 2018 M. Mungia Financial Report Aug 2018 H.
 Board Box October 2018 Item # Item Staff Page 1. Key Performance Indicators Sep 2018 M. Mungia 2-10 2. Financial Report Aug 2018 H. Rodriguez 11-15 ITEM 1 October 31, 2018 TO: FROM: RE: BOARD OF DIRECTORS
Service Cost Estimate for Route 10 only
 2009-2011 Service Cost Estimate for Route 10 only The City of Ashland buys down the fare on Route 10 for each passenger riding in Ashland, therefore service cost estimates are based on recent ridership
Analysis of Transit Fare Evasion in the Rose Quarter
 Analysis of Transit Fare Evasion in the Rose Quarter Shimon A. Israel James G. Strathman February 2002 Center for Urban Studies College of Urban and Public Affairs Portland State University Portland, OR
Executive Summary. Introduction. Community Assessment
 Executive Summary Introduction The Red Rose Transit Authority (RRTA) Transit Development Plan provides an evaluation of existing RRTA fixed route services, with the outcome being practical recommendations
Rides Mass Transit District. Jackson County Mass Transit District. FY 2020 Program of Projects (POP) Carbondale UZA
 Carbondale UZA") Rides Mass Transit District Jackson County Mass Transit District FY 2020 Program of Projects (POP) Carbondale UZA General Rides Mass Transit District (RMTD) is the public transportation provider for the
Rides Mass Transit District Jackson County Mass Transit District FY 2020 Program of Projects (POP) Carbondale UZA General Rides Mass Transit District (RMTD) is the public transportation provider for the
AIRPORT FUND. Description. Summary
 Description In March 1941 construction started for the airport at its present site. After Pearl Harbor, the airport, known as Pinellas Army Airfield, was used as a military flight-training base. After
METRO OPERATIONS COMMITTEE
 Los Angeles County Metropolitan Transportation Authority Item 1 CHIEF OPERATIONS OFFICER S S REPORT METRO OPERATIONS COMMITTEE Lonnie Mitchell Chief Operations Officer May 19, 20 1 Employee Recognition
Auckland Transport Quarterly Indicators Report 2018/19
 Attachment 1 Auckland Transport ly Indicators Report 218/19 September 218 Table of Contents Page 2. 1. Executive summary 2. External indicators 3. Performance by Key Priority 3.1 Deliver an efficient and
Washington Metropolitan Area Transit Authority Services Utilization Study
 Washington Metropolitan Area Transit Authority Services Utilization Study Maryland House Bill 300 Table of Contents Page 2 Executive Summary Slide 3 Notes Slide 4 Metro Systemwide Fact Sheet Slide 5 How
EXHIBIT K TERMINAL PROJECT PROCEDURES PHASE I - DEVELOPMENT OF TERMINAL PROGRAM & ALTERNATIVES
 EXHIBIT K TERMINAL PROJECT PROCEDURES PHASE I - DEVELOPMENT OF TERMINAL PROGRAM & ALTERNATIVES Over the term of the Master Amendment to the Airline Use and Lease Agreement, the Kansas City Aviation Department
Peer Performance Measurement February 2019 Prepared by the Division of Planning & Market Development
 2017 Sub-Regional Peer Review Peer Performance Measurement February 2019 Prepared by the Division of Planning & Market Development CONTENTS EXECUTIVE SUMMARY... 3 NOTES/METHODOLOGY... 6 AGENCIES... 7
Service Performance 2012 Networked Family of Services
 Service Performance 2012 Networked Family of Services Overview RTD s Mission is: "To meet our constituents' present and future public transit needs by offering safe, clean, reliable, courteous, accessible
Demand-Responsive Transportation in the TCQSM
 Demand-Responsive Transportation in the TCQSM Buffy Ellis KFH Group, Inc. Presentation Overview Brief introduction to the project DRT in the TCQSM, 1st Edition DRT in the TCQSM, 2nd Edition Key Issues
STA MOVING FORWARD A plan for more and better transit services
 A plan for more and better transit services A DRAFT PLAN FOR IMPLEMENTATION July, 17, 2014 More options. More often. Better transit. Contents Introduction...3 The Future...4 The Plan...5 High Performance
Title VI Service Equity Analysis
 Pierce Transit Title VI Service Equity Analysis Pursuant to FTA Circular 4702.1B NE Tacoma Service May 2016 Pierce Transit Transit Development Dept. PIERCE TRANSIT TITLE VI SERVICE EQUITY ANALYSIS TABLE
FY Year End Performance Report
 Overall Ridership Big Blue Bus carried 18,748,869 passengers in FY2014-2015, a 0.3% reduction from the year prior. This negligible reduction in ridership represents the beginnings of a reversal from a