Draft Transportation System Existing Conditions. System Group Recommendations
|
|
|
- Shannon Carroll
- 5 years ago
- Views:
Transcription
1 Draft Transportation System Existing Conditions System Group Recommendations April 2014
2
3 TABLE OF CONTENTS EXISTING CONDITIONS... 1 SYSTEM INTRODUCTION... 1 REGIONAL TRAVEL PATTERNS... 4 ROADWAY NETWORK... 7 BICYCLING MOBILITY AND REALIBILITY TRANSIT SERVICE PARKING COMMENTS RECEIVED AT FIRST GROUP MEETING DATA REQUESTS THAT COULD NOT BE FILLED LIST OF TABLES TABLE 1. Journey to Work Commutes... 4 TABLE 2. What Type(s) Of Ground Transportation Are You Using This Trip While In Utah?... 6 TABLE 3. How Did You Get To The Ski Area Today?... 6 LIST OF FIGURES FIGURE 1. Existing Transportation System... 2 FIGURE 2. Existing Daily Origin-Destination Pairs... 5 FIGURE 3. Existing Weekday and Weekend Congestion... 9 FIGURE 4. February Average Daily Traffic ( ) FIGURE 5. July Average Daily Traffic ( ) FIGURE 6. Cottonwood Canyons Change in Vehicles per Day (February) ( ) i
4 FIGURE 7. Cottonwood Canyons Change in Vehicles per Day (July) ( ) 11 FIGURE 8. Summit County Change in Vehicles per Day (February) ( )12 FIGURE 9. Summit County Change in Vehicles per Day (July) ( ) FIGURE 10. Cottonwood Canyons Average Daily Traffic ( ) FIGURE 11. Summit County Average Daily Traffic ( ) FIGURE 12. Little Cottonwood February Traffic (2013) FIGURE 13. Big Cottonwood Canyon February Traffic (2013) FIGURE 14. SR-224 (Kimball Junction to Park City) February Traffic (2013) FIGURE 15. SR-248 (SR-40 to Park City) February Traffic (2013) FIGURE 16. Little Cottonwood July Traffic (2013) FIGURE 17. Big Cottonwood Canyon July Traffic (2013) FIGURE 18. SR-224 (Kimball Junction to Park City) July Traffic (2013) FIGURE 19. SR-248 (SR-40 to Park City) July Traffic (2013) FIGURE 20. Congestion on Wasatch Boulevard between the Two Cottonwood Canyons FIGURE 21. Safety Index Crash Rate Ratio FIGURE 22. Red Snake in Little Cottonwood Canyon FIGURE 23. Congestion in Big Cottonwood Canyon FIGURE 24. Annual Public Transit Ridership (2013) FIGURE 25. Ski Bus Loading FIGURE 26. Park City Ridership Counts (2012) FIGURE 27. Winter On-Street Parking in Big Cottonwood Canyon FIGURE 28. Winter On-Street Parking in Little Cottonwood Canyon ii
5 EXISTING CONDITIONS This report summarizes the best available information on existing conditions for the Central Wasatch Transportation System, intended to succinctly inform the Mountain Accord process. This report references other detailed information and analyses, but is not meant to be a comprehensive description of all that is known about the Transportation System. It is meant to concisely present available information about the Transportation System that is most relevant to the intent of Mountain Accord. Together with the Future Trendline information, the Existing Conditions information will help identify the key needs and opportunities for this system, inform the development of a Vision, goals and metrics, and establish a baseline against which to compare options for a future Idealized System. If later steps in the process identify the need for additional information on existing conditions, that information can be added at that time. SYSTEM INTRODUCTION The transportation system relevant to the study area is composed of several main roadways, including interstate routes, a range of transit services from commuter and light rail to local bus, and parking facilities in canyons and at major resorts. These components combine to accommodate regional travel patterns that involve not only daily work and household trips but also tourist and recreational trips to and from the Wasatch Mountains. This document describes the health of the transportation system in terms of its roadways, transit routes, and parking areas; it also addresses how safety issues such as avalanche hazards affect travel patterns. Figure 1 shows the existing transportation system. 1

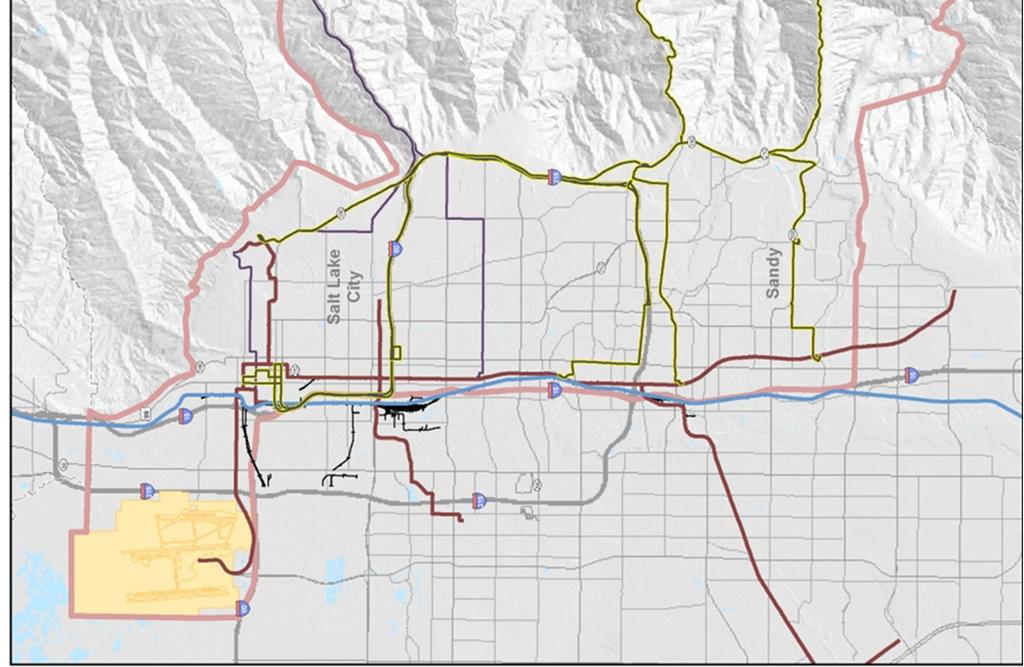
6 Figure 1. Existing Transportation System 2
7 SUMMARY OF TRANSPORTATION SYSTEM EXISTING CONDITIONS A major issue throughout the transportation system, but primarily in the Cottonwood Canyons, is the unreliability of the system, especially in the winter months. The freeway network generally operates well, although I-15 experiences consistent peak-hour delays. I-80 in Parley s Canyon functions well, although truck traffic can create issues such as delays and safety. The arterial network along, to, and within the Wasatch has various performance attributes: Weekday, commuter traffic is high at the Cottonwood Heights/I-215 area. The east/west corridors of 9000 South and 7200 South also experience peak-hour congestion. Foothill Boulevard in Salt Lake City has weekday morning and evening congestion due to the University of Utah and associated health facilities at the north end of the corridor. Kimball Junction in Summit County experiences more consistent congestion as a result of both resort traffic and increased background traffic due to extensive commercial, retail, housing, and office development. Weekend, recreational congestion tends to be high due to peak resort demand at or along all four entryways to the Wasatch: Kearns Boulevard (SR-248), SR-224, Big Cottonwood Canyon Road (SR-190), and Little Cottonwood Canyon Road (SR-210). The transit system is provided through multiple providers, predominately by UTA and Park City Transit. UTA operates an extensive network of bus and rail throughout the Wasatch Front, with an express bus service to Park City and seasonal (winter) bus routes up the Cottonwood Canyons. Park City Transit operates a free, year-round bus service throughout Snyderville Basin and Park City with service to mountain resorts. Seasonal and private shuttles are also available. Parking is provided at lots at major trailheads, ski resorts, park-and-ride lots at the base of the canyons and west of US-40, and along roadsides. In the Cottonwood Canyons, parking is at or near capacity on peak winter days (15-20 days per year). Parking is also a problem near recreation access points during peak summer periods. Parking in Park City and near the mountains can be scarce during the ski season, while park-and-ride lots in Summit County generally have available capacity. The Cottonwood Canyons have only one emergency ingress/egress route, which can inhibit access, especially in winter. Avalanches in the Cottonwood Canyons pose a serious threat to safety. An average of 33 avalanches per year may affect SR-210. Road conditions and driver behavior in Big Cottonwood Canyon contribute to SR-190 having one of the highest crash rates in the state. I-80 in Parley s Canyon and SR-210 also have higher than average crash rates. 3
8 REGIONAL TRAVEL PATTERNS Population in the Salt Lake Valley and Wasatch Back is increasing and, as such, travel demand will increase. According to Utah s Unified Transportation Plan, the 2010 population of Utah was 2.7 million and by 2040 the population is expected to reach over 5 million. In-migration contributes to growth (in addition to natural increase) due to Utah s quality of life and strong economy. From 2005 to 2009, 40 percent of Utah s population growth was due to net in-migration and 60 percent was due to natural increase. Between 1990 and 2010, travel in Utah grew by 78 percent, and population grew by 61 percent. During that same period, mileage on roads only increased 6 percent (source: Utah s Unified Transportation Plan). Nearly 85 percent of Utah s population lives in urban areas. Due to these trends, congestion will be growing in the Salt Lake Valley, as well as in the Cottonwood Canyons and the Wasatch Back in the future. There is a clear demand for travel between areas of the Wasatch Front and the Wasatch Back. Although most residents in the Wasatch Front and Back stay within their respective counties to work, there are notable shares of commuters between certain counties, as indicated in Table 1. Table 1. Journey to Work Commutes Home County Destination County Salt Lake Summit Wasatch Salt Lake 94.22% 0.64% 0.06% Summit 30.86% 63.64% 0.86% Wasatch 12.75% 23.33% 54.01% Source: Census for Transportation Planning Package Journey to Work Data, USTM. The Mountain Transportation Study (2012) estimated travel demand between the Summit County (Park City) and Salt Lake County as 30,000 to 40,000 person-trips per day, and travel data collected as part of the Utah Household Travel Survey suggests the inter-county person travel to be even higher. While Table 1 showed the intra- and inter-county flows for commute trips, Figure 2, Existing Daily Origin-Destination Pairs, shows where trips start and end in each county, this includes work and recreation trips. Note that Figure 2 only shows trips between areas, and not trips that start and end within the same area (such as Salt Lake County to Salt Lake County). The wider the line connecting each county pair, the greater the number of trips between counties. As shown in Figure 2, most travel to and from the Cottonwood Canyons is from Salt Lake County, with relatively few trips from Summit County. There is also a comparatively large amount of travel between Summit and Salt Lake Counties. 4

9 Source: Mountain Accord Model Development. Figure 2. Existing Daily Origin-Destination Pairs Regional travel patterns influential to this project include travel to and from recreation destinations. According to skier surveys from the winter season, the majority of out-of-state visitors travelled to Utah via air, with travelling by air as the mode for 81% of those skiing in the Cottonwood Canyons and 92% of those skiing in Summit County. The remainder of out-of-state visitors going to the Cottonwood Canyons arrived by private vehicle. In Summit County, 6% came by private vehicle, 1% by rental vehicle, and 1% by some other means. Table 2 shows survey data on what type of ground transportation out-of-town visitors to ski areas used visiting in Utah, not necessarily how they got to the ski resort (shown in Table 3). This information provides insight to the range of modes visitors use. Private and rental vehicles were overwhelmingly used more than other modes in both the Wasatch Front and Back. Public transit and private shuttles were the next highest modes, with visitors to Summit County having higher shares of both modes. Table 3 shows how visitors arrived at the ski area on the day they went skiing or snowboarding. Private and rental vehicles continue to be the dominant mode of transportation, with only 5% traveling by public bus. Also notable is the high number of visitors that stay near the ski area to facilitate ski-in/ski-out/walking. This information provides insights into the types of transportation solutions that could be used by ski area visitors. 5
10 Table 2. What Type(s) Of Ground Transportation Are You Using This Trip While In Utah? Type Skiing in Big & Little Cottonwood Canyons Skiing in Summit County Private Vehicle 61% 40% Rental Vehicle 26% 40% Other Bus, Shuttle, Van, etc. 11% 18% Public Bus Service 11% 12% TRAX 3% 0% Other 1% 1% Source: Ski Utah Survey Data Table 3. How Did You Get To The Ski Area Today? Type Skiing in Big & Little Cottonwood Canyons Skiing in Summit County Private Vehicle 57% 38% Rental Vehicle 21% 27% Ski-in/Ski-out 11% 7% Walked 3% 11% Other Bus, Shuttle, Van, etc. 4% 9% Public Bus Service 7% 6% TRAX 1% 0% Other 1% 1% Source: Ski Utah Survey Data Park City Chamber of Commerce conducted a similar study for out-of-state summer visitors to Park City both for day visits and for overnight visits. In 2010, 58% of daytime visitors reported traveling to Utah by airplane, while 41% traveled by car. Specifically to Park City, 54% of overnight visitors traveled to Park City by their own vehicle, while 33% traveled by rental vehicle. Only 5% used a transportation company such as private shuttles. Similar mode split data for dispersed recreation use and non-winter recreation is unavailable. 6
11 Vehicle Occupancy UDOT collected vehicle occupancies for Little and Big Cottonwood Canyons in In Big Cottonwood Canyon, the average vehicle occupancy was 1.98 occupants per vehicle. In Little Cottonwood Canyon, the average vehicle occupancy was 1.7 occupants per vehicle. ROADWAY NETWORK Several major state-owned roadways provide primary access to mountain destinations in the study area. These include: SR-190, a two-lane road providing access to and up Big Cottonwood Canyon. SR-210, a two-lane road providing access to and up Little Cottonwood Canyon. SR-224, with five lanes connecting I-80 to Park City. SR-248, a three- to five-lane highway connecting Park City to US-40. I-80, a six-lane freeway connection Salt Lake County to Summit County. Foothill Boulevard, a five- to seven-lane road connecting central Salt Lake City and the University of Utah to I-80 and I South (SR-209), a five-lane road providing access east-west across Salt Lake Valley to Little Cottonwood Canyon. Near the mouth of Little Cottonwood Canyon, 9000 South narrows to a two-lane road South (Fort Union Boulevard), a five-lane road providing access eastwest across Salt Lake Valley to Big Cottonwood Canyon. Near the mouth of Big Cottonwood Canyon, 7200 South narrows to a three-lane road. Wasatch Boulevard, (also two state routes: 190 and 210), a two- to five-lane road providing north-south access between I-80, I-215, Little Cottonwood Canyon, and points south. In the study area, traffic volumes have remained relatively constant for 11 years, with a decline in 2009 and an upward progression in recent years. In general, these major roadways accessing the Wasatch Front and the Wasatch Back function reasonably well. Traffic in the Cottonwood Canyons typically operates at free-flow speeds, with the exception of weather incidents and road closures. According to the Park City Transportation Master Plan, SR-224 typically operates at acceptable levels of service, with peak hour congestion occurring near the Kimball Junction interchange. SR-248 operates at a more marginal level of service during peak times, with ski season congestion but good traffic flow during other times of the year (source: SR-248 State Environmental Study, 2013). Figure 3 indicates general 7
12 locations of traffic congestion. As shown in Figure 3, I-15 experiences high levels of congestion during the peak hours of travel on weekdays. Other facilities in the study area with high levels of weekday congestion are: Knudsen s Corner a commercial center that serves as a gateway to the Cottonwood Canyons, Cottonwood Heights, and Sandy Kimball Junction a commercial center that serves as the main corridor between Park City, Snyderville Basin, and I-80 On weekends, the main areas of congestion are gateways to recreation: the entrance areas to Little and Big Cottonwood, Kimball Junction, and Old Town in the Park City area. There is also congestion on high visitation days at and along SR- 210 during the outflow at the Snowbird and Alta resort areas. Figure 4 shows the February and Figure 5 shows the July average daily traffic on SR-224, SSR-248, SR-190, SR-210, and I-80. As expected, regional facilities and facilities that serve commercial uses, such as I-80 and SR-224, have higher volumes than more localized facilities like SR-210 and SR-190. Figures 6 and 8 show the yearly percentage change for the average day in February, while Figures 7 and 9 show the yearly percentage change for the average day in July. These figures show the decline in traffic around 2009 and the subsequent increase in traffic in more recent years. However, there is generally very little traffic growth occurring in the Canyons. Traffic volumes in the study area were analyzed for the month of February, which is consistently a peak month for mountain-related traffic in both the Wasatch Front and the Wasatch Back, and July, which is the peak month for summer traffic. As shown in Figures 10 and 11, traffic in the study area has seasonal variations, mainly increasing in winter, with the Summit County roadways experiencing less drastic variations. 8

13 Figure 3. Existing Weekday and Weekend Congestion 9
14 60,000 50,000 Vehicles per Day 40,000 30,000 20,000 10, SR-224 SR-248 SR-210 (LCC) SR-190 (BCC) I-80 Source: UDOT Figure 4. February Average Daily Traffic ( ) Vehicles per Day 60,000 50,000 40,000 30,000 20,000 10, SR-224 SR-248 SR-210 (LCC) SR-190 (BCC) I-80 Source: UDOT Figure 5. July Average Daily Traffic ( ) 10
15 20.00% 15.00% 10.00% 5.00% 0.00% -5.00% % SR-210 (LCC) SR-190 (BCC) Trendline (SR-210) Trendline (SR-190) Source: UDOT Figure 6. Cottonwood Canyons Change in Vehicles per Day (February) ( ) 40.00% 30.00% 20.00% 10.00% 0.00% % % % % SR-210 (LCC) SR-190 (BCC) Trendline (SR-210) Trendline (SR-190) Source: UDOT Figure 7. Cottonwood Canyons Change in Vehicles per Day (July) ( ) 11
16 15.00% 10.00% 5.00% 0.00% -5.00% % SR-224 SR-248 Trendline (SR-224) Trendline (SR-248) Source: UDOT Figure 8. Summit County Change in Vehicles per Day (February) ( ) 15.00% 10.00% 5.00% 0.00% -5.00% % SR-224 SR-248 Trendline (SR-224) Trendline (SR-248) Source: UDOT Figure 9. Summit County Change in Vehicles per Day (July) ( ) 12
17 9,000 8,000 Vehicle per Day 7,000 6,000 5,000 4,000 3,000 2,000 1,000 - Jan Feb Mar Apr May June July Aug Sept Oct Nov Dec SR-190 (BCC) SR-210 (LCC) Source: UDOT Figure 10. Cottonwood Canyons Average Daily Traffic ( ) 40,000 35,000 30,000 Vehicle per Day 25,000 20,000 15,000 10,000 5,000 - Jan Feb Mar Apr May June July Aug Sept Oct Nov Dec SR-224 SR-248 Source: UDOT Figure 11. Summit County Average Daily Traffic ( ) February is among the highest peak months for the Wasatch Front and Back. On a typical February day (based on 2013 data), SR-190 experiences an average daily traffic volume of 5,200 vehicles, SR-210 experiences an average daily traffic of 8,000 vehicles, SR-224 has average daily traffic of 32,800 and SR-248 has average 13
18 daily traffic of 16,200. The Cottonwood Canyons are unique in having significantly higher weekend than weekday volumes, indicating a greater focus on recreational trips than typical work or household trips. Figures 12 through 15 show daily variations of project area roadways. The red areas on Figures 12 through 15 represent the potential capacity of these roadways. As shown, during peak travel times (weekends and holidays), Little Cottonwood Canyon experiences capacity issues both in the early morning and evening, correlating with ski resort operations. A second red line is shown on Figure 12 to indicate a weather-based capacity. Capacity of the roadway decreases as drivers slow down to operate safely within snowy or otherwise slick roadway conditions. A similar, but not as extreme, trend is also seen in Big Cottonwood Canyon. Capacity is usually not reached in either of the Cottonwood Canyons on weekdays during the ski season, or during the late spring, summer, or fall seasons. In Summit County, traffic volumes on SR-244 are generally consistent throughout the month with peaking occurring in the traditional PM peak hour. SR-248 has a less recreational-trip focus than the Cottonwoods, with weekday volumes exceeding weekend volumes Normal Capacity Weather Capacity Daily Weekend Weekday President's Day Source: UDOT Figure 12. Little Cottonwood February Traffic (2013) 14
19 1,400 1,200 1, Daily Weekend Weekday President's Day Source: UDOT Figure 13. Big Cottonwood Canyon February Traffic (2013) 3,500 3,000 2,500 2,000 1,500 1, :00 1:00 2:00 3:00 4:00 5:00 6:00 7:00 8:00 9:00 10:00 11:00 12:00 13:00 14:00 15:00 16:00 17:00 18:00 19:00 20:00 21:00 22:00 23:00 Daily Weekend Weekday President's Day Source: UDOT Figure 14. SR-224 (Kimball Junction to Park City) February Traffic (2013) 2,000 1,500 1, :00 1:00 2:00 3:00 4:00 5:00 6:00 7:00 8:00 9:00 10:00 11:00 12:00 13:00 14:00 15:00 16:00 17:00 18:00 19:00 20:00 21:00 22:00 23:00 Daily Weekend Weekday President's Day Source: UDOT Figure 15. SR-248 (SR-40 to Park City) February Traffic (2013) 15
20 July is the highest peak summer month. On a typical July day (based on 2013 data), SR-190 experiences an average daily traffic volume of 5,400 vehicles, which is higher than the peak winter month. SR-210 experiences an average daily traffic of 5,100 vehicles, about 60% of the winter peak month. SR-224 has average daily traffic of 32,500 and SR-248 has average daily traffic of 17,300, both of which are comparable to the winter peak month. Figures 16 through 19 show daily variations of project area roadways. Unlike the winter months, these roadways do not reach the potential capacity of the roadway Daily Weekend Weekday Source: UDOT Figure 16. Little Cottonwood July Traffic (2013) :00 1:00 2:00 3:00 4:00 5:00 6:00 7:00 8:00 9:00 10:00 11:00 12:00 13:00 14:00 15:00 16:00 17:00 18:00 19:00 20:00 21:00 22:00 23:00 Daily Weekend Weekday Source: UDOT Figure 17. Big Cottonwood Canyon July Traffic (2013) 16
21 :00 1:00 2:00 3:00 4:00 5:00 6:00 7:00 8:00 9:00 10:00 11:00 12:00 13:00 14:00 15:00 16:00 17:00 18:00 19:00 20:00 21:00 22:00 23:00 Daily Weekend Weekday Source: UDOT Figure 18. SR-224 (Kimball Junction to Park City) July Traffic (2013) :00 1:00 2:00 3:00 4:00 5:00 6:00 7:00 8:00 9:00 10:00 11:00 12:00 13:00 14:00 15:00 16:00 17:00 18:00 19:00 20:00 21:00 22:00 23:00 Daily Weekend Weekday Source: UDOT Figure 19. SR-248 (SR-40 to Park City) July Traffic (2013) Similar hourly and monthly data for 7200 South, 9000 South, and Wasatch Boulevard is unavailable from UDOT. However, yearly counts are available through UDOT. On 7200 South west of State Street, the average daily traffic (ADT) is over 33,000. Between State Street and 2300 East, the ADT on 7200 South is between 19,000 and 34,000, with particularly high volumes around the intersection of 900 East. As land uses become more residential closer to the mouth of Big Cottonwood, volumes decline to around 9,000 vehicles. Traffic growth along 7200 has been basically flat in recent years. The ADT on 9000 South west of 700 East is approximately 33,000 vehicles, and varies between 20,100 and 30,000 vehicles between 700 East and 2000 East. Closer to the mouth of Little Cottonwood Canyon, the ADT drops to between 3,000 and 7,000 vehicles as land use becomes more residential. Like 7200 South, traffic growth has been basically flat in recent years. 17
22 North of Big Cottonwood Canyon, Wasatch Boulevard has an ADT of approximately 19,000, which declines to around 14,000 closer to Little Cottonwood Canyon. The growth rate on Wasatch Boulevard has been generally flat. Foothill Boulevard has an ADT between 33,000 and 45,000 from the University of Utah south. Volumes along Foothill Boulevard have been relatively consistent, although Foothill does experience heavy levels of congestion during the AM and PM commute peak hours and during special events at the University of Utah. BICYCLING Bicycling is very popular along the Wasatch Front and Back, with many trails and on-street facilities connecting to the Canyons and on-mountain facilities. Specific bicycle facilities in the study area are: Extensive trail networks in Summit County and Park City, including tunnels under major roadways Wide shoulders on SR-224 Bike lanes along Wasatch Boulevard Recent shoulder widening improvements in Big and Little Cottonwood Canyon, although there are no specific bicycle facilities Bicycle counts were not readily available for major roadways in the study area. For more information about bicycling in the study area, see the Emigration Canyon Trails Master Plan (2007), Parley s Canyon Trail Feasibility Assessment Report (2010), Snyderville Basin Transportation Master Plan (2009), Park City Trails Master Plan (2008), and Snyderville Bain Recreation Trails Master Plan (2013). MOBILITY AND REALIBILITY Travel in mountainous areas can have a set of reliability issues that are unique. As Little and Big Cottonwood Canyons have one access point (although Big Cottonwood connects via unpaved road to Summit County in the winter), any issues within the Canyons have major impacts on mobility. Avalanches, crashes, and other problems can cause high levels of delay in an area with no alternative travel routes. Avalanches Little Cottonwood Canyon road (SR-210) has the highest Avalanche Hazard Index of any major roadway in North America. Vehicles that are traveling slowly or are stationary due to congestion are at increased risk for exposure to avalanches. The 18

23 50-year average of avalanche data shows that an average of 33 avalanches per year hit and adversely impact SR-210. These avalanches have caused an average of 18 full-highway closures per year. Road closure with subsequent firing of artillery into avalanche starting zones is the typical method of control. In Little Cottonwood, closures for avalanche work tend to be 1.5 to two hours in duration during the morning hours. Overnight closures can be eight to 15 hours in duration and affect the canyon two to three times a year. However, these closures can have major impacts to travel. After the roadway is opened, the commute delay of vehicles waiting to enter the canyon can be 1.5 to two hours. Vehicles waiting to enter the canyons can back onto Wasatch Boulevard, as shown in Figure 20. Avalanche work also affects travelers leaving the canyons. Figure 20. Congestion on Wasatch Boulevard between the Two Cottonwood Canyons Safety Hazards There is only one emergency ingress/egress to each of the Cottonwood Canyons. Emergency response times increase when there is traffic in the canyons. There is no alternative access in Little Cottonwood Canyon, and there is limited/seasonal alternative access in Big Cottonwood Canyon via Guardsman Pass. The road conditions in the Cottonwood Canyons (steep grades, winding, snowy/icy), combined with driver behavior, can result in crashes typically vehicles running off the road. UDOT evaluates accident data by comparing the number of crashes on a specific road to the average number of crashes on similar types of roads. These ratios were included as part of the WFRC Long Range Plan, as shown in Figure 21. Roadways in yellow have a higher crash rate than the statewide crash rate of crashes per 100 million vehicle miles traveled, while roads in red indicate the highest five percent of segments. Big Cottonwood Canyon, the mouth of Little Cottonwood Canyon, and the mouth of Parley s Canyon are red. All major east-west 19

24 corridors between Salt Lake and Summit Counties experience higher crash rates than the statewide average. Source: WFRC Figure 21. Safety Index Crash Rate Ratio Commute delays fluctuate wildly based on dynamics, severity, and location of the crash. Delays range from none to several hours, with most highway accidents resulting in noticeable delays in the minute range with motorists reacting/slowing for emergency vehicles being present and the time needed to recover disabled vehicles. Based on data from the Unified Police Department, Little Cottonwood Canyon experiences an average of 62 crashes a year, with over a third occurring between November and January and 50-67% occurring in the months between November and March. Big Cottonwood Canyon experiences an average of 77 crashes a year, with 32-54% occurring between November and January and 50-71% occurring in the months between November and March. Congestion One of the major traffic-related concerns in the Cottonwood Canyons is the unreliable travel experience. Little Cottonwood Canyon experiences over 30 days a year where traffic volumes exceed roadway capacity (all within the winter season). High seasonal demand can cause traffic conditions resembling a traffic jam, what 20


25 Draft Transportation System Existing Conditions is known locally as the red snake, a very long line of cars heading in or out of Little Cottonwood Canyon, as shown in Figure 22. When one canyon is closed, visitors can overwhelm the open canyon, causing major congestion, parking, and transit issues. This is shown in Figure 23, when Little Cottonwood Canyon was closed for avalanche work and Big Cottonwood Canyon experienced heavy congestion. Figure 22. Red Snake in Little Cottonwood Canyon Figure 23. Congestion in Big Cottonwood Canyon 21
26 TRANSIT SERVICE Limited transit service is available to people wishing to access the mountain areas within the study area. Service is available through several providers: UTA Ski Bus routes (in Big and Little Cottonwood Canyons, only in winter) UTA PC Connect (from the Salt Lake Valley to Park City, year-round) Park City Transit (within Park City and the surrounding environs, year-round) Seasonal and private shuttles (such as Lewis Brothers and Canyons Transportation) Annual ridership on public transit routes is demonstrated in Figure 24, and compared to regional transit systems such as the North/South TRAX line in the Salt Lake Valley. For more information about private shuttles within Summit County see the Park City Transit Short-Range Development Plan (2011). Park City Transit PC-SLC Connect Ski Bus BCC Ski Bus LCC Frontrunner TRAX Green Line (West Valley to Airport) TRAX Red Line (U of U to Daybreak) TRAX Blue Line (Downtown to Draper) 0 2,000,000 4,000,000 6,000,000 8,000,000 Source:, Park City Transit Figure 24. Annual Public Transit Ridership (2013) UTA provides bus service to the resorts in Big and Little Cottonwood Canyons usually from mid-december to mid-april. Although the ridership of a seasonal bus is overwhelmed by the annual ridership of TRAX service, as shown in Figure 24, the UTA ski bus service provides an invaluable component to travel within the Cottonwood Canyons. The annual ridership of the ski buses is over 160,000 trips a year, resulting in a significant reduction in vehicle trips every day during the ski season. The resorts offer employees and season pass holders a transit pass that is automatically activated for the season. The fare is on a pay-per-trip basis, counted electronically for pass holders or collected in cash. The one-way fare for ski bus service was $4.50. UTA has a current operating fleet of 40 ski buses. Ski buses stop at the major ski areas and a few trailheads within the Canyons for dispersed recreation use. Additional bus service operates in the summer months to 22

27 serve work trips in Little Cottonwood Canyon, consisting of one trip in the morning and one in the evening. During peak times in the winter, ski buses operate at capacity (Figure 25). This can present issues if the ski buses reach capacity before the park-and-ride lots at the mouth of the Cottonwood Canyons because potential riders may need to wait until another is available. These capacity issues have led some canyon users to skip the wait and hitchhike. While technically illegal, hitchhiking is a common method of carpooling and resources sharing in the canyons. Hitchhiking is used by resort employees, resort visitors, and dispersed recreationalists such as back-country skiers and snowboarders. Hitchhiking also occurs in the summer months as hikers may do hiking tours that do not necessarily end at their vehicles and there is a lack of transit in the Cottonwood Canyons during the summer. Figure 25. Ski Bus Loading Current transit connections between the population base and tourist amenities in the Salt Lake Valley are limited. Although there are buses serving the canyons, bus service directly from downtown hotels is limited to two round trips per day. The bus trip from downtown to Alta takes 1.5 hours. There are currently no convenient transit options between Summit County and the Cottonwood Canyons. For example, for a tourist staying in a hotel near old town Park City, the transit trip to Little Cottonwood Canyon would be about 1.5 hours with one transfer and would only be available on winter weekdays. The transit trip would require two transfers for Big Cottonwood Canyon. The bus route between Salt Lake City and Park City currently does not operate on weekends and the bus does not operate in the summer. The direct distance from Park City to Alta is only nine miles, but the distance on existing roads is 42 miles (a 1-hour drive). 23
28 Transit within and around Park City is provided by Park City Transit. PC Transit carried 1.87 million passengers in 2012 on multiple routes within City limits and also within the Snyderville Basin, in a combination of fixed-route and on-demand service types. This is consistent with ridership totals provided in the Park City Transit Short Range Development Plan, which indicated that transit ridership has declined slightly since the economic downturn beginning in Routes within the City generate the highest levels of ridership, totaling roughly 874,000 riders in Routes to Kimball Junction accounted for approximately 481,000 riders in Ridership on the PC Transit network is typically highest in winter months, particularly in January when the Sundance Film Festival brings visitors from across the globe to Park City. Ridership is typically lowest in May and October, the shoulder seasons between winter sports activity and the summer tourist season. Figure 26 shows ridership on various routes throughout the year. 450, , , , , , , ,000 50,000 0 Jan Feb Mar Apr May Jun Jul Aug Sep Oct Nov Dec Total Ridership Figure 26. Park City Ridership Counts (2012) While transit service provides a means of access for both employees and recreationalists heading to the mountain areas of the Wasatch Range, relatively small portions of those populations are using transit to access resort areas. According to analysis of SkiUtah data, 6% of skiers traveling to Summit County take transit; 6% traveling to Little Cottonwood take transit; and only 2% traveling to Big Cottonwood take transit. PARKING Information on existing parking conditions in the Study Area was taken from several sources, including the Salt Lake County 2012 Canyons Parking Study. Results from prior studies indicate the large lots at the ski resorts, the park-and-ride lots at the base of the canyons, and roadside parking areas are at or near capacity on peak 24

29 winter days, typically weekends, but have available parking during off peak days, typically weekdays. Parking is also a problem near recreation access points during peak summer periods, but the large resort lots generally have availability. In the winter, both the resorts and major dispersed recreation trailheads have parking limited available parking. The large resort lots range in size from 600 to 1,800 spaces. Parking expansion is not allowed on USFS lands in the canyons (except if needed for watershed protection or to facilitate mass transit). In the Cottonwood Canyons, parking on the side of the road creates an uncomfortable and/or unsafe environment, impedes bicycle travel and snow removal, and degrades natural resources (Figures 27 and 28). Parking on the side of the road is generally legal unless otherwise marked. However, in many areas there is not adequate space to park on the side of the road. Occasionally, on peak winter days, cars are parked partially in the travel lane. Finding parking during the summer in the Cottonwood Canyons near trailheads is consistently seen as a major issue by canyon users. Trailhead parking is limited and can quickly reach capacity, forcing many people to park on the side of the road and walk along the roadway to trail head. One of the most congested areas in the summer is near Mill B in Big Cottonwood Canyon and White Pine in Little Cottonwood Canyon. Figure 27. Winter On-Street Parking in Big Cottonwood Canyon 25

30 Figure 28. Winter On-Street Parking in Little Cottonwood Canyon Transit service to the park-and-ride lots at the base of the canyons is limited and the ski buses are generally accessed by driving and parking at the base of the canyons or to designated drop-offs. There are regular bus routes on 7200 South and 9400 South. During the winter, there are two round trips per day from downtown Salt Lake City, the University of Utah, and the 4500 South TRAX station. Park-and-ride lots in the Salt Lake Valley, at TRAX stations, and downtown Salt Lake City have unused capacity in both seasons. For more information regarding parking capacities and utilizations see the Cottonwood Canyons Parking Study Recommendations (2012). Park City maintains its own parking systems, both in terms of park-and-ride lots and citywide parking programs. The public transit system has park-and-ride lots at Richardson Flats and Jeremy Ranch, both of which typically have capacity available. Park City runs both paid on-street and parking permit programs; parking supply in Old Town can get especially scarce during the ski season and more emphatically so during the Sundance Film Festival each January. COMMENTS RECEIVED AT FIRST GROUP MEETING What is your biggest concern in the Wasatch Mountains? 26
31 Transportation Improve cyclists (and driver) experience. Experience getting there is deteriorating. (2 comments) Provide multimodal transportation to achieve mode shift away from low occupancy cars. (2) Need for concurrent land use transportation planning (2) Address inefficiency of existing systems (e.g., negative impacts associated with cars/traffic) (2) Canyon road capacity constrained; congestion/delay issues (2) Limited transportation opportunities on the East Side [Salt Lake Valley]. Opportunity to improve transportation on East Side. Carrying capacity. How many cars & people can reasonably fit simultaneously? Noted Zion NP shuttle example. Economic incentives/disincentives important. Qualitative aspects there are important intangibles that can t be measured. Access / Safety / Growth Safety in general, with some emphasizing active transportation modes (e.g., cyclists). (8) Managing negative effects associated with population growth. (6) Accommodates everyone (e.g., families, students, hikers, campers, all types of users). (4) Maintain accessibility (including affordability). (4) Sustainability. References to sustainability also included financial and operations/management. (4) Preserve communities and respect private property rights when considering land use and transportation projects. (3) Residents within canyons want to be a connected community. No dead end canyons for public safety reasons (e.g., evacuation). Avalanche hazards particularly high in LCC. Build on previous plans and implement solutions. Gravel pit redevelopment opportunity to focus growth purposefully. Vet plans with operational personal. Inclusion of appropriate agencies and staff. Plans need dedicated resources to be executed. Bridge disconnect between plans and implementation. 27
32 Natural Systems Preservation Preserve quality visitor experience and recreation opportunities. (4) Preservation of quality natural character, view shed. (3) Balance economy and rich environmental conditions. (2) Watershed needs to be priority protected resource. (3) Preservation of air quality. (2) Management Management agencies could be ways to make existing operations more effective with incremental improvements. Better understanding of operations and maintenance costs. Existing bike facility in BCC. DATA REQUESTS THAT COULD NOT BE FILLED The Transportation team has requested collision data and will incorporate it when it becomes available. Note: This report reflects the input of the Transportation System Group, which is an advisory body to the Mountain Accord. As such, this report may not necessarily reflect the opinions of the Mountain Accord Executive Board organizations. The intent of this report is to lead to the development of a recommendation from the System Group to the Executive Board for their consideration. 28
33
DISTRICT EXPRESS LANES ANNUAL REPORT FISCAL YEAR 2017 JULY 1, 2016 JUNE 30, FloridaExpressLanes.com
 DISTRICT EXPRESS LANES ANNUAL REPORT FISCAL YEAR 2017 JULY 1, 2016 JUNE 30, 2017 FloridaExpressLanes.com This page intentionally left blank. TABLE OF CONTENTS List of Figures... ii List of Tables.... ii
UTA Ski Service Redesign. Christopher Chesnut Sr. Manager of Integrated Service Planning Utah Transit Authority Salt Lake City, UT
 UTA Ski Service Redesign Christopher Chesnut Sr. Manager of Integrated Service Planning Utah Transit Authority Salt Lake City, UT Stephanie McVey Regional Planning & Environmental Manager WSP USA Tempe,
Sound Transit Operations December 2014 Service Performance Report. Ridership
 Ridership Total Boardings by Mode Mode Dec-13 Dec-14 % YTD-13 YTD-14 % ST Express 1,266,130 1,396,787 10.3% 16,605,299 17,661,976 6.4% Sounder 248,710 285,016 14.6% 3,035,735 3,361,317 10.7% Tacoma Link
Sound Transit Operations June 2016 Service Performance Report. Ridership
 Ridership Total Boardings by Mode Mode Jun-15 Jun-16 % YTD-15 YTD-16 % ST Express 1,622,222 1,617,420-0.3% 9,159,934 9,228,211 0.7% Sounder 323,747 361,919 11.8% 1,843,914 2,099,824 13.9% Tacoma Link 75,396
Sound Transit Operations March 2018 Service Performance Report. Ridership
 March 218 Service Performance Report Ridership Total Boardings by Mode Mar-17 Mar-18 % YTD-17 YTD-18 % ST Express 1,622,116 1,47,79-4.6% 4,499,798 4,428,14-1.6% Sounder 393,33 39,6.% 1,74,96 1,163,76 8.3%
Draft Transportation White Paper
 Draft Transportation White Paper October 2014 TABLE OF CONTENTS INTRODUCTION... 4 SUMMARY... 4 TRANSPORTATION SYSTEM GOALS AND METRICS... 6 TRANSPORTATION GOALS... 6 TRANSPORTATION METRICS... 6 CONCEPTS...
Existing Services, Ridership, and Standards Report. June 2018
 Existing Services, Ridership, and Standards Report June 2018 Prepared for: Prepared by: Contents Overview of Existing Conditions... 1 Fixed Route Service... 1 Mobility Bus... 34 Market Analysis... 41 Identification/Description
PROPOSED ACTION South 3000 East Salt Lake City, UT United States Department of Agriculture
 United States Department of Agriculture Forest Service Uinta-Wasatch-Cache National Forest Salt Lake Ranger District 6944 South 3000 East Salt Lake City, UT 84121 801-733-2660 File Code: 1950/2300 Date:
Sound Transit Operations January 2018 Service Performance Report. Ridership
 January 218 Service Performance Report Ridership Total Boardings by Mode Jan-17 Jan-18 % YTD-17 YTD-18 % ST Express 1,3,33 1,7,91.3% 1,3,33 1,7,91.3% Sounder 367,33 416,8 13.3% 367,33 416,8 13.3% Tacoma
System Group Meeting #1. March 2014
 System Group Meeting #1 March 2014 Meeting #1 Outcomes 1. Understand Your Role 2. List of Revisions to Existing Conditions 3. Information Sources Study Area The Purpose of Mountain Accord is to Preserve
Sound Transit Operations August 2015 Service Performance Report. Ridership
 Ridership Total Boardings by Mode Mode Aug-14 Aug-15 % YTD-14 YTD-15 % ST Express 1,534,241 1,553,492 1.3% 11,742,839 12,354,957 5.2% Sounder 275,403 326,015 18.4% 2,139,086 2,463,422 15.2% Tacoma Link
KING STREET TRANSIT PILOT
 KING STREET TRANSIT PILOT Update toronto.ca/kingstreetpilot #kingstreetpilot HIGHLIGHTS TRANSIT RIDERSHIP TRANSIT CAPACITY To respond to this growth in ridership, the TTC has increased the capacity of
Sound Transit Operations January 2014 Service Performance Report. Ridership
 Ridership Total Boardings by Mode Mode Jan-13 Jan-14 % YTD-13 YTD-14 % ST Express 1,343,290 1,426,928 6.2% 1,343,290 1,426,928 6.2% Sounder 245,135 256,775 4.7% 245,135 256,775 4.7% Tacoma Link 86,229
SAMTRANS TITLE VI STANDARDS AND POLICIES
 SAMTRANS TITLE VI STANDARDS AND POLICIES Adopted March 13, 2013 Federal Title VI requirements of the Civil Rights Act of 1964 were recently updated by the Federal Transit Administration (FTA) and now require
Assessment of Travel Trends
 I - 2 0 E A S T T R A N S I T I N I T I A T I V E Assessment of Travel Trends Prepared for: Metropolitan Atlanta Rapid Transit Authority Prepared by: AECOM/JJG Joint Venture Atlanta, GA October 2011 General
ECONOMIC PROFILE. Tourism
 ECONOMIC PROFILE Tourism Park City & Summit County Utah Prepared by Park City Chamber of Commerce Convention & Visitors Bureau P.O. Box 1630 ~ Park City, UT 84060-1630 800.453.1360 ~ 435.649.6100 ~ fax
Date: 11/6/15. Total Passengers
 Total San Diego Metropolitan Transit System POLICY 42 PERFORMANCE MONITORING REPORT Page 1 of 6 OBJECTIVE Develop a Customer-Focused and Competitive System The following measures of productivity and service
2017/2018 Q3 Performance Measures Report. Revised March 22, 2018 Average Daily Boardings Comparison Chart, Page 11 Q3 Boardings figures revised
 2017/2018 Q3 Performance Measures Report Revised March 22, 2018 Average Daily Boardings Comparison Chart, Page 11 Q3 Boardings figures revised Contents Ridership & Revenue... 1 Historical Revenue & Ridership...
Att. A, AI 46, 11/9/17
 Total s San Diego Metropolitan Transit System POLICY 42 PERFORMANCE MONITORING REPORT Page 1 of 6 Date: 11/8/17 OBJECTIVE Develop a Customer-Focused and Competitive System The following measures of productivity
Memorandum. Roger Millar, Secretary of Transportation. Date: April 5, Interstate 90 Operations and Mercer Island Mobility
 Memorandum To: From: The Honorable Dow Constantine, King County Executive; The Honorable Ed Murray, City of Seattle Mayor; The Honorable Bruce Bassett, City of Mercer Island Mayor; The Honorable John Stokes,
PERFORMANCE REPORT DECEMBER 2017
 PERFORMANCE REPORT DECEMBER 2017 Note: New FY2018 Goal/Target/Min or Max incorporated in the Fixed Route and Connection Dashboards. Keith A. Clinkscale Performance Manager INTRODUCTION/BACKGROUND Keith
Interstate 90 and Mercer Island Mobility Study APRIL Commissioned by. Prepared by
 Interstate 90 and Mercer Island Mobility Study APRIL 2017 Commissioned by Prepared by Interstate 90 and Mercer Island Mobility Study Commissioned by: Sound Transit Prepared by: April 2017 Contents Section
Appendix 4.1 J. May 17, 2010 Memorandum from CTPS to the Inter Agency Coordinating Group
 Appendix 4.1 J May 17, 2010 Memorandum from CTPS to the Inter Agency Coordinating Group CTPS CENTRAL TRANSPORTATION PLANNING STAFF Staff to the Boston Region Metropolitan Planning Organization MEMORANDUM
2017/ Q1 Performance Measures Report
 2017/2018 - Q1 Performance Measures Report Contents Ridership & Revenue... 1 Historical Revenue & Ridership... 1 Revenue Actual vs. Planned... 3 Mean Distance Between Failures... 5 Maintenance Cost Quarter
Sound Transit Operations March 2017 Service Performance Report. Ridership. Total Boardings by Mode
 March 217 Service Performance Report Ridership ST Express Sounder Tacoma Link Link Paratransit Mar-16 Mar-17 % 1,83,4 1,621,49 2.4% 37,496 82,631 1,264,47 3,821 Total Boardings by Mode 389,98 87,39 1,89,43,297
Treasure Island Supplemental Information Report Addendum
 1 1 1 1 0 1 0 1 0 1 Treasure Island Supplemental Information Report Addendum Introduction Purpose The purpose of this Supplemental Information Report (SIR) Addendum is to determine if the current land
Business Growth (as of mid 2002)
") Page 1 of 6 Planning FHWA > HEP > Planning > Econ Dev < Previous Contents Next > Business Growth (as of mid 2002) Data from two business directories was used to analyze the change in the number of businesses
Page 1 of 6 Planning FHWA > HEP > Planning > Econ Dev < Previous Contents Next > Business Growth (as of mid 2002) Data from two business directories was used to analyze the change in the number of businesses
VCTC Transit Ridership and Performance Measures Quarterly Report
 VCTC Transit Ridership and Performance Measures Quarterly Report Overview Quarter 2 Fiscal Year 2018-2019 This report provides performance measures for VCTC Intercity Bus Service covering the FY 2018-19
A CASE FOR COMPLETING THE JORDAN RIVER PARKWAY: A
 A CASE FOR COMPLETING THE JORDAN RIVER PARKWAY: A safe crossing at 9000 South and 850 West Proposed 9000 South Underpass Parkway Timeline Parkway, Trail, and Tourism Facts Blueprint Jordan River 1971 1973
HOV LANE PERFORMANCE MONITORING: 2000 REPORT EXECUTIVE SUMMARY
 Final Report Research Project Agreement No. T1803, Task 4 HOV Monitoring V HOV LANE PERFORMANCE MONITORING: 2000 REPORT EXECUTIVE SUMMARY by Jennifer Nee TRAC Research Engineer John Ishimaru TRAC Senior
2015 Business Survey Report Erie to Pittsburgh Trail March 2015
 2015 Business Survey Report Erie to Pittsburgh Trail March 2015 Table of Contents Executive Summary 2 2013 EPT Trail User Survey and Impact Analysis 3 Overview 3 Results 3 2014 2015 Erie to Pittsburgh
ECONOMIC PROFILE PARK CITY & SUMMIT COUNTY, UTAH
 ECONOMIC PROFILE PARK CITY & SUMMIT COUNTY, UTAH Prepared by the Park City Chamber of Commerce & Visitors Bureau PO Box 1630, Park City, UT 84060 1.800.453.1360 Economic Profile Packet Sections 1. Introduction
A. CONCLUSIONS OF THE FGEIS
 Chapter 11: Traffic and Parking A. CONCLUSIONS OF THE FGEIS The FGEIS found that the Approved Plan will generate a substantial volume of vehicular and pedestrian activity, including an estimated 1,300
5.1 Traffic and Transportation
 5.1 When it opens in 2009, the Bellevue Nickel Improvement Project will increase the number of vehicles able to travel through the study area, improve travel speeds, and improve safety by reducing the
Project Deliverable 4.1.3d Individual City Report - City of La Verne
 Pomona Valley ITS Project Project Deliverable 4.1.3d Individual City Report - City of La Verne Prepared by: April 19, 2002 099017000.1 Copyright 2002, Kimley-Horn and Associates, Inc TABLE OF CONTENTS
PUBLIC TRANSIT IN KENOSHA, RACINE, AND MILWAUKEE COUNTIES
 PUBLIC TRANSIT IN KENOSHA, RACINE, AND MILWAUKEE COUNTIES #118404v1 Regional Transit Authority June 19, 2006 1 Presentation Overview Existing Public Transit Transit System Peer Comparison Recent Transit
Sound Transit Operations February 2018 Service Performance Report. Ridership
 February 218 Service Performance Report Ridership Total Boardings by Mode Feb-17 Feb-18 % YTD-17 YTD-18 % ST Express 1,373,96 1,372,88 -.1% 2,877,294 2,88,719.1% Sounder 314,96 32,187 11.9% 681,923 768,69
RACINE COUNTY PUBLIC TRANSIT PLAN:
 RACINE COUNTY PUBLIC TRANSIT PLAN: 2013-2017 Recommended Transit Service Improvement Plan NEWSLETTER 3 SEPTEMBER 2013 This newsletter describes the final recommended public transit plan for the City of
PERFORMANCE REPORT NOVEMBER 2017
 PERFORMANCE REPORT NOVEMBER 2017 Note: New FY2018 Goal/Target/Min or Max incorporated in the Fixed Route and Connection Dashboards. Keith A. Clinkscale Performance Manager INTRODUCTION/BACKGROUND In June
Estimating Tourism Expenditures for the Burlington Waterfront Path and the Island Line Trail
 A report by the University of Vermont Transportation Research Center Estimating Tourism Expenditures for the Burlington Waterfront Path and the Island Line Trail Report # 10-003 February 2010 Estimating
PERFORMANCE REPORT JANUARY Keith A. Clinkscale Performance Manager
 PERFORMANCE REPORT JANUARY 2018 Keith A. Clinkscale Performance Manager INTRODUCTION/BACKGROUND Keith A. Clinkscale Performance Manager FIXED ROUTE DASHBOARD JANUARY 2018 Safety Max Target Goal Preventable
Monthly SunPass Transponder Sales Inception to June 2012
 Monthly SunPass Transponder Sales Inception to June 2012 This graph shows the monthly SunPass transponder sales since inception. The significant increase in transponder sales during March 2004 is attributed
rtc transit Before and After Studies for RTC Transit Boulder highway UPWP TASK Before Conditions
 rtc transit Before and After Studies for RTC Transit UPWP TASK 3403-11-14 Before Conditions Report Boulder highway June 2011 Before and After Studies for RTC Transit BOULDER HIGHWAY BEFORE STUDY UPWP Task
Sound Transit Operations January 2017 Service Performance Report. Ridership. Total Boardings by Mode
 January 217 Service Performance Report Ridership ST Express Sounder Tacoma Link Link Paratransit Jan-16 Jan-17 % 1,433,7 1,3,33 4.9% 331,27 7,121 98,411 3,633 Total Boardings by Mode 363,6 74,823 1,76,914
Word Count: 3,565 Number of Tables: 4 Number of Figures: 6 Number of Photographs: 0. Word Limit: 7,500 Tables/Figures Word Count = 2,250
 Katherine F. Turnbull, Ken Buckeye, Nick Thompson 1 Corresponding Author Katherine F. Turnbull Executive Associate Director Texas Transportation Institute Texas A&M University System 3135 TAMU College
MUSKEGON AREA TRANSIT SYSTEM PROPOSAL FOR FARE AND SERVICE ADJUSTMENTS TO BE PHASED IN BEGINNING JANUARY 1, 2018
 MUSKEGON AREA TRANSIT SYSTEM PROPOSAL FOR FARE AND SERVICE ADJUSTMENTS TO BE PHASED IN BEGINNING JANUARY 1, 2018 The Muskegon Area Transit System is proposing a series of System Adjustments to be implemented
CENTRAL OREGON REGIONAL TRANSIT MASTER PLAN
 Central Oregon Regional Transit Master Plan Volume II: Surveys and Market Research CENTRAL OREGON REGIONAL TRANSIT MASTER PLAN Volume IV: Service Plan Appendices A-B July 213 Nelson\Nygaard Consulting
Yukon Tourism Indicators Year-End Report Yukon Tourism Indicators Year-End Report 2015
 Yukon Tourism Indicators Overview The Yukon Tourism Indicators is published by the Department of Tourism and Culture as a companion to the monthly Yukon Tourism Visitation Report. This document is intended
LA Metro Rapid - Considerations in Identifying BRT Corridors. Martha Butler LACMTA, Transportation Planning Manager Los Angeles, California
 LA Metro Rapid - Considerations in Identifying BRT Corridors Martha Butler LACMTA, Transportation Planning Manager Los Angeles, California LA Metro Transportation planner/coordinator, designer, builder
RIDERSHIP TRENDS. August 2018
 RIDERSHIP TRENDS August Prepared by the Division of Strategic Capital Planning October Table of Contents Executive Summary...1 Ridership...3 Estimated Passenger Trips by Line...3 Estimated Passenger Trips
PERFORMANCE REPORT DECEMBER Performance Management Office
 PERFORMANCE REPORT DECEMBER 2018 Performance Management Office INTRODUCTION/BACKGROUND Performance Management Office FIXED ROUTE DASHBOARD FY 2019 Safety Max Target Goal Preventable Collisions per 100k
2018 Service Implementation Plan Executive Summary
 2018 Service Implementation Plan Executive Summary March 2018 2018 SERVICE IMPLEMENTATION PLAN Executive Summary 2018 Service Implementation Plan Each year, Sound Transit prepares a Service Implementation
PROJECT OVERVIEW WHAT IS THE GENERAL PLAN? WHY UPDATE THE PLAN? THE GENERAL PLAN WILL: WASATCH CANYONS GENERAL PLAN UPDATE
 WASATCH CANYONS GENERAL PLAN UPDATE PROJECT OVERVIEW WHAT IS THE GENERAL PLAN? The General Plan establishes goals and policies as a basis for land use and development regulations, transportation planning,
BaltimoreLink Implementation Status Report
 BaltimoreLink Implementation Status Report February 218 Joint Chairmen s Report JH1 Executive Summary BaltimoreLink, implemented on June 18, 217, is the complete overhaul and rebranding of the core transit
Resort Municipality Initiative Annual Report 2015
 Resort Municipality Initiative Annual Report 2015 Submitted by: City of Rossland in association with Tourism Rossland Prepared by: Deanne Steven Acknowledgements The City of Rossland would like to thank
WELLINGTON $422 MILLION $614 MILLION $83 MILLION 22% SPEND $1.9 BILLION
 WELLINGTON WELLINGTON $1.9 BILLION FORECAST TOTAL WELLINGTON INVESTMENT The Wellington region s transport challenges are dominated by the region s concentration of population in the metropolitan cities,
U.S. DOMESTIC INDUSTRY OVERVIEW FOR MARCH
 Inter-Office Memo Reno-Tahoe Airport Authority Date: April 30, 2009 To: Statistics Recipients From: Krys T. Bart, A.A.E., President/CEO Subject: RENO-TAHOE INTERNATIONAL AIRPORT PASSENGER STATISTICS U.S.
RIDERSHIP TRENDS. October 2017
 RIDERSHIP TRENDS October 2017 Prepared by the Division of Strategic Capital Planning December 2017 Table of Contents Executive Summary...1 Ridership...3 Estimated Passenger Trips by Line...3 Estimated
Produced by: Destination Research Sergi Jarques, Director
 Produced by: Destination Research Sergi Jarques, Director Economic Impact of Tourism Oxfordshire - 2016 Economic Impact of Tourism Headline Figures Oxfordshire - 2016 number of trips (day & staying) 27,592,106
Site Location and Setting
 Memorandum Date: To: From: Subject: Kristy Le, Gary Black Steve Orem Santa Teresa County Park Historic Area Traffic and Parking Study Hexagon Transportation Consultants, Inc. has completed a traffic and
Airport Planning Area
 PLANNING AREA POLICIES l AIRPORT Airport Planning Area LOCATION AND CONTEXT The Airport Planning Area ( Airport area ) is a key part of Boise s economy and transportation network; it features a multi-purpose
Memorandum. Fund Allocation Fund Programming Policy/Legislation Plan/Study Capital Project Oversight/Delivery Budget/Finance Contract/Agreement Other:
 Memorandum Date: March 23, 2018 To: Transportation Authority Board From: Eric Cordoba Deputy Director Capital Projects Subject: 4/10/18 Board Meeting: San Francisco Freeway Corridor Management Study Update
ATM Network Performance Report
 ATM Network Performance Report 2018. Page 1 of 16 Table of contents Summary... 3 Network Wide Performance... 4 Airborne delay... 4 Sydney... 6 Airborne delay... 6 Notable events... 6 Melbourne... 9 Airborne
Produced by: Destination Research Sergi Jarques, Director
 Produced by: Destination Research Sergi Jarques, Director Economic Impact of Tourism Oxfordshire - 2015 Economic Impact of Tourism Headline Figures Oxfordshire - 2015 Total number of trips (day & staying)
Research Report Agreement T4118, Task 24 HOV Action Plan HOV ACTION PLAN
 Research Report Agreement T4118, Task 24 HOV Action Plan HOV ACTION PLAN by John M. Ishimaru Senior Research Engineer Duane Wright Systems Analyst Programmer Mark E. Hallenbeck Director Jaime Kang Research
Produced by: Destination Research Sergi Jarques, Director
 Produced by: Destination Research Sergi Jarques, Director Economic Impact of Tourism North Norfolk District - 2016 Contents Page Summary Results 2 Contextual analysis 4 Volume of Tourism 7 Staying Visitors
Produced by: Destination Research Sergi Jarques, Director
 Produced by: Destination Research Sergi Jarques, Director Economic Impact of Tourism Norfolk - 2016 Contents Page Summary Results 2 Contextual analysis 4 Volume of Tourism 7 Staying Visitors - Accommodation
TransAction Overview. Introduction. Vision. NVTA Jurisdictions
 Introduction Vision NVTA Jurisdictions In the 21 st century, Northern Virginia will develop and sustain a multimodal transportation system that enhances quality of life and supports economic growth. Investments
FORECASTING FUTURE ACTIVITY
 EXECUTIVE SUMMARY The Eagle County Regional Airport (EGE) is known as a gateway into the heart of the Colorado Rocky Mountains, providing access to some of the nation s top ski resort towns (Vail, Beaver
Atlantic City Tourism Performance Indicators (AC-TPI) nd Quarter
 nd Quarter") Atlantic City Tourism Performance Indicators (AC-TPI) 2018 2nd Quarter Prepared by Brian J. Tyrrell, Ph.D. and Rummy Pandit, L.P.D., M.B.A., C.H.A. Executive Director Atlantic City Tourism Performance
Atlantic City Tourism Performance Indicators (AC-TPI) 2018 2nd Quarter Prepared by Brian J. Tyrrell, Ph.D. and Rummy Pandit, L.P.D., M.B.A., C.H.A. Executive Director Atlantic City Tourism Performance
2006 WEEKDAY TRAFFIC PROFILE. June 15, 2007
 June 15, 2007 Mr. Gary Stobb, P.E. Director of Planning/Operations Harris County Toll Road Authority 330 Meadowfern, Suite 200 Houston, TX 77067 Re: Westpark Tollway Value Pricing Analysis Dear Mr. Stobb:
Auckland Transport Quarterly Indicators Report 2018/19
 Attachment 1 Auckland Transport ly Indicators Report 218/19 September 218 Table of Contents Page 2. 1. Executive summary 2. External indicators 3. Performance by Key Priority 3.1 Deliver an efficient and
Evaluating Lodging Opportunities
 Evaluating Lodging Opportunities This section explores market opportunities for new lodging accommodations in the downtown area. It will help you understand travel and visitation trends, existing competition,
HEATHROW COMMUNITY NOISE FORUM
 HEATHROW COMMUNITY NOISE FORUM 3Villages flight path analysis report January 216 1 Contents 1. Executive summary 2. Introduction 3. Evolution of traffic from 25 to 215 4. Easterly departures 5. Westerly
US 380 FEASIBILITY STUDY
 US 380 FEASIBILITY STUDY Denton County CSJ(s): 0135-10-061, 0135-10-062 Public Meeting(s): January 15 & 22, 2019 WELCOME US 380 Denton County Feasibility Study DALLAS DISTRICT PUBLIC MEETING January 15
Produced by: Destination Research Sergi Jarques, Director
 Produced by: Destination Research Sergi Jarques, Director Economic Impact of Tourism Norfolk - 2017 Contents Page Summary Results 2 Contextual analysis 4 Volume of Tourism 7 Staying Visitors - Accommodation
Section II. Planning & Public Process Planning for the Baker/Carver Regional Trail began in 2010 as a City of Minnetrista initiative.
 Section II Planning & Public Process Planning for the began in 2010 as a City of initiative. city staff began discussions with the Park District on the possibility of a north/south regional trail connection
RIDERSHIP TRENDS. January 2018
 RIDERSHIP TRENDS January 2018 Prepared by the Division of Strategic Capital Planning March 2018 Table of Contents Executive Summary...1 Ridership...3 Estimated Passenger Trips by Line...3 Estimated Passenger
Evaluation of the Effectiveness of High Occupancy Vehicle Lanes
 Evaluation of the Effectiveness of High Occupancy Vehicle Lanes Peter T. Martin, Associate Professor Joseph Perrin, Research Assistant Professor Pen Wu and Rob Lambert, Research Assistants University of
APPENDIX B COMMUTER BUS FAREBOX POLICY PEER REVIEW
 APPENDIX B COMMUTER BUS FAREBOX POLICY PEER REVIEW APPENDIX B COMMUTER BUS FAREBOX POLICY PEER REVIEW The following pages are excerpts from a DRAFT-version Fare Analysis report conducted by Nelson\Nygaard
CONGESTION MONITORING THE NEW ZEALAND EXPERIENCE. By Mike Curran, Manager Strategic Policy, Transit New Zealand
 CONGESTION MONITORING THE NEW ZEALAND EXPERIENCE 26 th Australasian Transport Research Forum Wellington New Zealand 1-3 October 2003 By, Manager Strategic Policy, Transit New Zealand Abstract New Zealand
Macleod Trail Corridor Study. Welcome. Macleod Trail Corridor Study Open House. Presentation of Proposed Design Concepts
 Macleod Trail Corridor Study Welcome Macleod Trail Corridor Study Open House Presentation of Proposed Design Concepts Study Purpose Develop a corridor plan for Macleod Trail that aligns with The City s:
Managing And Understand The Impact Of Of The Air Air Traffic System: United Airline s Perspective
 Managing And Understand The Impact Of Of The Air Air Traffic System: United Airline s Perspective NEXTOR NEXTOR Moving Moving Metrics: Metrics: A Performance-Oriented View View of of the the Aviation Aviation
B. Congestion Trends. Congestion Trends
 B. Congestion Trends Congestion Trends There are two types of congestion that impact mobility: recurring and non-recurring congestion. Recurring congestion is related to segments of roadway that are over
Summary of Proposed NH 120 Service
 Proposed NH 120 Bus Route Moody Building Etna Road Summary of Proposed NH 120 Service The Upper Valley Lake Sunapee Regional Planning Commission (UVLSRPC) working together with a Steering Committee comprised
FIXED ROUTE DASHBOARD JULY 2018
 FIXED ROUTE DASHBOARD JULY 2018 Safety Max Target Goal Preventable Collisions per 100k Miles Non-Preventable Collisions per 100k Miles Total Incidents per 10,000 Boardings 1.6 1.3 0.8 2.63 2.1 2.0 1.60
AUGUST 2008 MONTHLY PASSENGER AND CARGO STATISTICS
 Inter-Office Memo Reno-Tahoe Airport Authority Date: October 2, 2008 To: Statistics Recipients From: Tom Medland, Director Air Service Business Development Subject: RENO-TAHOE INTERNATIONAL AIRPORT PASSENGER
Mobile Farebox Repair Program: Setting Standards & Maximizing Regained Revenue
 Mobile Farebox Repair Program: Setting Standards & Maximizing Regained Revenue Michael J. Walk, Chief Performance Officer Larry Jackson, Directory of Treasury Maryland Transit Administration March 2012
DASHBOARD DEC YOUR MONTHLY UPDATE FOR IOWA ONE CALL
 Executive Summary Per the Board s request, we have added this Executive Summary to the Monthly Dashboard. We ll be including it from now on. It will provide you with a running total of the number of tickets
SOUTH INTERCHANGE AREA
 Santaquin City General Plan 1 Location and Characteristics The South Interchange Area of Santaquin is located west of Interstate 15 and south of 500 South (Figure 1). It includes properties already annexed
Tolling in Washington State. Craig J. Stone, P.E. Assistant Secretary, Toll Division
 Tolling in Washington State Craig J. Stone, P.E. Assistant Secretary, Toll Division Connecticut Department of Transportation Bridgeport, CT June 4, 2014 Tolling in Washington State Tolling is part of Washington
Manual vs. Automatic Operation and Operational Restrictions
 Customer Services, Operations, and Safety Committee Board Information Item IV-B March 11, 2010 Manual vs. Automatic Operation and Operational Restrictions Page 81 of 91 Washington Metropolitan Area Transit
12, 14 and 16 York Street - Amendments to Section 16 Agreement and Road Closure Authorization
 REPORT FOR ACTION 12, 14 and 16 York Street - Amendments to Section 16 Agreement and Road Closure Authorization Date: April 27, 2018 To: Toronto and East York Community Council From: Senior Strategic Director,
Produced by: Destination Research Sergi Jarques, Director
 Produced by: Destination Research Sergi Jarques, Director Economic Impact of Tourism Epping Forest - 2014 Economic Impact of Tourism Headline Figures Epping Forest - 2014 Total number of trips (day & staying)
Multimodal Planning Studies
 Multimodal Planning Studies Commuter Park and Ride Study Steering Committee Meeting June 6, 2013 Agenda 1. Update on Project Schedule 2. Update on Online Interactive Mapping 3. Key Themes from the Open
January 2018 Air Traffic Activity Summary
 January 2018 Air Traffic Activity Summary Jan-2018 Jan-2017 CY-2018 CY-2017 Passengers 528,947 505,421 4.7% 528,947 505,421 4.7% Passengers 537,332 515,787 4.2% 537,332 515,787 4.2% Passengers 1,066,279
A Tour Across America s Managed Lanes Mike Heiligenstein, Executive Director Central Texas Regional Mobility Authority
 A Tour Across America s Managed Lanes Mike Heiligenstein, Executive Director Central Texas Regional Mobility Authority IBTTA Global Tolling Summit; Salzburg, Austria September 6, 2018 The Rise of Managed
PURPOSE AND NEED (CONCURRENCE POINT 1) NEW CANADA ROAD PROJECT FROM STATE ROUTE 1 (U.S. HIGHWAY 70) TO U.S. INTERSTATE 40
 NEW CANADA ROAD PROJECT FROM STATE ROUTE 1 (U.S. HIGHWAY 70) TO U.S. INTERSTATE 40") PURPOSE AND NEED (CONCURRENCE POINT 1) NEW CANADA ROAD PROJECT FROM STATE ROUTE 1 (U.S. HIGHWAY 70) TO U.S. INTERSTATE 40 Project Description The primary purpose of this project is to improve the major
PURPOSE AND NEED (CONCURRENCE POINT 1) NEW CANADA ROAD PROJECT FROM STATE ROUTE 1 (U.S. HIGHWAY 70) TO U.S. INTERSTATE 40 Project Description The primary purpose of this project is to improve the major
McLean Citizens Association Transportation Committee Project Briefing
 McLean Citizens Association Transportation Committee Project Briefing November 10, 2015 Project Map 2 Project Context Only Interstate in the Country limited to HOV only traffic during rush hours Stoplight
Risk Assessment in Winter Backcountry Travel
 Wilderness and Environmental Medicine, 20, 269 274 (2009) ORIGINAL RESEARCH Risk Assessment in Winter Backcountry Travel Natalie A. Silverton, MD; Scott E. McIntosh, MD; Han S. Kim, PhD, MSPH From the