Evaluating Lodging Opportunities
|
|
|
- Hilary Collins
- 6 years ago
- Views:
Transcription

1 Evaluating Lodging Opportunities This section explores market opportunities for new lodging accommodations in the downtown area. It will help you understand travel and visitation trends, existing competition, traveler market segments in the area, and projected room night demand. This section will help you project the occupancy and average room rate, key variables in determining the viability of a new hotel downtown. Hotels can be an extremely valuable addition to a downtown area. They bring leisure visitors and business people to the heart of a community. They can fill a compelling market need by accommodating visitors to area businesses and institutions. Hotels can generates sales for nearby retail and service businesses and capture tourism dollars in the community. Hotels also generate significant tax revenues while creating many new jobs for local residents. Because of their central location, downtowns often provide great market opportunities for hotel development. Downtown sites are typically within close proximity to businesses and industry, colleges, hospitals, attractions, services and entertainment. These are important generators of room-night demand. Market conditions in your area have a significant impact on the feasibility of a new hotel. The strength of the local lodging market affects how many rooms you can sell and the rates that you can charge. This section will help you analyze your market so that you can gauge the market potential of a new lodging facility in your community. This analysis is especially important in demonstrating the potential of downtown locations, as many lodging developers often prefer suburban or highway sites. 1
2 This section will help you collect and analyze information as part of a lodging market analysis. The analysis is tailored to the hotel/motel industry and should answer the following: What trends are occurring in the lodging industry? Are local economic and visitation trends favorable? Who are the competitors and how successful are they? What are the potential lodging market segments in the area? What occupancy and average room rate could a new property achieve? Using your projections of occupancy and average room rate, you can estimate whether a new lodging facility would make financial sense in your downtown. The material that follows include data collection and analysis techniques as outlined in the flowchart. While the part on projecting sales volume should be the final step, the other parts can be completed in any order. Learn more: Lodging Consumer Trends Market Area Business and Tourism Activity Lodging Demand Analysis by Segment Lodging Competition Analysis Location Analysis Project Refinement Sales Projection Analyzing the Results Appendix - Using GIS to Demonstrate Downtown s Location Advantage 2
3 Lodging Consumer Trends Market Area Business and Tourism Activity Lodging Demand Analysis by Segment Lodging Competition Analysis Lodging Demand (Room nights) Lodging Supply (Room Nights) Location Analysis Project Refinement Sales Projection Assessment of Lodging Opportunities Process of Evaluating Lodging Opportunities 3
4 Lodging Consumer Trends National and regional industry trends need to be considered as they may affect the profitability of a new lodging operation in your community. Relevant trends might include the growth in demand for overnight accommodations, changes in travelers lodging needs, and new, innovative properties that are opening around the country. There are various sources of trend information including the American Hotel and Lodging Association; state and local hotel/motel associations; hospitality industry libraries available at many colleges and universities; industry publications (such as Cornell Hotel and Restaurant Quarterly, Hotel & Motel Management and Lodging); web sites such as hotel-online.com. Other industry related research provided by accounting and consulting firms specializing in the lodging industry (such as Smith Travel Research and Pannell Kerr Forster). The following provides a sample of topics you might want to study as part of your market analysis. Be sure to expand this list as needed. Growth in Industry - limited service vs. full service, chain vs. independent, downtown vs. suburban, etc. Market Demand - occupancy and room rates, business travel trends, leisure travel trends, group travel trends, and lodging preferences of various market segments. Market Supply - aging of existing lodging facilities, new types of properties, growth in number of properties, and alternative lodging accommodations (such as bed & breakfast operations and inns). Success and Failure Factors - service, facilities, amenities, pricing practices, reservation systems, efficient property sizes, debt-to-sales and other financing statistics 4
5 Market Area Business and Tourism Activity Hotels that primarily serve business travelers usually rely on the strength of the local business community. The size, stability and diversity of major local employers are important factors that should be researched. Plans for future business development should also be studied including growth in professional and technical employment. Local planning officials and chambers of commerce are good sources for this information. Ask for information to help you understand trends over the past ten years and the future outlook. Hotels in resort areas typically rely on local attractions to bring in customers. Attractions may include natural or scenic sites, recreational activities, cultural or historic sites, special events and shopping and entertainment. Operators of these attractions can sometimes provide you with estimates of attendance and seasonality trends. An analysis of the transportation network serving the market area is also important. Existing streets and highways and proposed improvements should be identified. Distances to feeder markets (where the guests originate) may be particularly important for resort hotels. Local economic and demographic trends should also be considered. Examine the following market area characteristics and include all information relevant to a new property in your community. Use several years data to identify trends. Business and Economic Characteristics - room tax collections, * eating and drinking place sales, retail sales, employment (levels, types, major employers), office/industrial space occupied, and exiting and future major employers. Tourism and Recreation Characteristics - visitation to parks, lakes, beaches, museums, casinos, festivals and events and other attractions. Transportation Factors - distance from major cities, traffic counts, airport service, ferry volume and passenger rail volume. *Municipal room tax collections can provide you with a measure of the growth in lodging revenues during the past three to five years. This is typically a reliable source of data to supplement your analysis of area competition. 5
6 Lodging Demand Analysis by Segment Based on local business and tourism activity, you should identify what market segments of overnight guests visit your community. These market segments typically fall into four categories: business, leisure, group, and other. Business Travelers Business travelers represent a large portion of lodging demand in many market areas. They include people traveling on business representing commercial, industrial and governmental organizations. Peak business demand is usually experienced Monday through Thursday nights. It is important to understand why business travelers are visiting the market area and how many room nights they generate. Reasons for visiting a particular area might include conducting business with a local company (recruiting, training and management meetings); calling on multiple businesses (by suppliers, vendors and sales representative); and stopping over between destinations. Interviews with local business representatives can be the most effective way to estimate how many room nights they might generate. Questions to ask include: type of visitors, frequency of visits, length of stay, where most visitors tend to stay and what rate range is acceptable. Leisure Travelers Leisure travelers may visit an area for a vacation, to attend sporting or social events, to shop, or to visit friends and relatives. They might be staying over simply because they are traveling to other destinations. Leisure travelers may be individuals, couples, families, or small groups. Travelers visiting hospitals and universities are typically included in this market segment. Leisure room demand is often seasonal. In larger, more urban market areas, leisure room demand may be limited to weekends, summer months and holiday periods. To measure the significance of leisure demand in your market area, interview the local visitor bureau, chamber of commerce and local event and attraction operators. Also, study variations in room rates by day of week and time of year. Higher rates usually indicate periods of higher occupancy. Finally, inspect local hotels to determine if they have been designed to serve leisure travelers. Recreational facilities such as pools, fitness centers, tennis courts, snowmobile trails and other features may indicate the importance of leisure travelers to a particular property. Group Meeting Travelers The group market consists of both leisure and business travelers. Leisure groups include bus tours, school activities, athletic events, etc. Tour groups are often brought to an area for sightseeing and attending special events. Local attractions that appeal to leisure tour groups may have records of the numbers and names of tour operators who have visited their 6
7 attractions. The National Tour Association and American Bus Association, among others, can provide information on tour activity. Business group meetings are typically associated with conferences, board meetings, training programs, seminars, trade shows, and other gatherings. Often the sponsoring organization will be from the local area. Out-of-town organizations may use local meeting facilities because they often rotate the sites of their regional meetings. Information on the group meeting market can be obtained through state chapters of Meeting Planners International and the American Society of Association Executives. Your community s convention and visitors bureau or chamber of commerce can usually provide a good estimate of local group meeting activity. Other Travelers Various lodging customers cannot be classified under the categories of business, leisure, or group. These travelers may include construction workers, truckers, utility crews, airline personnel and others. Activity at local truck stops, distribution centers, long term construction projects and other sources of demand could help you estimate the significance of this market segment. 7
8 Lodging Competition Analysis The most important part of a lodging market analysis is the study of current and proposed competition. The operating performance of existing local competition is a key indicator of market potential. Conduct interviews with area hotel operators to effectively complete this part of your study. An important part of your competition analysis is estimating the monthly and annual operation performance of each competitive property. Performance can be measured in terms of occupancy percent and average daily room rate. Occupancy Percent = number of rooms sold / number of rooms available Average Daily Room Rate = total room revenue / number of rooms sold In addition to occupancy and average room rates, each operation should be carefully studied to determine its strengths, weaknesses and competitive position in the market area. Information on your competition can be obtained from interviews with management, hotel websites, American Automobile Association Tourbook, Mobil Travel Guide, and state and local lodging directories. You should also investigate any plans for other new lodging operations in the area. Too many new rooms can lead to depressed occupancy levels and "price wars. Local planners and the development departments of hotel companies are usually aware of developments proposed for your community. The following items will help you analyze each competitor. Location - proximity to sources of lodging demand, accessibility, visibility and surrounding neighborhood Facility - age, exterior appearance and condition, interior appearance and condition, cleanliness, signage, types of rooms (suites, standard room,...), food and beverage outlets, function rooms and recreation (pool, fitness center) Service - quality of service and extra services offered Operating Information (from managers) - weekday vs. weekend demand patterns, historical occupancy growth or decline, monthly occupancy levels, number of 100% occupancy days per month, average room rate per month (after any discounts), major market segments served per month and major sources of demand General Information - number of rooms, months open, published rates, franchise affiliation, ratings in travel guides, local reputation and plans for expansion or improvements 8
9 Location Analysis Location is a critical consideration because it impacts your ability to draw customers. It is important that your location be visible, accessible, convenient and attractive to your market. Surrounding land uses are important for all types of lodging operations. High traffic volume is very important. Aesthetics of the area, noise, safety and other factors should be considered. How you evaluate your location will depend on the type of property you are considering and the customers you hope to serve. Hotels benefit from high visibility and proximity to generators of room night demand. Local colleges, hospitals, attractions, services and entertainment are examples of room night demand generators. Be sure to consider future growth patterns when analyzing your location. Hotels in resort areas generate most of their business form leisure travelers who see the lodging facility and surrounding area as their destination. Access and visibility, while important, are secondary to the quality of the facility, services, amenities, and nearby attractions. Different types of lodging operations will have different location requirements. Analyze your location using the factors listed below. Be sure to consider other location criteria to your particular hotel development. Description of Immediate Area - commercial profile, adjacent land uses, proposed developments, safety, and availability of nearby services (food, services, shopping) Proximity to Demand Generators - businesses, colleges, hospitals and other institutions, convention facilities, and tourist attractions (museums, historical sites, recreation). Traffic Volume - highway/street traffic counts and traffic patterns Accessibility - proximity to major streets and highways, ease of entrance and exit Other Issues - Site size and social, political and environmental concerns related to development downtown. 9
10 Project Refinement In planning for a new downtown hotel, it is essential to understand the lodging needs of people visiting your community. Using data already gathered, this part will help you refine your proposed hotel concept so that it can effectively serve your market area. Segments of the industry include luxury, full service, midmarket, economy, resort, extended stay and subcategories of these hotels. It is important to match the lodging concept (or segment) considered with the needs of travelers to the area. For example, the extended stay hotel concept works best in areas with a high concentration of office and corporate headquarters that bring in people for longer stays. One of the most important considerations in refining your hotel project is estimating the total number of guestrooms. Optimum room size is dependent on a number of variables including market area room demand as measured by occupancy rates; financial resources available to the developer and minimum room size allowed by a franchiser. Keeping the project within the optimum size range will help ensure financial success while reducing the risk of over-building within a market area. Using the items below identify development criteria for a new hotel in your downtown area. Affiliation - independent or chain. Product Category - limited or full service Room Type and Number - standard rooms, suites and specialty rooms Amenities and Facilities - restaurant and lounge, function facilities, recreation (pool and fitness center). Market Area to be Served - as defined by primary competition. Market Segments to be Served - business, leisure, group and other categories. Expected Price Range - peak and slow periods 10
11 Sales Projection Room sales in a hotel are a function of occupancy percent and average room rate as defined earlier. A key indicator of future performance is past performance of other properties in the market area. The steps that follow will help you estimate your occupancy, room rate and resulting sales potential. Step 1: Project Market Area Annual Occupancy Project the occupancy for your entire market area for the coming year using the following procedure. See the following example as a guide for projecting market area occupancy. A. Under Area Hotels, list all of the competitive properties in your market area. If you are an existing operator, be sure to include your own property. B. For each property, record the Days open, Rooms in the property, and the estimated Occupancy Percent. C. For each property, calculate and record the number of Rooms Available per year by multiplying Days Open by Rooms. Sum the Rooms Available column. D. For each property, calculate and record the number of Rooms Sold per year by multiplying Rooms Available by Occupancy Percent. Sum the Rooms Sold column. E. Calculate the current market occupancy by dividing the sum of Rooms Sold by Rooms Available. F. Looking ahead to next year, record any additional rooms (New Room Supply) that will be added to the market area. Include your planned downtown hotel here. G. For next year, record additional growth in room night demand that might occur as a result of improving economic conditions, tourism visitation, or simply as a result of having new lodging rooms added to the market area. H. Record the Total Area Rooms Available and Rooms Sold for next year (current year totals plus additions from steps F and G). Calculate next years market occupancy by dividing Rooms Sold by Rooms Available. 11
12 Current Year 2011 Lodging Supply: Lodging Demand: Area Hotels Days Rooms Room Avail x Occupancy =Rooms Sold Hotel Midtown ,200 68% 19,856 Downtown Inn ,375 69% 18,889 Roadside Inn ,425 70% 11,498 Traveler s Inn ,600 62% 9,052 Highway Motel ,950 66% 7,227 Suburban Inn ,300 58% 4,234 Total Area 105,850 67% 70,755 Next Year 2012 New Room Supply , New Room Demand ,650 Total Area 127,750 58% 74,405 Example Projection of Market Area Occupancy 12
13 Step 2: Project Your Property's Capture of Market Area Annual Occupancy Based on your hotel's relative strengths and weaknesses, determine if a downtown property will achieve an occupancy higher or lower than the market occupancy projected in step one. Compare your proposed operation with the competitive properties in your market area using the criteria in the example Strengths-Weaknesses grid (see grid below). Be sure to keep in mind the types of travelers that make up local lodging demand. Then, estimate your proposed property's occupancy projection based on these strengths and weaknesses. Competitive Strength Competitive Weakness Immediate area - X Proximity to demand X Traffic volume X - Accessibility X - Visibility X - Building Appearance X Guest Rooms X Reputation and Ratings - X Franchise Affiliation - X Management - X Maintenance X Projected Annual Occupancy: Market Area 58% Proposed Property 64% Example Strengths-Weaknesses Grid to Evaluate Proposed Property 13
14 Step 3: Check the Reasonableness of Your Occupancy Projection Once you have projected your annual occupancy, determine if it is reasonable given the historic seasonal demand patterns in the market area. First, identify the seasonal trends for each market segment. Based on these demand patterns, estimate monthly occupancy levels. The average occupancy level for the 12 months should be similar to your annual projection in step 2. See the following example. Jan Feb Mar Apr May Jun Jul Aug Sep Oct Nov Dec Seasonality - Indicate Peak-Season (P), Middle-Season (M) or Off-Season (O): Business M M M P P P O O P P M O Leisure M M O O M P P P M M O O Group O O M M P P O O P P M O Rooms Available: Days Open x Rooms = Avail. 3,100 2,800 3,100 3,000 3,100 3,000 3,100 3,100 3,000 3,100 3,000 3,100 Annual Total = 36,500 rooms available Rooms Sold: x Occ % 45% 45% 35% 60% 80% 85% 90% 90% 75% 65% 50% 45% = Sold 1,395 1,2260 1,395 1,050 1,860 2,400 2,635 2,790 2,700 2,325 1,950 1,550 Annual Total = 23,310 rooms sold or 64% occupancy Example Occupancy Reasonableness Check 14
15 Step 4: Project Your Average Room Rate Effective pricing is critical in the lodging business as increases or decreases in rates have a major impact on the bottom-line. Setting prices to maximize profit is an important process that requires consideration of the rates charged by competitors and the price sensitivity of travelers to the area. The following four steps will help ensure that you are competitively priced relative to your competition. Analyze your expected market segments. What factors do they consider when choosing a lodging facility (such as location, service, condition, and affiliation)? Compare your expected quality level and appeal with that of your competitors. Make this comparison using the factors identified in step 2. Analyze the room rates charged by your competitors. Consider single and double rates, discounting, and variations in rates by season. Estimate their average annual room rate. Project your average annual room rate by considering the rates and quality levels of your competitors. Your rates must be acceptable to the market segments you are targeting. 15
16 Step 5: Project and Analyze Your Sales After you have developed projections of occupancy and average room rate, you will be able to calculate the projected room revenue. These performance estimates can then be compared with industry standards to determine whether the project would be attractive to a developer. See the following example. Proposed Hotel Industry Average Projected Annual Occupancy 64% 67% x Number of Rooms in Your Hotel or Motel x Days Open x Average Room Rate $85 $75 = Projected Annual Room Revenue $2,000,000 _ Revenue per Available Room (RevPar) $55 $50 Example Projection of Sales and Comparison to Industry 16
17 Analyzing the Results Once your calculations are complete, compare your annual occupancy, average room rate and RevPar projections with state and national averages (see "industry trends" earlier in this section). Study these projections carefully to make sure they are realistic. If your projections are near or above the state or national averages for the type of property you are proposing, lodging should be considered a possible market opportunity for your downtown area. While more detailed feasibility work will be needed, this assessment should provide developers with an important market overview of lodging development opportunities downtown. 17
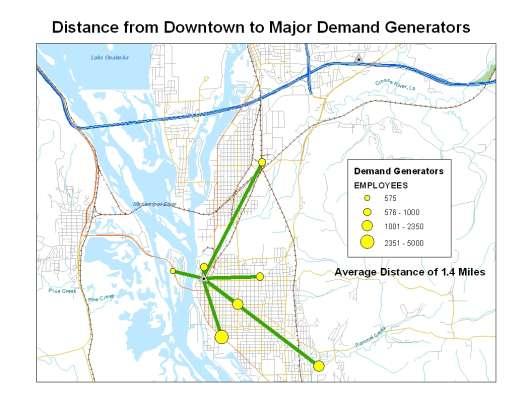
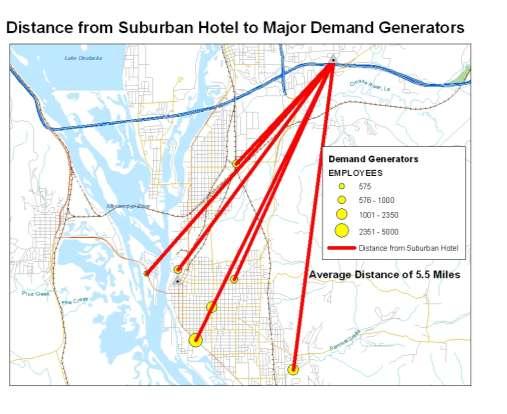
18 Appendix - Using GIS to Demonstrate Downtown s Location Advantage Downtown hotels often have location advantages over suburban properties. They are often closer to major demand generators such as hospitals, colleges and large employers. In addition they often have a high concentration of dining, entertainment, retail, and other services that complement a visitor s overnight stay. GIS can be used to identify these advantages and provide data to prospective investors as a means of attracting development downtown. One method of demonstrating downtown s location advantage is to measure its proximity to local lodging demand generators. This can be done using GIS as follows: Identify a point that represents the center of the downtown area Identify a point that represents the concentration of suburban hotels Identify points that represent major demand generators in the community Measure the average distance from downtown to the major demand generators Measure the average distance from the suburban hotels to the major demand generators Compare downtown with the suburban hotels to determine its proximity advantage Using GIS, this analysis could be presented as illustrated on the maps that follow. Based on this analysis, downtown is significantly closer to the main demand generators identified (average distance of 1.4 miles from downtown compared to 5.5 miles from the suburban location). This supports the argument to locate a hotel downtown because it is centrally located and closer to the major demand generators in the community. 18
19 19
20 About the Toolbox and this Section The 2011 update of the Downtown and Business District Market Analysis toolbox is a result of a collaborative effort involving University of Minnesota Extension, Ohio State University Extension, and University of Wisconsin Extension. The updated toolbox was supported with funding from the North Central Regional Center for Rural Development. The toolbox is based on and supportive of the economic restructuring principles of the National Trust Main Street Center. The Wisconsin Main Street Program (Wisconsin Department of Commerce) has been an instrumental partner in the development of this toolbox. This section was written by Bill Ryan of the University of Wisconsin-Extension. May 31,
An outdoor waterpark is a facility offering three or more waterslides and other aquatic facilities.
 Methodology for Feasibility Studies for Waterparks By David J. Sangree, MAI, CPA, ISHC Before a developer or an organization considers constructing a new indoor or outdoor waterpark at a resort or standalone,
CHAPTER FIVE PROSPECTS FOR FUTURE ECONOMIC DEVELOPMENT
 CHAPTER FIVE PROSPECTS FOR FUTURE ECONOMIC DEVELOPMENT 5.1 GENERAL The recommended type and location of future land uses in Alpine should, in part, consider potential opportunities for future economic
Maury County, TN. Hotel, Restaurant, and Travel Industries: Economic Profile and Business Trends, Maury County (Columbia and Spring Hill area)
") Maury County, TN Maury County (Columbia and Spring Hill area) Hotel, Restaurant, and Travel Industries: Economic Profile and Business Trends, 06 Steve Morse, Ph.D. Director & Economist Tourism Institute
Maury County, TN Maury County (Columbia and Spring Hill area) Hotel, Restaurant, and Travel Industries: Economic Profile and Business Trends, 06 Steve Morse, Ph.D. Director & Economist Tourism Institute
Loudon County, TN. Hotel, Restaurant, and Travel Industries: Economic Profile and Business Trends, Loudon County (Loudon and Lenoir City areas)
") Loudon County, TN Loudon County (Loudon and Lenoir City areas) Hotel, Restaurant, and Travel Industries: Economic Profile and Business Trends, Steve Morse, Ph.D. Director & Economist Tourism Institute
Loudon County, TN Loudon County (Loudon and Lenoir City areas) Hotel, Restaurant, and Travel Industries: Economic Profile and Business Trends, Steve Morse, Ph.D. Director & Economist Tourism Institute
1. Hotel Trends Occupancy Rate
 Introduction The Louisiana Travel Pulse is a seasonal industry travel barometer designed to present recent trends in travel industry performance. This issue s emphasis is on the Spring 2002 season (March-May).
Yukon Tourism Indicators Year-End Report Yukon Tourism Indicators Year-End Report 2015
 Yukon Tourism Indicators Overview The Yukon Tourism Indicators is published by the Department of Tourism and Culture as a companion to the monthly Yukon Tourism Visitation Report. This document is intended
Estimating Tourism Expenditures for the Burlington Waterfront Path and the Island Line Trail
 A report by the University of Vermont Transportation Research Center Estimating Tourism Expenditures for the Burlington Waterfront Path and the Island Line Trail Report # 10-003 February 2010 Estimating
Business Growth (as of mid 2002)
") Page 1 of 6 Planning FHWA > HEP > Planning > Econ Dev < Previous Contents Next > Business Growth (as of mid 2002) Data from two business directories was used to analyze the change in the number of businesses
Page 1 of 6 Planning FHWA > HEP > Planning > Econ Dev < Previous Contents Next > Business Growth (as of mid 2002) Data from two business directories was used to analyze the change in the number of businesses
Cheatham County, TN. Hotel, Restaurant, and Travel Industries: Economic Profile and Business Trends, 2006
 Cheatham County, TN Cheatham County (Kingston Springs & Ashland City areas) Hotel, Restaurant, and Travel Industries: Economic Profile and Business Trends, Steve Morse, Ph.D. Director & Economist Tourism
PROJECTED UTILIZATION OF THE PROPOSED HOTEL
 PROJECTED UTILIZATION OF THE PROPOSED HOTEL The supply and demand analysis included general overviews of the Frostburg, Maryland market area, a detailed analysis of the properties projected to provide
2009 Muskoka Airport Economic Impact Study
 2009 Muskoka Airport Economic Impact Study November 4, 2009 Prepared by The District of Muskoka Planning and Economic Development Department BACKGROUND The Muskoka Airport is situated at the north end
Produced by: Destination Research Sergi Jarques, Director
 Produced by: Destination Research Sergi Jarques, Director Economic Impact of Tourism Oxfordshire - 2015 Economic Impact of Tourism Headline Figures Oxfordshire - 2015 Total number of trips (day & staying)
2017/ Q1 Performance Measures Report
 2017/2018 - Q1 Performance Measures Report Contents Ridership & Revenue... 1 Historical Revenue & Ridership... 1 Revenue Actual vs. Planned... 3 Mean Distance Between Failures... 5 Maintenance Cost Quarter
Oct-17 Nov-17. Travel is expected to grow over the coming 6 months; at a slower rate
 Analysis provided by TRAVEL TRENDS INDEX OCTOBER 2018 CTI reading of 51.6 in October 2018 indicates that travel to or within the U.S. grew 3.2% in October 2018 compared to October 2017. LTI predicts travel
Jan-18. Dec-17. Travel is expected to grow over the coming 6 months; at a slower rate
 Analysis provided by TRAVEL TRENDS INDEX DECEMBER 2018 CTI reading of 51.8 in December 2018 indicates that travel to or within the U.S. grew 3.6% in December 2018 compared to December 2017. LTI predicts
Produced by: Destination Research Sergi Jarques, Director
 Produced by: Destination Research Sergi Jarques, Director Economic Impact of Tourism Epping Forest - 2014 Economic Impact of Tourism Headline Figures Epping Forest - 2014 Total number of trips (day & staying)
Produced by: Destination Research Sergi Jarques, Director
 Produced by: Destination Research Sergi Jarques, Director Economic Impact of Tourism Oxfordshire - 2016 Economic Impact of Tourism Headline Figures Oxfordshire - 2016 number of trips (day & staying) 27,592,106
Compustat. Data Navigator. White Paper: Lodging Industry-Specific Data
 Compustat Data Navigator White Paper: Lodging Industry-Specific Data November 2008 Data Navigator: Lodging Industry-Specific Data There are several important lodging metrics to that are unavailable on
Oct-17 Nov-17. Sep-17. Travel is expected to grow over the coming 6 months; at a slightly faster rate
 Analysis provided by TRAVEL TRENDS INDEX SEPTEMBER 2018 CTI reading of.8 in September 2018 indicates that travel to or within the U.S. grew 1.6% in September 2018 compared to September 2017. LTI predicts
Destination Marketing and the Lodging Industry STANDARD 2
 Destination Marketing and the Lodging Industry STANDARD 2 Marketing The process of developing, promoting, and distributing products to satisfy customers needs and wants. It is a series of activities that
NAPA VALLEY VISITOR INDUSTRY 2016 Economic Impact Report
 NAPA VALLEY VISITOR INDUSTRY 2016 Economic Impact Report Research prepared for Visit Napa Valley by Destination Analysts, Inc. Table of Contents S E C T I O N 1 Introduction 2 S E C T I O N 2 Executive
Resort Municipality Initiative Annual Report 2015
 Resort Municipality Initiative Annual Report 2015 Submitted by: City of Rossland in association with Tourism Rossland Prepared by: Deanne Steven Acknowledgements The City of Rossland would like to thank
Produced by: Destination Research Sergi Jarques, Director
 Produced by: Destination Research Sergi Jarques, Director Economic Impact of Tourism North Norfolk District - 2016 Contents Page Summary Results 2 Contextual analysis 4 Volume of Tourism 7 Staying Visitors
Produced by: Destination Research Sergi Jarques, Director
 Produced by: Destination Research Sergi Jarques, Director Economic Impact of Tourism Norfolk - 2016 Contents Page Summary Results 2 Contextual analysis 4 Volume of Tourism 7 Staying Visitors - Accommodation
Measures & Projections October 31, GoToBermuda.com
 Measures & Projections October 31, 2015 GoToBermuda.com October Total Vacation Visitor Arrivals Vacation Arrivals Oct-14 Oct-15 2015 Air Vacation 9,203 10,344 1,141 12.40 126,842 127,044 202 0.16 Cruise
Tourism Statistics RTO 1
 Tourism Statistics RTO 1 Tourism Research Unit Spring 2012 1 1 Ontario Tourism 2 2 Ontario Tourism Indicators 2011* Visits increased by 1.3% to 104.4 million. Visits from Ontario and overseas countries
Atlantic City Tourism Performance Indicators (AC-TPI) nd Quarter
 nd Quarter") Atlantic City Tourism Performance Indicators (AC-TPI) 20 2nd Quarter Prepared by Brian J. Tyrrell, Ph.D. Supported by Rummy Pandit, M.B.A., L.P.D., C.H.A. Executive Director Atlantic City Tourism Performance
Atlantic City Tourism Performance Indicators (AC-TPI) 20 2nd Quarter Prepared by Brian J. Tyrrell, Ph.D. Supported by Rummy Pandit, M.B.A., L.P.D., C.H.A. Executive Director Atlantic City Tourism Performance
Atlantic City Tourism Performance Indicators (AC-TPI) 2014 Year End
 2014 Year End") Atlantic City Tourism Performance Indicators (AC-TPI) 2014 Year End Prepared by Brian J. Tyrrell, Ph.D. Supported by Israel Posner, Ph.D. Executive Director Atlantic City Tourism Performance Indicators
Atlantic City Tourism Performance Indicators (AC-TPI) 2014 Year End Prepared by Brian J. Tyrrell, Ph.D. Supported by Israel Posner, Ph.D. Executive Director Atlantic City Tourism Performance Indicators
HOTEL INDUSTRY OVERVIEW. Texas
 HOTEL INDUSTRY OVERVIEW Texas DEMAND GROWTH STRONG BALANCED OCC & ADR GROWTH % Change Room Supply* 149M 1.3% Room Demand* 92M 5.6% Occupancy 61.6% 4.3% A.D.R. $90 4.4% RevPAR $55 8.9% Room Revenue* $8.3B
EFFECTS OF CITYWIDE CONVENTIONS ON DOWNTOWN VANCOUVER HOTELS IN 2016
 EFFECTS OF CITYWIDE CONVENTIONS ON DOWNTOWN VANCOUVER HOTELS IN 2016 NICOLETTE DOUGLAS CONSULTING APRIL 2017 TABLE OF CONTENTS EXECUTIVE SUMMARY... 3 BACKGROUND AND PURPOSE... 6 APPROACH... 6 ANALYSIS...
NAPA VALLEY VISITOR INDUSTRY 2014 Economic Impact Report
 NAPA VALLEY VISITOR INDUSTRY 2014 Economic Impact Report Research prepared for Visit Napa Valley by Destination Analysts, Inc. Table of Contents SECTION 1 Introduction 2 SECTION 2 Executive Summary 5 SECTION
Visit Phoenix Market Update January Eric Kerr Director of Research & Business Analysis
 Visit Phoenix Market Update January 2019 Eric Kerr Director of Research & Business Analysis Visitation totals 2012-2017 & Spending trends Hotel Market Overview YTD - November Chain scales, Submarkets,
Downtown Hotel Development
 Downtown Hotel Development Emerging Opportunities for Small & Medium Size Cities National Extension Tourism Conference, June 15, 2009 Bill Ryan, University of Wisconsin-Extension Bill Way, University of
Note: These Louisiana indicators show the percentage difference from Second Quarter 2004 to Second Quarter 2005.
 Second Quarter 2005 The Louisiana Travel Pulse is a quarterly industry travel barometer designed to present recent trends in travel industry performance. This issue s emphasis is on the Second Quarter
Produced by: Destination Research Sergi Jarques, Director
 Produced by: Destination Research Sergi Jarques, Director Economic Impact of Tourism Norfolk - 2017 Contents Page Summary Results 2 Contextual analysis 4 Volume of Tourism 7 Staying Visitors - Accommodation
Panama City Beach Travel Market Economic Impact Report. Prepared for: Panama City Beach Convention & Visitors Bureau
 Panama City Beach 2016 Travel Market Economic Impact Report Presented by: Berkeley Young, President Young Strategies, Inc. Data Analysis: Larry D. Gustke, PhD Steve Morse, PhD Prepared for: Panama City
HOTEL MARKET SUPPLY AND DEMAND ANALYSIS
 HOTEL MARKET SUPPLY AND DEMAND ANALYSIS February 4th, 2010 Daniel H. Lesser Senior Managing Director Industry Leader Hospitality & Gaming Group CB Richard Ellis, Inc. One Penn Plaza, Suite 1835 New York,
Commissioned by: Economic Impact of Tourism. Stevenage Results. Produced by: Destination Research
 Commissioned by: Produced by: Destination Research www.destinationresearch.co.uk December 2016 Contents Page Introduction and Contextual Analysis 3 Headline Figures 5 Volume of Tourism 7 Staying Visitors
The Travel and Tourism Industry in Vermont. A Benchmark Study of the Economic Impact of Visitor Expenditures on the Vermont Economy 2005
 The Travel and Tourism Industry in Vermont A Benchmark Study of the Economic Impact of Visitor Expenditures on the Vermont Economy 2005 INTRODUCTION GENERAL November, 2006 This 2005 update of the original
Panama City Beach CVB Travel Market Preliminary Report. Prepared for: Panama City Beach Convention & Visitors Bureau
 Panama City Beach CVB 2017 Travel Market Preliminary Report Prepared for: Panama City Beach Convention & Visitors Bureau Presented by: Berkeley Young, President Young Strategies, Inc. Larry D. Gustke,
Economic Impact of Tourism. Hertfordshire Results. Commissioned by: Visit Herts. Produced by:
 Commissioned by: Visit Herts Produced by: Destination Research www.destinationresearch.co.uk December 2016 Contents Page Introduction and Contextual Analysis 3 Headline Figures 5 Volume of Tourism 7 Staying
The Economic Impact of Tourism in Walworth County, Wisconsin. July 2013
 The Economic Impact of Tourism in Walworth County, Wisconsin July 2013 Key themes for 2012 The Walworth County, Wisconsin visitor economy continued its brisk growth in 2012. Visitor spending rose 11% after
Visit Loudoun 2016 Lodging Market Research
 2016 Lodging Market Research Prepared for: Loudoun County Lodging Market Research & Analysis Study Conducted: November December 2016 Final Report Submitted: December 2016 2016 Lodging Market Analysis Summary
Atlantic City Tourism Performance Indicators (AC-TPI) nd Quarter
 nd Quarter") Atlantic City Tourism Performance Indicators (AC-TPI) 2018 2nd Quarter Prepared by Brian J. Tyrrell, Ph.D. and Rummy Pandit, L.P.D., M.B.A., C.H.A. Executive Director Atlantic City Tourism Performance
Atlantic City Tourism Performance Indicators (AC-TPI) 2018 2nd Quarter Prepared by Brian J. Tyrrell, Ph.D. and Rummy Pandit, L.P.D., M.B.A., C.H.A. Executive Director Atlantic City Tourism Performance
1. Hotel Trends Occupancy Rate
 Summer 2004 The Louisiana Travel Pulse is a seasonal industry travel barometer designed to present recent trends in travel industry performance. This issue s emphasis is on the Summer 2004 season (June
49 May-17. Jun-17. Travel is expected to grow over the coming 6 months; at a slower rate
 Analysis provided by TRAVEL TRENDS INDEX MAY 2018 CTI reading of 51.7 in May 2018 shows that travel to or within the U.S. grew 3.4% in May 2018 compared to May 2017. LTI predicts moderating travel growth
Atlantic City Tourism Performance Indicators (AC-TPI) rd Quarter
 rd Quarter") Atlantic City Tourism Performance Indicators (AC-TPI) 2015 3rd Quarter Prepared by Brian J. Tyrrell, Ph.D. Supported by Rummy Pandit, M.B.A., L.P.D., C.H.A. Executive Director Atlantic City Tourism Performance
Atlantic City Tourism Performance Indicators (AC-TPI) 2015 3rd Quarter Prepared by Brian J. Tyrrell, Ph.D. Supported by Rummy Pandit, M.B.A., L.P.D., C.H.A. Executive Director Atlantic City Tourism Performance
1. Hotel Trends Occupancy Rate
 Fall 2003 The Louisiana Travel Pulse is a seasonal industry travel barometer designed to present recent trends in travel industry performance. This issue s emphasis is on the Fall 2003 season (SeptemberNovember
Great Wolf Lodge Fact Sheet & Frequently Asked Questions Potential Location in Gilroy, California 8/30/17
 WHAT? Great Wolf Resorts has identified Gilroy, California as a potential location for a new Great Wolf Lodge family resort and has entered into a 60-day period of exclusivity with the City and community
Region 2: Tourism Partnership of Niagara. Visitor Statistics Visitor Spending Statistics Hotel Statistics Tourism Related Establishments
 Region 2: Tourism Partnership of Niagara Visitor Statistics Visitor Spending Statistics Hotel Statistics Tourism Related Establishments http://www.mtc.gov.on.ca/en/research/rtp/rtp.shtml tourism.research@ontario.ca
Atlantic City Tourism Performance Indicators (AC-TPI) st Quarter
 st Quarter") Atlantic City Tourism Performance Indicators (AC-TPI) 2018 1st Quarter Prepared by Brian J. Tyrrell, Ph.D. and Rummy Pandit, L.P.D., M.B.A., C.H.A. Executive Director Atlantic City Tourism Performance
Atlantic City Tourism Performance Indicators (AC-TPI) 2018 1st Quarter Prepared by Brian J. Tyrrell, Ph.D. and Rummy Pandit, L.P.D., M.B.A., C.H.A. Executive Director Atlantic City Tourism Performance
AIR TRANSPORT MANAGEMENT Universidade Lusofona January 2008
 AIR TRANSPORT MANAGEMENT Universidade Lusofona Introduction to airline network planning: John Strickland, Director JLS Consulting Contents 1. What kind of airlines? 2. Network Planning Data Generic / traditional
Third Quarter Marketing Report B R A N SON/LAKES A R EA C VB N OVEMBER, 2013
 Third Quarter Marketing Report B R A N SON/LAKES A R EA C VB N OVEMBER, 2013 Economic Outlook +5.1% from July 2011 Consumer Confidence is Up 7% This Year Increasing from 66.7 in Dec to 71.2 Today +6.7%
Significant increase in accommodation activity but slightly less than in the previous month
 Tourism activity February 2015 15 April, 2015 Significant increase in accommodation activity but slightly less than in the previous month Hotel establishments recorded approximately 2.2 million overnight
Chattanooga & Hamilton Co. Tourism Trends & Economic Outlook
 Chattanooga & Hamilton Co. Tourism Trends & Economic Outlook How Tourism Works for Chattanooga, TN January 21, 2010 Presentation by: Steve Morse, Ph.D. Director & Economist, Tourism Institute University
Temecula Valley Travel Impacts
 Temecula Valley Travel Impacts 2000-2013p photo courtesy of Temecula Valley Convention and Visitors Bureau June 2014 Prepared for the Temecula Valley Convention and Visitors Bureau Temecula, California
State of the Shared Vacation Ownership Industry. ARDA International Foundation (AIF)
") State of the Shared Vacation Ownership Industry ARDA International Foundation (AIF) This paper includes a high-level overview of the timeshare industry with a core focus on financial growth, owner demographics
State of the Shared Vacation Ownership Industry ARDA International Foundation (AIF) This paper includes a high-level overview of the timeshare industry with a core focus on financial growth, owner demographics
Atlantic City Tourism Performance Indicators (AC-TPI) rd Quarter
 rd Quarter") Atlantic City Tourism Performance Indicators (AC-TPI) 2017 3rd Quarter Prepared by Brian J. Tyrrell, Ph.D. and Rummy Pandit, L.P.D., M.B.A., C.H.A. Executive Director Atlantic City Tourism Performance
Atlantic City Tourism Performance Indicators (AC-TPI) 2017 3rd Quarter Prepared by Brian J. Tyrrell, Ph.D. and Rummy Pandit, L.P.D., M.B.A., C.H.A. Executive Director Atlantic City Tourism Performance
TUI GROUP INVESTOR PRESENTATION
 TUI GROUP INVESTOR PRESENTATION German Investment Conference UniCredit / Kepler Munich, 26-27 September 2012 Future-related statements This presentation contains a number of statements related to the future
Atlantic City Tourism Performance Indicators (AC-TPI) th Quarter
 th Quarter") Atlantic City Tourism Performance Indicators (AC-TPI) 2016 4th Quarter Prepared by Brian J. Tyrrell, Ph.D. Supported by Rummy Pandit, L.P.D., M.B.A., C.H.A. Executive Director Atlantic City Tourism Performance
Atlantic City Tourism Performance Indicators (AC-TPI) 2016 4th Quarter Prepared by Brian J. Tyrrell, Ph.D. Supported by Rummy Pandit, L.P.D., M.B.A., C.H.A. Executive Director Atlantic City Tourism Performance
MARKET INSIGHTS UPDATE North America
 SPOTLIGHT ON: THE SHOULDER TRAVEL SEASON PG2 A monthly update including relevant information on travel industry trends, consumer and meetings market research, competitive intelligence, and Hawai i s performance
2017/2018 Q3 Performance Measures Report. Revised March 22, 2018 Average Daily Boardings Comparison Chart, Page 11 Q3 Boardings figures revised
 2017/2018 Q3 Performance Measures Report Revised March 22, 2018 Average Daily Boardings Comparison Chart, Page 11 Q3 Boardings figures revised Contents Ridership & Revenue... 1 Historical Revenue & Ridership...
Lodging and Conference Center Analysis ECONOMIC AND REAL ESTATE ANALYSIS FOR SUSTAINABLE LAND USE OUTCOMES
 Lodging and Conference Center Analysis ECONOMIC AND REAL ESTATE ANALYSIS FOR SUSTAINABLE LAND USE OUTCOMES Glossary of Lodging Facility Types Hotels & Inns Hotels and inns are primarily designed to meet
The Travel & Tourism Industry in Vermont
 The Travel & Tourism Industry in Vermont A Benchmark Study of the Economic Impact of Visitor Expenditures on the Vermont Economy 2003 Prepared by: Introduction In 2003 Establishing clear and useful performance
Cedar Rapids Area Convention and Visitors Bureau Visitor Study
 Cedar Rapids Area Convention and Visitors Bureau Visitor Study 2003-2004 University of Northern Iowa Sustainable Tourism & The Environment Program www.uni.edu/step Project Directors: Sam Lankford, Ph.D.
The Economic Impact of Travel in Kansas. Tourism Satellite Account Calendar Year 2013
 The Economic Impact of Travel in Kansas Tourism Satellite Account Calendar Year 2013 Who we are Tourism Economics Union of industry expertise and economic disciplines Real world insights based on quantitative
Billings Area COC. For the Month of December 2010 Date Created: Jan 18, 2011
 1 United Kingdom United States Blue Fin Building 735 East Main Street 110 Southwark Street Hendersonville London SE1 0TA TN 37075 Phone: +44 (0)20 7922 1930 Phone: +1 (615) 824 8664 Fax: +44 (0)20 7922
Occupancy in North Carolina
 Smith Travel Research Year-End 2009 Lodging Report Year-end 2009 hotel/motel occupancy was down -9.0% statewide from 2008. This represents a decrease of -12.2% since 2005. o The US occupancy was down -8.6%
The Economic Impact of Tourism in North Carolina. Tourism Satellite Account Calendar Year 2015
 The Economic Impact of Tourism in North Carolina Tourism Satellite Account Calendar Year 2015 Key results 2 Total tourism demand tallied $28.3 billion in 2015, expanding 3.6%. This marks another new high
Loudoun County Lodging Study
 Loudoun County Lodging Study Prepared for: Visit Loudoun Study Conducted: February - May, 2015 Report Submitted: June, 2015 YSI Lodging Research Methodology Young Strategies, Inc. (YSI) conducted a survey
The Economic Impact of Tourism in Buncombe County, North Carolina
 The Economic Impact of Tourism in Buncombe County, North Carolina 2017 Analysis September 2018 Introduction and definitions This study measures the economic impact of tourism in Buncombe County, North
RIDERSHIP TRENDS. August 2018
 RIDERSHIP TRENDS August Prepared by the Division of Strategic Capital Planning October Table of Contents Executive Summary...1 Ridership...3 Estimated Passenger Trips by Line...3 Estimated Passenger Trips
Main indicators kept growing
 September, 15 th 2016 Tourism Activity July 2016 Main indicators kept growing Hotel establishments recorded 2.1 million guests and 6.5 million overnight stays in July 2016, corresponding to year-onyear
SLOW GROWTH OF SOUTHERN NEVADA ECONOMY
 NEVADA S ECONOMY A monthly report produced for Commerce Real Estate Solutions by Stephen P. A. Brown, PhD, Center for Business & Economic Research, University of Nevada, Las Vegas To receive an electronic
Tourism Statistics Region 1
 Tourism Statistics Region 1 Tourism Research Unit Winter 2011 1 Summary In 2008, there were 101.0 million visits in and visitors spent $17.6 billion residents account for the majority of visits and spending
Maine Office of Tourism Visitor Tracking Research Winter 2017 Seasonal Topline. Prepared by
 Maine Office of Tourism Visitor Tracking Research Winter 2017 Seasonal Topline Prepared by June 2017 Research Objectives and Methodology 2 Research Objectives Three distinct online surveys are used to
NAPA VALLEY VISITOR INDUSTRY 2012 Economic Impact Report
 Join Visit Napa Valley NAPA VALLEY VISITOR INDUSTRY 2012 Economic Impact Report Research prepared for Visit Napa Valley by Destination Analysts, Inc. Table of Contents SECTION 1 Introduction 2 SECTION
2013 ASTA Travel Agency Industry Overview
 University of Massachusetts Amherst ScholarWorks@UMass Amherst Tourism Travel and Research Association: Advancing Tourism Research Globally 2013 Marketing Outlook Forum - Outlook for 2014 2013 ASTA Travel
Tourism Snapshot. A focus on the markets in which the CTC and its partners are active. February 2015 Volume 11, Issue 2.
 Tourism Snapshot Tourism Whistler/Mike Crane A focus on the markets in which the CTC and its partners are active www.canada.travel/corporate February Volume 11, Issue 2 Key highlights The strong beginning
Washington County, TN. Hotel, Restaurant, and Travel Industries: Economic Profile and Business Trends, Washington County (Jonesborough area)
") Washington County, TN Washington County (Jonesborough area) Hotel, Restaurant, and Travel Industries: Economic Profile and Business Trends, Steve Morse, Ph.D. Director & Economist Tourism Institute University
Washington County, TN Washington County (Jonesborough area) Hotel, Restaurant, and Travel Industries: Economic Profile and Business Trends, Steve Morse, Ph.D. Director & Economist Tourism Institute University
Blount County, TN. Hotel, Restaurant, and Travel Industries: Economic Profile and Business Trends, 2006
 Blount County, TN Blount County (Alcoa, Maryville, Rockford, Seymour, Townsend areas) Hotel, Restaurant, and Travel Industries: Economic Profile and Business Trends, Steve Morse, Ph.D. Director & Economist
Presentation overview
 Presentation overview Retail is a key component of tourist and business destinations and can act as major draw Retail is #1 or #2 leisure activity among travelers One of most important reasons meeting
December 1, Tim Martin Executive Director Stephens County Development Authority 31 W. Doyle Street Toccoa, GA
 December 1, 2017 Tim Martin Executive Director Stephens County Development Authority 31 W. Doyle Street Toccoa, GA 30577 tim@scda.biz Dear Mr. Martin, We are pleased to present this summary letter report
Number of tourism trips of residents increased namely for leisure
 Tourism Demand of Residents 1 st Quarter 2018 25 July 2018 Number of tourism trips of residents increased namely for leisure In the 1 st quarter 2018, residents in Portugal took a total of 4.5 million
MEMORANDUM MARKET OVERVIEW. Matt Roberts, Director of Parks and Recreation City of Carpinteria. Kevin Engstrom James Rabe. Date: June 21, 2016
 MEMORANDUM ADVISORS IN: REAL ESTATE REDEVELOPMENT AFFORDABLE HOUSING ECONOMIC DEVELOPMENT SAN FRANCISCO A. JERRY KEYSER TIMOTHY C. KELLY KATE EARLE FUNK DEBBIE M. KERN REED T. KAWAHARA DAVID DOEZEMA LOS
Existing Services, Ridership, and Standards Report. June 2018
 Existing Services, Ridership, and Standards Report June 2018 Prepared for: Prepared by: Contents Overview of Existing Conditions... 1 Fixed Route Service... 1 Mobility Bus... 34 Market Analysis... 41 Identification/Description
ECONOMIC PROFILE PARK CITY & SUMMIT COUNTY, UTAH
 ECONOMIC PROFILE PARK CITY & SUMMIT COUNTY, UTAH Prepared by the Park City Chamber of Commerce & Visitors Bureau PO Box 1630, Park City, UT 84060 1.800.453.1360 Economic Profile Packet Sections 1. Introduction
RIDERSHIP TRENDS. October 2017
 RIDERSHIP TRENDS October 2017 Prepared by the Division of Strategic Capital Planning December 2017 Table of Contents Executive Summary...1 Ridership...3 Estimated Passenger Trips by Line...3 Estimated
BUSINESS BAROMETER December 2018
 Credit: Chris Orange BUSINESS BAROMETER December Credit: Nigel Moore 1 Contents Summary of findings 3 Annual monthly performance: visitor attractions..4 Visit Herts Team update 5 National context.8 Visitor
AUCKLAND DESTINATION OVERVIEW
 AUCKLAND DESTINATION OVERVIEW October 218 An in-depth overview of Auckland s visitor economy from the latest arrival, accommodation, spend, cruise and event data through to past five- commentary. Prepared
Hamilton County, TN. Hotel, Restaurant, and Travel Industries: Economic Profile and Business Trends, Hamilton County (Chattanooga area)
") Hamilton County, TN Hamilton County (Chattanooga area) Hotel, Restaurant, and Travel Industries: Economic Profile and Business Trends, Steve Morse, Ph.D. Director & Economist Tourism Institute University
Hamilton County, TN Hamilton County (Chattanooga area) Hotel, Restaurant, and Travel Industries: Economic Profile and Business Trends, Steve Morse, Ph.D. Director & Economist Tourism Institute University
TABLE OF CONTENTS Executive Summary. Convention Industry Overview and Trends. Convention Market Competitive and Comparable Analysis
 TABLE OF CONTENTS ----------- Executive Summary Chapter 1 Appendix A Appendix B Appendix C Appendix D Appendix E Appendix F Demand and Impact Convention Industry Overview and Trends Convention Market Competitive
Asheville Metro Economic Report 2014 Second Quarter
 Asheville Metro Economic Report Johnson Price Sprinkle PA HIGHLIGHTS: ASHEVILLE METRO The Asheville metro area gained 2,400 more jobs than one year earlier, averaging a growth rate of 1.4 percent, continuing
2015 Business Survey Report Erie to Pittsburgh Trail March 2015
 2015 Business Survey Report Erie to Pittsburgh Trail March 2015 Table of Contents Executive Summary 2 2013 EPT Trail User Survey and Impact Analysis 3 Overview 3 Results 3 2014 2015 Erie to Pittsburgh
Panama City Beach CVB Visitor Profile & Economic Impact Report. Prepared for: Panama City Beach Convention & Visitors Bureau
 Panama City Beach CVB 2015 Visitor Profile & Economic Impact Report Presented by: Berkeley Young, President Young Strategies, Inc. Larry D. Gustke, PhD Prepared for: Panama City Beach Convention & Visitors
RIDERSHIP TRENDS. January 2018
 RIDERSHIP TRENDS January 2018 Prepared by the Division of Strategic Capital Planning March 2018 Table of Contents Executive Summary...1 Ridership...3 Estimated Passenger Trips by Line...3 Estimated Passenger
AUCKLAND DESTINATION OVERVIEW
 AUCKLAND DESTINATION OVERVIEW September 218 An in-depth overview of Auckland s visitor economy from the latest arrival, accommodation, spend, cruise and event data through to past five- commentary. Prepared
Tourism in South Africa A statistical overview
 Tourism in South Africa A statistical overview Purpose of presentation Purpose of the presentation is to present different tourism statistics produced by Stats SA People like to travel we are a country
Ohio Chapter of the Appraisal Institute 40 th Annual Economic Seminar
 Ohio Chapter of the Appraisal Institute 40 th Annual Economic Seminar Ohio and National Lodging Industry Overview: Statistics, Appraisal Issues, and New Supply Presented by: David J. Sangree, MAI, CPA,
2004 SOUTH DAKOTA MOTEL AND CAMPGROUND OCCUPANCY REPORT and INTERNATIONAL VISITOR SURVEY
 2004 SOUTH DAKOTA MOTEL AND CAMPGROUND OCCUPANCY REPORT and INTERNATIONAL VISITOR SURVEY Prepared By: Center for Tourism Research Black Hills State University Spearfish, South Dakota Commissioned by: South