Visit Phoenix Market Update January Eric Kerr Director of Research & Business Analysis
|
|
|
- Silvester Harrison
- 5 years ago
- Views:
Transcription
1 Visit Phoenix Market Update January 2019 Eric Kerr Director of Research & Business Analysis
2 Visitation totals & Spending trends Hotel Market Overview YTD - November Chain scales, Submarkets, Segmentation 2019 STR Phoenix-Market Forecast Hotel market trends Convention Center booking pace Airport updates
3 Greater Phoenix 2017 Visitation segments domestic and international Trips and Spend Nominal dollars, millions Visits Domestic International Spending $6,060 $6,269 $6,672 $7,145 $7,420 $7,799 Domestic $4,658 $4,761 $5,155 $5,623 $5,884 $6,227 International $1,403 $1,508 $1,517 $1,522 $1,536 $1,572 Domestic totals are a near 50/50 split of domestic overnight and domestic daytrip

4 Greater Phoenix visitor spending Percent of total 100% 10.5% 9.8% 9.1% 9.5% 9.6% 9.3% 80% 60% 40% 20% 27.6% 28.3% 29.2% 30.4% 30.7% 30.8% 21.5% 22.0% 22.1% 22.4% 22.6% 23.0% 16.5% 16.1% 15.7% 15.2% 15.0% 14.8% 11.5% 11.5% 12.0% 11.4% 11.5% 11.6% Air transp. Lodging* F&B Retail Rec Local transp. 0% 12.4% 12.2% 11.9% 11.2% 10.6% 10.5% Source: Longwoods International; Tourism Economics
5 Hotel Performance 2018 YTD Jan. Nov. Phoenix-Metro Area Actual % Change Top 25 % Rank Occupancy 70.6% 3.1% 2 nd ADR $ % 16 th RevPAR $ % 4 th 12 markets posting occupancy declines 2 markets posting ADR declines 2 markets posting RevPAR declines SOURCE: STR, INC. REPUBLICATION OR OTHER RE USE OF THIS DATA WITHOUT THE EXPRESS WRITTEN PERMISSION OF STR IS STRICTLY PROHIBITED.
6 January November 2018 Phoenix-Metro Hotel Performance Demand Overview Demand YOY Change (%) United States 2.5 STR Top 25 Markets 2.6 Phoenix-Metro ,000+ additional hotel rooms sold in market Phoenix-Metro Ranking Top 25 #3 in Demand (Rooms Sold) percent change SOURCE: STR, INC. REPUBLICATION OR OTHER RE USE OF THIS DATA WITHOUT THE EXPRESS WRITTEN PERMISSION OF STR IS STRICTLY PROHIBITED.
7 Phoenix-Metro Hotel Market January - November 2018, Chain Scale KPI Comparison showing year over year percent change Room Avail Room Sold Luxury Upper Upscale Upscale Upper Midscale Midscale Economy SOURCE: STR, INC. REPUBLICATION OR OTHER RE USE OF THIS DATA WITHOUT THE EXPRESS WRITTEN PERMISSION OF STR IS STRICTLY PROHIBITED.

8 Hotel Performance 2018 YTD Jan. Nov. Phoenix-Metro Submarkets SOURCE: STR, INC. REPUBLICATION OR OTHER RE USE OF THIS DATA WITHOUT THE EXPRESS WRITTEN PERMISSION OF STR IS STRICTLY PROHIBITED.
9 Segmentation January November 2018 YTD Phoenix-Metro Hotel Performance (Luxury & Upper Upscale Properties only) Group Segment Phoenix % Change Top 25 Rank % Change Occupancy 1.2% 10 th ADR 1.9% 17 th RevPar 3.2% 12 th Transient Segment Phoenix % Change Top 25 Rank % Change Occupancy 3.9% 2 nd ADR 3.3% 14 th RevPar 7.3% 2 nd 45.8 % of occupancy at top tier hotels is from group business 2 nd highest group share of occupancy in STR Top 25 SOURCE: STR, INC. REPUBLICATION OR OTHER RE USE OF THIS DATA WITHOUT THE EXPRESS WRITTEN PERMISSION OF STR IS STRICTLY PROHIBITED.
10 15.0% Phoenix Hotel Market Supply & Demand 12MMA January October % 5.0% 0.0% Sep % 2.4% Supply % Change 12MMA Demand % Change 12MMA -5.0% -10.0% Jan-00 Jun-00 Nov-00 Apr-01 Sep-01 Feb-02 Jul-02 Dec-02 May-03 Oct-03 Mar-04 Aug-04 Jan-05 Jun-05 Nov-05 Apr-06 Sep-06 Feb-07 Jul-07 Dec-07 May-08 Oct-08 Mar-09 Aug-09 Jan-10 Jun-10 Nov-10 Apr-11 Sep-11 Feb-12 Jul-12 Dec-12 May-13 Oct-13 Mar-14 Aug-14 Jan-15 Jun-15 Nov-15 Apr-16 Sep-16 Feb-17 Jul-17 Dec-17 May-18 Oct-18 SOURCE: STR, INC. REPUBLICATION OR OTHER RE USE OF THIS DATA WITHOUT THE EXPRESS WRITTEN PERMISSION OF STR IS STRICTLY PROHIBITED.
11 Phoenix-Metro Hotel Development 2017 Supply growth: 1.9%; 18 th out of Top YTD though Nov. supply growth: 2.6%; 12 th out of Top 25 STR Pipeline Report (November Forecasts 2018) Under Construction: 15 properties; 2,010 rooms Final Planning: 29 properties; 3,250 rooms More than 9,000 rooms at more than 70 properties proposed 35+ properties have no timeline for opening


12 17 properties 2,240 hotel rooms 2019 Projected Hotel Openings

13 2019 Projected Hotel Openings
14 CY 2019 STR Hotel Market Forecast U.S.* Phoenix-Metro** Occupancy 0.1% 0.1% ADR 2.3% 2.5% RevPAR 2.4% 2.5% Supply 1.9% 1.9% Demand 2.0% 2.0% *U.S. Forecast data from recent STR presentations on HotelNewsNow.com December 2018 ** Phoenix forecast data from Q Forecast report, received November 2018

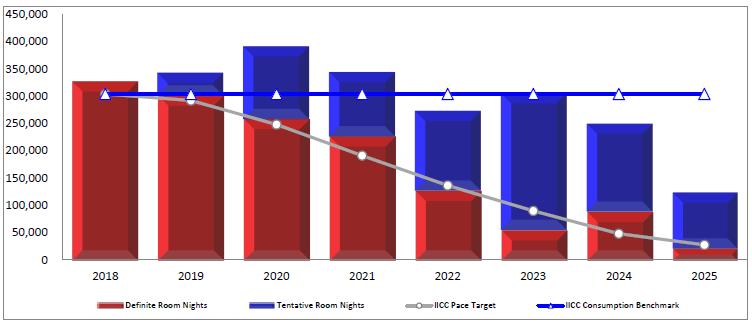
15 PCC Room Night TAP
16 2019 Large PCC Conventions 2,300+ Rooms on Peak 5/11/2019: Society for Science & the Public 2,871 rooms on peak; 17,000+ total contracted rooms; 9,000 estimated attendees 6/26/2019: Volleyball Festival 2,525 rooms on peak; 10,600+ total contracted rooms; 10,500 estimated attendees 7/7/2019: Church of the Nazarene 2,300 rooms on peak; 13,500+ total contracted rooms; 7,500 estimated attendees 8/5/2019: Jehovah's Witnesses 4,000 rooms on peak; 18,000+ contracted rooms; 30,000 estimated attendees 10/27/2019: Association of Corporate Counsel 2,450 rooms on peak; 8,180+ total contracted rooms; 4,000 estimated attendees 11/8/2019: Association of American Medical Colleges 2,325 rooms on peak; 9,300+ total contacted rooms; 3,800 estimated attendees 12/30/2019: Fellowship of Catholic University Students 2,800 rooms on peak; 12,400+ total contracted rooms; 7,500 estimated attendees Source: Visit Phoenix
17 Sky Harbor Passenger Stats YTD: January November 2018 Total passenger traffic increased 2.2% (903k) International passenger traffic increased +3.6% (66k) American passengers increased +2.0% (371k) Southwest passengers +3.5% (482k) Frontier passengers -25% (204k) Spirit passengers -11% (22k) New international services (Frankfurt & Montreal) American adding direct to London in 2019 Source: Sky Harbor Int. Airport October 2018 Reports American & Southwest = 80% total passenger traffic
18 Airport Update Flight Announcements New direct flight to Frankfurt, Germany, started May 2018 with Condor Airlines Condor already announced seasonal service will be expanded in 2019 Southwest started direct to LaGuardia NYC (seasonal) Air Canada direct to Montreal from Sky Harbor American adding non-stop to London in 2019 Frontier announced 5 new destinations Fort Myers, Florida; Grand Rapids, Michigan; Madison, Wisconsin; Norfolk, Virginia and Rally Durham, North Carolina Mesa Gateway - Estimated to reach 1.5 million passengers 2018 West-Jet continues with flights to Calgary. Swoop Airlines will offer direct flights to Edmonton Oct - April Allegiant Expanding at Mesa-Gateway
19 What we are watching Government shutdown impact on travel and conventions 2021 & 2023 Convention Center booking PACE New convention products coming to competing cities U.S. international visitation total revision Per AOT, 2017 International visitation to AZ -1.9%; Phoenix = flat since 2015 Airport passenger numbers & Airlift Development Phoenix-metro destination developments
20 Questions?
Hotel Association of North Texas. Karrie Keen Director, Destination and Trend Operations
 Hotel Association of North Texas Karrie Keen Director, Destination and Trend Operations To view this presentation, go to HotelNewsNow.com and click on Industry Analysis then Hotel data presentations. Agenda
HOTEL INDUSTRY OVERVIEW. Texas
 HOTEL INDUSTRY OVERVIEW Texas DEMAND GROWTH STRONG BALANCED OCC & ADR GROWTH % Change Room Supply* 149M 1.3% Room Demand* 92M 5.6% Occupancy 61.6% 4.3% A.D.R. $90 4.4% RevPAR $55 8.9% Room Revenue* $8.3B
January 2018 Air Traffic Activity Summary
 January 2018 Air Traffic Activity Summary Jan-2018 Jan-2017 CY-2018 CY-2017 Passengers 528,947 505,421 4.7% 528,947 505,421 4.7% Passengers 537,332 515,787 4.2% 537,332 515,787 4.2% Passengers 1,066,279
Recovery Now! ANZPHIC 2010 Sydney - July 8, Hotel Performance Back On Track
 Recovery Now! Hotel Performance Back On Track ANZPHIC 2010 Sydney - July 8, 2010. STR Global Ltd is the exclusive owner of all rights in this presentation and its content. Reproduction of all or a portion
Lodging Industry Overview. 14 December Bobby Bowers Smith Travel Research / STR Global
 Lodging Industry Overview 14 December 2011 Bobby Bowers Smith Travel Research / STR Global Global / U.S. Overview Key U.S. Markets Construction Pipeline Forecast Takeaways Today s Agenda RevPar Growth
Hotel Industry Performance Overview Washington Lodging Convention
 Hotel Industry Performance Overview Washington Lodging Convention Valerie Woods Director of Business Development, Hotels vwoods@str.com Valerie_STR 2016 STR, Inc. All Rights Reserved. Any reprint, use
Measures & Projections October 31, GoToBermuda.com
 Measures & Projections October 31, 2015 GoToBermuda.com October Total Vacation Visitor Arrivals Vacation Arrivals Oct-14 Oct-15 2015 Air Vacation 9,203 10,344 1,141 12.40 126,842 127,044 202 0.16 Cruise
LOUIS ARMSTRONG NEW ORLEANS INTERNATIONAL AIRPORT For the Period Ending September 30, Enplaned Passengers by Airline
 Domestic Scheduled Enplaned Passengers by Airline Alaska Airlines 7,070 4,331 63.2% 59,552 42,265 40.9% 1.2% 1.0% Virgin America 0 803-100.0% 12,231 803 1423.2% 0.3% 0.0% Allegiant Air 1,333 2,063-35.4%
Panama City Beach CVB Travel Market Preliminary Report. Prepared for: Panama City Beach Convention & Visitors Bureau
 Panama City Beach CVB 2017 Travel Market Preliminary Report Prepared for: Panama City Beach Convention & Visitors Bureau Presented by: Berkeley Young, President Young Strategies, Inc. Larry D. Gustke,
AUCKLAND DESTINATION OVERVIEW
 AUCKLAND DESTINATION OVERVIEW October 218 An in-depth overview of Auckland s visitor economy from the latest arrival, accommodation, spend, cruise and event data through to past five- commentary. Prepared
The European Hotel Market
 The European Hotel Market Boutique and Lifestyle Hotel Summit 2017 Sophie Colvin Business Development scolvin@str.com 2016 STR, Inc. All Rights Reserved. Any reprint, use or republication of all or a part
AUCKLAND DESTINATION OVERVIEW
 AUCKLAND DESTINATION OVERVIEW September 218 An in-depth overview of Auckland s visitor economy from the latest arrival, accommodation, spend, cruise and event data through to past five- commentary. Prepared
AUCKLAND DESTINATION OVERVIEW
 AUCKLAND DESTINATION OVERVIEW AUGUST 218 An in-depth overview of Auckland s visitor economy from the latest arrival, accommodation, spend and cruise data through to past five- commentary. Prepared September
Industry. OH&LA Hospitality It s not all BLACK & WHITE. Duane Vinson Vice President
 State of the Industry OH&LA Hospitality 2010 It s not all BLACK & WHITE Duane Vinson Vice President For a copy of this presentation go to www.hotelnewsnow.com Click on Industry Presentation Supply Growth
U.S. Hotel Industry Performance What Lies Ahead
 U.S. Hotel Industry Performance What Lies Ahead Vail R. Brown, CHMS Vice President, Global Business Development & Marketing vail_str May 5, 2015 vbrown@str.com 1. Visit www.hotelnewsnow.com 2. Create Free
U.S. Hotel Industry Performance. Brad Garner Chief Operating Officer
 U.S. Hotel Industry Performance Brad Garner Chief Operating Officer 1 Agenda Total US Review Scale Review Segmentation Markets Supply Pipeline 2013 / 2014 Forecast 2 www.hotelnewsnow.com Click on Hotel
COUNCIL OF INNS & SUITES Lodging Overview. Jan D. Freitag Senior Vice President
 COUNCIL OF INNS & SUITES Lodging Overview Jan D. Freitag Senior Vice President 1 www.hotelnewsnow.com Click on Hotel Data Presentations 2 Agenda Total US Review Chain Scale Review Upper Midscale / Midscale
Mexico Hotel & Tourism Investment Conference Global Hotel Industry Overview
 Mexico Hotel & Tourism Investment Conference Global Hotel Industry Overview Jeff Higley VP, digital media & communications Thursday, 7 February 2013 www.hotelnewsnow.com Click on Hotel Data Presentations
Southern Innkeepers 104 th Annual Meeting Lodging Overview. Jan D. Freitag Senior Vice President
 Southern Innkeepers 104 th Annual Meeting Lodging Overview Jan D. Freitag Senior Vice President 1 Agenda Total US Review Scales Segmentation Markets Pipeline Southern Innkeepers Hotels Performance 2012
Visit Loudoun 2016 Lodging Market Research
 2016 Lodging Market Research Prepared for: Loudoun County Lodging Market Research & Analysis Study Conducted: November December 2016 Final Report Submitted: December 2016 2016 Lodging Market Analysis Summary
Tourism Statistics Region 1
 Tourism Statistics Region 1 Tourism Research Unit Winter 2011 1 Summary In 2008, there were 101.0 million visits in and visitors spent $17.6 billion residents account for the majority of visits and spending
Coast to coast. STR Coastal Town Review Coastal Towns Market Review Report_JE.indd 3
 Coast to coast. STR Coastal Town Review 16 Coastal Towns Market Review Report_JE.indd 3 4//17 8:31:38 AM Table of Contents Introduction...3 United Kingdom...4 Blackpool...6 Bournemouth...8 Brighton...
Billings Area COC. For the Month of April 2017 Date Created: May 17, 2017
 United Kingdom United States Blue Fin Building 735 East Main Street 110 Southwark Street Hendersonville London SE1 0TA TN 37075 Phone: +44 (0)20 7922 1930 Phone: +1 (615) 824 8664 Fax: +44 (0)20 7922 1931
December 2012 Passenger and Cargo Traffic Statistics Reno-Tahoe International Airport
 December 2012 Passenger and Cargo Traffic Statistics Reno-Tahoe International Airport January 29, 2013 U.S. DOMESTIC INDUSTRY OVERVIEW FOR DECEMBER 2012 All RNO Carriers Systemwide year over year comparison
SUPPLY AND DEMAND ANALYSIS
 SUPPLY AND DEMAND ANALYSIS The objectives of the supply and demand analysis are to: 1. Identify those hotels that constitute direct competition to the proposed hotel. 2. Estimate the occupancy levels,
LOUIS ARMSTRONG NEW ORLEANS INTERNATIONAL AIRPORT For the Period Ending August 31, Enplaned Passengers by Airline
 Enplaned Passengers by Airline Domestic Scheduled Alaska Airlines 3,797 4,077-6.9% 36,538 35,188 3.8% 1.0% 1.0% Allegiant Air 5,698 743 666.9% 41,738 14,843 181.2% 1.1% 0.4% American Airlines (US Air)
U.S. Hotel Industry Performance HBI Annual Conference
 U.S. Hotel Industry Performance HBI Annual Conference February 17, 2017 Jeff Higley VP/Editorial Director jeff@str.com @jeffhigley1 2016 STR, Inc. All Rights Reserved. Any reprint, use or republication
TravelClick: Business Intelligence Lodging Outlook. Sara Duggan. Regional Vice President, Business Intelligence TravelClick 03/23/18
 TravelClick: Business Intelligence 2018 Lodging Outlook Sara Duggan Regional Vice President, Business Intelligence TravelClick 03/23/18 25,000+ Partners 25 283 Million $49 Billion 365 North America Markets
Table of Contents PAGE
 DECEMBER 2018 EL PASO INTERNATIONAL AIRPORT MONTHLY ACTIVITY REPORT December 2018 Table of Contents PAGE AIRPORT ACTIVITY OVERVIEW 1 NONSTOP DESTINATION ANALYSIS 2 MAP OF NONSTOP DESTINATIONS 3 FLIGHT
Panama City Beach CVB Visitor Profile & Economic Impact Report. Prepared for: Panama City Beach Convention & Visitors Bureau
 Panama City Beach CVB 2015 Visitor Profile & Economic Impact Report Presented by: Berkeley Young, President Young Strategies, Inc. Larry D. Gustke, PhD Prepared for: Panama City Beach Convention & Visitors
Table of Contents PAGE
 OCTOBER 2018 EL PASO INTERNATIONAL AIRPORT MONTHLY ACTIVITY REPORT October 2018 Table of Contents PAGE AIRPORT ACTIVITY OVERVIEW 1 NONSTOP DESTINATION ANALYSIS 2 MAP OF NONSTOP DESTINATIONS 3 FLIGHT SCHEDULE
Table of Contents PAGE
 NOVEMBER 2018 EL PASO INTERNATIONAL AIRPORT MONTHLY ACTIVITY REPORT November 2018 Table of Contents PAGE AIRPORT ACTIVITY OVERVIEW 1 NONSTOP DESTINATION ANALYSIS 2 MAP OF NONSTOP DESTINATIONS 3 FLIGHT
GoToBermuda.com. Q4 Arrivals and Statistics at December 31 st 2015
 Q4 Arrivals and Statistics at December 31 st 1 Q4 Total Vacation Visitor Arrivals Q4 Arrivals Air - Vacation 23,770 23,125-2.7% -645 141,509 139,820-1.2% -1,689 Cruise 39,118 48,344 23.6% 9,226 355,880
May 2011 Passenger and Cargo Traffic Statistics Reno-Tahoe International Airport
 May 2011 Passenger and Cargo Traffic Statistics Reno-Tahoe International Airport July 5, 2011 U.S. DOMESTIC INDUSTRY OVERVIEW FOR MAY 2011 All RNO Carriers Systemwide year over year comparison Average
air traffic statistics
 July 23 air traffic statistics Prepared by the Office of Finance Department of Internal Controls, Compliance and Financial Strategy Air Traffic Summary July 23 Below is a summary of the July 23 Air Traffic
Finding Rationality in an Irrational World: The Economics of Successful Hotel Negotiations
 Finding Rationality in an Irrational World: The Economics of Successful Hotel Negotiations Isaac Collazo, Vice President, Performance Strategy & Planning, InterContinental Hotels Group (IHG) Maria Lowry,
September 2013 Passenger and Cargo Traffic Statistics Reno-Tahoe International Airport
 September 2013 Passenger and Cargo Traffic Statistics Reno-Tahoe International Airport October 31, 2013 U.S. DOMESTIC INDUSTRY OVERVIEW FOR SEPTEMBER 2013 All RNO Carriers Systemwide year over year comparison
Table of Contents PAGE
 FEBRUARY 2018 EL PASO INTERNATIONAL AIRPORT MONTHLY ACTIVITY REPORT February 2018 Table of Contents PAGE AIRPORT ACTIVITY OVERVIEW 1 NONSTOP DESTINATION ANALYSIS 2 MAP OF NONSTOP DESTINATIONS 3 FLIGHT
AUCKLAND DESTINATION OVERVIEW
 AUCKLAND DESTINATION OVERVIEW JUNE 218 An in-depth overview of Auckland s visitor economy from the latest arrival, accommodation, spend and cruise data through to past five-year commentary. Prepared July
August 2014 Passenger and Cargo Traffic Statistics Reno-Tahoe International Airport
 August 2014 Passenger and Cargo Traffic Statistics Reno-Tahoe International Airport October 8, 2014 U.S. DOMESTIC INDUSTRY OVERVIEW FOR AUGUST 2014 All RNO Carriers Domestic Systemwide year over year comparison
Tourism Snapshot. June 2015 Volume 11, Issue 6. A focus on the markets in which Destination Canada (DC) and its partners are active.
 and its partners are active.") Tourism Snapshot Tourism PEI / Paul Baglole A focus on the markets in which Destination Canada (DC) and its partners are active. www.destinationcanada.com June Volume 11, Issue 6 Key highlights Over the
Tourism Snapshot Tourism PEI / Paul Baglole A focus on the markets in which Destination Canada (DC) and its partners are active. www.destinationcanada.com June Volume 11, Issue 6 Key highlights Over the
TOURISM PERFORMANCE 2017
 4 th QUARTER TOURISM PERFORMANCE 2017 TOTAL STAYOVER ARRIVALS 105,658 TOTAL CRUISE ARRIVALS 224,212 TOTAL VISITOR NIGHTS AVERAGE HOTEL OCCUPANCY 935,402 71.7% ECONOMIC IMPACT $142.6 million HOW WAS OUR
Fort Lauderdale August 8, 2017
 Fort Lauderdale August 8, 2017 8/10/2017 TAP Software Analytics Division Brian Finucane TAP Reports Jeff Eastman TAP Hotel Reports Jeanne Eastman TAP Data Source Jeff Eastman Cloud Database Numerous Data
AUCKLAND DESTINATION OVERVIEW
 AUCKLAND DESTINATION OVERVIEW JULY 218 An in-depth overview of Auckland s visitor economy from the latest arrival, accommodation, spend and cruise data through to past five-year commentary. Prepared August
Hotel InduSTRy Overview What Lies Ahead
 University of Massachusetts Amherst ScholarWorks@UMass Amherst Tourism Travel and Research Association: Advancing Tourism Research Globally 2013 Marketing Outlook Forum - Outlook for 2014 Hotel InduSTRy
U.S. DOMESTIC INDUSTRY OVERVIEW FOR MARCH
 Inter-Office Memo Reno-Tahoe Airport Authority Date: April 30, 2009 To: Statistics Recipients From: Krys T. Bart, A.A.E., President/CEO Subject: RENO-TAHOE INTERNATIONAL AIRPORT PASSENGER STATISTICS U.S.
Table of Contents PAGE
 April 2015 EL PASO INTERNATIONAL AIRPORT MONTHLY ACTIVITY REPORT April 2015 Table of Contents PAGE AIRPORT ACTIVITY OVERVIEW 1 NONSTOP DESTINATION ANALYSIS 2 MAP OF NONSTOP DESTINATIONS 3 FLIGHT SCHEDULE
Tourism Statistics RTO 1
 Tourism Statistics RTO 1 Tourism Research Unit Spring 2012 1 1 Ontario Tourism 2 2 Ontario Tourism Indicators 2011* Visits increased by 1.3% to 104.4 million. Visits from Ontario and overseas countries
HelmsBr Meeting I ndustry T rends 2011 September 10, 2010
 HelmsBriscoe Meeting Industry Trends 2011 September 10, 2010 Agenda HelmsBriscoe Overview Market Conditions Key Meeting Industry Trends Q&A HB By the Numbers The largest meetings procurement firm in the
July 2012 Passenger and Cargo Traffic Statistics Reno-Tahoe International Airport
 July 2012 Passenger and Cargo Traffic Statistics Reno-Tahoe International Airport August 31, 2012 U.S. DOMESTIC INDUSTRY OVERVIEW FOR JULY 2012 All RNO Carriers Systemwide year over year comparison Average
BRANSON 2 nd QUARTER 2014 MARKETING REPORT
 BRANSON 2 nd QUARTER 2014 MARKETING REPORT October 14, 2014 Branson Convention & Visitors Bureau PRESENTATION OVERVIEW Economic Overview Travel Industry Update Branson 2Q 2014 Update ECONOMIC OUTLOOK Consumer
Tourism Snapshot A Monthly Monitor of the Performance of Canada s Tourism Sector
 Tourism Snapshot A Monthly Monitor of the Performance of Canada s Tourism Sector December Volume 14, Issue 12 www.destinationcanada.com Tourism Snapshot December 1 Newfoundland and Labrador Tourism KEY
Billings Area COC. For the Month of December 2010 Date Created: Jan 18, 2011
 1 United Kingdom United States Blue Fin Building 735 East Main Street 110 Southwark Street Hendersonville London SE1 0TA TN 37075 Phone: +44 (0)20 7922 1930 Phone: +1 (615) 824 8664 Fax: +44 (0)20 7922
May Air Traffic Statistics. Prepared by the Office of Corporate Risk and Strategy
 May 214 Air Traffic Statistics Prepared by the Office of Corporate Risk and Strategy Commercial Total Int'l Dom Air Traffic Summary May 214 Passenger Activity (in Millions) Current Month Year-to-Date Last
AUGUST 2008 MONTHLY PASSENGER AND CARGO STATISTICS
 Inter-Office Memo Reno-Tahoe Airport Authority Date: October 2, 2008 To: Statistics Recipients From: Tom Medland, Director Air Service Business Development Subject: RENO-TAHOE INTERNATIONAL AIRPORT PASSENGER
Passenger and Cargo Statistics Report
 Passenger and Cargo Statistics Report Reno-Tahoe International Airport December 2014 U.S. DOMESTIC INDUSTRY OVERVIEW FOR DECEMBER 2014 All RNO Carriers Domestic Systemwide year over year comparison Average
Passenger and Cargo Statistics Report
 Passenger and Cargo Statistics Report RenoTahoe International Airport December 2015 U.S. DOMESTIC INDUSTRY OVERVIEW FOR DECEMBER 2015 All RNO Carriers Domestic Systemwide year over year comparison Average
Third Quarter Marketing Report B R A N SON/LAKES A R EA C VB N OVEMBER, 2013
 Third Quarter Marketing Report B R A N SON/LAKES A R EA C VB N OVEMBER, 2013 Economic Outlook +5.1% from July 2011 Consumer Confidence is Up 7% This Year Increasing from 66.7 in Dec to 71.2 Today +6.7%
DTTAS Quarterly Aviation Statistics Snapshot Quarter Report
 Contents DTTAS Quarterly Aviation Statistics Snapshot Quarter 4 2015 Report 1.1 Dublin Airport Key Statistics... 1 1.2 Cork Airport Key Statistics... 3 1.3 Shannon Airport Key Statistics... 5 1.4 Total
MPI Nashville Chapter
 MPI Nashville Chapter Monthly Meeting Embassy Suites Cool Springs September 20, 2017 Veronica Andrews Director, Digital Data Solutions vandrews@str.com @STR_Data 2017 STR, Inc. All Rights Reserved. Any
March 2011 Visitor Profile
 RESEARCH DATA SERVICES, INC. 777 SOUTH HARBOUR ISLAND BOULEVARD SUITE 260 TAMPA, FLORIDA 33602 TEL (813) 254-2975 FAX (813) 254-2986 Naples, Marco Island, Everglades Convention and Visitors Bureau March
November 2013 Passenger and Cargo Traffic Statistics Reno-Tahoe International Airport
 November 2013 Passenger and Cargo Traffic Statistics Reno-Tahoe International Airport December 26, 2013 U.S. DOMESTIC INDUSTRY OVERVIEW FOR NOVEMBER 2013 All RNO Carriers Domestic Systemwide year over
October 2013 Passenger and Cargo Traffic Statistics Reno-Tahoe International Airport
 October 2013 Passenger and Cargo Traffic Statistics Reno-Tahoe International Airport December 4, 2013 U.S. DOMESTIC INDUSTRY OVERVIEW FOR OCTOBER 2013 All RNO Carriers Systemwide year over year comparison
Passenger and Cargo Statistics Report
 Passenger and Cargo Statistics Report RenoTahoe International Airport September 2017 U.S. DOMESTIC INDUSTRY OVERVIEW FOR SEPTEMBER 2017 Systemwide RNO Carriers Domestic Flights year over year comparison
Passenger and Cargo Statistics Report
 Passenger and Cargo Statistics Report RenoTahoe International Airport January 2018 U.S. DOMESTIC INDUSTRY OVERVIEW FOR JANUARY 2018 Systemwide RNO Carriers Domestic Flights year over year comparison Average
air traffic statistics
 June 23 air traffic statistics Prepared by the Office of Finance Department of Internal Controls, Compliance and Financial Strategy Metropolitan Washington Airports Authority Air Traffic Statistics Table
Passenger and Cargo Statistics Report
 Passenger and Cargo Statistics Report RenoTahoe International Airport February 2018 U.S. DOMESTIC INDUSTRY OVERVIEW FOR FEBRUARY 2018 Systemwide RNO Carriers Domestic Flights year over year comparison
December 2013 Passenger and Cargo Traffic Statistics Reno-Tahoe International Airport
 December 2013 Passenger and Cargo Traffic Statistics Reno-Tahoe International Airport January 24, 2014 U.S. DOMESTIC INDUSTRY OVERVIEW FOR DECEMBER 2013 All RNO Carriers Domestic Systemwide year over year
air traffic statistics
 September 213 air traffic statistics Prepared by the Office of Finance Department of Internal Controls, Compliance and Financial Strategy Commercial Total Int'l Dom Passengers % Change Air Traffic Summary
Monthly Airport Passenger Activity Summary. Sep 2017
 T F Green Airport Monthly Airport Passenger Activity Summary Sep 2017 Calendar Year Basis Year Year Sep Sep Percent to Date to Date Percent 2017 2016 Change 2017 2016 Change Total Enplaned 161,165 151,982
Tourism Snapshot A Monthly Monitor of the Performance of Canada s Tourism Industry
 Tourism Snapshot A Monthly Monitor of the Performance of Canada s Tourism Industry December 2015 Volume 11, Issue 12 www.destinationcanada.com Tourism Snapshot December 2015 1 2 Tourism Snapshot December
BUSINESS BAROMETER December 2018
 Credit: Chris Orange BUSINESS BAROMETER December Credit: Nigel Moore 1 Contents Summary of findings 3 Annual monthly performance: visitor attractions..4 Visit Herts Team update 5 National context.8 Visitor
Passenger and Cargo Statistics Report
 Passenger and Cargo Statistics Report Reno-Tahoe International Airport October 2018 U.S. DOMESTIC INDUSTRY OVERVIEW FOR OCTOBER 2018 Systemwide RNO Carriers Domestic Flights year over year comparison Average
Passenger and Cargo Statistics Report
 Passenger and Cargo Statistics Report RenoTahoe International Airport July 2018 U.S. DOMESTIC INDUSTRY OVERVIEW FOR JULY 2018 Systemwide RNO Carriers Domestic Flights year over year comparison Average
Passenger and Cargo Statistics Report
 Passenger and Cargo Statistics Report RenoTahoe International Airport June 2018 U.S. DOMESTIC INDUSTRY OVERVIEW FOR JUNE 2018 Systemwide RNO Carriers Domestic Flights year over year comparison Average
December Air Traffic Statistics. Prepared by the Office of Marketing & Consumer Strategy
 December 217 Air Traffic Statistics Prepared by the Office of Marketing & Consumer Strategy 1 This report includes only data submitted by airlines as of the date of publication: February 2, 217. Reports
March 2014 Passenger and Cargo Traffic Statistics Reno-Tahoe International Airport
 March 2014 Passenger and Cargo Traffic Statistics Reno-Tahoe International Airport April 25, 2014 U.S. DOMESTIC INDUSTRY OVERVIEW FOR MARCH 2014 All RNO Carriers Domestic Systemwide year over year comparison
U.S. DOMESTIC INDUSTRY OVERVIEW FOR OCTOBER 2010 All RNO Carriers Systemwide year over year comparison
 Inter-Office Memo Reno-Tahoe Airport Authority Date: November 22, 2010 To: Chairman and Board of Trustees From: Krys T. Bart, A.A.E., President/CEO Subject: RENO-TAHOE INTERNATIONAL AIRPORT OCTOBER 2010
Panama City Beach Travel Market Economic Impact Report. Prepared for: Panama City Beach Convention & Visitors Bureau
 Panama City Beach 2016 Travel Market Economic Impact Report Presented by: Berkeley Young, President Young Strategies, Inc. Data Analysis: Larry D. Gustke, PhD Steve Morse, PhD Prepared for: Panama City
STR: Asia Pacific Hotel Update Yesterday, Today & Tomorrow
 STR: Asia Pacific Hotel Update Yesterday, Today & Tomorrow ITB Asia, 25 October 2017 Fenady Uriarte Business Development Manager, Southeast Asia furiarte@str.com, apinfo@str.com 2017 STR, Inc. All Rights
DOWNTOWN, CHARLOTTE AMALIE
 TOTAL VISITOR ARRIVALS TO THE USVI : DECEMBER YEAR TO DATE DECEMBER TOTAL VISITOR ARRIVALS 2,85, 2,8, 2,814,257 2,75, 2,7, 2,65, 2,6, 2,642,118 2,71,542 2,648,5 2,55, 212 213 214 215 Visitor arrivals ended
U.S. DOMESTIC INDUSTRY OVERVIEW FOR MAY 2009
 Inter-Office Memo Reno-Tahoe Airport Authority Date: June 30, 2009 To: Statistics Recipients From: Krys T. Bart, A.A.E., President/CEO Subject: RENO-TAHOE INTERNATIONAL AIRPORT PASSENGER STATISTICS U.S.
Passenger and Cargo Statistics Report
 Passenger and Cargo Statistics Report RenoTahoe International Airport November 2017 U.S. DOMESTIC INDUSTRY OVERVIEW FOR NOVEMBER 2017 Systemwide RNO Carriers Domestic Flights year over year comparison
Annual Report Collier s Hospitality &Tourism Industry
 Annual Report - 2015 Collier s Hospitality &Tourism Industry Welcome to Our Celebration of the 33 rd National Travel & Tourism Week Thank You To Our Host Today Naples Bay Resort Please Welcome John Reilly,
Quarterly Meeting# 4/2018
 Quarterly Meeting# 4/2018 3Q18 & 9M18 Performance & Outlook 14 November 2018 1 2016 ERAWAN. All rights reserved. The views expressed here contain some information derived from publicly available sources
Economic Impact of Tourism in Hillsborough County September 2016
 Economic Impact of Tourism in Hillsborough County - 2015 September 2016 Key findings for 2015 Almost 22 million people visited Hillsborough County in 2015. Visits to Hillsborough County increased 4.5%
Passenger and Cargo Statistics Report
 Passenger and Cargo Statistics Report RenoTahoe International Airport September 2018 U.S. DOMESTIC INDUSTRY OVERVIEW FOR SEPTEMBER 2018 Systemwide RNO Carriers Domestic Flights year over year comparison
Hertfordshire Business Barometer April 2018
 Hertfordshire Business Barometer April 1 Contents Summary of findings 3 Marketing update 4 Visitor Attractions: monthly performance 6 Serviced Accommodation: monthly performance 10 Other news: national
Accommodation Market update
 STR Global Ltd is the exclusive owner of all rights to hotel related data in this presentation and its content. Reproduction of all or a portion of this presentation for any purpose without prior approval
Is NYC coming back sooner than we think?
 Research Is NYC coming back sooner than we think? 23 AUGUST 2016 7:26 AM New York City and its Manhattan submarket could rebound sooner than expected with the amount of foreign capital coming in and a
January 2014 Passenger and Cargo Traffic Statistics Reno-Tahoe International Airport
 January 2014 Passenger and Cargo Traffic Statistics Reno-Tahoe International Airport March 12, 2014 U.S. DOMESTIC INDUSTRY OVERVIEW FOR DECEMBER 2013 All RNO Carriers Domestic Systemwide year over year
HOTELIER MIDDLE EAST. General Manager Debate Market Presentation September Christopher Hewett Director TRI Consulting
 HOTELIER MIDDLE EAST General Manager Debate Market Presentation September 2018 Christopher Hewett Director TRI Consulting TRI CONSULTING KEY FACTS 20 years Advising clients in the GCC, Middle East & Globally
TOURISM rd QUARTER PRESS CONFERENCE
 TOURISM 2018 3 rd QUARTER PRESS CONFERENCE CuraçaoPorts Authority Jan Sep cruise call arrivals 45 42 40 35 30 33 29 35 33 32 27 25 20 15 10 15 15 11 11 10 15 15 15 14 11 12 5 0 Jan Feb Mar Apr May Jun
DENVER INTERNATIONAL AIRPORT TOTAL OPERATIONS AND TRAFFIC DECEMBER 2003
 DENVER INTERNATIONAL AIRPORT TOTAL OPERATIONS AND TRAFFIC DECEMBER 2003 DECEMBER YEAR TO DATE % OF % OF % GRAND % GRAND INCR./ INCR./ TOTAL INCR./ INCR./ TOTAL 2003 2002 (10) DECR. DECR. 2003 2003 (9)
The Conference Board Consumer Confidence Index decreased in July The Index now stands at 96.7 down from 97.4 in June.
 Interoffice Memo Date: August 31, 2016 To: Distribution From: Brian Baker Re: Air Traffic Statistics July 2016 Please review the attached report and return any comments or questions to Brian Baker. Reports
Tourism Snapshot A Monthly Monitor of the Performance of Canada s Tourism Industry
 Tourism Snapshot A Monthly Monitor of the Performance of Canada s Tourism Industry December Volume 12, Issue 12 Michelle Valberg www.destinationcanada.com Tourism Snapshot December 1 KEY HIGHLIGHTS With
Passenger and Cargo Statistics Report
 Passenger and Cargo Statistics Report RenoTahoe International Airport September 2015 U.S. DOMESTIC INDUSTRY OVERVIEW FOR SEPTEMBER 2015 All RNO Carriers Domestic Systemwide year over year comparison Average
February Air Traffic Statistics. Prepared by the Office of Marketing & Consumer Strategy
 February 218 Air Traffic Statistics Prepared by the Office of Marketing & Consumer Strategy 1 This report includes only data submitted by airlines as of the date of publication: April 18, 218. Reports
Passenger and Cargo Statistics Report
 Passenger and Cargo Statistics Report RenoTahoe International Airport August 2015 U.S. DOMESTIC INDUSTRY OVERVIEW FOR AUGUST 2015 All RNO Carriers Domestic Systemwide year over year comparison Average
Passenger and Cargo Statistics Report
 Passenger and Cargo Statistics Report RenoTahoe International Airport July 2017 U.S. DOMESTIC INDUSTRY OVERVIEW FOR JULY 2017 Systemwide RNO Carriers Domestic Flights year over year comparison Average