Annual Results: Year Ended 31 December 2017
|
|
|
- Tyler Griffin
- 5 years ago
- Views:
Transcription

1 Annual Results: Year Ended 31 December 2017 Highly Resilient Financial Performance Presented by Andy Bruce Chief Executive Officer Robin Gregson Chief Financial Officer Nigel McMinn Chief Operating Officer
2 Highly Resilient Financial Performance Profit before tax of 68.4m (2016: 77.1m) Parts Division contributed 12.1m in 2016 before disposal at year end Continuing businesses PBT of 68.4m vs 64.9m in % Revenue increased to 4.7bn (2016: 4.3bn) EPS in continuing businesses up 1.3% at 14.57p (2016: 14.38p) LFL growth across all profit streams - outperforming the market Cost pressures from employment costs, rates, dealership investments etc. More aggressive approach to cost control - 2.5m cost in December saving at least 3m per annum 2
3 Robust Capital Structure / Capital Allocation Strong operational cash flow Net debt of 97.8m net debt 74.1m Invested in well priced used car stock in December Planned sale and leasebacks delayed to end Q1-29m proceeds Net debt / EBITDA 0.95:1 at mid point of range of 0.5:1-1.5:1 Significant headroom for targeted acquisitions Dividend increased by 7% with proposed final dividend of 2.48p Share buy back programme to commence immediately - Capital value 10m 3
4 Proven Strategy and Business Model Maintain focus on Right Brands in Right Locations Driving profit per outlet and ROI 3 more loss making dealerships closed in the period Continuous process of evaluation Knights and Drayton fully integrated Further investment in dealership estate to improve customer experience Significant progress on the key people agenda 4
5 Current Financial Year Robust performance in January March order book building in line with the plan Improved pipeline of acquisitions 5

6 Our Strategy 6


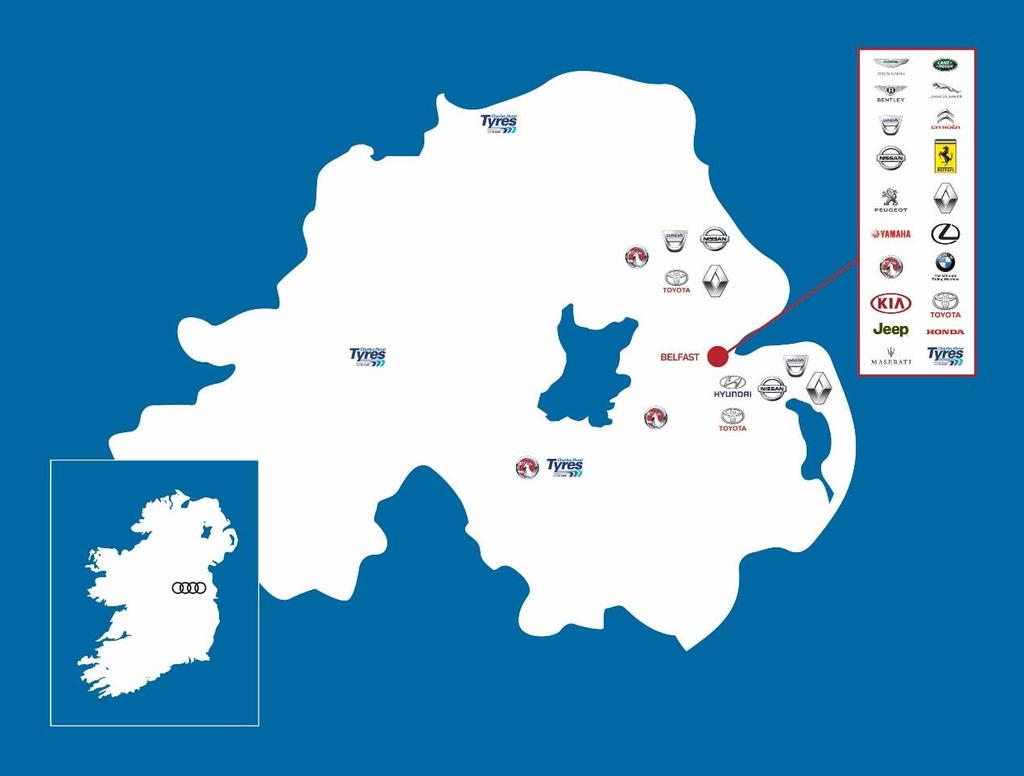
7 Right Brands, Right Locations 7
8 Transformed Portfolio % change Outlets Total Turnover (Gross) 1.75bn 4.93bn +181 Turnover per Outlet 14.2m 31.8m +124 Total GP 191m 464m +143 GP/ Outlet 1.54m 3.0m +95 PBT * 19.9m 75.5m +212 PBT per Outlet 160k 487k +204 *N.B. Excludes ancillary businesses and head office costs. Dealerships only. 8


9 Investment in Dealership Estate Glasgow Jaguar Dublin Audi Glasgow Volvo Colchester Land Rover Stockport Volvo m Maintenance m Upgrades m TOTAL

10 Financial Review 10
11 Robust Financial Performance Lookers plc 2017 m 2016 m Profit before tax of 68.4m Revenue increased 10% to 4.7 billion (2016: 4.3 billion) Earnings per share of 14.57p (2016: 15.87p) Final dividend increased by 5% to 2.48p per share (2016: 2.36p) Turnover 4, ,281.7 Gross profit Gross margin 10.7% 11.8% Operating Profit Interest Underlying Profit Before Tax Underlying Operating Margin 1.8% 2.2% Pre-Tax Margin 1.5% 1.8% EPS 14.57p 15.87p Net Debt Gearing 25% 22% EBITDA (12 months) Dividend per share 3.89p 3.64p Underlying Tax Charge Profit after Tax Return on Capital Employed 17.8% 22.6% 11
12 Financial performance: continuing operations Revenue increased by 15% Profit before tax increases by 5% Earnings per share increased by 1.3% 2017 m 2016 m Turnover 4, ,088.2 Operating Profit Interest (16.3) (17.6) Underlying Profit Before Tax Underlying Operating Margin 1.8% 2.0% Pre-Tax Margin 1.5% 1.6% Basic EPS 14.57p 14.38p 12
13 Underlying Profit Profit 2016 New Cars Used Cars Dealership Aftersales Costs Sale of Parts Division Finance Costs Profit
14 Strong growth across the business 2017 m 2016 m % change 2017 m 2016 m % change TURNOVER GROSS PROFIT New Cars 2,477 2,206 12% New Cars % Used Cars 1,702 1,437 18% Used Cars % Aftersales % Aftersales % Parts Division NC Parts Division - 55 NC Leasing and other % Leasing and other TOTAL TURNOVER 4,696 4,281 10% TOTAL GROSS PROFIT LFL TURNOVER LFL GROSS PROFIT New Cars: retail 1,499 1,477 2% New Cars: retail % New Cars: fleet % New Cars: fleet (9%) Used Cars 1,702 1,518 12% Used Cars % Aftersales % Aftersales % 14
15 Balance Sheet Low levels of gearing, at 25% (2016: 22%) Strong balance sheet and high level of unutilised bank facilities 2017 m 2016 m Fixed Assets Rental Fleet Vehicles (VRS) Dec Dec 2014 Stocks m m Debtors Current Liabilities (excluding bank loans) 1, ,105.2 Non Current Liabilities (excluding bank loans) Vehicle rental fleet finance (VRS) Net Assets Net Debt Gearing 25% 22% Net Debt / EBITDA
16 Positive Cash Flow Generation Cash flow was strong with cash generated from operations of 83.0m (2016: 140.9m) Invested 46.8m of capital expenditure in improving dealership facilities Received 8.1m for the sale of assets Net cash outflow was 36.4m compared to 92.3m in 2016 The ratio of net debt to EBITDA continued to be low Gearing was maintained at the low level of 25% compared to 22% at the start of the year 2017 m 2016 m EBITDA Working capital increase/(decrease) (17.8) 33.3 Cash generated from operations Acquisition of subsidiary companies - (92.6) Purchase of fixed assets (46.1) (36.3) Proceeds from asset disposals Purchase of intangibles (8.1) (9.2) Net proceeds from parts division Purchase of goodwill (1.3) - VRS Rental Fleet Vehicles purchased (87.1) (93.7) Sale of VRS Rental Fleet Vehicles Dividends paid to shareholders (15.0) (13.2) Loan repayments (12.5) (10.2) New loans Interest paid (net) (16.3) (17.6) Tax paid (25.5) (14.2) Pension payments (net) (3.6) (3.4) Shares issued (Increase) / Decrease in net debt (23.6) 87.6 (Decrease) / Increase in cash (36.4)
17 Consistent Financial Track Record m Group Pre-tax Profit Trend Group Net Assets Trend m m Group Net Debt

18 Operational Review 18
19 Industry backdrop Strong registrations in first quarter Weaker second quarter Continued double digit decline in second half Declining diesel share PCP is resilient Residual values stable Used and aftersales markets still strong 19
20 Diesel Progressive slow decline in diesel mix Accelerated change in mix from Q2 onwards Residual value (RV) decline in Q2 arrested in Q3 20

21 Diesel trends Diesel YOY performance 3 years 60,000 miles ,400,000 1,200,000 1,000, , , , , % 50.0% 40.0% 30.0% 20.0% 10.0% Jan Feb Mar Apr May Jun Jul Aug Sep Oct Nov Dec 0 0.0% -2.5 Diesel volume Diesel share
22 UK New Passenger Car Registrations by Fuel Type - Forecast 70% UK New Passenger Car Registrations by Fuel Type forecast 60% 50% 40% 30% 20% 10% 0% Diesel Petrol HEV PHEV BEV Source: CapHpi 22
23 m m New cars Growth in turnover and gross profit despite market downturn Finance penetration stable at 81% Strong gross profit increase of 6% in retail Maintained market share Fleet margins under pressure All figures on a like for like basis 1,600 1,400 1,200 1, LFL new car turnover +2% +6% 1,375 1,477 1, , Retail Fleet LFL total gross profit +6% (9)% Retail Fleet


24 33% 32% 38% 49% 52% 54% 63% 72% 79% 84% 84% 7% 7% 6% 5% 6% 7% 9% 17% 26% 37% 47% 50% Lookers PCP growth New Car Finance % Used Car Finance % 90% 80% 70% 67% 83% 79% 81% 75% 77% 78% 60% 50% 40% 37% 37% 37% 36% 38% 39% 42% 43% 42% 42% 42% 42% 60% 50% 55% 50% 61% 60% 56% 30% 20% 40% 10% 30% 0% New Finance % New PCP % Used Finance % Used PCP % 24 24
25 m m Used cars Turnover growth taking more market share Strong gross profit increase of 15% Finance penetration remained stable at 42% Residual value stability underpins robust margins despite diesel decline Continued discipline in stock management All figures on a like for like basis LFL used car turnover LFL total gross profit 1,750 1, % % 1,650 1,600 1,550 1,500 1,450 1, , ,518 1, ,
26 Monthly movements 3 years 60,000 miles 1.5 Stable monthly movements Seasonal Avg to Source: CAP HPi 26
27 m m Dealership Aftersales Turnover and gross profit grew in line with the parc growth Strong gross margin result All figures on a like for like basis LFL aftersales turnover LFL aftersales gross profit % % (1%)
28 2007 H H H H H H H H H H H H H H H H H H H H H H1 Dealership Aftersales Retention Strategy Cumulative Service Plans Live book % Vehicles sold with a service plan 120, ,000 39% 38% 37% 38% 38% 38% 38% 80,000 36% 35% 60,000 40,000 34% 33% 32% 32% 33% 20, % 30% 29% All figures on a like for like basis 28


29 Investing in our technology new website 2017 Users: +25% YoY 2017 Enquiries: +34% YoY Better Search Functionality and Improved User Experience - Driven by Our Customers Enhanced for Mobile Personalised Content for Returning Customers My Lookers section for Saved Search Terms and Shortlisted Vehicles Cleaner, De-cluttered and Easier to Access Content with More Intuitive Navigation 29


30 Attracting Talent 30

31 Outlook 31
32 Outlook Confident of further progress in 2018 Our strategy is working New car market expected to fall by c. 6% Biggest impact in Q1 then comparatives ease Demonstrated resilience in new car GP vs market Expect to see further growth in used and aftersales GP Restructuring actions in 2017 will mitigate cost pressures in 2018 and beyond Acquisition opportunities will further increase EPS 32

33 Appendices 33


34 Strong market fundamentals Car sales track population growth and GDP EU now recovered to previous peak New car registration growth 3,000,000 2,500,000 2,000,000 1,500,000 1,000, ,000 0 EU Car Registrations m
35 Strong market fundamentals Used vehicle market New Used Average age of used vehicles Source: SMMT and DVLA Data Source: Statista.com 35
36 Millions Dealership Aftersales Market Fundamentals % +8% Forecast 0-3 Years 4-6 Years 7-9 Years Years Source: SMMT 36

37 Market Update: Consolidation of Ownership Creates Opportunities Gradual reduction in franchised dealerships set to continue Will drive up average sales per outlet Helps leverage fixed cost base 37


38 Acquisition history: Delivering successful integration and synergies AMERSHAM VRS Lomond Group Chipperfield Land Rover Canterbury Mercedes smart Benfield Motor Group Amersham Jaguar Knights BMW Drayton Mercedes-Benz Total Acquisition cost c 200m 2017 profit of c 40m ROI 20% 38
39 Business Portfolio Franchise & Distribution Outlets MOTOR DIVISION Dacia Jaguar Mercedes-Benz Peugeot Toyota Volkswagen CV SERVICE CENTRE Aston Martin Belfast Amersham Ashford Belfast Belfast Carlisle Renault Chelmsford Belfast Carlisle Belfast Brighton Dundonald Darnley Vauxhall Dundonald Chester Glasgow Canterbury Renault Newtonabbey Glasgow Audi Newcastle West London Eastbourne Belfast Guildford Ayr Newtonabbey Gatwick Carlisle Vauxhall Newcastle LEASING Basingstoke Newtonards Jeep Maidstone Chester Belfast Teesside Harrogate Camberley Stockport Belfast Shrewsbury Newcastle Birkenhead Dublin Stafford Newtonabbey Birmingham Volvo Edinburgh Ferrari Kia Stoke on Trent Newtonards Chester Colchester FLEET FINANCIAL Glasgow Belfast Belfast Stourbridge Stockport Ellesmere Port Glasgow Belfast Guildford Newcastle Tonbridge Lisburn Stockport Hamilton Ford Stockport Walsall Seat Liverpool VEHICLE RENTAL Newcastle Braintree Wolverhampton Manchester Newtonabbey USED CAR SERVICES Stirling Chelmsford Land Rover Worcester Stockport Portadown Belfast Beaconsfield Teesside Colchester Belfast Selly Oak Dublin Tyneside Guiseley Bishops Stortford MINI Skoda Speke AGRICULTURAL Wearside Harrogate Chelmsford Crewe Eccles St. Helens MOTORCYCLES DIVISION Leeds Chipperfield Stafford Guildford Warrington BMW Belfast Darley Dale Bentley Sheffield Colchester Stoke-on-Trent Harrogate Yardley Honda Belfast Tuxford Belfast South W Ferrers Glasgow North Manchester Yamaha Belfast Sudbury Glasgow South Nissan Newcastle Volkswagen BMW Sunderland London Battersea Belfast Stockport London - Battersea TPS Crewe Motherwell Carlisle West London Blackburn Edinburgh Stafford Honda West London Chester Blackpool Glasgow Stoke-on-Trent Orpington Gateshead Smart Carlisle Guildford Lexus Leeds Brighton Dumfries Newcastle Citroen Hyundai Belfast Motherwell Gatwick Darlington Reading Belfast Dundonald Newcastle Maidstone Guildford Teesside Motherwell Maserati Newtonabbey Shrewsbury Morden Belfast Newtonards Stoke-on-Trent Newcastle TYRES Stourbridge Northallerton Belfast Boucher Rd Tonbridge Preston Belfast Sydenham Rd Wolverhampton Silverlink Colerane Worcester Teesside Omagh Walton-on-Thames Portadown 39

40 Franchise Locations

41 Thank you
Annual Results: Year ended 31 December 2016
 Annual Results: Year ended 31 December 2016 Presented by Andy Bruce Chief Executive Officer Robin Gregson Chief Financial Officer Nigel McMinn Chief Operating Officer 1 1 Record profits and well positioned
Interim Results: Half Year Ended 30 June 2018
 Interim Results: Half Year Ended 30 June 2018 Presented by Andy Bruce Chief Executive Officer Robin Gregson Chief Financial Officer Nigel McMinn Chief Operating Officer Highlights Profit before tax of
Interim Results Half Year Ended 30 June 2009
 Interim Results Half Year Ended 30 June 2009 Presented by Ken Surgenor, Chief Executive Robin Gregson, Finance Director Peter Jones, Managing Director - Motor Division 1 1 Overview Strong first half result
Vertu Motors plc ( Vertu Motors or the Group ) Pre-close Trading Update. Trading ahead of expectations with record revenues and profits.
 Pre-close Trading Update. Trading ahead of expectations with record revenues and profits.") 8 March 2016 Vertu Motors plc ( Vertu Motors or the Group ) Pre-close Trading Update Trading ahead of expectations with record revenues and profits. Vertu Motors, the automotive retailer with a network
8 March 2016 Vertu Motors plc ( Vertu Motors or the Group ) Pre-close Trading Update Trading ahead of expectations with record revenues and profits. Vertu Motors, the automotive retailer with a network
The Property Franchise Group
 The Property Franchise Group Capital Markets Event 22 October 2015 This afternoon s agenda 2 15:15 Welcome Richard Martin, Chairman 15:20 Introduction to MartinCo PLC Ian Wilson, Chief Executive Officer
2007/08 Full Year Results Investor Briefing
 2007/08 Full Year Results Investor Briefing Highlights of Result Profit before tax up 46% to $1,408 million Up 36% on the reported result Margin improvement $3 billion of Sustainable Future Benefits achieved
2006 Preliminary Results. 7 March 2007
 2006 Preliminary Results 7 March 2007 Anthony Rabin 16 Headline numbers 2005 2006 Revenue 4,938m 5,852m +19% Pre-tax profit* 134m 152m +13% Adjusted eps* 24.1p 27.3p +13% Full-year proposed dividend 8.1p
Interim results. 11 May 2010
 Interim results 11 May 2010 Introduction Andy Harrison Chief Executive Officer Strong performance despite disruption Improvement in revenue, margins and cash Continued network improvement has driven better
SAS Group Presentation Carnegie, May 22, 2012 Sture Stölen, Head of IR
 SAS Group Presentation Carnegie, May 22, 2012 Sture Stölen, Head of IR 1 This is the SAS Group 128 destinations 27,2 million passengers 28 new routes to be launched 2012 1,085 daily flights Revenues 2011,
Summary of Results for the First Three Quarters FY2015/3
 Summary of Results for the First Three Quarters FY2015/3 February 10, 2015 Tokyu Corporation (9005) http://www.tokyu.co.jp/ Contents Ⅰ.Executive Summary 2 Ⅱ.Conditions in Each Business 5 Ⅲ.Details of Financial
Cris Tarrant CEO (BVA State of the Nation. Joe Stather Associate Director #2018HIF
 Cris Tarrant CEO (BVA BDRC) @cristarrant State of the Nation Joe Stather Associate Director (CBRE) @joestather #2018HIF Cris Tarrant CEO (BVA BDRC) @cristarrant Trends & Spends Joe Stather Associate Director
McLAREN AND ROLLS ROYCE STRATFORD ROAD, HOCKLEY HEATH, SOLIHULL, B94 5NH
 McLAREN AND ROLLS ROYCE STRATFORD ROAD, HOCKLEY HEATH, SOLIHULL, B94 5NH Investment Summary Prime car dealership developed in 2011 Operating two of the UK s most prestigious franchises of McLaren and
Vertu Motors plc ( Vertu or Group ) Final results for the year ended 29 February 2016 Strong aftersales performance drives record revenues and profits
 Final results for the year ended 29 February 2016 Strong aftersales performance drives record revenues and profits") 11 May 2016 Vertu Motors plc ( Vertu or Group ) Final results for the year ended 29 February 2016 Strong aftersales performance drives record revenues and profits Vertu Motors plc, the UK automotive retailer
11 May 2016 Vertu Motors plc ( Vertu or Group ) Final results for the year ended 29 February 2016 Strong aftersales performance drives record revenues and profits Vertu Motors plc, the UK automotive retailer
For personal use only. Merrill Lynch Emerging Stars Conference
 Merrill Lynch Emerging Stars Conference October 2013 Performance History Share Price Performance 12 Months 150 100 18.8% (3.6%) 14 Oct 2013 AHE ASX Small Ords Share price $3.72 2193.21 50 0 Oct-12 Dec-12
Management Presentation. November 2011
 Management Presentation November 2011 Forward looking statements This presentation as well as oral statements made by officers or directors of Allegiant Travel Company, its advisors and affiliates (collectively
Air China Limited Annual Results. March Under IFRS
 Air China Limited 21 Annual Results Under IFRS March 211 Agenda Part 1 Highlights Part 2 Business Overview Part 3 Financial Overview Part 4 Outlook 2 Part 1 Highlights Steady Economic Growth; Asia Pacific
EASYJET TRADING STATEMENT FOR THE QUARTER ENDED 31 DECEMBER easyjet delivers a good start to the year, in line with expectations
 EASYJET TRADING STATEMENT FOR THE QUARTER ENDED 31 DECEMBER 2018 easyjet delivers a good start to the year, in line with expectations Summary easyjet has delivered a good performance in the quarter with
Summary of Results for the First Quarter of FY2015/3
 Summary of for the First Quarter of FY2015/3 August 8, 2014 Tokyu Corporation (9005) http://www.tokyu.co.jp/ Contents Ⅰ.Executive Summary 2 Ⅱ.Conditions in Each Business 4 Ⅲ.Details of Financial for the
SHAPING A SUSTAINABLE FUTURE
 SHAPING A SUSTAINABLE FUTURE Full Year Results Year ended 31 March 2017 Analyst and Investor Presentation 8 June 2017 Agenda Introduction Christine Ourmieres-Widener Financial Review Philip de Klerk Performance
AHG ANNOUNCES SOLID FULL YEAR RESULT, ACQUISITION OF FIRST AUDI FRANCHISE AND $90 MILLION PLACEMENT TO SUPPORT EXECUTION OF FURTHER GROWTH INITIATIVES
 Not for release or distribution in the United States AHG ANNOUNCES SOLID FULL YEAR RESULT, ACQUISITION OF FIRST AUDI FRANCHISE AND $90 MILLION PLACEMENT TO SUPPORT EXECUTION OF FURTHER GROWTH INITIATIVES
Heathrow (SP) Limited
 Limited") Draft v2.0 10 Feb Heathrow (SP) Limited Results for year ended 31 December 2013 24 February 2014 Strong operational and financial performance in 2013 Passenger satisfaction at record high and over 72 million
Draft v2.0 10 Feb Heathrow (SP) Limited Results for year ended 31 December 2013 24 February 2014 Strong operational and financial performance in 2013 Passenger satisfaction at record high and over 72 million
Investor update presentation. November 2016
 Investor update presentation November 2016 Content Update on Q3 2016 financial performance 3-8 Recap on ATG Evolution 9-10 Update on hospitality strategic business unit 11-14 Update on online travel and
Annual Results. Year ended 28 April June 2018
 1 Annual Results Year ended 28 April 2018 28 June 2018 Cautionary statement 2 This document is solely for use in connection with a briefing on the group headed by Stagecoach Group plc ( the Group ). This
Management Presentation. September 2011
 Management Presentation September 2011 Forward looking statements This presentation as well as oral statements made by officers or directors of Allegiant Travel Company, its advisors and affiliates (collectively
An innovative media company delivering sustainable, profitable growth Half year results 21 st August 2013
 An innovative media company delivering sustainable, profitable growth Half year results 21 st August 2013 Richard Findlay Chairman An innovative media company delivering sustainable, profitable growth
Management Presentation. March 2016
 Management Presentation March 2016 Forward looking statements This presentation as well as oral statements made by officers or directors of Allegiant Travel Company, its advisors and affiliates (collectively
SAS Group Q Teleconference
 SAS Group Q4 2012 Teleconference December 12, 2012 1 Break-even result in 2012 despite 1.6 bn SEK higher fuel cost 23 MSEK EBT (before non-recurring items) despite 1.6 bn SEK higher fuel cost Positive
PRIME AUTOMOTIVE INVESTMENT
 PRIME AUTOMOTIVE INVESTMENT Silverlink Business Park, Middle Engine Lane, Newcastle upon Tyne, NE28 9NZ 15 years unexpired let to Honda (no breaks) with fixed uplifts INVESTMENT CONSIDERATIONS The property
Air China Limited 2014 Annual Results Under IFRS
 Air China Limited 2014 Annual Results Under IFRS March 2015 Agenda Part 1 Results Highlights Part 2 Business Overview Part 3 Financial Overview Part 4 Outlook Part 1 Results Highlights Gradual Global Economic
Six Continents PLC. Preliminary Results. For the Year ended 30th September 2001
 1 2 Six Continents PLC Preliminary Results For the Year ended 30th September 2001 3 SIR IAN PROSSER Chairman Business Results Operating Profit ( m)( 4 Six Continents Hotels 427 Up 13.6% Six Continents
THE GO-AHEAD GROUP PLC HALF YEAR RESULTS FOR THE SIX MONTHS ENDED 29 DECEMBER 2018
 THE GO-AHEAD GROUP PLC HALF YEAR RESULTS FOR THE SIX MONTHS ENDED 29 DECEMBER 2018 BUSINESS OVERVIEW Continued good progress made in all three strategic pillars: protect and grow the core; win new bus
Interim Report 6m 2014
 August 11, 2014 Interim Report 6m 2014 Investors and Analysts Conference Call on August 11, 2014 Joachim Müller, CFO Latest ad-hoc release (August 4, 2014) Reduction of forecast, primarily due to a further
Cathay Pacific Airways Interim Results 04 August Cathay Pacific Airways Interim Results 6 August 2008
 Cathay Pacific Airways 2010 Interim Results 04 August 2010 Cathay Pacific Airways 2008 Interim Results 6 August 2008 Interim Result 1H 2010 1H 2009 Group Profit/(Loss) HK$6,840m HK$812m Group Turnover
For personal use only
 Automotive Holdings Group Limited 21 Old Aberdeen Place West Perth, WA 6005 www.ahgir.com.au ABN 35 111 470 038 PRESENTATION TO MACQUARIE CONFERENCE 7 th May 2015 The company advises the attached presentation
Highlights from the Annual Results December 2007
 Highlights from the Annual Results December 2007 Disclaimer The information in this document is taken from the BAA 2007 Annual Results ( the Results ) which were published on 11 March 2008 and other public
QANTAS ANNOUNCES PROFIT RESULT HALF-YEAR ENDED 31 DECEMBER 2009
 QANTAS ANNOUNCES PROFIT RESULT HALF-YEAR ENDED 31 DECEMBER 2009 HIGHLIGHTS TWO BRAND STRATEGY DELIVERS RESILIENCE AND CONTAINS COSTS Statutory Net Profit Before Tax of $90 million Underlying Profit Before
QANTAS DELIVERS STRONG FIRST HALF RESULT DESPITE HIGHER FUEL BILL
 ASX and Media Release Sydney, 21 February 2019 QANTAS DELIVERS STRONG FIRST HALF RESULT DESPITE HIGHER FUEL BILL Underlying Profit Before Tax: $780 million (down $179 million) Statutory Profit Before Tax:
Heathrow (SP) Limited
 Limited") 28 April 2014 Heathrow (SP) Limited Results for three months ended 31 March 2014 Strong operational and financial performance at the outset of the new regulatory period Highest ever passenger satisfaction
28 April 2014 Heathrow (SP) Limited Results for three months ended 31 March 2014 Strong operational and financial performance at the outset of the new regulatory period Highest ever passenger satisfaction
Cathay Pacific Airways Interim Results for the six months ended 30 June 2012
 Cathay Pacific Airways Interim Results for the six months ended 30 June 2012 8 August 2012 1 Interim Result 1H2012 1H2011 Change Group attributable (loss) / profit HK$ million (935) 2,808-133.3% Group
Analysts Briefing. 18 March Cathay Pacific Airways Limited
 Analysts Briefing 18 March 2015 Cathay Pacific Airways Limited Annual Results 2014 2013 Change Group attributable profit HK$m 3,150 2,620 +20.2% Group turnover HK$m 105,991 100,484 +5.5% Profit margin
The Outlook for the Residential Construction Industry Hunter and the Central Coast
 The Outlook for the Residential Construction Industry Hunter and the Central Coast Graham Wolfe HIA Chief Executive Industry Policy and Media HIA Industry Outlook Breakfast Newcastle February 2013 Backdrop:
IRISH CONTINENTAL GROUP, plc. Interim Update 8th September 2005
 IRISH CONTINENTAL GROUP, plc Interim Update 8th September 2005 ICG Profile 1. Irish Ferries Biggest ferry company operating between UK / Continent and Republic of Ireland. Modern fleet of large ships Major
AGENDA. Group overview. Financial highlights. Operational highlights. Expansion plans
 1 AGENDA Group overview Financial highlights Operational highlights Expansion plans 2 3 CURRENT FOOTPRINT Kenya 12 stores 2 DCs Tanzania 2 stores Number of stores 31-Dec-16 31-Dec-17 Increase: Dec-16 to
Management Presentation. November 2018
 Management Presentation November 2018 Forward looking statements This presentation as well as oral statements made by officers or directors of Allegiant Travel Company, its advisors and affiliates (collectively
3rd Quarter Result for Fiscal year ending February 29, 2016
 Last updated: January 12, 2016 3rd Quarter Result for Fiscal year ending February 29, 2016 January 12, 2016 Gulliver International Co., Ltd. (7599) Contents Ⅰ. 3rd Quarter Result for FY 2016 Ⅱ. Status
Managing through disruption
 28 July 2016 Third quarter results for the three months ended 30 June 2016 Managing through disruption 3 months ended Like-for-like (ii) m (unless otherwise stated) Change 30 June 2016 30 June 2015 change
Execution of WIN2016 programme currently underway, confirmation of underlying operating margin target of 5-6% for 2015/2016
 Press Release Results for the year ending 30 September 2013 Paris, 4 December 2013 Note: this press release presents consolidated 2013/2013 earnings established under IFRS accounting rules, currently being
Annual General Meeting May 3 rd FULL YEAR RESULTS DELIVERING OUR PROMISE
 Annual General Meeting May 3 rd 2018 2017 FULL YEAR RESULTS DELIVERING OUR PROMISE Key Value Drivers By focusing on our customers, our people, our brands and our growth strategy: We continue to outperform
Analysts and Investors conference call. Q results. 15 May 2013
 Analysts and Investors conference call Q1 2013 results 15 May 2013 Management summary Key messages of Q1 2013 +6% +9% +3.3%p. Q1 2013 operational KPIs are in line with 109.7 116.2 6.5 7.1 82.3 85.6 expectations,
Tat Hong Reports 13% Decline in FY2017 Revenue
 FOR IMMEDIATE RELEASE Registration No: 199105392H Tat Hong Reports 13 Decline in FY2017 Revenue - Cash and cash equivalents of S$114.3 million - Cash flow from operations of S$85.2 million - Net gearing
Results for the year ended 31 December Creating Advantage
 Results for the year ended 31 December 2018 Creating Advantage 2018 Overview Record revenues and profits Revenue 225m +14% HPBT 31m +26% Growth in Healthcare Revenue 152m +27% Profits 35m +36% Return to
Leaving the Competition Behind. Second Quarter (Apr-Jun) 2009 Results
 2009 Results") Leaving the Competition Behind Second Quarter (Apr-Jun) 2009 Results 12 Aug 2009 1 Disclaimer Information contained in our presentation is intended solely for your reference. Such information is subject
Leaving the Competition Behind Second Quarter (Apr-Jun) 2009 Results 12 Aug 2009 1 Disclaimer Information contained in our presentation is intended solely for your reference. Such information is subject
Full Year 2009 Results
 Full Year 2009 Results 1 Antonio Vázquez Chairman & Chief Executive Officer 2 Highlights 2009 Strong decrease in revenues: weak demand and yield deterioration. High competition and drop of business traffic.
M2 Group Ltd 2014 Interim Results
 M2 Group Ltd 2014 Interim Results 24 February 2014 Geoff Horth, CEO Presentation Content Record Financial Performance Strong Organic Growth FY14 Priorities and Guidance Slide 2, 24 February 2014 Record
Summary o f Results for the First Half of FY2018
 Summary o f Results for the First Half of FY2018 November 9, 2018 (9005) https://www.tokyu.co.jp/ Contents Ⅰ.Executive Summary 2 Ⅱ.Conditions in Each Business 6 Ⅲ.Details of Financial Results for the 13
2018 full-year results
 2018 full-year results 01 Message from Chairman & CEO 02 FY 2018 Results 03 Business drivers 04 Outlook 02 FY 2018 financial results Key figures Revenue 2.85 Bn ROP 115 M Net debt 252 M Free cash flow
ICG Profile 63% 26% 11%
 ICG Profile 1. Irish Ferries Leading ferry company operating between UK / Continent and Republic of Ireland. Modern fleet of large ships Major barriers to entry Significant operational gearing Very strong
BAA (SP) Limited Results for six months ended 30 June July 2011
 Limited Results for six months ended 30 June July 2011") BAA (SP) Limited Results for six months ended 30 June 2011 July 2011 Record Q2 Heathrow traffic Good overall service standards Strong financial results Successful dollar and sterling financings H1 2011
BAA (SP) Limited Results for six months ended 30 June 2011 July 2011 Record Q2 Heathrow traffic Good overall service standards Strong financial results Successful dollar and sterling financings H1 2011
Interim Results Presentation to Investors
 Interim Results Presentation to Investors SIR IAN PROSSER CHAIRMAN BASS PLC Highlights 3 Turnover + 11.2% Operating profit * + 21.2% Earnings per share * + 13.6% Dividend per share + 3.1% * Adjusted for
SAS Q2 2017/2018 TELECONFERENCE
 SAS Q2 2017/2018 TELECONFERENCE 30 May 2018 Earnings as expected despite negative currency effect POSITIVES + Total revenue up MSEK 73 vs. LY + Currency adjusted yield up 0.6% vs. LY + EB-point sale revenue
Management Presentation. August 2012
 Management Presentation August 2012 Forward looking statements This presentation as well as oral statements made by officers or directors of Allegiant Travel Company, its advisors and affiliates (collectively
Presentation on Results for the 2nd Quarter FY Idemitsu Kosan Co.,Ltd. November 14, 2018
 Presentation on Results for the 2nd Quarter FY 2018 Idemitsu Kosan Co.,Ltd. November 14, 2018 Table of Contents 1. FY 2018 2nd Quarter Financials (1) Overview (2) Segment Information 2. Reference Materials
2005 Q3 investor update. 25 August 2005
 2005 Q3 investor update 25 August 2005 1 This communication is directed only at (i) persons having professional experience in matters relating to investments who fall within the definition of investment
Record Result. 2006/07 Full Year Results Investor Presentation. Moved on successfully following bid. Profit before tax % to $1,032 million
 2006/07 Full Year Results Investor Presentation August 16 2007 Record Result Moved on successfully following bid Profit before tax + 53.8% to $1,032 million Group returning above Cost of Capital 2 Key
2012 Result. Mika Vehviläinen CEO
 2012 Result Mika Vehviläinen CEO 1 Agenda Market environment in Q4 Business performance and strategy execution Outlook Financials 2 Market Environment According to IATA, Global air travel continues to
Q Analyst & investor presentation. 22 January 2019
 Q1 2019 Analyst & investor presentation 22 January 2019 Q1 performance Overview 1. Positive underlying revenue trend Robust demand across Europe Strong ancillary revenue performance Moderate competitor
Montie Brewer, President and CEO Joshua Koshy, Executive VP and CFO UBS Transport Conference
 Montie Brewer, President and CEO Joshua Koshy, Executive VP and CFO UBS Transport Conference 1 London, England September 17, 2007 Agenda Strongly positioned international airline Investment proposition
Q Fast growth continued, Comparable operating result at record high levels Pekka Vauramo
 2018 Fast growth continued, Comparable operating result at record high levels 17.7.2018 Pekka Vauramo 2 A good - Comparable operating result increased to new seasonal high Revenue Comparable operating
Thank you for participating in the financial results for fiscal 2014.
 Thank you for participating in the financial results for fiscal 2014. ANA HOLDINGS strongly believes that safety is the most important principle of our air transportation business. The expansion of slots
JET AIRWAYS (I) LTD. Presentation on Financial Results Q July 24, 2009
 LTD. Presentation on Financial Results Q July 24, 2009") JET AIRWAYS (I) LTD Presentation on Financial Results Q1 2010 July 24, 2009 1 1 1 Agenda Domestic operating environment Jet Airways performance highlights JetLite performance highlights Outlook 2 2 2 Domestic
JET AIRWAYS (I) LTD Presentation on Financial Results Q1 2010 July 24, 2009 1 1 1 Agenda Domestic operating environment Jet Airways performance highlights JetLite performance highlights Outlook 2 2 2 Domestic
Results 2Q17. August 9, 2017
 Results 2Q17 August 9, 2017 2Q17 Highlights Indicators 2Q17 Var. x 2Q16 ASK (BN) 10.4-3.0% Traffic (000) 7,261-1.3% RPK (BN) 8.1 +0.5% Load Factor 77.9% +2.7 p.p. Yield (R$ cents) 23.2 +4.8% Pax Revenue
The SAS Group five business areas as from Q SAS Group statement of income
 Weak full year result but according to plan Teleconference Fiscal year st Quarter weak according to plan nd Quarter passenger load factors and yields better than expected 3 rd and 4 th Quarter pressure
2006 Interim Results. 16 August 2006
 2006 Interim Results 16 August 2006 Sir David John Anthony Rabin Headline numbers First half 2005 First half 2006 Revenue 2,308m 2,773m +20% Pre-tax profit* 52m 60m +15% Adjusted eps* 9.3p 11.4p +23% Interim
TRAFFIC GROWS BY 35%, PROFITS INCREASE BY 44% TO 104.5M
 TRAFFIC GROWS BY 35%, PROFITS INCREASE BY 44% TO 104.5M Ryanair, Europe s largest low fares airline today (25 June 2001) announced a strong set of results for the year end March, 2001. Traffic for the
For Immediate Release: 2 December Holidaybreak plc ANNOUNCES PRELIMINARY RESULTS FOR THE YEAR ENDED 30 SEPTEMBER 2002
 For Immediate Release: 2 December 2002 ANNOUNCES PRELIMINARY RESULTS FOR THE YEAR ENDED 30 SEPTEMBER 2002 ( HBR ), the provider of specialist holidays, today announces its Preliminary results for the year
PRESS RELEASE Financial Results. Rising passenger traffic at 12.5m Exceeding 1bn in consolidated revenue
 PRESS RELEASE 2016 Financial Results Rising passenger traffic at 12.5m Exceeding 1bn in consolidated revenue Kifissia, 23 March 2017 AEGEAN reports full year 2016 results with consolidated revenue at 1,020m,
Fact Sheet for Q4 and Full Year 2017 pre IFRS 15 and 9 adjustments February 1, 2018
 Fact Sheet for Q4 and Full Year 2017 pre IFRS 15 and 9 adjustments February 1, 2018 Contents Daimler Group Stock Market Information 3 Earnings and Financial Situation 4-12 Information for Divisions Mercedes-Benz
Fact Sheet for Q4 and Full Year 2016 February 2, 2017
 Fact Sheet for Q4 and Full Year 2016 February 2, 2017 Contents Daimler Group Stock Market Information 3 Earnings and Financial Situation 4-13 Information for Divisions Mercedes-Benz Cars 14-17 Daimler
First Half 2013 Results. 16 mai 2013
 First Half 2013 Results 16 mai 2013 26 July 2013 Results Increasing effects of Transform 2015 Highlights of the First Half A difficult global economic environment Transform 2015 plan roll-out on track
Presentation on Results for the 3rd Quarter FY Idemitsu Kosan Co.,Ltd. February 14, 2019
 Presentation on Results for the 3rd Quarter FY 2018 Idemitsu Kosan Co.,Ltd. February 14, 2019 Table of Contents 1. FY 2018 3rd Quarter Results (1) Overview (2) Segment Information 2. Forecast for FY 2018
VW HUDDERSFIELD LEEDS ROAD HUDDERSFIELD HD2 1UL. Prime Automotive Investment
 LEEDS ROAD HUDDERSFIELD HD2 1UL Prime Automotive Investment Investment Summary Purpose built car dealership trading as Volkswagen Let to the strong covenant of Goodman Retail Limited, a subsidiary of Sytner
Ramsay Health Care Limited Results Briefing Year ended 30 June 2018
 Ramsay Health Care Limited Results Briefing Year ended 30 June 2018 Craig McNally, Managing Director & Bruce Soden, Group Finance Director 30 August 2018 ramsayhealth.com Agenda Group Performance Overview
2006 Preliminary Results. 14 November 2006
 2006 Preliminary Results 14 November 2006 1 Business highlights Record profit before tax of 129 million Passenger numbers up 11.5% to 33 million Fleet increased to 122 aircraft, new order announced today
Management Presentation. May 2013
 Management Presentation May 2013 Forward looking statements This presentation as well as oral statements made by officers or directors of Allegiant Travel Company, its advisors and affiliates (collectively
Minor International Public Company Limited
 Minor International Public Company Limited Management Discussion & Analysis MINT s financial performance as of 30th September 2008 Summary of Key Financial Performance 3Q08 Performance Minor International
Annual Results. Year ended 30 April June 2014
 1 Annual Results Year ended 30 April 2014 25 June 2014 Cautionary statement 2 This document is solely for use in connection with a briefing on the group headed by Stagecoach Group plc ( the Group ). This
2006 Interim Results. 03 May 2006
 2006 Interim Results 03 May 2006 1 Unlocking our potential Strong foundation Powerful business model Great brand Strong market presence and scale The key to the future Building a strong leadership team
26 October 2017 Icelandair Group Interim Report NET PROFIT USD 101 MILLION IN THIRD QUARTER
 NET PROFIT USD 101 MILLION IN THIRD QUARTER Total income in Q3 up by 10% between years, to USD 536.0 million Passenger revenue higher than expected EBITDA unchanged year on year, at USD 161.1 million Passenger
Jan-18. Dec-17. Travel is expected to grow over the coming 6 months; at a slower rate
 Analysis provided by TRAVEL TRENDS INDEX DECEMBER 2018 CTI reading of 51.8 in December 2018 indicates that travel to or within the U.S. grew 3.6% in December 2018 compared to December 2017. LTI predicts
FY2015 2nd Quarter Business Results
 FY2015 2nd Quarter Business Results Project AH A MAY products Yamaha Corporation and Yamaha Motor Co., Ltd. make products by exchanging the design divisions and their design fields, and present a joint
Jet Airways (India) Ltd. Presentation on Annual Results FY06. May 2006
 Ltd. Presentation on Annual Results FY06. May 2006") Jet Airways (India) Ltd. Presentation on Annual Results FY06 May 2006 1 Agenda 1. Performance Highlights 2. Sahara Acquisition Update 3. Outlook 2 Performance Highlights 3 Domestic landscape capacity growth
Jet Airways (India) Ltd. Presentation on Annual Results FY06 May 2006 1 Agenda 1. Performance Highlights 2. Sahara Acquisition Update 3. Outlook 2 Performance Highlights 3 Domestic landscape capacity growth
Q Analyst & investor presentation. 23 January 2018
 Q1 2018 Analyst & investor presentation 23 January 2018 Strong start in 2018 Strengthening our market positions across the network Network Q1 RPS @ CC up 6.6% - positive underlying revenue trend Cost Underlying
Presentation on Results for the 2nd Quarter FY Idemitsu Kosan Co.,Ltd. November 1, 2016
 Presentation on Results for the 2nd Quarter FY 2016 Idemitsu Kosan Co.,Ltd. November 1, 2016 Table of Contents 1. 2nd Quarter FY 2016 Financials (1) Overview (2) Segment Information 2. Reference Materials
LANDLORD INFORMATION PACK MARCH 2018
 LANDLORD INFORMATION PACK MARCH 2018 WHO WE ARE JD SPORTS FASHION PLC Established in 1981, JD Sports Fashion Plc is a leading multichannel retailer of sports fashion and outdoor brands in the UK and Europe.
1 st Quarter Results FY
 1 st Quarter Results FY 2004-05 05 Q1 Highlights p Context 8Improving economic context 8Strong economic growth in Americas and Asia 8Modest economic recovery in Europe 8Soaring fuel prices 8IPE Brent up
Press Release. Bilfinger 2017: Stable foundation laid for the future
 Press Release February 14, 2018 Bilfinger 2017: Stable foundation laid for the future Organic growth in orders received after three years of decline Trend reversal: Output volume better than expected Growth
Corporate presentation CIBC Whistler Institutional Investor Conference January 21, 2010
 Corporate presentation CIBC Whistler Institutional Investor Conference January 21, 2010 Forwardlooking statement Certain information in this presentation and statements made during this presentation, including
Fact Sheet for Q3 and January-September 2017 October 20, 2017
 Fact Sheet for Q3 and January-September 2017 October 20, 2017 Contents Daimler Group Stock Market Information 3 Earnings and Financial Situation 4-12 Information for Divisions Mercedes-Benz Cars 13-16
Air Berlin PLC AGM 06 June 2013 London
 Air Berlin PLC AGM 06 June 2013 London airberlin a strong European carrier Market position as of 31 December 2012 No. 2 in core market: Germany / Austria / Switzerland No. 7 in Europe with 33.3 m guests
Finnair Q Result
 Finnair Q1 2015 Result 7 May 2015 CEO Pekka Vauramo, Interim CFO Mika Stirkkinen 1 Turbulent market environment The weakness of the Finnish economy continued to be reflected in the demand in the first