ICG Profile 63% 26% 11%
|
|
|
- Susan Davis
- 5 years ago
- Views:
Transcription
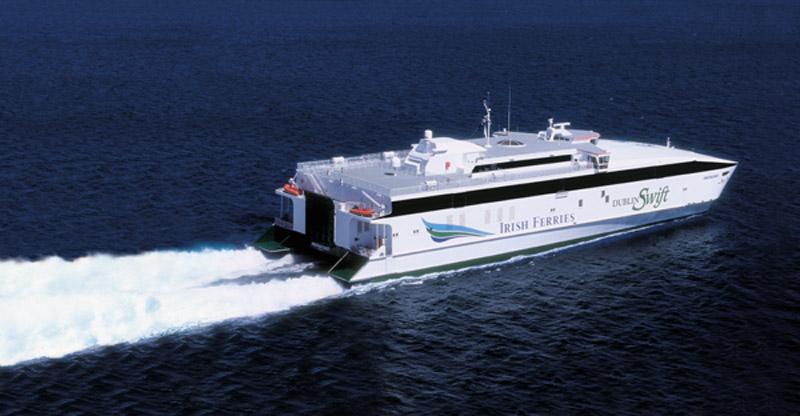
1 ICG Profile 1. Irish Ferries Leading ferry company operating between UK / Continent and Republic of Ireland. Modern fleet of large ships Major barriers to entry Significant operational gearing Very strong free cash flow 2. Ship Chartering Division Diversified ship charter business Capital Employed 63% 26% 3. Container Division Largest container stevedoring terminal in Ireland Leading container operator between Ireland and the Continent 1 11%
2 ICG - Group Performance Half Year Half Year Full Year m m m Turnover EBITDA Depreciation/Amortisation (13.0) (12.8) (27.7) Operating Profit Interest 2.8 (2.6) (4.7) PBT EPS Basic (cent) 10.6c 6.4c (66.9c) EPS Adjusted (cent) 10.6c 6.4c 57.9c Cash EPS (cent) 65.9c 61.3c 177.0c Dividend (Redemption) per Share (cent) 10.9c 9.9c 29.1c Net Debt (m)
3 Container Division Half Year Half Year Full Year m m m Turnover EBITDA Depreciation/Amortisation (1.5) (1.4) (3.7) Operating Profit
4 Operations & Key Issues Container Routes Ireland / Continent - Door to Door plus Quay to Quay UK / Continent - Quay to Quay container movement Port Ownership Container Terminal in Dublin Development in Belfast late Key Issues High fuel costs (up 45% in H1) Higher charter costs (up 12% in H1) Consolidation in Deep Sea shipping resulting in changes to feeder contracts Dublin Port Tunnel delayed to end 2006

5 Container Routes Grangemouth Belfast Dublin Cork Cork Waterford South Shields Liverpool Holyhead Holyhead Immingham Pembroke Pembroke Felixstowe Tilbury Southampton 14 ships 13 ports 25 routes Rotterdam Antwerp Rotterdam 5 Le Havre
6 Market Share LoLo 2005 (est.) All Ireland (UK & Continent) % Peel Holdings 33 ICG 24 Samskip 16 Norfolk Line (Maersk)* 9 C2C 8 Others 10 Total 100 * Now DFDS
7 Container Terminal Market 1.3 Million Teu in year lease of 33 acres from metres of berths (9-11 metres depth) 7 Picture courtesy of The Irish Times
8 Container handling in Ireland Market Share 22% 2005 CAGR Volume % % 14 13% % 6% 4% 7% 7% 7% 6% Market ICG Last 10 Yrs Last 5 Yrs Last 3 Yrs 2005
9 Ferries & Ship Chartering Half Year Half Year Full Year m m m Turnover EBITDA Depreciation/Amortisation (11.5) (11.4) (24.0) Operating Profit
10 Operations Ship Chartering 2 ferries on charter to P&O Irish Ferries 4000 departures to and from UK 250 departures to and from France 10

11 Ship Chartering Division Pride of Bilbao Night Ferry; 2400 beds, 580 cars, built 1986 Challenger 11 Day Ferry; 600 cars or 108 trucks built 1995 Pride of Cherbourg
12 Ship Chartering Division Use of ship market knowledge and balance sheet strength to avail of potential charter opportunities in ferry and container shipping markets. Pride of Bilbao on charter to P&O since Next optional renewal date October Pride of Cherbourg on charter to P&O until July Options on both ships to be declared by end January

13 Irish Ferries - Ships 13

14 Irish Ferries - Ships 14
15 Irish Ferries Route Structure Larne Belfast Stranraer Cairnryan Dublin Rosslare Holyhead Liverpool Pembroke Rotterdam 15 Roscoff Cherbourg
16 Irish Ferries Route Structure Focus on short routes with high utilisation of ships. Major barriers to entry in Holyhead & Pembroke for key slots UK / Rep. Ireland Routes Over 92% of cars travel on short routes into Dublin and Rosslare Over 54% of RoRo units travel on short routes into Dublin and Rosslare 16
17 Passenger Car Market UK Ireland Market REPUBLIC OF IRELAND Volumes (Cars) Market Irish Irish Ferries Ferries Share H1: Jan - June % - 11% 41% July Aug* % - 13% 39% Jan Aug* % - 12% 40% 17 Weak car market due to low fare airlines and reduced ferry capacity. ISE ceased operation while Stena & IF reduced their craft capacity. Overall tourism capacity on short sea routes was down 11% to July 06 Average yield slightly up on last year *August market figures are estimated
18 Market Share Cars 2006 v 2005 (H1) Republic of Ireland - UK % % Irish Ferries Stena Line P&O Irish Sea 2 1 Irish Sea Express / IOMSPC 0 2 Swansea Cork 4 4 Norfolkline 3 1 Total


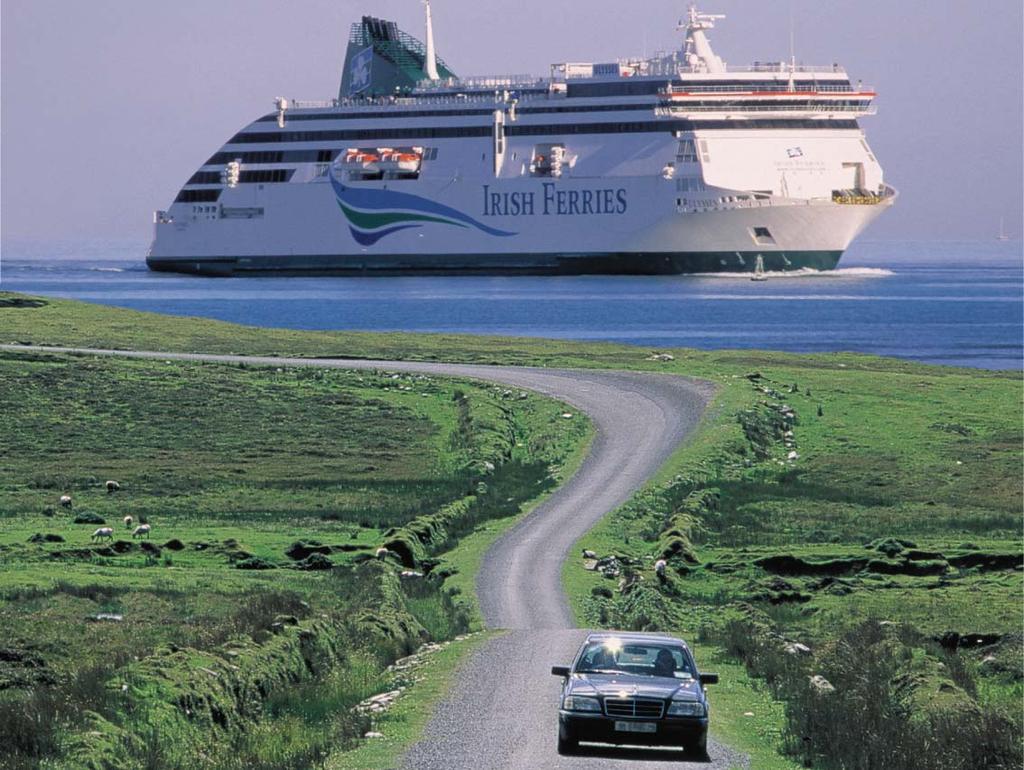
19 Irish Ferries - Advertisements 19

20 Irish Ferries - Distribution Car Booking Report 2006 All Markets Half Year Share Half Year % % Call Centres At our Ports 10 8 Internet Direct Travel Trade Total
21 RoRo Freight Market UK-Ireland 2006 REPUBLIC OF IRELAND Volumes Market Irish Market (Freight Units) Ferries Share Jan - June % 3% 27% July Aug* % 3% 28% Jan Aug* % 3% 27% Strong growth in the market in line with Ireland s economic growth and further integration with the rest of Europe. 21 Irish Ferries lower growth in first half of 2006 has benefited from technical disruptions to Stena Lines services in Competitors adding 4 new ships during 2006 and increasing capacity by 19% in a full year. Average yields slightly down on last year. *August market figures are estimated
22 Market Share RoRo 2006 V 2005 Rep. of Ireland - UK 2006 H H.1 % % Irish Ferries Stena Line Norfolkline P&O Irish Sea Celtic Link 1 0 Swansea Cork 0 1 Total


23 RoRo Freight Traffic Key Slots 23
24 RoRo Market Analysis Greater integration between Ireland & UK/Continent *(e) CAGR % % Value of Imports & Exports 45.1bn 241.5bn 13.8% GDP 40.0bn 161.2bn 11.3% Imports & Exports as % of GDP 113% 150%
25 Irish Ferries Revenue Mix
26 Irish Ferries Cost Analysis 2006 Payroll 26% Port Charges 26% 26
27 Restructuring Provision Benefit Charge 2006 m m 2004 Outsourcing crew on French route Shore side restructuring Dublin Ferryport Terminal Outsourcing crew on Irish Sea routes * Rebate of statutory redundancy (60%) (4.1) Pension curtailment (5.3) * Full year benefit 9.35m 27
28 Headcount Reduction Direct Employees June June June Irish Ferries Seagoing Shore (incl. ports) Total Container & Terminal & Group
29 Fuel Costs (f) Consumption (000 tons) Heavy Fuel Oil Marine Diesel Price ( per ton) Heavy Fuel Oil Marine Diesel Cost (2006 V s 2005) +21% 35m 29m 20m (2006 V s 2004) +75%
30 Cash Flow Half Year Half Year Full year 2006 m 2005 m 2005 m Operating Profit before restructuring Depreciation EBITDA (before restructuring) Working Capital Movement (1.1) Operating Cash Flow Interest (net) (2.6) (1.8) (4.9) Tax (1.0) (0.9) (1.7) Capex (8.4) (8.6) (12.9) Restructuring (36.3) (4.3) (5.9) Free Cash Flow (23.8) Dividends/Redemptions (4.5) (4.0) (6.3) Net Flow (28.3) Opening Debt (105.9) (117.9) (117.9) Translation / Other 1.8 (4.6) (1.9) Closing Debt (132.4) (115.9) (105.9)
31 Share Buybacks / Dividends Shares % Value AV. Share Price Buybacks m 8.1% 14.5m m 4.9% 9.8m m 2.9% 7.9m 11.4 TOTAL 4.08m 15.9% 32.2m 7.9 Authority to purchase up to an additional 2.3m shares (10%) valid up to 2007 AGM. Dividend Growth Since IPO Dividend ( IPO) 2.06c Dividend/Redemption (2005) 29.1 c CAGR ( ) 16.9% p.a. 31
32 Summary Balance Sheet June Dec m m Ships Other Retirement benefit asset 14 7 Working Capital (27) (22) Shareholders Equity Net Debt Provisions
33 Conclusion Leading position - Republic of Ireland / UK & Continent Significant capacity for growth in freight although tourism will remain challenging Restructuring of crew costs virtually complete No significant capex required, while offering best product/service to customers Strong free cash flow
34 34 Appendices
35 35 OPERATIONAL GEARING
36 Ulysses - RoRo Freight 36 81% night time utilisation 5 years growth at 5% p.a.100% night time utilisation in 2006 would yield additional 6.6m operating profit or 28.5 cent per share

37 Ulysses - Cars 12% day time utilisation (higher in holiday peaks) 37
38 Isle of Inishmore 1997 Price: 85m Year Built: 1997 Cars: 855 Trucks: 122 Passengers: 2,200 38

39 Jonathan Swift Price: 38m Year Built: 1999 Cars: 200 Coaches: 10 Passengers: 800
40 Ulysses Price: 107m Year Built: 2001 Cars: 1,342 Passengers: 1,900 Trucks: 240


41 Normandy Price: 20.8m Year Built: 1982 Cars: 420 Passengers: 1,577 Trucks: 43
42 Irish Continent/UK Market Share 24% 2005 CAGR Volume % % % % 6% 4% 7% 1% 6% -6% Market ICG 42 Last 10 Yrs Last 5 Yrs Last 3 Yrs 2005
43 Ulysses Boeing
44 Car Performance Irish Ferries Market Share % Rep. of Ireland % 43% 44% 44% 43% 43% 46% H H. 1
45 RoRo Freight Performance Irish Ferries Market Share % Rep. of Ireland 30 27% 27% 27% 28% 26% 27% 27% H H.1 45
46 RoRo Freight Traffic (1.6m) 000s Units Via Northern Ireland Ports 50% Compound Average Growth Rates % p.a % % % Via Republic of Ireland Ports % p.a. 6% p.a. 46
47 5/6 Year Performance Cash Flow Per Share % H H1 47
48 Composition Of Net Debt Currency m Fixed* Rate $ 15 26% 3.8% 24 36% 5.4% % 4.0% % 4.1% Cash (12.0) Net Debt 132 * Up to 3.5 years from 30 June
49 TAX LOW TAX Tonnage tax for Irish shipping activities (very low). Approved / encouraged by EU Std Corporation Tax for other activities (12.5%) Low blended corporate rate going forward 49


50 50 Interim Update 7 th September 2006
IRISH CONTINENTAL GROUP, plc. Interim Update 8th September 2005
 IRISH CONTINENTAL GROUP, plc Interim Update 8th September 2005 ICG Profile 1. Irish Ferries Biggest ferry company operating between UK / Continent and Republic of Ireland. Modern fleet of large ships Major
ICG Profile. Capital Employed 2003 % 1. Irish Ferries
 1. Irish Ferries ICG Profile Biggest ferry company operating between UK / Continent and Republic of Ireland. Modern fleet of large ships Major barriers to entry Significant operational gearing Very strong
ICG Profile 67% 22% 11% Leading ferry company operating between UK / Continent and Republic of Ireland. Capital Employed. 1.
 ICG Profile 1. Irish Ferries Leading ferry company operating between UK / Continent and Republic of Ireland. Capital Employed 67% 2. Ship Chartering Division 22% 3. Container Division Container stevedoring
Irish Continental Group plc Results Presentation, 23 March 2010
 Irish Continental Group plc 2009 Results Presentation, 23 March 2010 1 ICG Profile Capital Employed 1. Ferries Division Leading ferry company operating between UK/Continent and Republic of Ireland 85%
2018 Half Year Results Presentation 30 th August 2018
 2018 Half Year Results Presentation 30 th August 2018 Half Year 2018 Performance Summary 2018 2017 2018 2017 2018 2017 Revenue 157.2m +0.7% EBITDA 26.1m -11.8% Net Cash 54.6m Revenue for the year grew
Company Presentation. 05 January 2018
 Company Presentation 05 January 2018 Half Year 2017 Performance Summary Revenue 156.1 m +3.7% EBITDA 29.6 m 3.0% Net Cash 26.7 m +170.4% Basic EPS 22.8 c +121.4% Revenue for the first half of the year
DFDS A/S H Analyst meeting 30 August 2006
 DFDS A/S H1 2006 Analyst meeting 30 August 2006 DFDS A/S Contents The half-year in brief Strategy on track DFDS Seaways DFDS Tor Line Half-year accounts & profit forecast 2006 DFDS A/S H1 2006 in brief
Interim results. 11 May 2010
 Interim results 11 May 2010 Introduction Andy Harrison Chief Executive Officer Strong performance despite disruption Improvement in revenue, margins and cash Continued network improvement has driven better
PRESS RELEASE Financial Results. Rising passenger traffic at 12.5m Exceeding 1bn in consolidated revenue
 PRESS RELEASE 2016 Financial Results Rising passenger traffic at 12.5m Exceeding 1bn in consolidated revenue Kifissia, 23 March 2017 AEGEAN reports full year 2016 results with consolidated revenue at 1,020m,
PORT MARKETS IN NUMBERS STEPHEN TAYLOR
 PORT MARKETS IN NUMBERS STEPHEN TAYLOR PORT MARKETS IN NUMBERS 1 International trade trends 2 UK ports traffic 3 Summary of key indicators Data sources include: DfT mari3me sta3s3cs, HMRC trade sta3s3cs,
NORWEGIAN AIR SHUTTLE ASA QUARTERLY REPORT FIRST QUARTER 2004 [This document is a translation from the original Norwegian version]
![NORWEGIAN AIR SHUTTLE ASA QUARTERLY REPORT FIRST QUARTER 2004 [This document is a translation from the original Norwegian version]](/thumbs/87/95085804.jpg "NORWEGIAN AIR SHUTTLE ASA QUARTERLY REPORT FIRST QUARTER 2004 [This document is a translation from the original Norwegian version]") NORWEGIAN AIR SHUTTLE ASA QUARTERLY REPORT 2004 IN BRIEF At the start of 2003, Norwegian has become a pure low-fare airline. The Fokker F-50 operations have been terminated, and during the quarter the
NORWEGIAN AIR SHUTTLE ASA QUARTERLY REPORT 2004 IN BRIEF At the start of 2003, Norwegian has become a pure low-fare airline. The Fokker F-50 operations have been terminated, and during the quarter the
Finnair Group Interim Report 1 January 30 September 2008
 Finnair Group Interim Report 1 January 30 September 2008 1 31/10/2008 Presentation name / Author Airline industry at a historical turning point Expensive fuel price in the beginning of 2008 has dramatical
Western Channel crossings
 We are agents for the leading Cross-Channel ferry operators and also offer Eurotunnel. Our inclusive prices include the cost of a car and 2 adults on most Dover/Calais crossings with P&O Ferries. There
Annual Results. Year ended 28 April June 2018
 1 Annual Results Year ended 28 April 2018 28 June 2018 Cautionary statement 2 This document is solely for use in connection with a briefing on the group headed by Stagecoach Group plc ( the Group ). This
1 st Quarter Results FY
 1 st Quarter Results FY 2004-05 05 Q1 Highlights p Context 8Improving economic context 8Strong economic growth in Americas and Asia 8Modest economic recovery in Europe 8Soaring fuel prices 8IPE Brent up
2005 Q3 investor update. 25 August 2005
 2005 Q3 investor update 25 August 2005 1 This communication is directed only at (i) persons having professional experience in matters relating to investments who fall within the definition of investment
Finnair Group Annual Report 1 January 31 December 2006
 Finnair Group Annual Report 1 January 31 December 2006 2006: A year for restructuring Scheduled Passenger Traffic transforming to meet Asian traffic demands Labour negotiations to cut 670 jobs 80 million
First Half 2013 Results. 16 mai 2013
 First Half 2013 Results 16 mai 2013 26 July 2013 Results Increasing effects of Transform 2015 Highlights of the First Half A difficult global economic environment Transform 2015 plan roll-out on track
Q Fast growth continued, Comparable operating result at record high levels Pekka Vauramo
 2018 Fast growth continued, Comparable operating result at record high levels 17.7.2018 Pekka Vauramo 2 A good - Comparable operating result increased to new seasonal high Revenue Comparable operating
FIRST QUARTER 2017 RESULTS. 4 May 2017
 FIRST QUARTER 2017 RESULTS 4 May 2017 A resilient start of the year, traffic up 4.2% 20.9 million passengers carried, up 5.2%, traffic (RPK) up 4.2%, capacity (ASK) up 3.3% and load factor up 0.7pts Confirmation
For personal use only HILLS HOLDINGS HALF YEAR RESULTS FY2013
 HILLS HOLDINGS HALF YEAR RESULTS FY2013 TODAY KEY HIGHLIGHTS OUR FY13 FIRST HALF RESULTS GROUP PERFORMANACE FIRST HALF NPAT 1 $8.2M IN LINE WITH NOVEMBER AGM GUIDANCE. STRONG MANAGEMENT OF WORKING CAPITAL
26 October 2017 Icelandair Group Interim Report NET PROFIT USD 101 MILLION IN THIRD QUARTER
 NET PROFIT USD 101 MILLION IN THIRD QUARTER Total income in Q3 up by 10% between years, to USD 536.0 million Passenger revenue higher than expected EBITDA unchanged year on year, at USD 161.1 million Passenger
SAS Group Q Teleconference
 SAS Group Q4 2012 Teleconference December 12, 2012 1 Break-even result in 2012 despite 1.6 bn SEK higher fuel cost 23 MSEK EBT (before non-recurring items) despite 1.6 bn SEK higher fuel cost Positive
2012 Result. Mika Vehviläinen CEO
 2012 Result Mika Vehviläinen CEO 1 Agenda Market environment in Q4 Business performance and strategy execution Outlook Financials 2 Market Environment According to IATA, Global air travel continues to
Full Year 2009 Results
 Full Year 2009 Results 1 Antonio Vázquez Chairman & Chief Executive Officer 2 Highlights 2009 Strong decrease in revenues: weak demand and yield deterioration. High competition and drop of business traffic.
Third Quarter 2014 Results. 29 October 2014
 Third Quarter 2014 Results 29 October 2014 Highlights of the Third Quarter Operating environment Air France-KLM Economic environment remains weak Further currency volatility affecting revenues and results
MEDIA/ANALYST PRESENTATION FY RESULTS 11 MAY 2007
 MEDIA/ANALYST PRESENTATION FY2006-07 RESULTS 11 MAY 2007 SIA GROUP FY2006-07 07 RESULTS GROUP REVENUE FY2006/07 ($ million) ($ million) 15,000 14,494 14,000 13,000 12,000 11,000 10,515 12,013 13,341 Record
Management Presentation. March 2016
 Management Presentation March 2016 Forward looking statements This presentation as well as oral statements made by officers or directors of Allegiant Travel Company, its advisors and affiliates (collectively
SHAPING A SUSTAINABLE FUTURE
 SHAPING A SUSTAINABLE FUTURE Full Year Results Year ended 31 March 2017 Analyst and Investor Presentation 8 June 2017 Agenda Introduction Christine Ourmieres-Widener Financial Review Philip de Klerk Performance
Financial Review. Changing the Game
 Financial Review Changing the Game 1 $7,238 +8.1% Revenue (1) $ Millions $7,824 $10,095 30-Sep-05 30-Sep-06 12 Months Ended Sept. 9 months ended 30, 2006 2 8.1% revenue growth achieved with only 3.8% ASM
Management Presentation. November 2018
 Management Presentation November 2018 Forward looking statements This presentation as well as oral statements made by officers or directors of Allegiant Travel Company, its advisors and affiliates (collectively
TRAFFIC GROWS BY 35%, PROFITS INCREASE BY 44% TO 104.5M
 TRAFFIC GROWS BY 35%, PROFITS INCREASE BY 44% TO 104.5M Ryanair, Europe s largest low fares airline today (25 June 2001) announced a strong set of results for the year end March, 2001. Traffic for the
RYANAIR ANNOUNCES RECORD Q1 PROFIT INCREASE
 RYANAIR ANNOUNCES RECORD Q1 PROFIT INCREASE Ryanair, Europe s largest low fares airline today (Tuesday, 6 Aug 2002) announced its biggest increase in Q1 profits (end 30 Jun 02). Passenger traffic during
Final Results 31 December 2013
 Final Results 31 December 2013 Clarkson PLC 10 March 2014 www.clarksons.com Agenda Headline results Divisional performance Business Model & Strategy The market Outlook 10 March 2014 Final Results www.clarksons.com
Cathay Pacific Airways Interim Results 04 August Cathay Pacific Airways Interim Results 6 August 2008
 Cathay Pacific Airways 2010 Interim Results 04 August 2010 Cathay Pacific Airways 2008 Interim Results 6 August 2008 Interim Result 1H 2010 1H 2009 Group Profit/(Loss) HK$6,840m HK$812m Group Turnover
UCD Michael Smurfit Graduate Business School The Smurfiteers
 UCD Michael Smurfit Graduate Business School The Smurfiteers Security Analysis Ryanair Holdings Plc. By Quan Yuan Shane Carberry David Hannafin Huijie Song Shaozhe Liu Kashish Verma Quick Facts Ryanair
NORWEGIAN AIR SHUTTLE ASA QUARTERLY REPORT SECOND QUARTER 2006 [This document is a translation from the original Norwegian version]
![NORWEGIAN AIR SHUTTLE ASA QUARTERLY REPORT SECOND QUARTER 2006 [This document is a translation from the original Norwegian version]](/thumbs/74/71229964.jpg "NORWEGIAN AIR SHUTTLE ASA QUARTERLY REPORT SECOND QUARTER 2006 [This document is a translation from the original Norwegian version]") NORWEGIAN AIR SHUTTLE ASA QUARTERLY REPORT SECOND QUARTER 2006 SECOND QUARTER IN BRIEF had earnings before tax of MNOK 24.8 (20.6) in the second quarter. The operating revenue increased by 44 % this quarter,
NORWEGIAN AIR SHUTTLE ASA QUARTERLY REPORT SECOND QUARTER 2006 SECOND QUARTER IN BRIEF had earnings before tax of MNOK 24.8 (20.6) in the second quarter. The operating revenue increased by 44 % this quarter,
Media Release. Qantas Group Full Year 2017 Financial Result 1. Sydney, 25 August 2017
 Media Release Qantas Group Full Year 2017 Financial Result 1 Sydney, 25 August 2017 Underlying Profit Before Tax: $1,401 million (second highest in Qantas history) Statutory Profit Before Tax: $1,181 million
Q Finnair s growth continued Pekka Vähähyyppä
 2018 Finnair s growth continued 25.10.2018 Pekka Vähähyyppä 1 We continued to develop our services and network New route to Los Angeles in 2019, two daily flights to Hong Kong New digital service for exploring
PRESS RELEASE. First Half 2017 Financial Results Higher Load Factors and traffic lead to a significant rebound in second quarter profitability
 PRESS RELEASE First Half 2017 Financial Results Higher Load Factors and traffic lead to a significant rebound in second quarter profitability Kifissia, 12 September 2017 AEGEAN announces first half 2017
An innovative media company delivering sustainable, profitable growth Half year results 21 st August 2013
 An innovative media company delivering sustainable, profitable growth Half year results 21 st August 2013 Richard Findlay Chairman An innovative media company delivering sustainable, profitable growth
Information meeting. 12 September 2011
 Information meeting 12 September 2011 Full Year 2010-11 key data April 2010-March 2011 Revenues in billions Operating result in millions 77% Passenger 18.10 +11.3% -44 +874 13% Cargo 3.16 +29.5% +69 +505
SAS Q2 2017/2018 TELECONFERENCE
 SAS Q2 2017/2018 TELECONFERENCE 30 May 2018 Earnings as expected despite negative currency effect POSITIVES + Total revenue up MSEK 73 vs. LY + Currency adjusted yield up 0.6% vs. LY + EB-point sale revenue
FIRST QUARTER RESULTS 2017
 FIRST QUARTER RESULTS 2017 KEY RESULTS In the 1Q17 Interjet total revenues added $4,421.5 million pesos that represented an increase of 14.8% over the income generated in the 1Q16. In the 1Q17, operating
TUI GROUP FACTBOOK. May 2015
 TUI GROUP FACTBOOK May 2015 Pro Forma Turnover 2012/13 & 2013/14 m FY 12/13 Q1 13/14 Q2 13/14 Q3 13/14 Q4 13/14 FY 13/14 Northern Region 6,037.2 1,047.6 922.0 1,660.0 2,571.2 6,200.8 Central Region 5,524.8
Aviation industry outlook
 Euro Aviation ICT Forum Thursday 29 October, 2015 Divani Caravel Hotel, Athens Aviation industry outlook Jonathan Wober, Chief Financial Analyst The leading independent supplier of global aviation knowledge
Q3 Results, Feb 2016
 Q3 Results, Feb 2016 Europe s Favourite Airline Europe s Lowest Fares/Lowest Cost Carrier No 1, Traffic 106m No 1, Coverage 78 Bases No 1, C mer Service Low Fares/On-time/Fewest/Canx Always Getting Better
Annual General Meeting. 13 June 2017
 Annual General Meeting 13 June 2017 Agenda 1. Approval of the Annual Report of the financial year 2016 of AS Tallink Grupp 2. Proposal on distribution of profits 3. Extension of authorities of the members
SAS Q3 2017/ August 2018
 SAS Q3 2017/2018 31 August 2018 Strong earnings in peak season POSITIVES Record number of passengers Total revenue up MSEK 936 vs. LY Currency adjusted yield up 1.1% vs. LY EB point sale up 27% vs. LY
Finnlines Plc Annual General Meeting Tom Pippingsköld, CFO
 Finnlines Plc Annual General Meeting 12.4.2016 Tom Pippingsköld, CFO 1 Global Shipping Segments 1 Jan 2015 Source: http://www.statista.com/statistics/264024/number-of-merchant-ships-worldwide-by-type/
THIRD QUARTER 2016 RESULTS. 3 November 2016
 THIRD QUARTER 2016 RESULTS 3 November 2016 Highlights of the Third Quarter 2016 Environment Operations Financial highlights Strong increase in airline industry capacity Terrorist attacks in Europe resulting
Thank you for participating in the financial results for fiscal 2014.
 Thank you for participating in the financial results for fiscal 2014. ANA HOLDINGS strongly believes that safety is the most important principle of our air transportation business. The expansion of slots
Finnair Group Interim Report 1 January 30 June 2008
 Finnair Group Interim Report 1 January 30 June 2008 1 08/08/2008 Presentation name / Author Airline industry at a historical turning point Fuel price has a stranglehold on the business Average ticket prices
Cathay Pacific Airways Annual Results 10 March Cathay Pacific Airways Interim Results 6 August 2008
 Cathay Pacific Airways 2009 Annual Results 10 March 2010 Cathay Pacific Airways 2008 Interim Results 6 August 2008 Annual Result 2009 2008 (restated) Group Profit/(Loss) HK$4,694m (HK$8,696m) Group Turnover
SAS Group Presentation Carnegie, May 22, 2012 Sture Stölen, Head of IR
 SAS Group Presentation Carnegie, May 22, 2012 Sture Stölen, Head of IR 1 This is the SAS Group 128 destinations 27,2 million passengers 28 new routes to be launched 2012 1,085 daily flights Revenues 2011,
Investment Highlights
 Third Quarter 2014 Investment Highlights 1 Mexican airport portfolio positioned to take full advantage of global growth. 2 Diversified business model contributing to earnings resilience. 3 Well-defined
Information meeting. September 2011
 Information meeting September 2011 Full Year 2010-11 key data April 2010-March 2011 Revenues in billions Operating result in millions 77% Passenger 18.10 +11.3% -44 +874 13% Cargo 3.16 +29.5% +69 +505
Cathay Pacific Airways 2011 Interim Results 10 August 2011
 Cathay Pacific Airways 2011 Interim Results 10 August 2011 1 Interim Result 1H 2011 1H 2010 Group profit HK$2,808m HK$6,840m Group turnover HK$46,791 HK$41,337m Profit margin 6.0% 16.5% Return on capital
SAS Group Q2 2012/13. Q2 Restructuring programme moving KPIs in the right direction
 SAS Group Q2 2012/13 1 Q2 Restructuring programme moving KPIs in the right direction Operating revenues +1.6%* Yield improvement of +2.7%* Forceful implementation of 4XNG plan: Unit cost down by 10.7%
Six Continents PLC. Preliminary Results. For the Year ended 30th September 2001
 1 2 Six Continents PLC Preliminary Results For the Year ended 30th September 2001 3 SIR IAN PROSSER Chairman Business Results Operating Profit ( m)( 4 Six Continents Hotels 427 Up 13.6% Six Continents
RYANAIR ANNOUNCES RECORD Q3 RESULTS NET PROFIT RISES 30% TO 48M FULL YEAR GUIDANCE RAISED FROM 350M TO 390M
 RYANAIR ANNOUNCES RECORD Q3 RESULTS NET PROFIT RISES 30% TO 48M FULL YEAR GUIDANCE RAISED FROM 350M TO 390M Ryanair, Europe s biggest low fares airline, today (5 th Feb) announced record Q3 results. Net
INDEPENDENT NEWS & MEDIA PLC
 INDEPENDENT NEWS & MEDIA PLC 2014 INTERIM RESULTS 28 August 2014 2014 INM PLC inmplc.com Page 1 INTERIM RESULTS Key Highlights (Continuing Group*) Net Profit ** doubled from 6.9 million to 14.0 million;
THIRD QUARTER RESULTS 2018
 THIRD QUARTER RESULTS 2018 KEY RESULTS In the 3Q18 Interjet total revenues added $ 6,244.8 million pesos that represented an increase of 7.0% over the revenue generated in the 3Q17. In the 3Q18, operating
OPERATING AND FINANCIAL HIGHLIGHTS. Subsequent Events
 Copa Holdings Reports Net Income of US$113.1 Million and EPS of US$2.57 for the First Quarter of 2015 Excluding special items, adjusted net income came in at US$106.0 million, or EPS of US$2.41 per share
IAG results presentation. Quarter One th May 2018
 IAG results presentation Quarter One 2018 4 th May 2018 Highlights Willie Walsh, Chief Executive Officer Highlights Another strong quarter performance with an operating profit of 280m (5.6% margin, +2.3pts)
The Accounting Case Competition for Secondary Schools and Tertiary Institutes. Tertiary Institutes Group
 The Accounting Case Competition for Secondary Schools and Tertiary Institutes 2004 Time allowed 2 hours Answer ALL the questions Marks Section A 50 Section B 20 Section C 15 Section D 15 100 DO NOT OPEN
Investment Highlights
 Second Quarter 2014 Investment Highlights 1 Mexican airport portfolio positioned to take full advantage of global growth. 2 Diversified business model contributing to earnings resilience. 3 Well-defined
Financial Results 1 st Quarter Mar/2016 (FY2015) 30 July, 2015
 30 July, 2015") Financial Results Mar/2016 (FY2015) 30 July, 2015 Today s Topics P.2 P.3 P.15 1 Overview of FY Mar/2016 Financial Results Operating Revenue Operating Profit 320 307.0 +4.9Bn (+1.6%) 312.0 50 +17.6Bn (+94.6%)
Financial Results Mar/2016 (FY2015) 30 July, 2015 Today s Topics P.2 P.3 P.15 1 Overview of FY Mar/2016 Financial Results Operating Revenue Operating Profit 320 307.0 +4.9Bn (+1.6%) 312.0 50 +17.6Bn (+94.6%)
GROUP FINANCIAL HIGHLIGHTS
 AGENDA FINANCIAL HIGHLIGHTS OPERATIONS HIGHLIGHTS INCOME STATEMENT REVIEW BALANCE SHEET REVIEW KEY PERFORMANCE INDICATORS OPERATIONAL REVIEW AIRLINES COMPARATIVE PERFORMANCE OUTLOOK GROUP FINANCIAL HIGHLIGHTS
Information meeting. 1 st September 2011
 Information meeting 1 st September 2011 Full Year 2010-11 key data April 2010-March 2011 Revenues in billions Operating result in millions 77% Passenger 18.10 +11.3% -44 +874 13% Cargo 3.16 +29.5% +69
SAS Group 1 st interim report 2011
 SAS Group 1 st interim report 2011 Media/analyst presentation May 10, 2011 Q1 Improved earnings driven by Core SAS cost reductions Continued strong macro development in Scandinavia Additional capacity
QANTAS ANNOUNCES PROFIT RESULT YEAR ENDED 30 JUNE 2009
 QANTAS ANNOUNCES PROFIT RESULT YEAR ENDED 30 JUNE 2009 HIGHLIGHTS Profit before tax of $181 million, in a year when the International Air Transport Association forecast US$9 billion in losses for global
VERY GOOD RESULTS IN OUR MOST IMPORTANT QUARTER
 VERY GOOD RESULTS IN OUR MOST IMPORTANT QUARTER Q3 EBITDA USD 161.8 million, as compared to USD 155.6 million in the corresponding quarter last year 19% increase in passenger numbers on international flights
Airline industry outlook remains fragile
 Airline industry outlook remains fragile June 2009 www.iata.org/economics To represent, lead and serve the airline industry Airline industry outlook remains fragile Green shoots starting to appear Recovery
Air China Limited 2014 Annual Results Under IFRS
 Air China Limited 2014 Annual Results Under IFRS March 2015 Agenda Part 1 Results Highlights Part 2 Business Overview Part 3 Financial Overview Part 4 Outlook Part 1 Results Highlights Gradual Global Economic
Joe Randell President and Chief Executive Officer Jolene Mahody Executive Vice President and Chief Financial Officer
 Joe Randell President and Chief Executive Officer Jolene Mahody Executive Vice President and Chief Financial Officer Nathalie Megann Vice President, Investor Relations and Corporate Affairs December, 2015
EASYJET INTERIM MANAGEMENT STATEMENT FOR THE QUARTER ENDED 30 JUNE 2011
 22 July 2011 easyjet Interim Management Statement Page 1 of 5 22 July 2011 EASYJET INTERIM MANAGEMENT STATEMENT FOR THE QUARTER ENDED 30 JUNE 2011 Highlights (figures below are for the quarter ended 30
Interim Report 6m 2014
 August 11, 2014 Interim Report 6m 2014 Investors and Analysts Conference Call on August 11, 2014 Joachim Müller, CFO Latest ad-hoc release (August 4, 2014) Reduction of forecast, primarily due to a further
State of the Aviation Industry
 State of the Aviation Industry Presentation to the ACI Airport Economics & Finance 10 th 11 th February London, United Kingdom Laurie N. Price Director of Aviation Strategy Mott MacDonald Aviation Current
Globus Maritime Limited Trading Update and Financial Highlights for the Three Months and Nine Months Ended September 30, 2007.
 Globus Maritime Limited Trading Update and Financial Highlights for the Three Months and Nine Months Ended September 30, 2007. Athens, Greece, November 15, 2007. Globus Maritime Limited (AIM: GLBS), a
QANTAS ANNOUNCES PROFIT RESULT HALF-YEAR ENDED 31 DECEMBER 2009
 QANTAS ANNOUNCES PROFIT RESULT HALF-YEAR ENDED 31 DECEMBER 2009 HIGHLIGHTS TWO BRAND STRATEGY DELIVERS RESILIENCE AND CONTAINS COSTS Statutory Net Profit Before Tax of $90 million Underlying Profit Before
AIR NEW ZEALAND ANNUAL RESULTS ANNUAL RESULTS
 AIR NEW ZEALAND ANNUAL RESULTS 2008 1 HIGHLIGHTS Record operating revenue, up 9% Normalised earnings* $197m Net cash position of $1.3bn Launched direct service to Vancouver and Beijing Award winning product
Analyst and Investor Conference Call Q Ulrik Svensson, CFO and Member of the Executive Board
 Analyst and Investor Conference Call Q2 2017 Ulrik Svensson, CFO and Member of the Executive Board Frankfurt, 2 August 2017 Disclaimer The information herein is based on publicly available information.
QANTAS DELIVERS STRONG FIRST HALF RESULT DESPITE HIGHER FUEL BILL
 ASX and Media Release Sydney, 21 February 2019 QANTAS DELIVERS STRONG FIRST HALF RESULT DESPITE HIGHER FUEL BILL Underlying Profit Before Tax: $780 million (down $179 million) Statutory Profit Before Tax:
Financial Results 3 rd Quarter MAR/2016 (FY2015)
") Financial Results MAR/2016 (FY2015) January 29 th, 2016 CONTENTS P.1 P.2 P.3 P.4~ Overview of FY MAR/16 Results Operating Revenue Operating Profit 1,030 1,020 1,010 +1.0Bn 1,022.3 1,023.4 (+0.1%) 180 160
Financial Results MAR/2016 (FY2015) January 29 th, 2016 CONTENTS P.1 P.2 P.3 P.4~ Overview of FY MAR/16 Results Operating Revenue Operating Profit 1,030 1,020 1,010 +1.0Bn 1,022.3 1,023.4 (+0.1%) 180 160
Leaving the Competition Behind. Second Quarter (Apr-Jun) 2009 Results
 2009 Results") Leaving the Competition Behind Second Quarter (Apr-Jun) 2009 Results 12 Aug 2009 1 Disclaimer Information contained in our presentation is intended solely for your reference. Such information is subject
Leaving the Competition Behind Second Quarter (Apr-Jun) 2009 Results 12 Aug 2009 1 Disclaimer Information contained in our presentation is intended solely for your reference. Such information is subject
Strong improvement in underlying financial performance. Revenue + 11 % Profit before Tax + 48 % PBT Margin pp. Earnings per Share + 50 %
 20 th November 2007 Highlights Strong improvement in underlying financial performance Revenue + 11 % Profit before Tax + 48 % PBT Margin + 2.7 pp Earnings per Share + 50 % Return on Equity + 3.5 pp Net
Copa Holdings Reports Net Income of $49.9 million and EPS of $1.18 for the Second Quarter of 2018
 Copa Holdings Reports Net Income of $49.9 million and EPS of $1.18 for the Second Quarter of 2018 Panama City, Panama --- Aug 8, 2018. Copa Holdings, S.A. (NYSE: CPA), today announced financial results
Air China Limited Annual Results. March Under IFRS
 Air China Limited 21 Annual Results Under IFRS March 211 Agenda Part 1 Highlights Part 2 Business Overview Part 3 Financial Overview Part 4 Outlook 2 Part 1 Highlights Steady Economic Growth; Asia Pacific
Guidance on criteria for assessing the financial resources of new applicants and holders of operating licences
 Consumer Protection Group Risk Analysis Department Guidance on criteria for assessing the financial resources of new applicants and holders of operating licences Version 10 (20 April 2010) 1 Introduction
Freight Timetable. Scandinavia 11 January Göteborg - Frederikshavn Varberg - Grenaa. For Reservations, please call:
 Freight Timetable Scandinavia 11 January 2010 For Reservations, please call: Sweden +46 31 7040800/900 Denmark +45 96 200222 Norway +47 23179160 Germany Kiel +49 (0)431 9096 Germany Travemünde +49 (0)45024030
Finnair Q Result
 Finnair Q1 2015 Result 7 May 2015 CEO Pekka Vauramo, Interim CFO Mika Stirkkinen 1 Turbulent market environment The weakness of the Finnish economy continued to be reflected in the demand in the first
SAS Q1 2016/
 SAS Q1 2016/2017 08.03.2017 Weak Q1 as expected new structural actions underway Q1 in summary Positives + Currency adjusted passenger revenue up 5% + Strong development of ancillary revenues + Passengers
AUDITED GROUP RESULTS AND CASH DIVIDEND FOR THE YEAR ENDED 30 JUNE 2014
 Comair Limited (Incorporated in the Republic of South Africa) Reg. No. 1967/006783/06 ISIN Code: ZAE000029823 Share Code: COM ( Comair or the Group ) AUDITED GROUP RESULTS AND CASH DIVIDEND FOR THE YEAR
H1 RESULTS 2007 Jón Karl Ólafsson, CEO
 H1 RESULTS 2007 Jón Karl Ólafsson, CEO Agenda 01 Highlights 02 Financial results 03 Outlook 04 New organizational chart 05 Q & A H1 Highlights Aggressive fleet growth characterizes H1 results 12 aircraft
Management Presentation. August 2012
 Management Presentation August 2012 Forward looking statements This presentation as well as oral statements made by officers or directors of Allegiant Travel Company, its advisors and affiliates (collectively
JAPAN AIRLINES Co., Ltd. Financial Results 1 st Quarter Mar/2017(FY2016) July 29, 2016
 July 29, 2016") JAPAN AIRLINES Co., Ltd. Financial Results Mar/2017(FY2016) July 29, 2016 Today s Topics P.1 P.2 P.13 From the first quarter of this fiscal year, figures for Revenue Passengers Carried, ASK, RPK and Load
JAPAN AIRLINES Co., Ltd. Financial Results Mar/2017(FY2016) July 29, 2016 Today s Topics P.1 P.2 P.13 From the first quarter of this fiscal year, figures for Revenue Passengers Carried, ASK, RPK and Load
WÄRTSILÄ S STRONG FINANCIAL POSITION. RAIMO LIND Executive Vice President, CFO
 WÄRTSILÄ S STRONG FINANCIAL POSITION Executive Vice President, CFO 1 Wärtsilä 29 March 212 Contents Topic 3 Growth over the cycle fulfils targeted levels 4 Net sales emphasis on high growth areas 5 Net
Presentation to Analysts. 20 August
 Presentation to Analysts 20 August 2015 1 2015 Result Highlights Parent NPAT up 2.9% to $64.7M Underlying Group NPAT up 1.0 % to $79.0M Group EBITDA up 1.7% to $145M Final dividend of 30 cents per share
PARENT AIRLINE OPERATIONS LIFT GROUP PROFIT
 PARENT AIRLINE OPERATIONS LIFT GROUP PROFIT HIGHLIGHTS OF THE GROUP S PERFORMANCE Financial Year 2006-07 4th Quarter 2006-07 Apr 2006 Mar 2007 Year-on-Year % Change Jan-Mar 2007 Year-on-Year % Change Operating