A Biophysical Assessment of the Philippine Territory. of the Sulu-Sulawesi Marine Ecoregion
|
|
|
- Emmeline King
- 5 years ago
- Views:
Transcription

1 A Biophysical Assessment of the Philippine Territory of the Sulu-Sulawesi Marine Ecoregion Sulu-Sulawesi Marine Ecoregion Program WWF-Philippines May 2003
2 CREDITS AUTHORS: EDITORS: TECHNICAL ASSISTANTS: INTEGRATOR: Angel Alcala, Ph.D. Monyeen Alava, M.Sc. Emmanuel Anglo, Ph.D. Naniel Aragones, Ph.D. Emmanuel Bate, M.Sc. Flordeliz Guarin, Ph.D. Rudolf Hermes, Ph.D. Daniel Lagunzad, Ph.D. Augustus Rex Montebon, M.Sc. Ramon Miclat Jose Angelito Palma Johanna Pe-Montebon Hildie Maria Nacorda, M.Sc. Teresita Perez, Ph.D. Gavino Trono, Jr., Ph.D. Arnel Andrew Yaptinchay, D.V.M. Johanna Pe-Montebon, Evangeline F.B. Miclat, M.Sc., and Jose Noel Dumaup Josephine Sumangil-Evangelista and Dino Leoncarlo Calderon Johanna Pe-Montebon TECHNICAL ADVISERS/REVIEWERS: Alan White, Ph.D., Angel Alcala, Ph.D., and Romeo Trono ACKNOWLEDGEMENT: The Biophysical Assessment of the Sulu-Sulawesi Marine Ecoregion is funded by WWF-US. 1
3 TABLE OF CONTENTS Credits... 1 Table of Contents... 2 List of Figures... 5 List of Tables... 7 List of Appendices... 9 Chapter I Introduction THE ECOREGION CONSERVATION CONCEPT OBJECTIVES OF THE BIO-PHYSICAL ASSESSMENT...11 METHODOLOGY Chapter II The Physical Setting within Sulu-Sulawesi GEOGRAPHIC COVERAGE AND GEOMORPHOLOGY The Marine Environments of Sulu-Sulawesi The Philippine Inland Seas The Sulu Sea The Sulu Archipelago-Zamboanga Peninsula Sulawesi Sea GEOLOGY Tectonic Setting and Geologic History Active Geologic Processes METEOROLOGY Climatic Controls Monthly Station Weather OCEANOGRAPHY Bathymetry of Major Basins Tides Currents Wind-Generated Waves Sea Surface Temperature (SST) Storm Surges WATER QUALITY Riparian Ecosystems Estuarine and Associated Ecosystems Coastal and Marine Ecosystems Effects on Primary Production
4 Chapter III The Watersheds and their Linkages to the Ecoregion THE WATERSHED DEFINED LOCATION, OCCURRENCE AND DISTRIBUTION THREATS TO WATERSHED AREAS Agriculture and aquaculture Legislation and Resource Management Chapter IV Coastal and Marine Ecosystems and their Associated Species I. THE MANGROVE ECOSYSTEM Coverage, Occurrence and Distribution Species diversity Importance Threats Resource Management II. THE SEAWEED AND SEAGRASS ECOSYSTEMS Occurrence, Distribution and Data Gaps Importance Threats and Resource Management Issues III. THE CORAL REEF ECOSYSTEM Distribution of Noteworthy Reef Areas and Species Diversity Importance Threats and Issues Resource Management IV. THE SOFT BOTTOM ECOSYSTEM Benthic Faunal Assemblages Importance Threats V. MARINE PLANKTON AND ECOSYSTEM LINKAGES Dynamics and Linkages Importance Threats VI. MARINE FISHERY RESOURCES OF NERITIC ECOSYSTEMS Major Fishing Grounds within SSME Major Fishery Resources of the Region Importance Threats Resource Management Chapter V Species of Special Concern BACKGROUND MARINE BIRDS
5 Occurrence and Distribution Threats Conservation Initiatives MARINE MAMMALS Dugongs Whales and Dolphins ELASMOBRANCHS Characteristics and Distribution Threats Resource Management MARINE REPTILES Sea Turtles Sea Snakes Chapter VI Approaches to Biodiversity Conservation SUMMARY OF THREATS AND RESPONSES What we have done What we must do STARTEGIES FOR PROMOTING BIODIVERSITY CONSERVATION POST BIOPHYSICAL ASSESSMENT SELECTION OF PRIORITY AREAS References Acronyms The Biophysical Assessment Team Additional Contributors Appendices
6 LIST OF FIGURES Figure 2.1 Proposed boundary of the SSME...15 Figure 2.2 Bathymetric contours of the SSME...16 Figure 2.3 Major tectonic features of Sulu-Sulawesi...25 Figure 2.4 Sediment isopach map...27 Figure 2.5 Tsunami prone areas...31 Figure 2.6 Mean monthly position of the ITCZ over SSME (Flores and Balagot, 1969)...34 Figure 2.7 Anomalies in standardized rainfall due to the El Niño and La Niña (Anglo, 1999)...36 Figure 2.8 Mean annual tropical cyclone passage frequency over the Philippines (Anglo, 1999)...40 Figure 2.9 Wind roses from selected stations within SSME...41 Figure 2.10 Mean surface zonal (left) and meridional wind velocity over the project site ( )...42 Figure 2.11 Mean wind speed (left) and cloudiness over the project site ( )...43 Figure 2.12 Monthly rainfall at selected stations within SSME (mm)...44 Figure 2.13 Bathymetric contours of the SSME...50 Figure 2.14 Surface currents in the Sulu-Sulawesi region and vicinity (Wyrtki, 1961)...52 Figure 2.15 Mean annual sea surface temperature within SSME (NOAA/PMEL)...56 Figure 2.16a Mean monthly SST at SSME for January to April (NOAA/PMEL)...57 Figure 2.16b Mean monthly SST at SSME for May to August (NOAA/PMEL)...59 Figure 2.16c Mean monthly SST at SSME for September to December (NOAA/PMEL)...59 Figure 2.17 Mean annual salinity at SSME (NOAA/PMEL)...63 Figure 3.1 Watersheds within the Philippine portion of the SSME...83 Figure 3.2 Biogeographic zones of the Philippines (DENR, 1997)...84 Figure 4.1 Distribution of mangrove areas in the Philippines...89 Figure 4.2 Estimated area (has) of existing mangrove forests in the Philippines and their uses...91 Figure 4.3 Mangrove resource decline in the Philippines...98 Figure 4.4 Geographic distribution of seaweeds Figure 4.5 Geographic distribution of seagrasses Figure 4.6 Prominent reef areas in the Philippines Figure 4.7 Reefs with 0-25% coral cover Figure 4.8 Reefs with 25-50% coral cover Figure 4.9 Reefs with 50-75% coral cover Figure 4.11 Reefs where cyanide fishing is practiced Figure 4.12 Reefs where blast fishing is praticed Figure 4.13 Red tide occurrences in
7 Figure 4.14 Red tide occurrences in Figure 4.15 Red tide occurrences in Figure 4.16 Red tide occurrences in Figure 4.17 Red tide occurrences in Figure 4.18 Red tide occurrences in Figure 4.19 Fishery resource distribution in the SSME Figure 4.20 Commercial gear contribution to Sulu-Sulawesi s marine landings Figure 4.21 Municipal gear contribution to Sulu-Sulawesi s marine landings Figure 4.22 Important tuna fishing grounds for commercial fisheries Figure 4.23 Movements of tuna released in the Philippines and recaptured outside Philippine waters (Skipjack - solid lines, yellowfin - dashed lines; PRIMEX-SPC, 1993) Figure 4.24 Movements of tuna recaptured in the Philippines from releases outside Philippine waters (Skipjack - solid lines, yellowfin - dashed lines; PRIMEX-SPC, 1993) Figure 4.25 Movements of tagged skipjack (PRIMEX-SPC, 1993) Figure 4.26 Movements of tagged yellowfin (PRIMEX-SPC, 1993) Figure 4.27 Movements of tagged bigeye (PRIMEX-SPC, 1993) Figure 4.28 Industrial and artisanal fish catch in the Philippine portion of the Sulu-Sulawesi Seas (KKP Marine Fisheries Program for the SSME) Figure 4.29 Decreasing fish catch in the Philippine portion of the Sulu-Sulawesi Seas ( Philippine Fisheries Profile: BFAR, Quezon City as presented by the KKP Marine Fisheries Program for the SSME) Figure 5.1 Historical sightings of dugongs Figure 5.2 Distribution of cetaceans in the Philippines Figure 5.3 Actual and potential distributions of the 16 reported sea snake species in Philippine waters Figure 6.1 Marine protected areas (MPAs) in the Philippines Figure 6.2 Priority areas for mangrove conservation Figure 6.3 Priority areas for seaweed and seagrass conservation Figure 6.4 Priority areas for coral reef conservation Figure 6.5 Priority areas for marine fish conservation Figure 6.6 Priority areas for dugong conservation Figure 6.7 Priority areas for cetacean conservation Figure 6.8 Priority areas for chondrichthyan conservation Figure 6.9 Priority areas for giant clam conservation
8 LIST OF TABLES Table 2.1 Distribution of the marine environment in Sulu Sea...14 Table 2.2 Geologic time scale...23 Table 2.3 Drainage basins in islands surrounding the Sulu Sea...28 Table 2.4 Basins in Mindanao and Sulu Archipelago draining into the Sulawesi Sea...29 Table 2.5 Calculated ratio of diurnal to semi-diurnal tidal constituents...48 Table 2.6 Estimated significant wave heights (m) in SSME Table 2.7 Annual water balance analysis of the Sibalom-Guimbal Basins...67 Table 2.8 Discharge of rivers within the Tagum Libuganon Basins (discharge in cm)...70 Table 2.9 Summary of the water quality data from rivers associated with Davao Gulf...71 Table 2.10 Summary of the water quality data from rivers associated with Carigara Bay...71 Table 2.11 Water quality analyses in Iligan Bay...73 Table 2.12 Summary of the general water quality parameters in Davao Gulf...75 Table 2.13 Concentration of trace elements in the waters of Davao Gulf...76 Table 2.14 General water quality parameters in Carigara Bay (FSP, 1994)...76 Table 2.15 General water quality parameters in Panguil Bay (FSP, undated b)...77 Table 4.1 Estimated mangrove areas in the Philippines...92 Table 4.2 Major (1-23) and minor (24-35) mangrove vascular plants reported to occur in the Philippines...93 Table 4.3 Mangrove-associated thallophytes in Likot and Mahabang Parang Coves, Puerto Galera, Oriental Mindoro (Banaag, 1972)...94 Table 4.4 Mangrove-associated algal microphytes in Muelle Bay and Paniquian (Puerto Galera, Oriental Mindoro), Palsabangon (Pagbilao, Quezon), Ulugan Bay (Palawan), and Babatngon (Leyte). (Fortes, 1975; Cordero, 1978; Fortes and Trono, 1979)...95 Table 4.5 Average mangrove ecosystem valuation worldwide (adopted from White and Cruz-Trinidad, 1998)...97 Table 4.6 Estimated annual net economic value (US$) of Philippine mangroves based on different management levels (White and de Leon, 1996; de Leon and White, 1997)...97 Table 4.7 Meiofaunal communities in Cariga Bay (1994) Table 4.8 Total marine fisheries production (commercial and municipal) in the Sulu-Sulawesi Seas from 1978 to Table 4.9 Demersal species groups found in the Sulu-Sulawesi Seas (WWF, 1998) Table 4.10 Average annual landings of demersal species groups in the Sulu- Sulawesi Seas from (metric tons)
9 Table 4.11 Trends in Philippine commercial and municipal fish catch in the SSME between 1987 and 1995 (values in thousand metric tons) Table 5.1 Seabird species recorded in Tubbataha Reef National Marine Park in March, May, and June Table 5.2 Number of breeding and possibly breeding birds in Bird (BI) and South (SI) Islet in 1981,1991, 1993, and Table 5.3 Elimination functions of seagrass habitats in coastal East Asia (modified from Fortes, 1989) Table 5.4 List of confirmed and probably existing cetaceans in Philippine waters
10 LIST OF APPENDICES Appendix 1a Declared national parks in the Philippines (DENR, 1997) Appendix 1b Protected areas declared through administrative and memorandum orders (DENR, 1997)..239 Appendix 1c Islands proclaimed as tourist zones and marine reserves..241 Appendix 2a Mangrove-associated fishes in Pagbilao (Pinto, 1987).243 Appendix 2b Faunal assemblage in Philippine mangrove swamps (Ronquillo and Llana, 1979) Appendix 3 Occurrence of PSP in the Philippines from 1983 to Appendix 4 Checklist of Philippine chondrichthyes Appendix 5 Marine protected areas (MPAs) in the Philippines
11 Chapter I Introduction THE ECOREGION CONSERVATION CONCEPT The earth we humans call home is home to all species as well. But the exponential growth of our populations has placed a great stress on biological resources and the ecosystems natural capacity for recovery. Amidst this evident discrepancy, the World Wildlife Fund for Nature (WWF) conceptualized an ecoregion-based approach to conservation to meet the challenges of the 21 st century. WWF (1998) defined ecoregion as a relatively large unit of land or water that is biologically distinctive and harbors a characteristic set of species, ecosystems, dynamics and environmental conditions. In contrast to the conventional conservation method that targets a limited area, the ecoregion-based approach presents a revolutionary and exceptional scheme by adopting a large area transcending political boundaries, races, and cultures. It gauges both the immediate and root causes of threats to biodiversity and enables management interventions and mitigating measures to be done at various levels from municipal to international. The overall goal of ecoregion conservation is to preserve and restore the fullest possible range of biodiversity over large spatial and temporal scales. The planning process for the ecoregion conservation consists of the following four elements: Reconnaissance A multidisciplinary rapid assessment to determine whether WWF should initiate an ecoregional conservation program to frame the development of an ecoregional plan and to identify any urgent needs that require immediate action. Biodiversity Vision A clear biodiversity vision should set out long-term (e.g. 50 years) goals for conservation of the ecoregion s biodiversity, identifying key sites, populations and ecoregional processes. This vision is the touchstone for WWF s conservation efforts in guiding the development of the Conservation Plan, and also in guiding strategic decisions as circumstances and opportunities change. In the Biodiversity Vision, WWF sets out to define the four fundamental conservation goals: o representation of all distinct natural communities within a network of protected areas managed for biodiversity conservation; 10
12 o o o maintenance of ecological and evolutionary processes that create and sustain biodiversity; maintenance of viable populations of species; and conservation of blocks of natural habitats large enough to be responsive to large-scale periodic disturbances and long-term changes. A fifth goal has been added to the conservation of the SSME: o create opportunities for sustainable livelihood systems. The Biodiversity Vision is developed through a biological assessment which is conducted through the collection and analysis of biological information to identify priorities for long-term conservation. The assessment brings forward the distribution of biodiversity, its current status, and uses and threats that can potentially change such state. The assessment also includes the current resource management efforts that may enhance the present environmental condition of the resources and the mitigating factors that are put in place as intervention to the negative factors affecting biodiversity. Ecoregional Conservation Plan The Ecoregional Conservation Plan sets out the year goals, based on the Biodiversity Vision, and identifies the actions needed to achieve them. The plan is a comprehensive blueprint for the conservation action. The plan may need to be reviewed and updated. Thus, a feedback mechanism needs to be put in place to make it achievable and adoptable over time. WWF Action Program The WWF Action Program provides a strategic blueprint for WWF s activities to set the stage for the long-term realization of the Conservation Plan. Like the Conservation Plan, the Action Program can immediately respond to amendments that may be adopted during its implementation. By virtue of its outstanding biological wealth, the SSME was chosen as a priority site among the Global 200 ecoregions, which represents the earth s biodiversity (Olson and Dinerstein, 1998). OBJECTIVES OF THE BIO-PHYSICAL ASSESSMENT The Biophysical Assessment is conducted to gain knowledge of the biodiversity features of the ecoregion, understand the factors that affect them, and determine conservation priorities. These information will guide the setting of the long-term conservation goal (50 years), termed the Biodiversity Vision, for the ecoregion. Specifically, the assessment of the Sulu-Sulawesi Marine Ecoregion (SSME) ams to: 11
13 1. Compile and synthesize available information on diversity and the biological and physical factors that influence it; 2. Identify the threats which put the resources and the ecosystems at risk; 3. Recognize the current initiatives and gaps in conservation and resource management; and 4. Guide the determination of priority areas for biodiversity conservation in the Philippine part of the SSME. METHODOLOGY The Biophysical Assessment for SSME adopted the watershed approach in acknowledging the influence that exists in linkage ecosystems. This report integrates the information gathered by desk studies commissioned by WWF-Philippines (1998b&c, 1999a m, 2000a&b). Sources of information were: Scientific publications; Proceedings of national and international conferences; Reports from the government, research institutions, and scientists; Reports prepared by non-government organizations and private companies on resource and ecological assessments, fishery assessments, and coastal resource management; Environmental Impact Assessments of selected rivers and bays for major infrastructure projects; Information gained from stakeholders' participation in workshops; and Other unpublished reports prepared by local schools, state universities and nongovernment organizations identified during consultation with stakeholders in several areas within the SSME. 12
14 Chapter II The Physical Setting within Sulu-Sulawesi GEOGRAPHIC COVERAGE AND GEOMORPHOLOGY Emmanuel S. Bate The proposed boundary of the Sulu-Sulawesi Marine Ecoregion is shown in Figure 2.1. It lies above the equator between 1 o 30 and 12 o 00 N latitude and 117 o 00 and 127 o 00 E longitude. It covers the southwestern shoreline of southern Luzon (coastline of Batangas southwards to Bicol); the western shorelines of Samar-Leyte; rounding off the northern and entire southern coastal area of Mindanao until the Pujada Peninsula in Davao del Oriental. From the tip of Pujada Peninsula the proposed boundary extends southwards to the Indonesian territory of Sulawesi. The proposed line runs to the east of Sangihe Islands (Talaud Island and the other smaller islands). It gently curves to the west at the tip of the Sulawesi (Bunaken and Manado) and then follows the northern coastline of the northern arm of Sulawesi. It continues westerly until Sabah where it swings to the north following the coastline of northeast Borneo up to Samungat and Marchesa Bay. From this region it arches to the north, passing west of Banguey Island, across Balabac Strait traversing the eastern seaboard of Palawan. It continues its northeasterly trend, passing to the west of Busuanga and Batangas. This proposed boundary encompasses a total area (combined land and water) of 945,965 km 2 as measured by planimeter on a 1:575,000 scale map. The Marine Environments of Sulu-Sulawesi The marine geologic environment of the Sulu-Sulawesi can be classified into broad zones based on water depth. These are the neritic zone, bathyal zone and abyssal zone. The neritic zone or shelf area extends from the lowest tide limit to the break in slope at the edge of the continental shelf at about 100 fathoms. This zone is affected by water movements such as bottom currents, storm waves and tidal currents. All sediments emanating from terrestrial sources are either deposited or carried across this marine environment (Dunbar and Rogers, 1957). The neritic zone or shelf contains the most diverse marine plants and animals compared to the other environments. Below the shelf/neritic zone is the bathyal with its boundary from the abyssal zone at about 2,100 fathoms. Below 3,500 fathoms is the hadal zone (Hedgpeth, 1957) which, however, is not present in the ecoregion. Dunbar and Rogers (1957) state that there is no significant deviation in environmental conditions between bathyal and abyssal. Below 100 fathoms, the general environment in the ocean floor is totally dark, quiet and cold. The shelf or neritic zone of the Sulu-Sulawesi extends from the lowest tide limit to depths of about 60 fathoms as interpreted from the bathymetric map (Figure 2.2). The shelf of Sulu Sea is considerably wide around the northern end of Borneo and northern Palawan, 13
15 which extends far to the east in the region occupied by the Cuyo Group of Islands. The bathyal zone of Sulu is located in the northwest basin while the southeast basin being considerably deeper is abyssal. The distribution of the marine environments of Sulu Sea in terms of size are as follows: Table 2.1 Distribution of the marine environment in Sulu Sea Marine Environment Area in Km 2 Neritic or shelf Bathyal Abyssal 13,515 22,086 7,353 In the Philippine side of the Sulawesi Sea, the neritic or shelf is significant only in the Sulu Archipelago and south of the Zamboanga Peninsula. The bathyal zone of Sulawesi Sea is very narrow with the abyssal zone occupying a large portion of the basin. The ecoregion consists of the Philippine Inland Seas, Sulu Sea, Sulawesi Sea, the small and large islands within these seas, and the watersheds around the ecoregion s border. The Philippine Inland Seas The Philippine Inland Seas is made up of the Verde Island Passage, the bays of Batangas, Tayabas Bay, Ragay Gulf, Sibuyan Sea, the Visayan Sea, Camotes Sea and the Bohol Sea. The bays of southern Batangas within the ecoregion are Balayan Bay and Batangas Bay. Balayan Bay is separated from the South China Sea by the Calatagan Peninsula and from Batangas Bay to the east by the Calumpan Peninsula. To the south of these bays is the Verde Island Passage, a narrow body of water between Mindoro Island and Batangas. The Verde Island Passage is contiguous with Tablas Strait, the Sibuyan Sea and the Cuyo Pass farther to the south. Sibuyan Sea is enclosed by the Tablas Island to the west, the shoreline of northern Panay to the south, and Masbate to the east-southeast. The shelf zone around the islands of the central Philippines is narrow except in the Visayan Sea where a wide shelf zone is present. This zone is bound by northeast Panay, northern Negros, northwestern Cebu and Masbate Island. Deep water bathyal environments are present in the Sibuyan, Camotes and the Bohol Seas. The eastern-northeastern limit of the Central Philippines displays a distinct alignment of islands and other geographic features. This is due to the influence of the active Philippine Fault Zone that runs along the north-south direction at the eastern side of the archipelago. The oldest terrain in the Central Philippines is located in the islands of Mindoro and Sibuyan. This is represented by the Carboniferous-Jurassic metamorphic rocks at the northern central region of Mindoro and central portion of Sibuyan Island. This terrain is interpreted by geologists to be of the same age as the rocks of northern Palawan, including Busuanga and Cuyo. 14
16 Figure 2.1 Proposed boundary of the SSME 15
17 Figure 2.2 Bathymetric contours of the SSME 16
18 Sibuyan Sea Basins The deep water of Sibuyan Sea is divided into two basins, the northern and southern basins. The two basins are separated by the island of Sibuyan. The North Sibuyan Sea Basin, enclosed by the islands of Marinduque, Burias, Masbate and Sibuyan Island, is described (BMG, 1982) as a rhomboidal depression with a depth at the center of the basin of ~900 meters. The Tablas Fault is inferred to control the western limit of the basin. Bohol Sea Basin The Bohol Sea Basin is enclosed by northern Mindanao to the south; Surigao Peninsula and the islands of Nonoc, Dinagat and Panaon to the east; by the islands of Bohol, Cebu, Siquijor and Negros to the north-northwest. Average depth of the basin is ~1,500 meters. Thick sediments cover the eastern part of the basin (Butuan Bay in Mindanao). Danajon Bank Most of the coral reefs in the central Philippines are of the fringing reef type except for the Danajon Bank off the northern coast of Bohol island. The Danajon Bank is a double barrier reef that occupies the northern shelf of Bohol Island. This reef complex is more than 120 kilometers long. The reef is marked by numerous sand cays and low coralline islands. Mangroves grow on Mahanay Island, Banacon Island, Basaan Island, Tambu Island and other small islets. The Sulu Sea Sulu Sea The center of the Sulu Sea is approximately defined by geographic coordinates N latitude and E longitude. It is separated from the South China Sea by Palawan and Borneo at its northwestern side and from Sulawesi Sea by the alignment of Sulu Archipelago and the Zamboanga Peninsula. It is flanked to the northeast by the islands of Negros, Panay and Mindoro. The Sulu Sea is connected to the South China Sea by the Mindoro Strait at its northern end and by Balabac Strait at its southeastern side; and to Mindanao Sea and the Sulawesi through the passageways and channels in the Sulu Archipelago, the more prominent of which are the Basilan Strait and the Sibutu Passage. The general submarine morphology of the Sulu Sea is characterized by a wide shelf (or neritic zone) and a narrow shelf slope leading to the bathyal and abyssal zones. The Sulu Sea basin is subdivided by a submarine ridge into two subbasins, the northwest and southeastern basins. This submarine ridge is called the Cagayan Ridge and is elongated along the northeast-southwest direction, parallel to Palawan Island and the alignment of Zamboanga Peninsula-Sulu Archipelago. The northwest basin reaches depths of up to 1300 m to 2000 meters. This basin deepens towards its southern end and then rises as it meets the continental shelf of 17
19 northern Borneo. Covering the northwest basin is a thick wedge of sediment that thickens from 1,000 meters to as much as 7,500 meters towards the island of Palawan (BMG, 1982). It is thought that the Cagayan Ridge dammed the sediment, making the northwest basin relatively shallower than the southeast basin. The southeastern basin is comparatively deeper reaching more than 5,000 meters at the foot of the Sulu Ridge where the Sulu Trench is located. The basin floor is rough with occasional seamounts (BMG, 1982). Thick sediment deposit at the southwestern part of this basin is suspected to have been derived from Borneo (BMG, 1982; Rangin and Silver, 1990). The Islands and Reefs of the Cagayan Ridge A series of islands and reefs in the middle of the Sulu Sea indicate the alignment of the Cagayan Ridge, a submarine volcanic feature that bisects the Sulu Basin. The reef complexes of Sulu Seas have been classified as platform type. These platform reefs are (from southwest to northeast) San Miguel, Bancoran, Basterra (Meander Reef), North and South Tubbataha, Jessie Beazly, Arena, Cavili and the islands of Cagayancillo. These platform reefs rise from depths of more than 900 meters. The North and South Tubbataha Reefs are considered to be of classic atoll formation with large lagoons protected by fringing outer reefs and little land above sea level. o Cagayancillo Islands The Cagayancillo Islands are composed of Cagayan, Dondonay, Calalong, Tanusa, Langisan, Manucan and Boombong. These islands and the elongated reefs form the atoll of Cagayancillo. To the north of the Cagayancillo Islands is the Sultana Shoal. The Cagayancillo Islands are inferred to be Plio-Pleistocene uplifted coral reefs. This carbonate formation outlines the substrate of the recent reefs. Calusa Island is located to the west of Cagayan Island. Immediately to the northeast of Cagayan Island is Sultana Shoal and further northeast is the southern tip of the island of Panay where the extension of the Cagayan Volcanic Ridge has been identified. o Tubbataha The largest of these reef complexes is Tubbataha. It is composed of the North and South Reefs. Both have lagoons with depths reaching more than 18 m. The bottom cover of these lagoons is sand with colonies of branching Acropora. The north reef is marked by sand cays (one of which is occupied by the ranger station); a small low island at the northeastern end, called Bird Island; and a number of rock outcrops. The recent reef mapping conducted by the Kabang Kalikasan ng Pilipinas Foundation Inc. (KKPFI) showed that the lagoon of the north reef is contiguous instead of 18
20 the two lagoons depicted in NAMRIA Map The North Reef is elongated along the northeast-southwest direction. The approximate dimension of the reef is 17 by 5 kms. About 8 kms to the southwest is the South Reef. Unlike the North Reef, the South Reef is elongated along the north-south direction. It is smaller than the north reef with its dimension of about 8km long and 2.5km wide. The reef is marked by a small coralline island at the southern end where the lighthouse is located, a ship wreck and some coralline rock outcrops such as the Black Rock. Previous drilling done in Tubbataha uncovered more than 400 meters of reefal deposit (Rangin and Silver, 1990). The Cuyo Group of Islands The Cuyo Island Group occupies the eastern limit of the northern shelf of Palawan. It is bound to the west by the West Cuyo Pass and to the east by the East Cuyo Pass. The important islands that make up this group are Cuyo, Bisucay, Diit, Agutaya, Manamoc, Pamalican, the Quiniluban Group and Tagauayan Island. The Cuyo Island Group is underlain by quaternary volcanic rocks. Geology of the other smaller islands is not known. An interesting part of the Cuyo Group is the Quiniluban Group composed of the islands of Quiniluban, Alcisiras, Tinitituan, Silad and Maligun. These islands and the reef flat are arranged in a somewhat circular pattern enclosing a shallow lagoon. The lagoon is sandy and presently used for seaweed farming. Numerous shoals and banks are present in the Cuyo Island Group. Culion-Busuanga Culion and Busuanga are the northernmost islands of Palawan. This group is separated from Mindoro by the Mindoro Strait. The Mindoro Strait - Apo Reef In the middle of Mindoro Strait between Busuanga and Mindoro is Apo Reef, which divides the Mindoro Strait into Apo East Pass and Apo West Pass. The Apo Reef complex is described by Zacher (1981) as two atoll-like reefs with elongated lagoons having depths ranging from 3 to 8 m. The two reefs are separated by a 30 m deep channel and the reefs are built upon an old submarine platform. A small coralline island, Apo Island, and a number of coralline rock outcrops mark the reef. The Sulu Archipelago-Zamboanga Peninsula The alignment of the Sulu Archipelago and Zamboanga Peninsula divides the Sulu Sea from the Sulawesi Sea. The Sulu Archipelago is a string of young volcanic islands, Plio- Pleistocene coralline islands and old terranes. The following groups of islands are found in the Sulu Archipelago: 19
21 Sibutu Group The southwestern end of the Sulu Archipelago is composed of the Sibutu Group of Islands which is separated from Borneo by the Alice Channel. The Sibutu Group is made up of elongated and narrow reef complexes and islands that are separated by narrow and deep channels. These are the Meridien Channel and the Tumindao Channel with widths of 2 km to 3.5 km. Depths in both channels reach up to -100m as indicated in NAMRIA Map Interestingly, the islands and reefs of Sibutu are oriented along the north south direction suggesting strong influence of geology and possibly current movement. The easternmost island of this group is the narrow and elongated Sibutu Island. To the west of Sibutu Island is the Tumindao reef complex. Tawi-Tawi Island Group To the northeast of the Sibutu Group, separated by the Sibutu Passage is the Tawi-Tawi Island Group. This island group is dominated by the large island of Tawi-Tawi which is elongated along the northeast-southwest direction. The smaller islands of this group are Baliungan and Tandubato at the northeastern end and Sanga-Sanga, Bongao, Simunul and Manuk Manka at the southern end. As interpreted from NAMRIA Map 2553, a patch reef occurs pervasively on the shelf at the southeastern part of Tawi-Tawi. An enclosed body of marine water, about 20 km x 10 km is present at the southern end of Tawi-Tawi. This is enclosed by southern part of Tawi-Tawi Island, Sanga-Sanga and Bongao at the northwestern side; by Simunul Island, Sangasiapu Island and Lao Island at its southeastern side and by an extensive reef flat at the eastern flank. The rocks of Tawi-Tawi Island are the oldest exposed in the Sulu Archipelago. The Bureau of Mines and Geosciences (1982) reported that the northern half of Tawi-Tawi is made up of Mesozoic (Jurassic to Cretaceous) serpentine and basalt associated with metavolanic intrusives with thick quartz veins. While the southern part including Bongao is underlain by Miocene sandstone conglomerate. The presence of the Miocene conglomerate indicates the presence of large land masses during this geologic epoch from which clasts of the conglomerate are derived. Tapul Siasi Island Group This group of islands is separated from the Sibutu Island Group by the Sugbai Passage. Islands making this group are Lapac Island, Siasi Island, Lugus Island, Tapul Island, Cabingaan Island, Paquia Island and Tangkapaan Island. Again, the north-south alignment of submarine features between Sugbai Passage and Tapaan Passage stands out. The islands of the Tapul-Siasi Group are of Quaternary volcanic origin. Other islands, the small and flat islands are probably of coralline origin. As noted in the NAMRIA Map 2553, large mangrove swamps are present in the island groups of Cabingaan, Tangakapaan and Paquia. 20
22 Jolo Island Group Jolo island group is composed of the islands of Jolo, Pata, Patian, Capual, Bitinan, Gujangan, Marongas, Cabucan, Bubuan and other small islets. The islands of Jolo, Pata and Patian are sites of Plio-Pleistocene volcanism. While the other small flat islands, including the islands of Cabucan, Marongas, Pangasinan, Bubuan, Hegas and Minis could be uplifted coralline formation. Pangutaran Island Group To the northwest of Jolo Island is another group of flat islands, the Pangutaran Island Group. This island group is further divided into smaller groups of islands by deep channels. To the south is the island group of North Ubian, Ticul, Usada, Cunilan and Basbas. To the north is Pangutaran Island which is separated from the other islands by deep channels one of which is the Pangutaran Passage. To the east of Pangutaran Island are the islands of Kulassein and Panducan. Smaller islands further to the east include Tubigan and Teomabal. No information is at hand on the geology of the other islands. The Bureau of Mines and Geosciences (1982) classified Pangutaran Island as Plio-Pleistocene reef limestone. It is presumed that recent reefs veneer this older carbonate formation. Samales Group To the east of the Jolo Group is the Samales Island Group. The very narrow Capaul Channel separates this island group from Jolo Group. The islands composing the Samales Group are Bangalao, Simisa, Balanguingi, Tongquil, Bulan and Bucutua. It is inferred that the flat islands of the Samales Group are recent coral reef. The exception is the island of Bulan which by its topography is suspected to be volcanic. Extensive mangrove swamps in almost all of the island are indicated in the NAMRIA Map Basilan Island and the smaller island groups Lumped together with Basilan Island are the Tapiantana Group, located south of Basilan and the Pilas Island Group situated west of Basilan. Separating these island groups from mainland Basilan are the Tapiantan Channel and the Pilas Channel, respectively. Basilan is a volcanic island (Plio-Pleistocene) with multiple eruption vents expressed by the mountain peaks scattered in the island. The flat islands of Tapiantana and Pilas are inferred to be of coralline origin. Mangrove swamps occupy much of these smaller islands. The Zamboanga Peninsula Basilan Island is isolated from the Zamboanga Peninsula by the relatively shallow Basilan Strait. Unlike most of the channels of the Sulu Archipelago, the Basilan Channel is relatively shallow with maximum depth of about -50m. Zamboanga Peninsula is an amalgamation of the oldest terrane known in the Philippine archipelago and the younger island arc system. The oldest terrane mapped in Zamboanga is the Cretaceous metamorpic rocks which covers much of the 21
23 peninsula. Tertiary sediments and igneous intrusives are also represented. Plio- Pleistocene volcanism is very active in Zamboanga as evidenced by the presence of extensive formation of volcanic rocks. Reefs of the Zamboanga Peninsula are commonly fringing type. Shelf around the western and northern seaboard of Zamboanga Peninsula is considerably narrow. Continental Shelf of Northwest Borneo This section shall dwell only on the description of the part of the shelf within the Philippine territory. The northeastward limits of Borneo's continental shelf is approximately indicated by the Cagayan de Tawi-Tawi and the Turtle Islands Group. Farther to the north, the continental shelf of Borneo merges with the shelf of Palawan. Important islands in this border of the Philippines are Balabac, Mantangule, Bancalan, Pandanan and Bugsuk. The Turtle Islands Group The Turtle Islands Group on the Philippine side is made up of 6 major islands. These are Taganak, Baguan, Baoan, Bakkungaan, Lihiman and Langaan. The first two, Taganak and Baguan, are volcanic in origin, of the Plio-Pleistocene age. Accumulated around the foot of the volcanic hills are recent alluvial deposits mainly composed of coralline sand. The islands of Baoan, Bakkungaan and Lihiman have different modes of formation. These islands were built up by diapiric activities. Mud and boulders are forced to the surface from subsurface sources due to intense pressure, hence the formation of mud volcanoes. Shapes of these islands are tadpole-like, rounded-head, tapering towards the tail. The rounded-head is interpreted to be formed by the shifting positions of mud flow channels. This is best illustrated by the present activity in Lihiman Island. Geologic mapping in Bakkungan identified sandstone formation that is possibly of Middle Miocene age, the same age as the Crocker Range Formation of Sabah. All these major islands are rimmed by fringing reefs. Cagayan de Tawi-Tawi Cagayan de Tawi-Tawi is generally flat with hills punctuating the broad alluvial plains. The hills are of volcanic origin. The circular lakes at the southern part of the island are interpreted to be products of maar explosion, a process similar to the formation of the lakes of San Pablo, Laguna and Batangas. Sulawesi Sea The Sulawesi Sea is bound to the northwest by the Zamboanga Peninsula and the Sulu Archipelago, separating Sulawesi Sea from the Sulu Sea. Major embayments in the gulf are Sibuguey Bay, Yllana Bay, Saranggani Bay and other smaller bays. The widest shelf area in the Philippine side of the Sulawesi Sea is located in the Sulu Archipelago and the southern coast of the Zamboanga Peninsula. The shelf is extremely narrow beyond this region. 22
24 The basin, as described by the Bureau of Mines and Geosciences (1982) based on results of seismic surveys, has a rather flat bottom, with depths ranging from 4500 to 5000 meters. The flat seafloor is occasionally interrupted by small seamounts. Sediment cover of the basin is estimated at about two kilometers thick. Relatively recent bathymetric data suggests that the Sulawesi Sea is divided into two sub-basins by a northwest trending ridge connecting to the Sulu Archipelago at the north (Rangin and Silver, 1990). GEOLOGY Emmanuel S. Bate Tectonic Setting and Geologic History Table 2.2 Geologic time scale Era Period Epoch Millions of Years Ago Cenozoic Recent 0.01 Quaternary Pleistocene 2.5 Mesozoic Tertiary Cretaceous Pliocene Miocene Oligocene Eocene Paleocene Paleozoic Jurassic Triassic Permian Carboniferous Devonian Silurian Ordovician Cambrian TECTONIC SETTING The Sulu-Sulawesi region is situated in a geologically complicated part of the earth. The Philippine arc for instance is made up of a complex collection of island arcs and fragments of continental and oceanic crusts. The ecoregion is located along the boundaries of three major tectonic plates, the Philippine Sea Plate, the Eurasian Plate and the Australian Plate. As described by Ramos (1999), the Philippines is located between 23
25 the Philippine Sea Plate (smaller section of the Pacific Plate) and the Eurasian Plate represented by the South China Sea. The convergence of the northwestward moving Philippine Sea Plate and the Eurasian Plate is responsible for the tectonic activities in the Philippine Arc. The commonly recognized major tectonic features of the region are: (1) the Philippine Trough along the eastern border of the Philippine Arc; (2) the Manila Trough along the northwestern part of the arc; (3) the Sulu-Negros Trough in west central part of the Philippine Arc; (4) the Cotabato Trough at the southern part of the Philippine Arc; (5) the northeast-southwest Cagayan Ridge which bisects the Sulu Sea Basin; and (6) the active Philippine Fault (Figure 2.3). The Philippine Trough marks the northwestward convergence of the western edge of the Philippine Sea Plate with the Eurasian plate. This trough extends far south to the Halmahera. To the north of the Philippine Trough is the East Philippine Trough, which marks the pate convergence at the northeastern part of the Philippine Arc. As described by Rangin and Pubellier (1999), convergence in this zone of the Philippine Sea Plate is minor due to the blockage of subduction with the arrival of the Benham Rise. Instead, much of the convergence is absorbed by the Manila Trough. Within the central part of the Philippine Arc, part of the convergence of the Philippine Sea Plate with the Eurasian Plate is taken up by the Negros-Cotabato-Sulu Trenches (Rangin and Pubellier, 1999), while the Sulawesi Sea oceanic crust is being consumed by the Cotabato Trough. The Cagayan Ridge is an east-northeast trending submerged ridge that divides the Sulu Basin into northwest and southeast basins. This is a constructional ridge that is mainly of volcanic origin (BMG, 1982) and is part of the Cagayan Volcanic Arc. The volcanic islands of Cagayan de Tawi-Tawi and the Turtle Islands are presumed, as well, to be part of this volcanic arc. Rangin and Silver (1990) described the northwest slope of the ridge as relatively smooth while the southeast slope is steep cut by normal faults. Drilling at the southern part of the ridge showed a thick accumulation of volcanic rocks (andesite, basaltic flows and pyroclastics) interlayered with lower and lower middle Miocene shallow marine to brackish clastic sediments (Rangin and Silver, 1990; see Table 2.2 for geologic time scale). The northern part of the ridge is capped by platform reefs of Arena, Cavili, Jessie Beazley, Tubbataha, Basterra, Bancoran and San Miguel. Separating the Sulu Basin from the Sulawesi Basin is the Sulu Volcanic Arc - represented by the Sulu Archipelago extending into the Zamboanga Peninsula. Volcanism in this arc is Plio-Pleistocene in age. This Quaternary volcanic sequence overlays the pre-tertiary metamorphic basement in the Zamboanga Peninsula. Similarly, older volcanic sequences have been identified in southern Sulu Archipelago (Tawi-tawi Island; Rangin and Silver, 1990). This arc has been traced to Panay as its northern limit and the Dent Peninsula in Sabah as its southern limit. Radiometric dating of this volcanic arc along its length by different workers showed varying ages of 16.2 to 14.4 Ma in Zamboanga, 16.2 to 9 Ma in Panay, and 13 to 11 Ma in the Dent Peninsula (Rangin and Silver, 1990). 24
26 Figure 2.3 Major tectonic features of Sulu-Sulawesi 25
27 Seismic survey conducted in the Sulu-Sulawesi basins revealed substantial information on sediment deposition. The sediment isopach map (Mrozowski and Hayes, 1978; Figure 2.4) of the region indicates the most pervasive sediment deposition in the northwest basin of Sulu Sea. A thick sequence of sediment has also been mapped at the southeastern part of the southeast basin of Sulu Sea and along the western side of the Sulawesi Sea, through the length of the eastern periphery of Borneo. The Middle Miocene (9 Ma) collision of the Cagayan Ridge with the Philippine Arc (Panay) coincided with the peak in turbidite sedimentation all across the Sulu and Sulawesi Basins. Uplift and the fall of global sea level is suspected to have enhanced massive events of quartz rich turbidite deposition. The suspected source of quartz rich clastics is Sabah, namely the Crocker Formation (Rangin and Silver, 1990). The northeast sub-basin of Sulawesi Sea is less sedimented. Seafloor magnetic anomalies have been identified by Weissel (1980, cited in Rangin and Silver, 1990) in the southwestern basin indicating the middle Eocene formation of that particular part of the basin (Rangin and Silver, 1990). Analyses of drill samples collected from the northeast basin showed claystone deposits containing clay minerals seen in modern pelagic clays of equatorial western Pacific (Rangin and Silver, 1990). Characteristics of the claystone further indicate that the depositional environment is not far from a continent but protected from terrestrial and volcanogenic deposition (Rangin and Silver, 1990). These authors further deduced that: (1) volcanic arc activity is not significant; (2) early volcanism in the Cagayan Ridge is not recorded in the sediments of the Sulawesi Basin; and (3) quartz rich turbidites encountered at the northeast basin (deposition of which started 18.5Ma) could not have come from Sabah (as in the southwest basin of Sulu Sea) since Cagayan- Palawan took place only between 17.8 to 14 Ma. They presumed that the source of such quartz-rich clastic is the granodiorites in the north arm of Sulawesi. Erosion of these granodiorites could have ensued uplift and collision of this arc with the Sula Platform. PLEISTOCENE PALEOGEOGRAPHY The paleogeography of the Sulu Sea region during the late Pleistocene can be reconstructed with some degree of accuracy. This is attributed to the fact that the region has become relatively stable since the late Miocene with the cessation of subduction activities along the Palawan Trench. Hence, much of the Philippine Archipelago must have already existed then with some geomorphic changes due to local uplift and active volcanism. The fluctuation of the sea level to about 120 meters during the late Pleistocene (Heaney, 1985) below present sea level exposed a wide area of the continental shelf of Northern Borneo, Palawan and the Sulu Archipelago. The reconstructed shoreline of Sulu Sea during the late Pleistocene is shown in the accompanying map. Based on this reconstruction, the Sulu Sea, together with the Sibuyan Sea, Camotes Sea and Bohol Sea formed a network of inland seas. These smaller bodies of water are connected to the Sulu Sea by narrow channels. This network of inland seas is isolated from the Pacific Ocean. Its connections to the South China Sea are the narrow Mindoro Strait and the Verde Island Passage at the northern region. Its access to Sulawesi Sea is only through the Sibutu Passage at its southernmost part. 26

28 Figure 2.4 Sediment isopach map 27
29 The map showing the late Pleistocene shoreline of Sulu Sea indicates that Palawan, including the present day shelf, is connected to Borneo, while the Sulu Archipelago which is made up of large island masses is separated by deep channels. It is not known though how much the volcanic activities in the Sulu Archiplego have contributed to the build up of land masses in this region during the Pleistocene. The island of Mindoro is inferred to have existed as an isolated land mass even before the Pleistocene. It is separated from its adjoining land masses by bodies of water such as: (1) the Mindoro Strait which separates it from northern Palawan; (2) the Verde Island Passage which separates it from Luzon; (3) and the Tablas Strait which separates it from the large island formed then by Panay, Negros and Cebu. Mindanao must have been connected with Luzon through the eastern islands of the Philippine Archipelago during this geologic period, while the land masses of Panay, Negros and Cebu were connected to Mindanao by an isthmus, which is now the Bohol Island. It is surmised that the islands of Siquijor and Camiguin already existed then as small islands within the Bohol Sea. Active Geologic Processes SILTATION AND SEDIMENTATION Geologic records show that sedimentation in the Sulu-Sulawesi Basins has been active since the middle Miocene (~15 Ma). Borneo is construed to have continuously been the major source of terrigenous sediment in the Sulu-Sulawesi Basin. Delineation of the drainage basins in the land masses surrounding the Sulu Sea shows that the drainage basin of Borneo accounts for more than 60% of all the drainage basins emptying into the Sulu marine basin (Table 2.3). Sediment plume from Sabah has been observed (R. Trono pers. comm.) to disperse beyond the Turtle Islands group. Table 2.3 Drainage basins in islands surrounding the Sulu Sea Island Area in Km 2 Percent Mindoro Occidental 4, Eastern Palawan 6, Western Panay 3, Zamboanga del Norte 6, Negros Occidental 7, Northwest Borneo 46, Total 75, The contribution of Borneo to the Sulawesi Sea is presumed to be similarly significant considering the size of catchments in the island of Borneo. In the Philippine side, the 28
30 largest basin in Mindanao draining into the Sulawesi Sea is the Mindanao River System which has a total land area of almost 20,000 km 2. Table 2.4 summarizes the drainage basins in Mindanao and Basilan that drains into the Sulawesi Sea. In the Turtle Islands, diapiric activity, indicated by the presence of mud volcanoes in Lihiman, Baoan and Bakkungaan, is another likely source of siltation. Material being extruded by the mud volcanoes, as inferred from the deposit around the active one in Lihiman Island, is grey mud with angular clasts of gravel to boulder size rocks. The presence of submarine mud volcanoes off Lihiman is suspected based on the reported occurrence of highly turbid water in the area. Table 2.4 Basins in Mindanao and Sulu Archipelago draining into the Sulawesi Sea Island / Province Area in Km 2 Zamboanga del Sur 5, Lanao del Norte Lanao del Sur Maguindanao Sultan Kudarat 1, South Cotabato (including Mindanao River) 25, Basilan 1, Total 36, Siltation is identified as the most important factor severely affecting the country s coral reefs (EMB, 1996). EMB (1996) estimated that a widespread phenomenon like the eruption of Mt. Pinatubo is estimated to translate into a fishery loss amounting to US$0.5 to 2.5 Million per annum for the next 5 to 10 years. The same study states that human activities that greatly contribute to siltation are deforestation (including logging), agriculture and mining. SEISMIC AND VOLCANIC ACTIVITIES A greater part of the Sulu-Sulawesi region is located in what is referred to as the stable region. Subduction in this region has ceased and consequently there are no seismic and volcanic activities. But volcanism and seismicity occur along the northeastern border of Sulu Sea, along the Negros-Sulu Arc and the Cotabato-Sangihe Arc at the eastern border of the Sulawesi Sea. At the northeastern periphery are the volcanoes of the island of Negros while volcanoes at the eastern border (Philippine side) include Mt. Apo in Davao and Balut Island. Further south, numerous volcanic centers are present along the Sangihe Archipelago. 29
31 In the Sulu Arc, the active volcanoes are the Bud Dajo and Jolo Volcanoes. Bud Dajo is a solfataric cinder cone while Jolo Volcano is a pyroclastic volcano extruding mostly basaltic ash. It was reportedly active in 1641 and again erupted in 1897 (BMG, 1982). The southern coastline of Zamboanga, including the eastern coastline of Basilan and the coastline of Cotabato are susceptible to tsunami, triggered by earthquake generated by the Cotabato Trench. This region has been hit by a number of tsunami events (Figure 2.5). SEA LEVEL RISE Over the recent decades, there is an increasing concern for the effect of climate change on sea level rise. As such it is now recognized that sea level adjustment should be considered in coastal studies. Earlier estimates predict sea level rise can be drastic while more recent estimates based on monitoring, predicts that for the period 1900 to 2100 sea level rise is placed at 46 cm translating to a rate of 4-5 mm per annum. A higher rate of more than 10 mm/annum is reported in deltas and coastal plains. But this is attributed to subsidence due to groundwater extraction. A response of certain marine ecosystems to sea level rise in the Sulu Sea may well be exemplified by the platform reefs atop the Cagayan Ridge. The presence of a reef more than 400 meters thick in Tubbataha indicates that vertical expansion of the reef complexes in the Sulu Sea, at least during the last 18,000 years, kept pace with the fluctuating sea level at the end of the glacial period. BEACH EROSION There is limited information on beach erosion in the Sulu Sea. Among the few islands WWF has monitored is Baguan Island in the Turtle Islands. The pattern of sediment migration shows a possible long-term adjustment of the shoreline. While erosion is active in one part of the island, accretion takes place in the leeward side resulting to a change in the shape of the island. Additionally, very pronounced erosion occurs in the islands of Taganak, Bakunggan and Baoan. The shoreline has in fact retreated. Other areas which experience shoreline retreat include Pamalican and Manamoc Islands of the Quiniluban Group, and Cuyo in Palawan (SEASTEMS, 1990). 30
32 Figure 2.5 Tsunami prone areas 31
33 METEOROLOGY Emmanuel Anglo The SSME is a typical tropical oceanic region, with a mean surface air temperature of ~27 C. The waters prevent temperatures from fluctuating more than 10 C within the day, and monthly average temperatures deviate by less than 5 C between the coldest and warmest months. Between the northernmost and southernmost point of the area, mean annual temperatures differ by less than 3 C. Any significant geographic variation in temperature is largely due to elevation. Relative humidity is nearly constant at 80%, seldom falling below 60% owing to the availability of water vapor all year round. Higher temperatures during summer increase evaporation from the ocean, but allows the atmosphere to hold more water without reaching saturation. Lower evaporation during the Northern Hemisphere winter reduces absolute humidity but relative humidity remains high. For the same reasons, clouds are always present even in the absence of disturbances. The ocean is the main factor defining the climate over the area. Weather, on the other hand, is modified by various other climate controls discussed below. Climatic Controls Flores and Balagot (1969) identified several large-scale systems that control the meteorology of the area. Situated along the equatorial region, westward-flowing North Pacific Trade Winds define the general flow. The Asian monsoon imparts a conspicuous cycle in wind and rain patterns over much of the region. Disturbances are so common that they characterize mean conditions in the area. These include short-lived convective thunderstorms associated with either the Intertropical Convergence Zone (ITCZ) or easterly waves embedded in the trade winds. Forecasters also attribute heavy cloudiness and precipitation during the winter months to fronts. However, the most important type of weather disturbance in the area is the tropical cyclone, which brings extreme rains and winds to northern portions of the area. The El Niño-Southern Oscillation (ENSO) episode illustrated the vulnerability of the region to this phenomenon. Since then, strong interannual variations in the weather have been attributed to its irregular cycle. The last major episode was in 1998 when rainfall decreased initially followed by an ultimate rise in surface temperature. TRADE WINDS The Trades make up a belt of easterly winds along the equator. Together with westerlies along the middle latitudes and the easterlies around the polar caps, these winds form what is known as the general circulation of the atmosphere. Trade winds vary in strength 32
34 along meridians, fluctuating from one month to the next and from one year to another. Trade winds also drive equatorial ocean surface currents, generating the westwardflowing North Pacific Equatorial Current. Within SSME, the Trades are often dominated by the monsoonal flow such that they can only be distinctly pinpointed on months during the transition between the two regimes of the monsoon. The topography of Mindanao also modifies their speed and direction, weakening their presence near the surface. THE ASIAN MONSOON The factor imparting a strong seasonal variability in the weather over the Philippines is the Asian Monsoon. During the summer, temperatures progressively rise over the Asian mainland, generating a persistent low pressure area that draws warm moist air from the surrounding oceans to the interior of the continent. As these air masses spiral towards Asia, they impart a southwesterly flow over the Philippines, and unload large amounts of rainfall along the way. During the Northern Hemisphere winter, the cooling over Asia forms a semi-permanent high near Siberia. The divergence of cold and dry air away from this high brings a chilly wind from the northeast over to the Philippines. The cold also tends to suppress evaporation from the ocean, bringing rainless days to many areas. However, air forced over the windward side of the mountain ranges in Southern Luzon and Eastern Mindanao undergoes condensation, causing precipitation in these areas to peak in this season. Both the Southwest and Northeast Monsoons experience surges that bring intense rain over their areas of influence. In particular, heavy and widespread rainfall often takes place even with weak disturbances by enhancing the Southwest Monsoon. During the few weeks in the transition between the monsoons, trade winds become more prominent. THE ITCZ, EASTERLY WAVES AND FRONTS As noted earlier, these three systems influence cloudiness and rainfall over SSME through the development of thunderstorms. These tend to be mild disturbances that form part of the regular weather in the area. The ITCZ is a region that marks the confluence between the northern and southern segments of the trade winds. During July and August it tends to stay north of the Philippines. When it appears in August to April, it will be found within the Sulu or the Sulawesi Sea (Figure 2.6). This cluster of cloudiness brings winds and mild to moderate rainfall, usually of short duration. 33
35 Figure 2.6 Mean monthly position of the ITCZ over SSME (Flores and Balagot, 1969) 34
36 Satellite images of easterly waves show nearly circular clusters of cloudiness drifting westward with the trade winds. During summer, about two of these clusters pass through the Philippines per week, usually bringing mild rainfall to the eastern coasts of the Philippines. Few are able to reach the waters of the ecoregion after raining themselves out on the topography of the Pacific Ocean side of the country. Only stronger systems with heavy showers lasting for 2 to 3 days are able to cross over to the Sulu Sea. Whether the precipitation and cloudiness that prevail over the Philippines during the otherwise dry winter months are truly frontal in nature has long been debated. The main source of doubt is the absence of significant contrasts in temperature and humidity across the supposed interface. However, satellite images and synoptic charts often show these disturbances to be part of a cold front that extends from upper latitudes along a northeastsouthwest axis that can reach Mindanao. THE EL NIÑO SOUTHERN OSCILLATION (ENSO) The ENSO is a major oceanographic and meteorological phenomenon characterized by a weakening (even reversal) of the trade winds, a decrease in the upwelling over western South America, resulting in an anomalous warming of the waters in the eastern Pacific. Indeed, the measure of the phase and intensity of the phenomenon is the mean sea surface temperature over the Central and Eastern Pacific. Its effects are more subtle on the other side of the basin, but it can still be very profound. During the ENSO's warm phase, rainfall is generally below normal in the Philippines. As shown by De las Alas and Buan (1986), Mindanao is the region most prone to droughts during the ENSO period. Similar results were gathered by Harger (1995) for Indonesia, who also found an increasing equatorward sensitivity to the El Niño. Recent droughts associated with these events were accompanied by forest fires that persisted over large parts of Southeast Asia. The El Niño ceases as wind and ocean patterns over the Central and Eastern Pacific revert back to normal. However, conditions can swing another extreme called the La Niña, characterized by stronger trades and cooler sea surface temperatures. Results by Anglo (1999) provide detail on the impact of the cold and warm phases of the ENSO. Maps of standardized composites of annual rainfall associated with the phenomenon (Figure 2.7) show that the eastern Philippines receives higher than normal rainfall during the warm phase (El Niño), lower than normal during the cold phase (La Niña). By contrast, the western section of Luzon exhibits a minimal decrease during the event. During a La Niña, the same western section of Luzon again experiences a decrease in rainfall. Strong La Niña events intensify this decrease, and brings western Visayas (northeast of Sulu Sea) also under drought. 35
37 Legend LOWER THAN NORMAL HIGHER THAN NORMAL N El Niño Min = at Butuan Max = 0.15 at Sangley Strong El Niño Min = at Cagayan de Oro Max = at Coron 18N 16N 14N 12N 10N 8N 6N 20N La Nña Min = at Sangley Max = 1.68 at Dumaguete Strong La Niña Min = at Cuyo Max = 1.98 at Virac 18N 16N 14N 12N 10N 8N 6N Figure 2.7 Anomalies in standardized rainfall due to the El Niño and La Niña (Anglo, 1999) 36
38 37
39 TROPICAL CYCLONES The frequency of passage of tropical cyclones (TC) from 1950 to 1990 over the Philippine Area of Responsibility (PAR) is illustrated in (Figure 2.8), an update of a similar PAGASA map. As may be seen in this figure, most tropical cyclones pass through or originate from part of the Western Pacific east of the Northern Luzon area where more than 25 disturbances pass through every 10 years (or 2.5 annually). The ecoregion is relatively protected from these disturbances compared to the northern sections of the country. On average, less than two tropical cyclones pass through the area every year. Sulawesi Sea, in fact, is virtually free from being crossed by a tropical cyclone strong enough to be named. However, the area remains prone to the indirect effects of these disturbances through strong winds and rain. Monthly Station Weather As noted earlier, weather conditions over the SSME tend to remain invariant due to the buffering effect of the bodies of water. Variability is significant only in two parameters: wind and rainfall. Monthly patterns in these parameters are discussed below. WIND PATTERNS Wind statistics over the ecoregion are presented through wind roses from 20 stations surrounding the Sulu and Sulawesi Seas (Figure 2.9). Regional patterns, if any, appear to be subtle. Over the southeastern sector of the map, a north-south preference is visible. This covers Davao, General Santos, and Cagayan de Oro in Mindanao, Manado and Gorontalo in Sulawesi. This shared property is either coincidental or the influence of a large-scale system has not been investigated. A pure southwest-northeast reversal depicting the Asian monsoon is distinctly clear in only 2 of the 20 stations, Cuyo and Mactan in Cebu. It is visible in Iloilo, Romblon, Dipolog, Masbate and Sandakan, although winds from other directions tend to make its influence less pronounced. These stations tend to lie along a southwest-northeast axis crossing the central Philippines. Coron, Puerto Princesa, Calapan, Surigao, Tarakan and Manado indicate the presence of trade winds, even if winds in these stations can also come from other directions. Wind statistics in the remaining stations exhibit the prevalence of unique wind directions, such as in Tacloban, Tagbilaran, and Zamboanga. Winds at these stations are probably topographically modified. The data discussed above probably reflect only part of the wind conditions in the area. Owing to its volcanic origin, surface winds in the Philippines and its similarly situated neighbors will be channeled through valleys and around mountains. The tropical weather 38
40 will mean that there will be enough solar energy over the entire archipelago to drive diurnally reversing winds called land-sea breezes arising from the coastal interface. Winds over the open ocean are probably more steady and much less influenced by the topography, but few stations are available to describe them. Remotely sensed wind data gathered from the U. S. National Oceanographic and Atmospheric Agency (NOAA) are presented in Figure 2.10 as contours of zonal (east to west) and meridional (north to south) velocity components. A wind with a positive zonal component blows towards the east, that with a positive meridional component blows towards the north. The prevailing flow over the southeast sector of the ecoregion appears to be southwesterly. Over the northwestern sector the dominant flow is from the opposite direction. These averages tend however to mask the seasonal reversal resulting from the Asian monsoon. Isopleths of mean wind speed found in Figure 2.11 reveal the ecoregion to be regularly ventilated by a moderate flow of at least 3 meters per second. Average wind speeds are weakest near the center of the Sulawesi Sea, becoming stronger near the South China Sea and the Pacific Ocean. RAINFALL AND CLIMATE Monthly rainfall statistics from 32 weather stations surrounding the ecoregion exhibit a moderately narrow range of annual totals and about four main types of monthly distribution (Figure 2.12). The monthly distribution is in fact the basis of the Coronas climate classification used in the Philippines. The four types in this classification are described as follows (Kintanar, 1984): Type I Climate characterized by a distinct dry season and a wet season between June to September. Stations within the ecoregion representing this type include Cuyo, Coron, San Jose (Mindoro), and La Granja. In general western Luzon and the western side of islands in the Visayas belong to this type. This wet season tends to occur with the southwest monsoon, and it is no coincidence that these stations directly face this general direction in their respective island locations. Type II Climate here has no dry season and has a pronounced rainfall maximum during winter, which also happens to be within the northeast monsoon regime. PAGASA maps find this type to be almost exclusively at the eastern sides of southern Luzon, Samar, Leyte, and Mindanao. Within the ecoregion, Maasin (Leyte), Tacloban, Surigao, Butuan and, outside of the Philippines on the other side of the Sulu Sea, Sandakan and Manado, all belong to this type. Also common to these stations is the fact that they all have unobstructed exposure to this wind direction. 39
41 Max = Years Covered : 1950 Figure 2.8 Mean annual tropical cyclone passage frequency over the Philippines (Anglo, 1999) 40
42 % Romblon % Iloilo % % Calapan Masbate Mactan % % Tacloban Cuyo % % Surigao Tagbilaran % % % Coron Dipolog Puerto Princesa % % Cagayan de Oro % % Sandakan Tarakan % % % Zamboanga Davao % Manado % Legen d: Calm >16 Knots Gorontalo Gen, Santos Figure 2.9 Wind roses from selected stations within SSME 41

43 E 11 7E 11 8E 11 9E 12 0E 12 1E 12 2E 12 3E 12 4E 12 5E 12 6E 12 7E E 11 7E 11 8E 11 9E 12 0E 12 1E 12 2E 12 3E 12 4E 12 5E 12 6E 12 7E 2 Source: NOAA-CIRES/Climate Diagnostics Center
 and meridional wind velocity over the project")

44 Figure 2.10 Mean surface zonal (left) and meridional wind velocity over the project site ( ) 11 6E 11 7E 11 8E 11 9E 12 0E 12 1E 12 2E 12 3E 12 4E 12 5E 12 6E 12 7E E 11 7E 11 8E 11 9E 12 0E 12 1E 12 2E 12 3E 12 4E 12 5E 12 6E 12 7E 12 Source: NOAA-CIRES/Climate Diagnostics Center 43
45 Figure 2.11 Mean wind speed (left) and cloudiness over the project site ( ) Figure 2.12 Monthly rainfall at selected stations within SSME (mm) 44
46 45
47 ---figure 2.12 contd--- 46
48 Type III Stations with no pronounced rainfall peak and a short dry season in winter or spring are classified under this type. Most stations within Visayas not belonging to the other two previous types fall under Type III, such as Romblon, Iloilo, Masbate, Roxas, Calapan, Dumaguete and Zamboanga. The resemblance of this type to Type I indicates the influence of the southwest monsoon, but local or small-scale rainfall-inducing or suppressing elements probably modify the synoptic-scale processes. Type IV Rainfall here is nearly evenly distributed throughout the year, although in the absence of a clear definition of evenness there is some overlap between this type and Type III. Places that clearly fall under this type include Davao, General Santos, Tagbilaran, Sanga Sanga and Tawau. The lack of a seasonal pattern indicates the dominance of local rainfall controls such as topography and possibly land-sea breezes. Topography also probably reduces or eliminates the effect of large-scale processes. In this part of the globe, the presence of the ocean, the year-round availability of sunlight, and the convergence of the trade winds all favor the uplift of moisture-laden air that condense to generate significant amounts of annual rainfall upon which tropical forests thrive. The ample rainfall is also mirrored by the isopleths of mean cloudiness in Figure 2.10, which show that clouds cover at least half of the sky (4 oktas) on average. OCEANOGRAPHY Emmanuel Anglo Bathymetry of Major Basins The SSME encompasses the Sulu and Sulawesi Seas and the south-central waters of the Philippines (Figure 2.13). The bathymetry of the area is highly complex owing to the presence of volcanic ridges and sea floor depressions between major islands. In Central and Southern Philippines, which form the northern part of the ecoregion, scattered islands fringed by coral reefs mark its shallower portions. This area exchanges water with the Pacific Ocean through the San Bernardino and Surigao Straits. The Sulu Sea, which is one of the major basins in the region, is nearly rectangular in shape with its bottom sloping from about 1,500 m in the west to more than 5,000 m in the east. This region exchanges bottom water with the South China Sea through a deep channel (>500 m) running along the western side of Panay Island and south of Mindoro Island. This basin is also connected to the South China Sea through the relatively shallow Balabac Strait south of Palawan. Surface water exchange between the two basins occurs through this channel. 47
49 The other major basin in the ecoregion, which lies just south of Sulu Sea and north of the equator, is the large Sulawesi Sea. Previous oceanographic soundings and bathymetric charts show that this area has sharp gradients with depths exceeding 5,000 m towards its center. In its central parts, a large abyssal plain is situated in a depth of about 5,100 m. East of the basin is the Sangihe Trough which extends along the ridge that connects North Sulawesi with Mindanao. This area has a shallower sill depth of about 2,000 m and a maximal depth of more than 3,800 m. The bottom waters of the Sulawesi Basin is largely replenished by the Pacific Ocean through this eastern open boundary. A possible exchange of surface waters between the Sulu and Sulawesi Basins may also occur through the Sulu Archipelago. Tides With few exceptions, the observed tides in the ecoregion are generally of mixed type, judging from the conspicuous inequality between the two high and the two low water heights indicated in most of the gauging stations covered by the National Mapping and Resource Information Authority (NAMRIA). The primary constituents that dictate the tidal fluctuation in the area of interest include the main lunar diurnal (O 1 ), the solitary lunar diurnal (K 1 ), the main lunar semi-diurnal (M 2 ) and the main solar semi-diurnal (S 2 ) constituents. To examine the character of the tide in the stations of interest, ratios of the diurnal to the semi-diurnal constituents (O 1 + K 1 )/(M 2 + S 2 ) were obtained. The higher the value of this ratio in a station, the more dominant is its diurnal component. The estimated ratios are shown in Table 2.5. It can be seen that tides occurring in most of the stations are mixed, with a distinct semi-diurnal character as shown by the values that are close to unity. Davao Gulf is predominantly semi-diurnal based on its calculated ratio of 0.27, the lowest among the 21 stations and close to the characteristic ratio of 0.1 to be considered as purely semi-diurnal. Table 2.5 Calculated ratio of diurnal to semi-diurnal tidal constituents Tide Station (O 1 +K 1 )/(M 2 +S 2 ) 1. Banago Port, Negros Occidental Batangas Bay Cebu Port Surigao Port, Surigao del Norte * 5. San Narciso, Quezon San Jose, Mindoro Occidental * 7. Puerto Princesa, Palawan Penascosa, Palawan * 9. Jolo Port, Sulu * 10. Iloilo Port Dumaguete Port
50 12. Catanauan, Quezon Tagbilaran City, Bohol Isabela, Basilan * 15. Davao Gulf s Balabac Strait-Southern Palawan * 17. Ormoc, Leyte Tacloban, Leyte * 19. Ozamis Port Iligan Bay Macajalar Bay, Cagayan de Oro * mixed, but predominantly diurnal s semi-diurnal Seven out of the 21 stations have predominantly diurnal tides. Most are found in the southern Philippines near open waters. Two of these stations (Jolo and Basilan) are located at the boundary of the Sulu and Sulawesi Seas. Judging from this trend, tides on the other side of the basin are likely to also exhibit predominantly diurnal tides. In general, the tidal range within the ecoregion varies from 1 to 3 m. Stations in the northern portion showed tidal ranges of about 1 to less than 2 m. Slightly higher tidal ranges of 1.5 to 3 m have been reported in the Sulawesi Sea off the eastern coasts of Borneo. Currents Ocean currents in the ecoregion are mainly wind-driven and as such are expected to flow more or less in the direction of the seasonally varying monsoon winds. However, the presence of complex coastal boundaries and bottom topographic features in the area appear to have a profound influence on the observed circulation patterns. The formation of cyclonic and anticyclonic circulations are strongly dictated by wind stress and coastal and bathymetric configurations. The physical oceanographic study of Southeast Asian waters by Wyrtki (1961) gives by far the most comprehensive documentation of ocean currents in the ecoregion. This report includes current measurements in the Sulu and Sulawesi Seas. More recent observations using drifters and Acoustic Doppler Current Profilers (ADCP) were gathered by Lukas et al. (1991), mainly in the Sulawesi Sea. The latter observations, which are complemented by model results, gives a good picture of the influence of the persistent North Equatorial Current and Mindanao Current on the southern part of the ecoregion. 49
51 Figure 2.13 Bathymetric contours of the SSME 50
52 Scattered and intermittent observations on coastal currents within the Philippine Archipelago north of the ecoregion are gathered and compiled by the Coast and Geodetic Survey Department of the NAMRIA. Together with tide forecasts, predicted current velocities for selected channels are published annually by the agency. Surface flow from the Pacific Ocean through the Philippine Islands occur in the San Bernardino and Surigao Straits. In these two straits, strong tidal currents (often exceeding 100 cm/s) and residual currents are observed. They transport water of the surface layer over a sill depth of 110 m in the San Bernardino Strait and of 65 m in the Surigao Strait (Wyrtki, 1961). Numerous small passages in between the Philippine Islands are also responsible for minor but continuous water exchange with the Pacific Ocean. There is also a continuous transport of water from the North Equatorial Current into the Sulu Sea. From May to September, the current transport is expected to be weak because the southwest monsoon wind opposes it. The maximal inflow occurs in February (the peak of the northeast monsoon) when the North Equatorial Current is strongest. During this period, the water masses flow into the Sulu Sea partly through the South China Sea. Wyrtki's interpretation of the average bimonthly circulation patterns are shown in Figure The surface currents in Sulu Sea show strong seasonal variability due to monsoon winds. The wind-driven surface currents are generally weak in Sulu Sea with magnitudes ranging from 10 to 25 cm/s. During the northeast monsoon months of February, October and December, surface currents in Sulu Sea are generally directed towards the southwest. Surface waters flow out of Sulu Sea towards the South China Sea in two main exit points namely, the Balabac Strait south of Palawan and the deep channel off the coasts of Panay and Mindoro. During the southwest monsoon months of June and August, the surface currents in Sulu Sea change direction. The mean surface currents along the eastern coast of Sulu Sea in June appear to flow towards the northeast. As northeast-directed currents encounter the Philippine Islands, they veer to the northwest, and splits into a larger flow towards the South China Sea through the channel between Mindoro and Palawan and a weak return flow along the western coasts of the Sulu Sea. The situation in August at the height of the southwest monsoon season changes from a weak cyclonic to a more defined anticyclonic pattern. Water from the China Sea and the Pacific Ocean also appear to enhance this circulation through the deep Mindoro-Palawan channel and the Strait of Surigao, respectively. 51

53 Figure 2.14 Surface currents in the Sulu-Sulawesi region and vicinity (Wyrtki, 1961) 52
54 The Sulawesi Sea is widely open to the Pacific Ocean so that its circulation invades this region (Wyrtki, 1961). The Mindanao Current, which is enhanced by the North Equatorial Current, is responsible for the strong southwest flow (see Figure 2.14). The North Equatorial Current is the most powerful branch of the circulation in the western Pacific Ocean and flows steadily during the whole year towards the Philippines (Wyrtki, 1961). This current feeds the Mindanao Current, which flows close to the coast of Mindanao to the south with velocities often exceeding 100 cm/s. Approximately in the latitude of the south point of Mindanao, the current splits, one branch continues in the direction of the main current to the south, the other weaker branch turns to the southwest and enters the Sulawesi Sea (Wyrtki, 1961). Because of these two current systems, the average current patterns in Sulawesi Sea show a predominant northeasterly flow throughout the year. As this current system is expected to accelerate with the northeasterly winds, the northeasterly flow can reach a magnitude of 100 cm/s northeast of Sulawesi Sea during the northeast monsoon. However, as they intrude the center of the basin, a deceleration is evident upon encountering the major land mass of Borneo and Sulawesi. Part of the southwest-directed flow exits in the Macassar Strait as a weak current that continues towards the south. The main part veers up in the northeast direction as a weak counterflow in the north coasts of Sulawesi. The strong northeasterly flow in the Sulawesi Sea enhances water exchange with the Pacific Ocean. It is not surprising, therefore, that the water characteristics in the Sulawesi Basin is related to that of the Western Pacific Basin. Furthermore, water exchange through surface flows between the Sulu and Sulawesi Seas can occur between the Sulu Archipelago. From October to January, when north winds prevail over the Sulawesi Sea, the eddy in which the Mindanao Current turns back to the east, is displaced to the east, and water from the Sulu Sea flows through the western part of the Sulawesi Sea into the Macassar Strait. In the northern part of the Sulawesi Sea the water movements are normally weak and irregular, but movements into the Sulu Sea prevail from March to July and in the other months movements are towards the southwest (Wyrtki, 1961). Wind-Generated Waves Wind-generated surface waves were estimated using a hindcasting technique based on the Sverdrup-Munk-Bretschneider (SMB) modified relation for finite amplitude waves recommended by the US Army Coastal Engineering Research Center (CERC, 1989). This empirical method generates the amplitudes of wind-generated waves based on known wind speeds and depth of the basin. In particular, the procedure calculates the significant wave height, defined as the average height of the 1/3 highest waves. The method is based on the following equation: 53
55 H s = W g 2 gf gh 2 W tanh 053. tanh 2 W gh tanh W where H s is the significant wave height, W is the surface wind speed measured at anemometer level, F is the fetch or average distance the wind blows over the sea, g is the gravitational acceleration and h is the mean water depth. Table 2.6 shows the estimated significant wave heights at selected wind speeds and water depths in the ecoregion. Table 2.6 Estimated significant wave heights (m) in SSME. Depth (m) Surface Wind Speed (m/s) During normal conditions with wind speeds ranging from 1-5 m/s and an assumed fetch of 50 km, significant wave heights around half a meter or less can be expected in the area of study. During stormy conditions with surface winds ranging from m/s, the area may experience violent waves with significant wave heights exceeding 5 m in amplitude. It should be noted that the influence of the fetch on the wave height is asymptotic, i.e., higher fetches do not have a significant effect on the estimated values. As noted earlier, these figures represent the average of the highest third of all wave heights. Actual waves could be significantly higher, particularly in concave coastal configurations that tend to concentrate wave energy. Sea Surface Temperature (SST) Sea surface temperatures in the area have been taken from the website of the National Oceanic and Atmospheric Administration/Pacific Marine Environmental Laboratory (NOAA/PMEL). The surface water temperature measurements taken from 1946 to 1989 reflect the tropical character of the waters, with levels between 26 to 29 C. As shown in Figure 2.15, there is a 0.5-degree temperature decrease towards higher latitudes from the west-central part of the Sulawesi Sea to the southern coasts of Luzon. A similar latitudinal variation of surface temperatures during the northeast monsoon months of 54
56 November to April can be seen from the monthly interpolated SST s (Figures 2.16a-c). Lowest SSTs between 26.8 C to 28.2 C are generally observed in February. During the southwest monsoon season, a different distribution pattern of SST can be seen. A temperature gradient from west to east becomes evident. The SST distribution in May shows a maximum of about C in the western boundaries of the ecoregion (e.g. Palawan), decreasing to about C in the east. This east-west gradient vanishes during the month of June, reappearing again in July as a north-south gradient with a minimum of about 28.8 C in the deep portions of Sulawesi and Sulu Seas. In the northern coast of Sulawesi, a small area with a temperature above 29 C appears, as warm as the southern coasts of Luzon. An almost uniformly distributed SST picture can be observed during the month of August. This persists until the month of September. Most of the region under study has sea surface temperatures of C during these months. The only recorded exception was in 1998 when SST went up to 33ºC in September through November, thus causing the coral bleaching event. In locations with shallow waters, such as those with large fringing coral reefs in Southern Philippines, the seabed may be close enough to the surface to be heated directly by sunlight. Since the heat capacity of coral or other substrates are lower than that of water, a small greenhouse effect causes the overlying water to be heated as well. In such cases, variation in solar heating can cause the surface water to exhibit a temperature range exceeding 2 C within the day. Owing to the foregoing factor, short-term variations in cloudiness can also impart diurnal sea surface temperature changes larger than 2 C in shallow waters. Cooler and drier atmospheric conditions (which enhance evaporation and latent heat release from the ocean) bring mean water temperatures to below 27 to 28 C during the northeast monsoon months of November to February. Water temperatures consistently within the upper end of the narrow range are then expected during the months marking the transition between the monsoons owing to the decrease in cloudiness. The Asian summer should also bring warmer ocean temperatures, but increased cloudiness tends to decrease surface water temperatures during periods with disturbances. 55

57 Figure 2.15 Mean annual sea surface temperature within SSME (NOAA/PMEL) 56


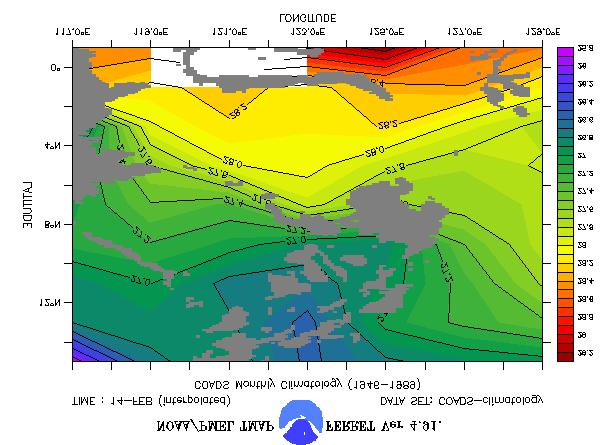
58 57


59 Figure 2.16a Mean monthly SST at SSME for January to April (NOAA/PMEL) 58

 16c Mean")

60 Figure 2.16b Mean monthly SST at SSME for May to August (NOAA/PMEL) Figure 2.16c Mean monthly SST at SSME for September to December (NOAA/PMEL) 59
61 60
62 Salinity Observations of salinity were taken from the World Ocean Atlas, which were interpolated and mapped by NOAA/PMEL from observations in The annual average values of surface salinity in the ecoregion is shown in Figure In general, the salinity varies from 33.5 psu (practical salinity unit) in the western coasts of Sulu Sea to about 34.2 psu in the eastern boundaries of the Sulawesi Sea, a relatively large range within the area. This can be explained by the strong variability of rainfall and evaporation in the ecoregion. According to Wyrtki (1961) and as indicated elsewhere in this report, the rainy season from May to September in the Sulu Sea is clearly developed, while during the rest of the year rainfall and evaporation are almost balanced. During the rainy season, the excess rainfall is about 840 mm, dropping salinity by 1.2 psu. But with a homogenous layer of 30 m such an excess of rainfall gives a decrease of only 0.9 psu. The inflow of water from the South China Sea therefore contributes to the drop in salinity, and from July to October, water with salinities between 33.0 and 33.4 psu enters the Sulu Sea. The increase in salinity from November to April coincides with the maximum inflow of highly saline water from the Pacific. In the Sulawesi Sea, Wyrtki (1961) noted that the phase of the annual variation of salinity is considerably displaced when compared to the Sulu Sea, but the amplitude is about the same. The salinity maximum occurs in September, and minimum in January. The Sulawesi Sea receives Pacific Ocean waters carried by the Mindanao Current throughout the year, causing slightly higher salinities in its eastern boundaries. However, during the northeast monsoon months, water masses from the Sulu Sea are transported into the Sulawesi Sea causing a salinity decline from October to January. It is evident that the salinity distribution in the region is dictated by the strength of the Mindanao Current and the waters of Sulu Sea particularly during the northeast monsoon months. The salinity variation over the months is also explained by the considerable rainfall that exceeds evaporation over Sulawesi. This causes a continuous decrease in salinity of the passing water masses. The homogeneous layer is normally less than 50 m and the salinity below it increases rapidly to more than 34.5 psu. Storm Surges The ecoregion rarely experiences storm surges. Historical records from the Philippine Atmospheric, Geophysical and Astronomical Services Administration (PAGASA) reveal that surge-generating tropical cyclones in most of the marine area covering Sulu and Sulawesi Seas are very rare. Very few cases have been documented (e.g. Surigao del Sur) east of the Philippine waters outside the ecoregion. The absence of storm surges in the area is not only attributed to the rare passage of tropical cyclones in the low latitudes, but also due to the sharp increase in water depths off coastal areas, and the complex coastal configuration of the region which effectively shelters many coastal areas from typhoon influence. The abrupt bathymetric change and 61
63 relatively deep waters in the area contributes to the damping of any propagating long gravity waves triggered by typhoons that pass over the northern portion of the ecoregion. WATER QUALITY Teresita Perez and Flordeliz Guarin The SSME covers a vast track of terrestrial, aquatic and marine ecosystems, all linked together by flowing bodies of water. Since water, along with all that flows with it, eventually ends up in the ocean, processes occurring upland dictates the outcome of the marine environment. Riparian Ecosystems The continuity of the upland to the coast is provided by the river systems. Rivers serve as the major transporter of nutrients from the upland areas to the estuaries and coastal waters. The quantity of freshwater influences the salinity in estuaries and the nearshore areas. Thus, changes in the quality and volume of freshwater determine the quality of the estuaries and has profound effects on the composition of the biological community downstream. Primary production in coastal waters are influenced by inputs from the land and from the discharge of the rivers. The quality of river water is determined by the land uses upstream of the river and the riverbanks. Land uses within SSME include agriculture; aquaculture; domestic use such as washing, cleaning, and fishing; and, in some parts, industrial uses such as discharge of effluents and as cooling water of industrial facilities. Some of the major rivers have been tapped for electricity generation either as dammed or running rivers. RIVER BASINS The Bicol River Basin is the only major river basin of the region with a total land area of 17,600 km 2. It is located in the southern part of Luzon with main topographic features such as the Eastern Bicol Cordillera in the northeast, the Ragay Hills in the southwest and the Bicol Plain in the central region. Its total catchment area is equivalent to about 21.4% of the total area of the region. Ragay Gulf (between the Bicol and Bondoc Peninsula, provinces of Quezon and Camarines Sur, Southeastern Luzon) A protected gulf area with an estuary in the northern part created by drainage from the mountains of the Northern Bicol Region (Mt. Labo). This coast is largely intact mangrove within intertidal mudflats, particularly in protected bays such as Peris Bay. Some areas have been converted to aquaculture ponds, and there are some coral reefs offshore. The gulf is saline with some dilution from the three main river sources to the north. 62
64 Figure 2.17 Mean annual salinity at SSME (NOAA/PMEL) 63
65 Natunawan Cove (southeast of Tabaco, north of Albay Gulf, Albay Province, Southeastern Luzon) A narrow oblong cove with intertidal mudflats and mangrove swamps in its upper reaches. The cove receives freshwater input from several rivers and streams, and has an average depth of only 1-2 m. The substrate is muddy in the inner part of the cove, and increasingly sandy towards the mouth. The Mindoro Basin Naujan Lake (northeast of Mindoro Island, Oriental Mindoro) A large freshwater lake extending for about 14 km from north to south and seven km from east to west. The lake is fed by local run-off and there are no major effluents; the outlet is near the north end through the Lumangbayan River. The Eastern Visayas Basins Catubig River and estuary (Northern Samar) The Catubig River is found in the highlands of northern Samar to the estuarine mangroves and intertidal mudflats at its mouth near the town of Laoang on the north coast of the island. The valley remains very much in its natural state, especially in the upper part of the watershed. Lake Danao (Imelda, northeast of Ormoc City, Leyte) This is a small fresh water lake with associated marshes on Mt. Danao in the highlands of North-central Leyte. The lake is fed by local run-off and is included in the Lake Danao National Park. Leyte Sab-a Basin (northeastern plains of Leyte) A vast area of marshy plains with numerous small lakes and ponds, peat bogs characteristic of binag marshes and rice paddies. The water supply comes from a number of springs, small rivers, aquifers at the edge of the basin and local rainfall. A large number of waterways traverse the basin, most of these draining east into the Leyte Gulf. Lake Bito (East-central Leyte) A small freshwater lake with associated marshes in low hills in East-central Leyte. The lake is fed by several small streams and local run-off. Layog and Higasaan Rivers (Abuyog, Leyte) The Layog River and its tributary, the Higasaan River, springs from about 1,000 m in elevation at the hills of Southern Leyte to the Layog Estuary in Leyte Gulf south of Abuyog. 64
66 Hinunangan Rice Paddies (southeastern coast of Leyte) A large area of rice paddies on the coastal plain of Southeastern Leyte, surrounded by extensive coconut plantations. There are deforested mountains to the west and southwest, including Mt. Cabalian. The Das-ay River system flows through the paddy areas. The Cebu River Basin comprises the central portion of the island including the isalnds of Mactan, Camotes and Bantayan. It is bounded on the north by the Masbate River Basin, on the west by the Negros Occidental and Negros Oriental River Basins, on the southeast by Siquijor Basin and on the east by the Bohol and Leyte Basins. The rivers of the Cebu Basin are relatively short and few but consist of numerous streams and brooks that dry up often during the summer months. Lake Danao (northern part of Pacijan, Camotes Island, Cebu) A fresh water lake about 5 km long with no definite outlet and the largest fresh water lake in Cebu. Most of the original vegetation has disappeared and even the small islet in the lake has been planted with coconut. The lake is fed with local run-off. Bohol Basin is generally hilly and rolling. Rolling hills and broad open valleys are concentrated in the northeast and the central parts of the basin. Its level areas comprise about 35 percent while the southern half has comparatively rough terrain broken by deep gullies. Inabanga River is considered the longest, originating from Mt. Sadungan. It traverses northeasterly and is joined by Malitbog, Wahig and Isomas Rivers as it drains towards Cebu Strait. Loboc River is considered the principal drainage of the southern portion of the basin which traverses southward and is joined by Cantimoc, Sampalago and Labayog Rivers draining to the Bohol Sea. Cogtong Bay (east coast of Bohol) An estuarine system of three small rivers, the Cabidian, Matulid and Sagumay, with extensive mangrove swamps and some areas of fish ponds; and the adjacent small sea bay (Cogtong bay), with extensive intertidal mudflats, several mangrove covered islands and offshore coral reefs. The rivers arise from the hill ranges of Southern Bohol. Cabidian River enters the bay in the north and forms the boundary between the two municipalities; Matulid River lies in the middle, and Sagumay River, the smallest of the three, enters the bay in the south near Candijay. Lapinin Island and Cabulao Bay (northeastern coast of Bohol) There are mangrove swamps and intertidal mudflats around the offshore island (Lapinin), two nearby islets (Lapipin Chico and Banoon), the adjacent main coast, and the associated shallow sea bay (Cabulao). There are some areas of fish ponds on the mainland coast, and offshore coral reefs. Trinidad and Quinobatan Mangroves (north coast of Bohol) This is the estuarine system of the Ipil River, with mangrove swamps along the lower reaches of the river and associated creeks, and extensive intertidal mudflats at the mouth of the estuary. 65
67 Jetafe Mangroves and Mahanay Island (north of Bohol) A large area of coastal mangrove swamps and intertidal mudflats on north coast of Bohol east of the Jetalfe Region to the Tulang point area. The Bago Binalbagan basins are among the major basins in the Nergos Island. It consists of the Bago and Binalbagan Basin proper and independent watersheds at the northwest to northeastern portion of the island. Bago has about 798 km 2 while Binalbagan has 772 km 2 and the rest covers 2,956 km 2. Most of the rivers except Binalbagan such as Himocaan, Grandse, Sicaba, Malogo, and Imbang including the northern upstream of Bago River originate from Mt. Mandalagan. Bago River drains into the Guimaras Strait while Binalbagan drains towards the Panay Gulf. The Negros Oriental Basins lie on the southeastern portion of the Negros Island with a total area of 5,694 km 2. Lake Balanan (southern tip of Negros Oriental) This is a freshwater lake in the forested mountains of Southern Negros with a shape resembling a figure eight, the narrowest point between the two main portions of the lake being only 90 m wide. The lake is surrounded by mountain ranges, and is fed by three streams, two of which rise on Lamaraw Mountain and the third on Anupugan Mountain. Bais Bay (Negros Oriental) This is located on the eastern side of Negros Island of the Visayas Region, with an area of 54 km 2. The bay is divided into two: North Bais Bay where Panambalon River, Alangilanan and Luato Rivers drain and South Bais Bay where Panamangan River drains. The two bays each have a pier and a fishing port. The coastline is fringed with mangroves that constitute about 4.6% of the total bay area. Pagatban River and estuary (southwest coast of Negros Oriental) The reaches of Patbagan River, its estuary and the adjacent shallow, semi-circular bay is bounded by a sandy beach extending from the river mouth to Candumao point to the west. There are extensive intertidal mudflats in the estuary and bay, belts of mangrove swamps m wide along the river banks, and rice paddies inland. The estuarine portion of the river extends upstream for about 500 meters. Ilog River and estuaries (southwestern coast of Negros Occidental) The estuarine and delta systems of the two main distributaries of the Ilog River has extensive intertidal mudflats, mangrove swamps, fishponds and adjacent rice paddies. The two estuaries are about nine km apart and both are prone to frequent floods which brings large volumes of sediment to the area. Southwestern Panay (Iloilo and Antique) The Sibalom-Guimbal Basin is located in the southwestern part of Panay covering almost the whole province of Antique and the southwestern part of Iloilo. The basin covers an approximate area of 2,800 km 2 composed of two principal basins. The 66
68 basin is generally mountainous with a fairly wide plain in Sibalom and a few adequately drained valleys in San Jose forming the San Jose-Sibalom Plains. The watershed has a total land area of 1,260 km 2 with an annual runoff depth of about mm or about 5,172 million cubic meters (mcm). Table 2.7 shows the annual water balance analysis of the Sibalom-Guimbal Basin, with Sibalom Basin having an area of 564 km 2 and Guimbal Basin with an area of 194 km 2. There is an addition of six minor basins and numerous independent watersheds. The drainage-ways of the basins are the Sibalom River which originates from Mt. Tigatay while Guimbal River originates from Mt. Napulac. Table 2.7 Annual water balance analysis of the Sibalom-Guimbal Basins Basin name Drainage area (km 2 ) Mean annual rainfall (mm) Mean annual run-off depth (mm) Mean evapotranspiration (mm) Coefficient of run-off (%) Sibalom 564 3,104 1,670 (942) 1, Guimbal 194 2,734 1,650 (320) 1, Cairauan 51 3,400 2,134 (109) 1, Cagaranan 294 3,332 1,858 (546) 1, Dalanas 119 3,400 2,302 (274) 1, Ipayo 71 3,300 1,724 (122) 1, Paliuan 206 3,400 2,046 (421) 1, Tibiao 41 3,400 2,300 (094) 1, Aggregate 2,800 3,068 1,847 (5,172) 1, Source: National Water Resources Council, Framework Plan for the Western Visayas, August Kalibo Wetlands (Aklan) This compose the estuarine systems of the Alcan River near Kalibo, and the extensive tidal lagoon and creek system of Batan Bay and Banga Bay to the southeast. Mangrove swamps constitute 80% of the area and there are extensive intertidal mudflats at the mouth of Alcan River in Batan Bay. The Palawan Basins Lake Manguao (Northern Palawan) This is a very deep freshwater lake set amongst low hills in Northern Palawan. The lake is fed by several rivers and local run-off, and retains water throughout the dry season. Ulugan Bay (Northern Palawan) A small sea bay between hilly headlands, with several small islands, offshore coral reefs, and extensive mangrove swamps along the southern and eastern shores. Seven rivers drain into the mangroves: Banaog, Kamanglet, Sia, Buruang, Egdasen, Baheli and Kayulo. The Northern Mindanao Basins 67
69 Lake Mainit (boundary between Surigao del Norte and Agusan del Norte) This is a large freshwater lake on a narrow plain between hill ranges near the northern tip of Mindanao. The lake is fed by fourteen small rivers and streams and one outlet, the Lalinawan River which flows south into Pagusi Lake and the Tubay River and eventually into Butuan Bay. Agusan Marsh (Northeastern Mindanao Island, Agusan del Sur) This is a vast complex of fresh water marshes and water courses with numerous small shallow lakes and ponds in the upper basin of the Agusan River and its tributaries. Some parts of the marsh have been converted into fishponds and rice paddies. The rivers arise from the hills of Eastern Mindanao and cause extensive flooding in the marshes from November to March. This drains in the northern portion via the Agusan River into the Butuan Bay. Sulu Archipelago-Southern Zamboanga Peninsula The Siocon, Quipit, Taguite and Tumaga Basins comprise the four major basins situated at the southern half of the Zamboanga Peninsula although independent watersheds also exist on the islands of Sulu Archipelago. The Siocon Watershed covers an area of 603 km 2, Quipit has 633 km 2, Taguite has 384 km 2 and Tumaga has 228 km 2 and drained by Vitali, Tumaga, Siocon and Quipit Rivers respectively. Basilan Island has two river basins namely, the Grubun Rver Basin and Gumalarang River Basin drained by Grubuan River and Gumalarang Rivers respectively. The region covers an aggregate area of 9,540 km 2 with a general hilly to mountainous topography, with the plains and hills along the coasts. The mean annual runoff depth of the region is approximately 1,802 mm or 9,668 mcm. Davao Gulf (Davao) Davao Gulf is located in the southeastern part of Mindanao bounded by Davao City and three provinces of Davao namely: Davao del Sur, Davao del Norte and Davao Oriental. The gulf is ringed by the high mountain range of Sarangani Province in the west and in the southwest direction by Mt. Apo. The total catchment area of the gulf is about 5,132 km 2 derived from the various watershed areas of the three Davao provinces. 33 major rivers and creeks drain into the gulf and among the bigger ones are: Tagum-Libuganon, Davao, Tuganay, Padda- Guihing and Lasang Rivers. Eastern Zamboanga Region (Zamboanga) 68
70 The Sibuguey-Ingin Basins are the major basins located at the eastern portion of Zamboanga, and covers Zamboanga del Sur and a portion of Zamboanga del Norte. This is the smallest basin area in the central portion of the region with a drainage area of 4,414 km 2. The topography is generally hilly to mountainous with few scattered plains dissected by rivers and creeks. The basin is drained by Sibuguey and Ingin Rivers. Annual runoff is approximately 1,833 mm or 8091 mcm. Lanao Region The Agus River Basins with six minor river basins and watersheds has a total drainage area of km 2. It is bounded by the Misamis Oriental Basin at the northeast, Pulangi River Basin at the southwest, Iligay Bay at the north and Iliana Bay and Mindanao Allah Basin at the south. The Agus Basin covers an area of 5,686 km 2 whose topography is generally flat to hilly. The basin includes Lake Lanao with a moderately sloping terrain by the presence of Mt. Iniaoan and Mt. Gurain at the western portion of the lake. It is a natural reservoir situated in the province of Lanao whose elevation is 703 m above sea level. It is fed by five major rivers and about 25 smaller ones. Its only outlet is Agus River that drains into Panguil and Iligan Bays. A series of hydropower stations are provided along the Agus River utilizing the abundant stream flow as well as steep slope. There is a difference of 673 m elevation from the mouth of Agus River at Lake Lanao to the Maria Cristina Falls, hence this difference contributes to the swift flow of water along the river. With this situation, the river itself became very ideal for the construction of seven major hydroelectric plants. South Cotabato River Basins This basin includes Pulangi River Basin on the northwest, Mindanao Allah River on the southwest, Davao Gulf on the northeast and Sulawesi Sea to the south. The topography is level to mountainous while plains are found north of the basin. The South Cotabato River Basins are drained by Padada, Mal, Buayan, Cinon and Siluay Rivers. Davao Oriental Basin (Davao) The Davao Oriental Basin is a narrow stretch on the eastern region of Minadanao composed of Surigao del Sur and Davao Oriental. The topography of the basin is mountainous while the central portion is relatively low. 69
71 The basin is composed of 17 sub-basins and watersheds with three major rivers namely: Boyaan, Carac-an and Tago. Tagum Libuganon Basins The Tagum Libuganon Basins are composed of four river systems namely: Hijo, Tagum, Matina and Sibulan. Table 2.8 shows the discharge of rivers within this basin. Table 2.8 Discharge of rivers within the Tagum Libuganon Basins (discharge in cm) Return period Hijo River Tagum River Matina River Sibulan River 5% years % % years % % years % % years % % years % % years % Scale parameter, ALPHA Characteristic drought, BETA Lower limit, GAMMA Source: National Water Resources Council, Framework Plan for the Tagum Libuganon Basins, December
72 Very little research and monitoring on the water quality of these rivers have been done. Documentation of water quality is generally done in relation to implementation of development projects. For instance, the water quality of the Cotabato River (Rio Grande de Mindanao) was determined in 1990 as part of the Environmental Impact I Assessment for the Mt. Apo Geothermal Power Plant by the Philippine National Oil Company (PNOC), while the water quality testing for Agus and Pulagui Rivers were conducted as part of the Environmental Impact Assessment for these rivers by the National Power Corporation (NAPOCOR). Generally, the water quality of these rivers meet Class C standards (best used for fishery, industry, and recreation such as boating; i.e., Davao Gulf and Carigara Bay data in Tables 2.9 and 2.10, respectively) but not for drinking purposes. Table 2.9 Summary of the water quality data from rivers associated with Davao Gulf Parameters Range Mean DENR Standards ph Range: for Class C Temperature ( o C) Dissolved Oxygen (mg/l) 3 deg. maximum rise for Class C (min.) for Class C Salinity (ppt) Turbidity (NTU) ,058 3, Suspended Solids (mg/l) , Not more than 30 mg/l increase Depth (m) Table 2.10 Summary of the water quality data from rivers associated with Carigara Bay Parameters Range DENR Standards ph for Class C Temperature ( o C) deg max. rise for Class C Dissolved Oxygen (mg/l) min for Class C Salinity (ppt) Alkalinity (meq/l) Biological Oxygen Demand (mg/l) (10) 71
73 THREATS Because of the various purposes that terrestrial environments serve, its accompanying riverine system is prone to numerous threats, most of which are anthropogenic in nature. Sedimentation Based on geologic records the Sulu-Sulawesi has a long history of sedimentation. Major sources of sediment during the geological times are Borneo, northern part of Sulawesi and the various islands of the Philippine Arc (Geology section of this report). The present day sedimentation is mainly due to massive forest denudation in the uplands. Suspended materials are carried by rivers into the nearshore waters. The distance traveled by sediments depend on size, as these are carried off by currents. The smaller sized ones can be transported several kilometers offshore while the coarser grains are deposited along the river and into the estuaries and the nearshore areas. Contamination from Domestic Wastes The rivers receive contamination from household wastes, which is similarly being experienced by coastal waters. Households located along the rivers utilize these bodies of water for household purposes such as washing clothes, bathing, and for sewage and domestic waste disposal. Coastal communities, in turn, dispose of their domestic wastes directly into the coastal waters. Majority of the household do not have sanitary toilets, evidenced by the presence of raw sewage in the waters. Thus, a large bulk of wastes obviously come from houses along the river banks. Agricultural effluents Fertilizers and pesticides come from nonpoint sources with the river serving as one of the transport route. Major development projects The construction of large dams for electricity generation or water and irrigation supply, change the salinity regime of the estuaries. The reduction in the volume of freshwater that flows in the estuaries result in the changes in the composition of the biological communities. Species that are tolerant of high salinity will thrive under such conditions replacing those that have low salinity tolerance. Examples of dam construction include Agus River Projects and Pulanga River serving as hydroelectric generators. 72
74 Estuarine and Associated Ecosystems ESTUARIES Estuaries are dynamic systems characterized by fluctuating salinity regime. The ecosystems in the estuaries are transitory due to salinity flux in this area which is mainly determined by the freshwater inflow from the uplands that mixes with seawater. The volume and seasonality of the freshwater inputs significantly influence the biological communities found within the estuaries. Water quality in some of the major rivers within the ecoregion can still be described as good except for some selected parameters. The mouth of the Rio Grande de Mindanao shows high total suspended solids ranging from 1,200 to 2,800 ppm. This is indicative of the high rate of erosion in the upper reaches of the river and along the banks of its tributaries. At the mouth of Iligan Bay, conductivity values range from 14,000 to 44,000 µmhos/cm and total solids range from 160 to 56,4000 mg/l (Table 2.11). Commercial activities occur in the estuaries. Many are utilized as transportation routes by the local residents as an alternative to land travel. Aquaculture activities are carried out in the mouth of rivers such as oyster and mussel farming due to the brackish character of the water that is suitable for raising these bivalves. Ecologically, juveniles of selected species of finfish and shellfish can be found with the planktonic communities. Table 2.11 Water quality analyses in Iligan Bay Parametrs Units DENR Standards Class SC 1M 2M 4M Turbidity NTU ph 6.5 to Temperature o C rise Salinity ppt Conductivity µmhos/cm 28, , , DO mg/ (min)l TSS mg/l Not more than 30mg/l increase TS mg/l - 27, , , Mg mg/l , , Ca mg/l NO3+ mg/l - ND ND ND Silica mg/l
75 Suspended solids mg/l Total hardness mg/l (Sampling Date: March 1989) Station Location 1M - Near beach resort at Timuga (depth m) 2M - Near MCCI wharf (depth = 3.0 m) 4M - Near NSC pier (depth = 6.5 m) Legend: the symbol (-) means no DENR standard has been set ASSOCIATED ECOSYSTEMS Marshlands and swamps serve many ecological functions. They provide habitats to many marine invertebrates; serve as resting, nesting and feeding places for migratory and resident marine birds; and provide a good source of food and livelihood for people residing along these marshlands. Major marshlands in the SSME are the Liguasan and Agusan Marshes and the delta of prominent bays and gulfs (e.g. Davao Gulf). Agusan Marsh spans almost 90,000 hectares of freshwater marshes and watercourses with a maximum depth of 4 m. Its upper basin, the Agusan River, has shallow lakes and ponds. Some portions of the marsh have been converted to rice paddies and fish ponds. Liguasan Marsh, which is the delta of Rio Grande de Mindanao, serves as feeding grounds for several species of marine birds and as stopovers for migratory birds. Wintering birds restock on freshwater and feed upon the fish and invertebrates found within. Liguasan Marsh also serves as a repository of organically rich topsoil coming from the nutrient rich watershed of Cotabato Province. THREATS The main sources of threats to the estuaries and marshlands are development projects such as the increasing urbanization of provinces. Construction of major highways, farm to market roads, energy and power projects, and commercial buildings are being planned and carried out in many rural areas as part of the government s program to spur economic development and also to decongest the urban centers. 74
76 Coastal and Marine Ecosystems Coastal and marine ecosystems harbor diverse species of marine fish and mammals providing coastal dwellers with a primary source of livelihood in fishing. In the Philippines and in the archipelagos of the SSME, these waters sustain the nations primary source of protein. As such, the significance of these ecosystems should not be undermined. Water quality characteristics of selected bays and gulfs in the ecoregion are presented in Tables The standards of maximum permissible levels of the water quality parameters in determining the classification of a coastal water body are defined by the regulatory agency, the Department of Environment and Natural Resources (DENR), through various department administrative orders. DENR standards for Class SC category have been applied to all the bays since Class SC is defined as bodies of water whose best usage are for the following: Recreational Water Class II (for boating, etc); Fishery Water Class II (Commercial and sustenance fishing); Marsh and/or mangrove areas declared as fish and wildlife sanctuaries. Table 2.12 Summary of the general water quality parameters in Davao Gulf Parameter Range DENR Standards for Class SC PH Range: for Temperature (ºC) degrees maximum rise DO (mg/l) (min) Salinity (ppt) No standard has been set/defined Turbidity (NTU) , No standard has been set/defined Suspended solids (mg/l) , Not more than 30 mg/l increase Depth (m) THREATS Contamination of the coastal waters come from point and nonpoint sources. Point sources are normally contributed by the rivers which carry pollutants from the upstream section. Industrial facilities located in the uplands which discharge their contaminated effluents into the rivers constitute the major sources of pollution. In addition, industries normally find the coastal areas ideal sites for their facilities since the coastal waters provide an unlimited source of coolants and at the same time serve as recipient of thermally heated cooling water. Mining companies either directly discharge their tailings into the coastal waters or use a nearby freshwater as recipient of their wastes. Heavy metal contamination and silt have been traced to mining companies such as Marcopper in Marinduque, and Atlas Mining in Toledo City. Farmlands contribute fertilizers and 75
77 pesticides into the rivers while contaminants from agricultural lands located along the coasts find their way into the nearshore areas through runoffs during heavy rains or periods of continuous rains. An example is the extensive banana plantation in Davao which in early 2000, resulted in fish kills along Davao Gulf. In the past decade, the fish and prawn ponds along the coasts in General Santos City and nearby Sarangani Province were also suspected of contributing to the fish kill in rivers. Table 2.13 Concentration of trace elements in the waters of Davao Gulf Concentration (ppm) Cadmium Copper Iron Lead Manganes e Mercury DENR Standard Class C Class SC Station 1. Sasa (wharf) BDC 2. Tibungko (coastal water) 3. Kaputian (coastal water) BDC BDC BDC BDC BDC BDC NOTE: BDC = Below detectable concentration Table 2.14 General water quality parameters in Carigara Bay (FSP, 1994) Parameter Range DENR Standards for Class SC ph Temperature (ºC) degrees maximum rise DO (mg/l) (min) Salinity (ppt) No standard has been set/defined Alkalinity (meq/l) No standard has been set/defined BOD (mg/l) No data 7(10) 76
78 Table 2.15 General water quality parameters in Panguil Bay (FSP, undated b) Parameter Range DENR Standards for Class SC ph Temperature (ºC) 3 degrees maximum rise DO (mg/l) (min) Among the most pressing threats to coastal and marine ecosystems are: Oil pollution There are three major sources of oil pollutants in the Philippines: refineries and oil depots; oil exploration and production; and oil tankers, barges, and cargo vessels. Three major companies are engaged in the refining and distribution of oil products in the Philippines namely: Caltex (Philippines) Inc., Pilipinas Shell Petroleum Corporation, and Petron. Each oil company has several depots located in various parts of the country. The refineries of the three companies are located in Batangas Bay and it is estimated that on the average 200 vessels enter the bay every month of which about 50 are oil tankers. The Shell refinery has the capacity to receive tankers of up to 320,000 dwt. Offshore oil exploration is ongoing for potential new sources of oil. These offshore activities are located northwest of Palawan. Tankers and barges carrying imported oil to the Philippines enter the different bays in the country. Potential sources of oil pollution include cases of grounding, collision and sinking where large quantities of oil may be dumped into the sea. Oily discharges of vessels also contribute to the oil in coastal waters. Since 1975, Naval Operations Center for Oil Pollution (NOCOP) has recorded oil spills of more than 400 liters in Philippine waters. Forty-seven of the total number represent spills between 50 and 5000 barrels (bbls) and only 6% from more than 6000 bbls. Seventy one percent of the total number of spills was caused by collision, sinking and grounding while 29% occurred during cargo handling operations. A recent spill from a tanker in April 2000 occurred in Bolinao, Lingayen Gulf spilling many barrels of oil into a shallow coral reef area. Other more common spills occur in Manila due to its busy transportation route of tanker and passenger ships. Within the SSME, passenger and cargo vessels use the Sulu-Sulawesi as a transportation route. Occasional major spills have occurred within the Sulu- Sulawesi Seas. 77
79 Although of a lesser magnitude, chronic oil contamination from bilge waters of motorized boats is evident in many coastal waters. By virtue of its habitual occurrence, these contaminations pose grave threats as they accumulate. Industrial Effluents Discharges coming from industrial facilities are the documented major contributors of water contamination either due to the volume of the discharge or the level of contaminants in the effluent. The contaminants range from inorganic nutrients to toxic heavy metals. One example is the electric power plants situated along the coasts. They discharge heated effluents in addition to the heavy metals which can cause fish kills, especially during the summer months. A case in point is the geothermal plant in Tiwi, Albay along Lagonoy Gulf. Heated geothermal effluents containing heavy metals have historically been discharged into Lagonoy Gulf which eventually deposited in the marine sediments. The finer silt particulates were carried further offshore and incorporated into the food chain. Concentrations of industrial facilities such as the fish canneries in General Santos City cause odor and effluent discharges in nearby coastal waters. High BOD (biochemical oxygen demand) due to insufficient wastewater treatment has caused contamination of nearly all adjacent waters of coastal communities. Agricultural runoff Large areas along the SSME are utilized for agricultural purposes. As such, fertilizers and pesticides constitute the principal contaminants from agricultural runoff. These cause eutrophication of nearshore areas and can trigger algal blooms when water movement is low. The fish kill in Davao in 1999, was attributed to pesticide runoff from an agricultural plantation. Some pesticides may persist for long periods of time and may ultimately be incorporated into the food chain. Solid Wastes Associated with the increase in population in the coastal municipalities, solid and domestic wastes have likewise increased. Majority of the households in coastal municipalities do not have adequate toilet facilities nor do they practice proper waste management. Both solid and raw human wastes are observed floating in water, with some ending up in beaches while some are found submerged within the substrate. The movement of wastes in the water depend on the prevailing wind velocity which drives the surface current. Death of some marine organisms are caused by floating plastics. Marine turtles, along with some fish and mammals, are victims where they either engulf the plastics or are asphyxiated by these non-biodegrable materials. 78
80 LEGISLATION In the hope of eradicating or at least minimizing these threats the Department of Environment and Natural Resources (DENR) issues regulations through various Department Administrative Orders (DAO). Relevant to the coastal and marine waters are DAO 34 and 35. DAO 34 Series of 1990 provides the criteria for coastal and marine waters determined by the present quality and usage. Coastal and marine waters are classified from Class SA to Class SD. Class SA, the most stringent, has uses for shellfish production for commercial volume, tourist zones and national marine and coral reef parks and reserves; and Class SD, the least stringent, are waters utilized for industrial supply. DAO 35 is the Revised Effluent Standards of 1990 and provides for the effluents generated by industries. New industries have to comply with more stringent rules than existing or operating facilities. It defines the limits and maximum permissible levels of many parameters that could potentially contaminate coastal waters through the operations of industrial facilities. The Pollution Control Decree of 1976 (Presidential Decree No. 984) has been revised under the title Revised Industrial and Commercial Wastewater Permitting Rules and Regulations of 1999 amending the Permit Regulations of It requires industrial facilities to secure the wastewater discharge permit and the payment of corresponding fees associated with effluent discharge volume. Effects on Primary Production Collectively, the state of freshwater and marine ecosystems will dictate the productivity of the SSME. Primary production in the ecoregion largely depends on the supply of nutrients and on the availability of photosynthetically active radiation (PAR) as temperature is not a very crucial factor in low latitudes. Observations from the expeditions presented in Wyrtki (1961) show that the Sulawesi basin has a mean of about 0.37 g carbon per square meter per day (gcm -2 day -1 ), slightly lower than that for the Sulu Sea at 0.43 gcm -2 day -1. These observations were shown to correlate well with the abundance of nutrients in the region. More recent values obtained by San Diego- McGlone et al. (1999a and b), yielded values of 0.53gCm -2 day -1 for the Sulu Sea and 0.40gCm -2 day -1 for the South China Sea. The authors attribute the higher productivity in the Sulu Sea to the nutrients upwelled by shoaling internal waves generated along the channel off the southern coast of Mindoro, a phenomenon investigated by Liu et al. (1985). 79
81 The different biological communities generate a wide range of primary production as follows (values converted from estimates made by Whittaker, 1975): Coral reefs : 4.93 to 12 gcm -2 day -1 Estuaries : 0.55 to 11 gcm -2 day -1 Continental shelf waters : 0.27 to 1.64 gcm -2 day -1 Comparing the above worldwide values of continental shelf waters with those obtained from both Sulu and Sulawesi Seas, the primary production in the SSME fall in the lower range. 80
82 Chapter III The Watersheds and their Linkages to the Ecoregion Daniel A. Lagunzad THE WATERSHED DEFINED A watershed is a discrete geographical area of land from which rainwater can drain as surface runoff, via a specific stream or river system to a common outlet point which may be a dam, irrigation system or municipal/urban water supply off take point, or where the stream/river discharges into a larger river lake or sea (FMB-DENR). Watersheds consist of intricately interacting biotic and abiotic components and oftentimes link several ecosystems. Varying in size and coverage, watersheds often extend over boundaries of one or more political administrative units. The Sulu-Sulawesi Marine Ecoregion has adopted the watershed approach. Its interest stems from the recognition that river systems and their tributaries empty into the coastal waters and serve as the primary agents in transporting pollutants. This results in the degradation of the marine environment, changing the quality of nearshore waters and impacting the organisms living within. Inputs from the major rivers affect the salinity gradient in nearshore areas. Thus, during periods of floods excessive soil erosion occurs and high sediment and silt load are brought down. The quality of coastal waters vary in accordance with the changes in the upper reaches of the streams and the watershed, and in turn, the organisms in the nearshore areas respond to these changes. From the watersheds come our main source of water (for drinking, for domestic use, and for industrial and agricultural purposes) disregarding direct utilization of rainwater which is done in smaller islands as in Cagayancillo. Major rivers have been tapped for electrical power generation. LOCATION, OCCURRENCE AND DISTRIBUTION The SSME is characterized by the presence of land masses surrounded by large bodies of water. The reciprocal influences between these two major components (the terrestrial and aquatic environments) generate profound impacts on each other. In an attempt to produce a conservation management plan and development program for the ecoregion, it is essential to incorporate an inventory and assessment of the watersheds associated with the site. Any management plan is decidedly dependent on a thorough evaluation of the available biophysical and socio-economic information.
83 The watershed reserves having major impacts on the ecoregion are shown in Figure 3.1. These islands include the following: Watersheds of large islands facing the marine waters around Sulu Sea o Luzon Southern Batangas Southern Lucena Western Bicol o Visayas Western Samar Western Leyte o Mindanao Surigao Zamboanga Cotabato Davao Basilan Sulu Archipelago Islands within the confines of Sulu Sea (whole islands as watersheds) o Mindoro o Marinduque o Burias Island o Romblon Group of Islands (Tablas, Romblon, Sibuyan) o Masbate o Negros o Panay Island o Cebu o Bohol o Siquijor Of the 30 million hectares of the Philippine total land area, about 44 % or million hectares is timberland and forest reserves (Baconguis et al., 1990). However, only about 6.5 million hectares of these are intact. An estimate of less than a million hectares is classified as primary or virgin forests. Practically 70% of the country is located within watersheds. Jurisdiction over Philippine watersheds falls primarily under the DENR. Substantial portions are under disposition of NIA (National Irrigation Authority), NAPOCOR and PNOC. As of 1997, the Philippines has 121 watershed forest reserves, distributed among 15 regions and covering an expanse of 1.38 million ha (Baconguis et al., 1990). It is from these that headwaters of rivers feed the dams, and irrigation systems originate. From the biodiversity perspective, 10 of the 15 Biogeographic Zones of the Philippines (Figure 3.2) namely: Southern Luzon, Mindoro, Western Visayas, Calamian, Palawan, Sulu, Zamboanga, and Mindanao, are represented in the SSME. 82
84 Figure 3.1 Watersheds within the Philippine portion of the SSME 83
85 Figure 3.2 Biogeographic zones of the Philippines (DENR, 1997) 84
86 Biodiversity-rich centers are distributed throughout these biogeographic zones. Oftentimes, these sites are, themselves, part of the Watershed Forest Reserve (WFR) system. The Forest Development Center s latest estimate for the number of WFRs and corresponding hectarage on a per region basis indicates that Regions 3, 6 and ARMM have the highest total hectarage of watershed forests reserves. In terms of forest cover however, Regions 3, 4 and 13 registered the highest values. Sixty-one (61) of the proclaimed 124 WFR are within SSME. This corresponds to 49.2% of the total number with an aggregate area of 784,061.6 ha (or 56.7% of the total WFR area). It is thus clear that a major proportion of the watershed forest reserve system of the country (number and hectarage) may have to be characterized in order to achieve a more ecologically sound conservation strategy of the SSME THREATS TO WATERSHED AREAS Watersheds are important life support systems. They play a very vital role in sustaining a nation. It is thus, of utmost importance to maintain the integrity of the watersheds. However, the degradation of our watershed reserves poses an alarming threat. The most important cause of watershed and mangrove forest reduction is the intensive conversion of the secondary and perhaps primary growth forests to urbanization and industrialization, coupled with agriculture and aquaculture. Urbanization and Industrialization Baconguis et al. (1990) recognized at least 4 regional industrial growth centers namely: Davao City, General Santos City, Zamboanga City, and Tacloban. In all of these centers, the associated watersheds have been defined. The activities in these growth centers are expected to impact the watershed and may affect freshwater and coastal ecosystems. These are the areas which would predictably cause major changes in the landscape and may contribute to the pollution and siltation of the adjacent coastal areas. In terms of the proposed/planned infrastructure development nationwide, Eastern Visayas has the largest (34,579 ha) followed by Northern and Southern Luzon. Central Visayas ranks third with an estimated 4,768 ha to be subjected to development. Based on NEDA (National Economic Development Authority) data high-level threat from planned infrastructure development is absent in Palawan and Liguasan. Six hundred seventy-six (676) ha of Sulu is expected to be under high level of threat. Both mainland Mindanao and Zamboanga are predicted to have a large hectarage to be subjected to high-level threat due to potential infrastructure development (3,070 and 2,247 ha respectively). It would, thus, be prudent to direct conservation efforts of the SSME in areas were there are likely more negative impacts on the environment. Cebu Port, an industrial island, contributes to the pollution of the Bays of Cebu. Likewise, the mine tailings from the Atlas Consolidated Mining and Development 85
87 Corporation may have negative impacts on the aquatic habitats. The latter has been reported to cause some contamination in the Pinangunahan mangrove and fishponds. The construction of additional spillways in Lake Lanao for the hydroelectric power station involves more dredging of riverbanks and destruction of riparian habitats. Several towns and many villages, which contribute to the changes in the water quality, also surround the lake. Davao Gulf is very well known to have achieved an economic status that is driven by industrialization and urbanization. Mining with their attendant processing, as well as quarrying have also contributed to the decline in water quality of the Davao Gulf. Increased production in agricultural areas is often associated with increased inputs such as pesticides, herbicides, fertilizers, and petroproducts. These substances eventually reach the marine ecosystems. Agriculture and aquaculture The extensive mangrove swamps provide excellent protection to molluscs, crustaceans and fishes of economic importance. They are also important breeding places of migratory aquatic organisms. Watersheds, on the other hand, are very important in averting erosion and siltation in streams and rivers. Destruction of watersheds result in erosion of the topsoil because of the absence of water-absorbing root systems. The proposed irrigation schemes to service additional hectares of agricultural land in the water catchment area of most watersheds are likely to have an impact downstream. Erosion from agricultural and aquacultural areas carries inorganic substances from fertilizer, pesticides and feeds that cause eutrophication and siltation of bodies of water, endangering the life of organisms thriving within. Such is illustrated by the infrastructure development in Bais City watershed, which was converted into sugar lands. The original watershed occupied an area of approximately 13,500 ha. The present watershed protected area is reported to be a much reduced area of 1,129 ha. In other areas such as in Catubig River estuary, the main source of livelihood of the inhabitants is based on forest products as well as agriculture. Logging licenses have been issued and these may be translated into increased run-off. Unless mitigating measures are made immediately, sediment load in water bodies is expected to increase. The indiscriminate cutting of most mangrove forests for aquaculture and plantations in Cogtong Bay, Inabangan Coast, Ulugan Bay, Davao Gulf and other areas have contributed to the pollution (agrochemicals) of the rivers and bays. This may eventually find its way to the marine ecosystems. Land use that pose threats to biodiversity include infrastructure development, both existing and proposed, such as the major industries, road networks, irrigation systems, water resources, power and energy projects, ports and harbors, and others. Infrastructure affects biodiversity both directly and indirectly. Direct effects are when their operations may disturb, pollute or encroach upon biodiversity rich ecosystems. Indirectly they may 86
88 attract satellite development of settlements that can cause habitat fragmentation. Roads provide easy access to rich ecosystems like old growth forests. Industries threaten the quality of surrounding water bodies that support a variety of aquatic resources including endemic species of plants and animals. In several instances, industrial wastewater treatment plants and air pollution control devices are absent or minimal. Altogether these pose as threats to the integrity of the watershed. Legislation and Resource Management A more quantitative assessment may be done to predict the possible trends in watershed development. Scenarios have to be projected given existing status as well as conservation measures. The watershed viewed as both a physical and a social unit, then, becomes an effective building block in planning. LEGISLATION Jurisdiction over Philippine watersheds falls primarily under the DENR and local government units. Watershed areas that serve as sources for irrigation have been placed under the jurisdiction of the NIA, while areas tapped for electricity generation such as hydropower and geothermal projects are placed under the NAPOCOR and PNOC. In addition to the existing 121 watershed forest reserves covering a total of 1,381,453 ha (Baconguis et al., 1990), proclamations in added over 1,000 hectares more. Furthermore, the distribution of the Philippines into Biogeographic Zones has stepped up biodiversity awareness. As previously mentioned, 10 of the 15 zones are included within the SSME. RESOURCE MANAGEMENT The National Parks System of the Philippines are mostly found in watersheds. Appendix 1a lists all the National Parks. Data on the biogeographic zone, region, location, establishment of the area, areal coverage, special features and examples of flora and fauna are included. Appendix 1b enumerates the projected areas delcared through various administrative orders and Memorandum orders. Appendix 1c is a listing of all the Islands within SSME proclaimed as tourist zone and marine reserves under Proclamation No.1810.S
89 Chapter IV Coastal and Marine Ecosystems and their Associated Species I. THE MANGROVE ECOSYSTEM Prescillano M. Zamora The mangrove ecosystem is very productive. Its ecological and economic value has long been recognized. However, it is also one of the most critical at risk ecosystems due to its continued intensive exploitation and conversion for various purposes. Coverage, Occurrence and Distribution Mangroves cover an estimated area of 180,000 km 2 around the world, 75,172 km 2 in Southeast Asia and less than 1,205 km 2 in the Philippines (EMB, 1996). In the Sulu Sulawesi Marine Ecoregion the mangal (as an ecological or habitat diversity type) occurs in protected coves and quiet embayments (a) along the coastal areas of islands facing the marine waters around Sulu Sea, i.e., Batangas, Lucena and Bicol in Luzon; Samar and Leyte in the Visayas; Surigao, Zamboanga, Cotabato, Davao Gulf, Basilan Island, Sulu Archipelago, Tawi-Tawi Island, Turtle Islands and Sibutu Island in Mindanao and the Palawan mainland; and (b) protected coastal areas of large and small islands within the Sulu Sea such as Mindoro, Marinduque, Burias, Romblon Group of Islands, Masbate, Panay, Negros, Cebu, Bohol, and Siquijor. There are no recent inventories to determine the actual areal extent of the mangroves of the Philippines. What is available is the last nationwide inventory of the mangrove forest of the Philippines which was done 11 years ago for the DENR by the Remote Sensing Division of the Swedish Space Corporation. Thus, the areal extent of the mangroves in the ecoregion can only be indicated in rather rough, raw and general terms (Table 4.1). The estimated areas of existing mangrove forests in the Philippines is presented in Figures 4.1 and 4.2. Species diversity The mangrove hosts a diverse assemblage of organisms, from the vascular plants which form the foundation of the ecosystem, to the animals and lower plants that thrive within. 88
90 Figure 4.1 Distribution of mangrove areas in the Philippines 89
91 90
92 Figure 4.2 Estimated area (has) of existing mangrove forests in the Philippines and their uses 91
93 Table 4.1 Estimated mangrove areas in the Philippines Coastal areas facing the Sulu Sea Estimated Area (km 2 ) Remarks Batangas (southern side) - All Lucena (southern side) - All Bicol (western side) - All Samar (western side) 226 Part Leyte (western side) 37 Part Surigao, Zamboanga, Cotabato, Davao Gulf - Part Basilan Island 62 All Bongao Island - All Sulu Archipelago - All Palawan (main island, eastern side) - All Palawan (islands north of main island) - All Palawan (islands north of main island) - All Islands Within Sulu Sea Mindoro Island 27 All Marinduque 31 All Burias Island - All Romblon Group of Islands 7 All Masbate 17 All Cebu 4 All Negros Island 10 All Bohol Island 85 All Siquijor - All VASCULAR PLANTS Thirty five taxa (Table 4.2) of mangrove vascular plants have been reported within Sulu Sea, consisting of 33 species, 1 variety (Avicennia marina var. rumphianna) and 1 hybrid (Rhizopora x lamarckii) making the Philippines and SSME one of the richest in terms of vascular plant diversity along with Japan, Ryukyus Islands, Sulawesi and the Northern Territories of Australia. Among these, Kandelia candel was recently (1998) collected and the voucher specimen is housed in the Herbarium of the Institute of Biology, College of Science, University of the Philippines at Diliman Quezon City. 92
94 Table 4.2 Major (1-23) and minor (24-35) mangrove vascular plants reported to occur in the Philippines Botanical Name Local Name Family Name Habit 1. Avicennia alba Bungalon-puti Verbenaceae s-t 2. Avicennia eucalyptifolia Bungalon-sahing Verbenaceae s-t 3. Avicennia lanata Piapi Verbenaceae s-t 4. Avicennia marina Piapi Verbenaceae s-t 5. Avicennia marina var rumphiana Piapi Verbenaceae s-t 6. Avicennia officinalis Api-api Verbenaceae m-t 7. Bruguiera cylindrica Pototan-lalake Rhizophoraceae m-t 8. Bruguiera gymnorrhiza Busain Rhizophoraceae m-t 9. Bruguiera parviflora Langarai Rhizophoraceae m-t 10. Buguiera sexangula Pototan Rhizophoraceae m-t 11. Ceriops decandra Malatangal Rhizophoraceae s-t 12. Ceriops tagal Tangal Rhizophoraceae s-t 13. Kandelia candel - Rhizophoraceae s-t 14. Lumnitzera littorea Sagasa Combretaceae s-t 15. Lumnitzera racemosa Kulasi Combretaceae s-t 16. Nypa fruticans Nipa Arecaceae Palm 17. Rhizophora apiculata Bakauan-lalake Rhizophoraceae m-t 18. Rhizophora mucronata Bakauan-babae Rhizophoraceae m-t 19. Rhizophora stylosa Bakauan tigkihon Rhizophoraceae m-t 20. Rhizophora x lamarckii Bakauan (hybrid) Rhizophoraceae m-t 21. Sonneratia alba Pedada Sonneratiaceae l-t 22. Sonneratia caseolaris Pagatpat Sonneratiaceae m-t 23. Sonneratia ovata Pagatpat baye Sonneratiaceae m-t 24. Acrostichum aureum Lagolo Pteridaceae Fern 25. Acrostichum speciosum Lagolo Pteridaceae Fern 26. Aegiceras corniculatum Saging-saging Myrsinaceae s-t 27. Aegiceras floridum Tinduk-tindukan Myrsinaceae s-t 28. Camptostemon philippinense Gapas-gapas Bombacaceae s-t 29. Excoecaria agallocha Buta-buta Euphorbiaceae s-t 30. Heritiera littoralis Dungon-late Sterculiaceae m-t 31. Osbornia octodonta Taualis Myrtaceae s-t 32. Pemphis acidula Bantigi Lythraceae s-t 33. Scyphiphora hydrophyllacea Nilad Rubiaceae s-t 34. Xylocarus granatum Tabigi Meliaceae m-t 35. Xylocarpus moluccensis Piagau Meliaceae s-t Definition of elements by size: s-t = shrub to small tree or one story tree with a diameter of 3-30 centimeters and a height of 2-5 meters; m-t = medium-sized tree or two story tree with a diameter of centimeters and a height of 5-15 meters; and l-t = large tree or three story tree with a diameter of over 40 centimeters and a height of over 15 meters. 93
95 NON-VASCULAR PLANT ASSOCIATES Banaag (1972) recorded the occurrence of thallophytes associated with the arborescent forms in the mangal of Likot cove and Mahabang Parang Cove in Muelle Bay, Puerto Galera, Oriental Mindoro (Table 4.3). Later, Fortes (1975), CDS (1979) and Fortes and Trono (1979) added nine species of blue-green, five species of green, and 10 species of red algae found in the mangrove areas of Puerto Galera, Oriental Mindoro; Palsabangon in Pagbilao, Quezon; Ulugan Bay in Palawan and Babatngon, Leyte (Table 4.4). Table 4.3 Mangrove-associated thallophytes in Likot and Mahabang Parang Coves, Puerto Galera, Oriental Mindoro (Banaag, 1972) Species Plant Group Habitat Scytonema myochrous 1 Trunks, branches, stilt toots of bakauan and tangal Oscillatoria tenuis 1 Muddy pools in exposed areas Lyngbya sordida 1 Stilt roots of bakauan Cladophora sp. 2 Trunks of trees Dichotomosiphon tuberosus 2 Pneumatophores of api-api Rhizoclonium crassipellitum 2 Trunks of api-api Rhizoclonium hookeri 2 Trunks of api-api Lophosiphonia sp. 3 Stilt roots of bakauan Myriogramme sp. 3 Stilt roots of bakauan Bostrychia sp. 3 Stilt roots of bakauan Herposiphonia secunda 3 Trunks of bakauan Ascodesmis sp. 4 Decaying trunks and branches Polyporus hirsutus 5 Decaying trunks and branches Polyporus sanguineus 5 Decaying trunks and branches Daedalia ambigua 5 Decaying trunks and branches Trametes aspera 5 Decaying trunks and branches Hydnum sp. 5 Decaying trunks and branches Hexagona sp. 5 Decaying trunks and branches Fomes ribis 5 Decaying trunks and branches Merasius sp. 5 Muddy substratum Schizophyllum commune 5 Decaying branches Collybia platyphylla 5 Clayish substratun Pleurotus ostreatus 5 Clayish substratum Hypocrea sp. 6 Trunk of api-api Pyxine sp. 6 Trunk of api-api Ohrolechia pallescens 6 Trunk of Bakauan Plant groups: 1 = blue green algae; 2 = green algae; 3 = red algae; 4 = ascomycete fungus; 5 = basidiomycete fungi; 6 = lichen. 94
96 Table 4.4 Mangrove-associated algal microphytes in Muelle Bay and Paniquian (Puerto Galera, Oriental Mindoro), Palsabangon (Pagbilao, Quezon), Ulugan Bay (Palawan), and Babatngon (Leyte). (Fortes, 1975; Cordero, 1978; Fortes and Trono, 1979) Species Plant Group Habitat Oscillatoria curviceps 1 Pneumatophores of api-api Oscillatoria nigto-viridis 1 Pneumatophores of api-api Oscillatoria sancta 1 Stilt roots of bakauan Lyngbya lutea 1 Pneumatophores of api-api Lyngbya mesotricha 1 Pneumatophores of api-api Microcoleus acutissimus 1 Pneumatophores of api-api Calothrix aeruginea 1 Pneumatophores of api-api Calothrix scopulorum 1 Stilt roots of bakauan Rivularia nitida 1 Stilt roots of bakauan Enteromorpha chaetomorphoides 2 Roots of tinduk-tindukan Cladophora liebetruthii 2 Stilt roots of bakauan Rhizoclonium granda 2 Pneumatophores of api-api Boodleopsis pusilla 2 Pneumatophores of api-api Boodleopsis verticillata 2 Pneumatophores of api-api Gelidiella adnata 3 Stilt roots of bakauan Catenella opuntia 3 Pneumatophores of api-api Ceramium leutzelburgii 3 Pneumatophores of api-api Ceramium zacae 3 Pneumatophores of pedada Caloglossa adnata 3 Pneumatophores of api-api Caloglossa leprieurii 3 Stilt roots of bakauan Caloglossa ogasawaraensis 3 Pneumatophores of api-api Bostrychia radicans 3 Pneumatophores of api-api Laurencia surculigera 3 Pneumatophores of api-api Murrayella periclados 3 Pneumatophores of api-api 95
97 FAUNAL ASSEMBLAGE Alcala (unpub.) listed the following animals associated with mangroves: the frog Rana cancrivora; two Gecknoid lizards, Gehyra mutilata and Lepidodactylus lugubris; the Scincid lizard, Emoia atrocostata; the varanid lizard, Varanus salvator; the acrochordid snake, Acrochordus granulatus; two colubrid snakes, Boiga dendrophila and Hurria runchops; the primate Macaca fascicularis; the Palawan flying fox, Acerodon leucotis; and the golden crowned flying fox, Acerodon jubatus Additionally, the swamps harbor 54 species of crustaceans, 63 species of shellfishes (molluscs), 110 species of finfishes, and 10 species of birds (Dickinson et al., 1991; Appendix 2a-b). Importance PRODUCTIVITY AND ECONOMIC IMPORTANCE Mangroves have been utilized by coastal communities in a variety of ways: As a source of forest products Poles for house construction; firewood (fuel) for cooking; charcoal as domestic energy source and source of income; tanbark for coloring tuba (fermented nipa juice); nipa sap for tuba, vinegar, alcohol and sugar; nipa shingles (roofs and walling) for domestic use and source of income. As a source of fishery products Adult finfishes, shellfishes, shrimps and mangrove crabs found within are harvested for domestic consumption and source of income. The juveniles are caught for food and for stocking fishponds in grow out ponds. Healthy mangrove forests produce an average of 1.08 t of fish per hectare per year. As site for human activities Residential, commercial and industrial developments are expanding to mangrove areas, hence, domestic and industrial wastes are reported to be disposed of in the area as well. Areas which have been cleared of mangroves are converted to housing units, fishponds, and commercial and industrial establishments. Table 4.5 is a summary of the average valuation of the mangrove ecosystem from around the world. Given the differenct levels of management, Table 4.6 gives the estimated annual net economic value (US$) of Philippine mangroves. 96
98 Table 4.5 Average mangrove ecosystem valuation worldwide (adopted from White and Cruz-Trinidad, 1998) Benefits of ecosystem services Value (US$ ha year) Disturbance regulation *1839 Waste treatment *6696 Habitat /refugia 169 Food production 466 Raw materials 162 Recreation 658 Total benefits 3,294 *White and Cruz-Trinidad notes that disturbance regulation, waste treatment and recreation are generally not economically quantified in the Philippine context because they are indirect services which are difficult to quantify. Table 4.6 Estimated annual net economic value (US$) of Philippine mangroves based on different management levels (White and de Leon, 1996; de Leon and White, 1997) Level of Management Wood products Fish products Total (US$/hectare) (US$/hectare) (US$/hectare) Mangrove plantation Managed, naturally vegetated Unmanaged, unstocked ECOLOGICAL SIGNIFICANCE Many species are associated with mangrove areas indicating their usefulness in serving as habitat for wildlife. Detritus and nutrients from mangrove areas support the nearshore fishery in the coastal waters. These are exported to form the food base of a host of marine organisms such as finfishes, shellfishes and crustaceans (Reyes, 1983; Zamora, 1987b,1990c). Coastal areas which serve as feeding, spawning and nursery grounds are also enriched by the nutrients derived from the decomposition of mangal detritus (Motoh and Solis, 1978; NATMANCOM, 1982; Pinto, 1987). Coastal areas which are exposed to storm surges and high winds associated with tropical typhoons are protected by mangroves. Places where mangroves have been completely removed suffered the effects of storm surges and now require concrete walls to protect them. In estuaries and deltas, mangroves serve to reduce the effect of floods and erosion of river and narrow coastlines. 97
99 Threats Because of the multifarious benefits derived from mangrove areas, they are subject to intense stresses, most of which are human-induced. ANTHROPOGENIC SOURCES Figure 4.3 shows the decline of mangroves from 1918 at 450,000 hectares to 289,000 hectares in If the current rate of exploitation is maintained, it is projected that by year 2030, only a little more than 18,000 hectares will be left in the entire Philippines. Habitat loss or destruction of mangroves has been attributed to such human-induced threats as conversion to residential areas, farmlands, commercial and industrial establishments and fishponds. The conversion of large areas of mangrove to brackishwater fishpond (fishpondification) for the cultivation of economically important marine organisms such as milkfish (Chanos chanos) and prawn (Penaeus monodon) is one of the major causes of the disappearance of mangrove areas (Zamora, 1989a; Zamora, 1995). In fishpondification, the disturbance of the mangal is maximal in that all standing biomass is completely remove, the soil profile is seriously disturbed resulting in the loss of diverse organisms living within. This conversion has involved to date: 289,000 hectares (White and de Leon, 1996; de Leon and White, 1997) out of a total of 450,000 hectares in 1918 (Brown and Fischer, 1920). Mangrove Area (ha) 500, , , , , ,000 ha in ,000 ha in 1970 If the reduction of mangroves continue at the pre-70 s rate, there will only be 18,170 ha left in the year ,000 ha in ,000 ha in Year Mangrove cover was reduced at a rate of 3,115 ha per year between 1918 and 1970 Figure 4.3 Mangrove resource decline in the Philippines 98
100 Overexploitation of mangroves is another problem that has persisted over the decades. Felling of trees for fuel, charcoal-making and construction materials is probably the second most pervasive intrusion on the mangal. The demand for the various products leads to over harvesting of large areas. The complete destruction of even young plants has decimated many areas resulting not only in the loss of biodiversity but a complete conversion of the ecosystem. NATURAL SOURCES Infestation of mangrove plants, especially newly planted individuals by barnacles, borers and tussock moths pose another threat to the mangroves. Heavy infestation of these pests can lead to the death of the mangrove. Resource Management LEGISLATIONS The Philippine government has long recognized the necessity of passing laws to regulate the excessive destruction and utilization of mangroves. The policies, rules and regulations governing mangrove forest development in the country are embodied in various acts, administrative orders, letters of instruction, memoranda, presidential decrees, presidential proclamations and special orders. DENR Administrative Order (DAO) No.15 Series of 1990 (dated February 1,1990) aims to: o o o o conserve, protect, rehabilitate and develop the remaining mangrove resources; give preference to organizations, associations or cooperatives over individual users in the utilization of the mangrove resources; stop the wanton exploitation of the mangroves; and enhance the replenishment of denuded mangrove areas through natural or artificial means - Section 4 of DAO No.15 prohibits the conversion of mangrove areas into fishponds. Fishponds that have been abandoned for over 5 years shall revert to the category of forest lands. - Section 6 stipulates provisions for the Certificate of Stewardship contract which is granted only for sustainable activities in mangrove areas. By Presidential Proclamations 2151 and 2152, 74,628 hectares were set aside as mangrove forest reserves and 4,327 hectares were set aside as wilderness areas, respectively. 99
101 DENR Special Order 309 (December 13,1976) Creation of the National Mangrove Committee DENR Special Order 728 (1987) Reconstitution of the National Mangrove Committee. Under the Mangrove Management plan, the following activities are prohibited: o conversion of thickly vegetated mangrove areas into fishponds; o fishpondification within the mangrove forest reserves and mangrove wilderness areas; o conversion of mangroves into fishponds (also saltworks, paddy cultivation) under the Certificate of Stewardship contract; o deposition for fishpondification of estuarine mangrove which are predominantly, if not totally vegetated with shrubs. REFORESTATION EFFORTS Reforestation and plantation establishment in degraded mangrove areas have been started in Bohol (1968), Sulu (1981), Cebu (1984) and Basilan (1985). Recent efforts on mangrove replanting in the Visayas include that of Baldevarona (Institute of Aquaculture, College of Fisheries, University of the Philippines in the Visayas, Iloilo, ) in Taklong Island, Guimaras, Iloilo. Private individuals, coastal communities and the government are involved in the establishment and management of these plantations. Plantations managed by an individual or a family average about 500 to 2,000 square meters. When managed by a community, the average size of the plantation may be between hectares. Government programs include (1) The Mangrove Program (FMB in Region 7) and (2) the Central Visayas Regional Project Office, a World Bank Assisted Project (CVRPO). In some of the sites in Negros Oriental and Bohol, these plantations were first established on a small scale (backyard) by an individual or a coastal community with the original objective of protecting infrastructures (houses, roads) against the impact of strong winds and waves during inclement weather conditions but later expanded for wood production (fuelwood or firewood) and construction materials like poles. The current RP policies on mangrove rehabilitation and management are summarized by Melana et al. (2000) in the Mangrove Management Handbook. 100
102 II. THE SEAWEED AND SEAGRASS ECOSYSTEMS Gavino C. Trono, Jr. Occurrence, Distribution and Data Gaps During the last three decades, research efforts to document the basic studies on seaweeds and seagrasses had been constrained by the limited funds and expertise on the subject. Funding was focused on the potential economic uses of these marine plants. Thus, there is limited information on the distribution and cover of the various species. Documentation is mostly based on a one time spot collection. Because of the interest to inventory known seaweed-producing areas that sell seaweeds in local markets or exported them for chemical extracts, collection sites in Mindanao were limited to farming areas and project field sites in Sulu, Tawi-Tawi, Misamis, Zamboanga and Davao. Some recent collections came from Lopez-Jaena, Misamis Occidental. Seagrass and seaweed information on the inland seas were obtained from the Resource and Ecological Assessment of the Priority Bays under the Fisheries Sector Program (FSP) from 1991 to Their distributions are shown in Figures 4.4 and 4.5, respectively. SEAWEED DISTRIBUTION Of the more than 800 species of marine benthic algae reported in the Philippines, only 353 species have been recorded in the SSME. These consist of the three species of Cyanophyta (blue-green algae), 114 Chlorophyta, (green) 65 Phaeophyta (brown) and 174 Rhodophyta (Red). Many of these species are common in the collecting sites in the Philippines. The low number of species reflects a lack of information and detailed studies on algae in the SSME. Of the sites sampled, Leyte has 148 species; Batangas 141 species; Palawan 129 species, Sorsogon, 124 species and Panay Island 100 species. Based on the data, these sites can be described as relatively diverse in terms of flora. Even with such incomplete information, the SSME is still richer than other areas in the world. Most rocky intertidal areas in temperate countries harbor less than a hundred species due to the adverse conditions affecting the region. In the Mediterranean, there are roughly 210 species of seaweeds growing along its northern, southern and eastern coasts (Lipkin and Friedlander, 1998). These flora are relatively less diverse compared to those found within the territorial waters of the Philippines. 101
103 Figure 4.4 Geographic distribution of seaweeds 102
104 Figure 4.5 Geographic distribution of seagrasses 103
105 SEAGRASS DISTRIBUTION In the Philippines, a total of 14 species of seagrass, 7 of which come from Family Hydrocharitaceae, 6 from Cymodoceae and one still unclassified, have been reported. These are distributed as follows: 11 species are found in Mindoro and Negros, 10 in Batangas, and 9 in Cebu. Davao, Marinduque, Siquijor, Tubbataha Reef and Zamboanga are each represented by 8 species. When compared with other areas in the world, Japan for instance has reportedly only 6 species at most in a single area, showing that the Philippines still has a more diverse seagrass species composition. Importance Seaweeds and seagrasses comprise two major groups of primary producers in the shallow coastal waters. They form large and dominant communities, providing the sources of organic matter and energy which support other marine ecosystems. Seagrass beds and areas with diverse seaweed species serve as nursery, feeding grounds and habitat for many associated groups of animals such as mollusks, crustaceans, echinoderms, fishes, reptiles, birds and mammals, many of which are of economic importance while some are endangered species such as dugongs and turtles. In addition to its contribution to the food chain, seagrass beds stabilize the substrata, thus controlling erosion of the reef flats. In the Philippines, the major seaweed export at the moment is Eucheuma and Kappaphycus as sources of carrageenan. The agarophytes Gracilaria and Gelidiella acerosa are also being harvested for agar manufacture. Caulerpa lentillifera is also exported to Japan for seaweed salad. Nevertheless, the development of the industry is constrained by losses due to diseases and low quality of extracted natural products. Sargassum is a major source of alginate and phenolic compounds but its industrial potential has not been maximized. Many seaweeds contain compounds with medicinal properties aside from being a major source of iodine. Caulerpa possess anaesthetic chemicals while Sargassum, Enteromorpha, Caulerpa, Turbinaria, Hypnea and a host of other species contain antimicrobial compounds. Seaweeds also serve as fodder for many animals. Among the potential species presently being looked into is Halymenia durvillaei as an export item to Japan. Japan is currently importing tons of red seaweeds from Africa and some parts of Southeast Asia to support the growing demand for these food species. Farming of Caulerpa is being done here in the Philippines but production is short of the demand for export. 104
106 Threats and Resource Management Issues One of the major threats to the seagrass and seaweed communities is the uncontrolled development along the coastal areas. The proliferation of industries and other commercial activities change the quality of water and bring pollutants and sediments to the shallow marine areas. Pollutants brought by the rivers from the uplands such as mine tailings, large sediments from eroded farmlands and watersheds, effluents from industries located in the coastal waters and thermal discharges from industrial facilities utilizing the coastal waters for their cooling systems. Another problem is the intense gathering of economically important seaweed species leading to the loss of species and the lower production capacity of the seaweed beds. Although seaweed species that are exported are often cultivated, there are still areas that suffer from intensive harvesting. Two of the seaweed genera that are heavily gathered are Gracilaria and Gelidiella for agar manufacture. Caulerpa lentillifera is another species that is a target species for export to Japan for seaweed salad. Natural threats to the biological diversity include storms and typhoons, storm surges that shift the substratum on reef flats causing the destruction of seaweed and seagrass beds. Among the recommended strategies for rehabilitation and ecosystem protection are proper harvesting methods, i.e., leaving the holdfast (root-like organ) intact for the thallus to regenerate. Repopulation techniques such as laying down of artificial substrates are already being done in denuded areas where seaweeds once proliferated. III. THE CORAL REEF ECOSYSTEM Naniel Aragones, Emmanuel S. Bate, Ramon I. Miclat, A. Rex F. Montebon, and Johanna Pe-Montebon Distribution of Noteworthy Reef Areas and Species Diversity THE CORAL REEFS Coral reefs are among the most biologically diverse ecosystems and have been considered as the rain forest of the ocean. In Southeast Asia, these reefs are at the center of marine biodiversity, particularly Indonesia and the Philippines (Wilkinson et al., 1993). Alcala (1993) has stated four characteristics of the Sulu Sea which warrant their protection and management, namely: Reefs in the Sulu Sea are the last remaining good reefs in the Philippines; The reefs have unique formations; They play a significant role in sustaining fisheries; and They have a significant role in maintaining biological diversity. 105
107 Some of the more prominent reef areas in the Philippines (Figure 4.6; UNEP/IUCN, 1988) within the boundaries of the SSME include: Apo Reef Marine Nature Park A small island and adjoining reef make up this 11,677 ha marine reserve located 35 km southwest of Mindoro Island in the Mindoro Strait, ~12 o N latitude and 120 o E longitude. The reef rises abruptly from water depths of greater than 1,000 m and has steep slopes to the north, west, and south. The declivity to the east is more gentle. The complex consists of subtriangular northern and southern reefs, partially separated by a large channel. The leeward sides of the reef complex are not closed but support discontinuous mound of coral growth. Lagoon depths range from 2-25 m. The reef flat is characterized by low species diversity and the dominance of ramose species, apparently well adapted to strong abiotic and biotic stress. Corals from the reef crest are considered to be tolerant of moderate wave action. The outer reef slope is characterized by high species diversity and the predominance of plate and encrusting forms (Ross and Hodgson, 1981). Species diversity reaches a reef maximum by 15 m. Below 25 m, a 45 o scree slope and low irradiance levels restrict coral colonization. The leeward reef community appears to be one of the most diverse in the world (Hodgson and Ross, 1981). Apo Island Municipal Reserve Apo Island is a small island off the southeastern coast of Negros Oriental at 9 o 05 N latitude and 123 o 16 E longitude. It is 7 km east of Bgy. Malatapay, Zamboanguita (25 km south of Dumaguete City) and west of Siquijor Island. It is under the jurisdiction of the Municipality of Dauin, Negros Oriental. Apo Island is a 74 ha volcanic island lying in the middle of Mindanao Sea. A narrow but diverse fringing coral reef surrounds the island with an area of 54 ha to a 20 m isobath or 106 ha to a 60 m isobath. The island is surrounded by a standard fringing reef which is in good to very good condition. Topographically, it is surrounded by steep drop-offs and gradually sloping drops of o decline. Live corals are found to be most extensive in the eastern and southeastern portions of the reef, with much of its growth supported by volcanic rock boulders (MCDP, 1985). A total of 48 hard coral and 11 soft coral genera were recorded around Apo Island in 1983 (MCDP, 1985). In 1995, only 31 genera of hard corals were observed while the number of soft coral remained the same. Among the hard corals, Galaxea is the most dominant, especially in the reserve, followed by Acropora and Porites. The dominance of massive corals to other hard coral growth forms indicate a high topographic index. Cagayan Islands The Cagayan Group of Islands is located in the northeastern Sulu Sea, some km southwest of Panay Island, within the Province of Palawan, 9 o 35-9 o 50 N latitude and 121 o o 20 E longitude. 106
108 Dodonay and Cagayan Islands rise to 100 ft (30 m) above sea-level; the other islands are flat. The total area of the pseudo-atoll formation is about km 2. A few kilometers west of the formation, the waters reach 1000 fathoms (1828 m) depth. Live coral cover in most parts of the reef northwest of Manucan Island does not exceed 40%, and is probably usually 20-30%. Good cover (70-80%) is found on the southern rim of the island ring, near the junction of the two main islands. The reef on the northern rim, near the coral islet of Boombong, has coral cover of about 50%, and many dead corals, some not yet reduced to rubble, can be seen. A drop-off on the western side of Cagayan Island has good to excellent cover, estimated at 50-60% and 80-95% on the steeper parts, for a length of about km along the shore (UNEP/IUCN, 1988) Carbin Reef Municipal Park Situated in the Visayasn Sea, about 0.5 (5?) km northeast of Old Sagay on Negros Island, and 9.5 km west of Molocaboc Island, to the north of Negros Island, 10 o 59 N latitude and 123 o o 28 E longitude. The approximate area is 2 km 2 (reef is 2 x 1.4 km); greatest depth m; a part (0.5 x 0.1 km) of the sand cay is exposed at low tide; area of Municipal Park is 154 ha. The cay is surrounded by a somewhat oval shaped reef flat, elongated in the northsouth direction and which slopes gradually from 3-10 m depth. The reef is surrounded by water m deep. Data from a 1983 survey by Silliman University Marine Laboratory showed the following live and dead coral cover: live soft corals ; live hard corals ; dead corals ; coral rubble ; rock ; and sand The following corals were found on the southern reef: Porites, Favia, Acropora, Pocillopora, Favites and Heliopora; on the west side, Acropora, Porites, Fungia, Heliopora, Millepora and Pocilliopora were recorded; on the north Porites, Acropora, Pocillopora, Favia, Favites, and Millepora were recorded. In general, coral diversity was fairly high (UNEP/IUCN, 1988). Danajon Bank The Danajon Bank Double Barrier Reef is a unique coastal environment within the jurisdiction of 17 municipalities covering 4 provinces. It lies in the Camotes Sea, Central Philippines, along the northern coast of Bohol, 10 o 16 N latitude and 124 o 37 E longitude. The inner barrier of the double barrier reef is some 3 miles (5.5 km) north of the municipality of Jetafe, on the northern tip of Bohol. The outer slope of the outer barrier generally has a gentle upper slope about m wide down to a 15 m depth and a lower, vertical slope down to 50 m. The upper slope has about 50% coral cover with Pavona cactus and Anacropora dominating. Fungiids are particularly abundant onhard and soft bottoms and include species such as Halomitra philippinensis. The lower drop-off is composed of horizontal overhangs 107
109 where Leptoseris dominates. Ahermatypic forms, like Tubastrea and Dendrophyllia, occur under the overhangs. The reef flats of both inner and outer barriers are similar. The external part of the reef flat on the outer barrier is covered mainly with corals of various growth forms (massive, digitate, or branching). The seagrass beds of both barriers are often interrupted by sandy areas where acroporids, pocilloporids, faviids, and Millepora grow. The back-reefs of both barriers are composed of sandy slopes colonized by large coral heads. The back-reef of the outer barrier has indented coral-built margins, sometimes descending by a series of steps toward the lagoon floor and colonized mostly by Anacropora, Porites, Echinopora, Pachyseris, and Pectinia (UNEP/IUCN, 1988). Dos Hermanas Islands Dos Hermanas Islands is situated nautical miles (22-28 km) south of Gasan, Marinduque Island; under the municipal jurisdiction of Corcuera (Jones), Romblon, located at the southeast, 13 o 1 N latitude and 121 o 54 E longitude. The total area encompasses 54 ha with a maximum altitude of 70 m (Isabel Island); and maximum depth of fringing reefs 30+ meters. Dos Hermanas is a pair of islands two nautical miles (3.7 km) apart, oriented southwest. The larger westernmost island is Carlota; the other is Isabel. Both islands are flat-topped with coastal limestone cliffs approximately feet (9-12 m) high. Carlota Island is bordered by a fringing reef which is steeply sloping except on the north side, where the island has a rocky beach and the reef slopes gently down to 20 fathoms (36 m). Isabel Island is ringed by a narrow fringing reef on all sides. At a distance of 1-2 km on the south and southwest of both islands are reef patches and white sand that slope gradually. Coral cover is good, ranging from 40-80%, with branching forms of Acropora sp. predominant. The reef slopes on the eastern side of both islands have abundant colonies of alcyonarians; off Carlota, there is an extensive community of stinging hydroids. On the western side of Carlota, where the coral cover is best, the reef slopes down to 2-33 m where encrusting and massive coral species predominate (UNEP/IUCN, 1988). El Nido El Nido is located in Bacuit Bay, on the northwest corner of Palawan Island, between Malampaya Sound to the south, and norhtern tip of Palawan, about 30 km to the north, 11 o o 15 N latitude and 119 o o 20 E longitude. Bacuit Bay covers approximately 150 km 2 ; depths within the bay gradually increase seaward to 40 m near the entrance; islands in the bay reach a maximum elevation of about 400 m while the mountains surrounding the bay reach to above 500 m. 108
110 The islands are surrounded by fringing reefs, and there are many reef patches. Reef flats in this area are generally exposed during extreme low tides, and have very low coral cover with silt and sand predominating. The reef edges have highest coral cover (which can approach 100% for sediment-resistant species) and this gradually decreased as the depth increases. In some areas, coral cover rapidly approaches zero at depths as shallow as 6 m. The bottom is composed of several meters of deep silt. In the cleaner water of the central bay, patch reefs and reef flats are dominated by many species of Montipora, Porites, Coeloceris, Favia, Echinopora and Goniastrea. Coral diversity increases over the reef edge and down the slope to a point where sedimentation effects are again apparent and coral cover gradually declines to zero at 15 m depth. Many of the reefs around the islands at the mouth of the bay have reef flats with 90% coral cover and sheer drop-offs to 50 m depth. Shallow reefs here have a very high diversity of Acropora with large table forms. On the reef slopes and walls, coral and fish diversities equal or surpass those found at more distant pristine sites such as Apo Reef or Tubbataha Reef. The fringing reefs along the outer islands generally have a narrow shelf-like reef flat and then a steep to sheer slope down to 30 m. In some areas, a second drop-off begins after a second shelf and drops to 70 m depth. In these areas large pelagic fish are common as well as large reef fish such as Napoleon Wrasse Cheilinus undulatus and groupers Epinephelus spp. Transects of wide reef areas have shown overall coral cover of approximately 30% (UNEP/IUCN, 1988). Honda Bay Honda Bay is a broad embayment (28,000 ha) off the Sulu Sea, dotted with 12 coral islands and lined with mangroves, located about 10 km north of Puerto Princesa, Palawan, 9 o o N latitude and 118 o o E longitude. Honda Bay has a complex basin geometry, and is shallower than 20 m all throughout. The fringing reefs have very wide and often shallow reef flats, frequently many times larger in area than the islands they surround. The exposed parts of these flats consist mostly of sand and coral rubble but the more enclosed areas may have mangroves. The submerged areas of the platforms may be barren or may be inhabited by corals such as Porites, Acropora and Millepora. On most flats, algal mats and seagrass beds are found in patches. The reef flats may reach 6 m depth but are usually around 1-3 m. Seaward of the flats are slopes and sometimes vertical but short drop-offs, as in Bush Island, Arrecife Island and Fondeado Island. The reef slopes are often gradual, reching 6-19 m depth or undetermined depth. Most of the slopes are sandy or rocky and overgrown by Porites, Montipora, Acropora, Turbinaria and Fungia, the soft corals Sarcophyton, Lobophyton, Xenia, Anthelia and Dendronephthya, gorgonians, whip corals, and sponges. Foliate forms of Turbinaria, Pachyseris and Montipora predominate in deeper areas. Coral cover was estimated at 40-63%. Soft coral cover is greater than hard coral cover. Sarcophyton and Lobophyton are the commonest soft 109
111 corals, and Porites, Acropora, Millepora, Turbinaria, Pachyseris and Montipora are the commonest hard corals (UNEP/IUCN, 1988). Mactan Island Mactan Island is located on the eastern side of Cebu at 10 o 20 N latitude and 124 o E longitude. The fringing reef consists of a reef flat, coral crest, and steep drop-off. The reef flat is composed of seagrasses and brown algae interrupted by low diversity patches of coral dominated by Pavona. The upper reef crest is dominated by Montipora colonies and exhibits a moderate diversity at its upward edge which increases in slightly deeper waters. The lower reef crest is dominated by Porites and some Montipora species. The reef wall supports a highly diverse fauna dominated by Pavona. The coral assemblage produces high evenness values and includes a broad variety of colony shapes and sizes (Aliño et al., in prep.). Moalboal/Pescador Island Moalboal sits in the midwest coast of Cebu Island along the Tañon Strait at 9 o o N latitude and 123 o o 25 E longitude. It has a narrow fringing reef approximately 200 m wide. The reef flat extends m from the shoreline to the crest with a slope of o at depths of 5-10 m. It is largely covered by rocks, rubble, sand and mostly by soft corals (Lobophyton and Sarcophyton) with few patches of hard coral colonies. The most common hard coral are the branching Acropora and non-acropora such as Seriatopora and Porites. The crest is characterized by boulders, rock, rubble and colonies of live hard corals. Branching (Porites), massive and encrusting corals are dominant. Pescador Island is a coralline island situated in the Tañon Strait about 3 km off the coats of Moalboal. The reef surrounding the island is an oval-shaped fringing reef composed of a gradually sloping reef flat with an area of less than one ha to a depth of five meters and a steep slope deeper tha five meters. Pescador Reef is a mixture of hard and soft corals and inhabited by a wide variety of invertebrates and reef fishes (Aliño et al., in prep.). Puerto Galera Biosphere Reserve Puerto Galera is located in the extreme northern part of Mindoro Is., between 12 o o 32 N latitude and 120 o o 00 E longitude. The almost land-locked Puerto Galera Bay has three considerable coral communities referred to as the First, Second, and Third Plateaus. The coral condition on the reef flat appears to be poor although the sloping portions, with depths ranging from 7-15 m, are rich with reef-building corals. The massive and encrusting type of corals are found on these platforms called plateaus. Of the three sites surveyed, the Third Plateau has the highest mean percentage of live coral cover at 33%. The other two have mean hard coral cover of 15% (First Plateau) and 18% (Escarceo Pt.). Out of the 32 coral genera observed in Puerto Galera, Acropora, and Porites are dominant. The deeper part of Escarceo Pt. (outside the 110
112 Bay) has the number of genera at 18 while the rest of the locations have around <13 coral genera based on line transect surveys. It is also in Puerto Galera Bay where the first record of Acropora puertogalerae was first identified and described by Nemenzo in This species of Acropora thrives in unconsolidated substrates, such as silty sand, which characterizes the deeper portions of the First and Second Plateaus. Acropora puertogalerae are still prevalent in these areas (Aliño et al., in prep.). Panglao Island Panglao Island is located southwest of Tagbilaran City, the capital of Bohol, at 9 o 35 N latitutde and 123 o 34 E longitude. Panglao is a flat coralline island. The reef around the island is of fringing type, narrower in the northern and southeastern sides and spans several hundred meters at its widest southwest of the Panglao municipality. On the southwest is a wide reef that drops off adjacent to a navigational lane. The southeastern side is characterized by a long white sand beach and a gently sloping seabed with patches of corals interspersed with white sandy substrate. The reef flat extends 200 m from the shore and slopes at an angle of o at m depths. Tabulate Acropora, the fire coral Millepora, branching Porites and massive corals together with soft corals mostly Lemnalia) are common at Poblacion (southwest). The branching Tubastrea is the dominant coral growth at the drop-off in Bolod (southeast). Danao (south) hard corals are represented mostly by Acropora; branching, foliate, and massive Porites; foliate forms of Echinopora and Montipora; branching Hydnophora and massive Millepora. Branching Acropora and Anacropora and foliate and mushroom corals are dominant in Doljo (western tip; Aliño et al., in prep.). Sicogon Island Located in the Visayan Sea about 10 km east of Estancia on mainland Panay, 53 km northwest of Carbin Reef, and 86 km northeast of Banago, Bacolod and Negros Occidental, 11 o o 28 N latitude and 123 o o 16 E longitude. Sicogon has an approximate land area of 6.0 km 2 ; c. 8.0 km 2 reef around the island. Depths immediately beyond the reef crest range from m. From the study made by Silliman University Marine Laboratory, a fairly high coral species diversity was observed. Southeast of Tumaguin Islet, the dominant live corals are Platygyra, Porites, Favia, Favites, Coeloseris, Symphyllia, Lobophyllia, Goniopora, Pocillopora, Acropora, Seriatopora and Millepora. East of Siocogon, the coral community includes: Porites, Platygyra, Heliopora, Favia, Favites, Symphyllia, Goniopora, Galaxea, Lobophylla, Acropora, Millepora and Hydnophora. To the south at Gasang, soft corals, Porites, Favia, Favites, Goniopora, Acropora, Montipora, Pavona, Millepora and Galaxea, are dominant. Coral relief in all three areas ranges from a few centimeters to one meter from the bottom (UNEP/IUCN, 1988). 111

113 Figure 4.6 Prominent reef areas in the Philippines
114 Sumilon Island Sumilon Island lies within the southern portion of Cebu Strait in between 9 o and 9 o N latitude and in between 123 o and 123 o E longitude. The total reef area of Sumilon, i.e., up to a depth of 40 m, is around 0.5 km 2. The reef crest of the island is separated from the shore by a reef flat of about 50 m wide in the western part and ~ m wide in the eastern portion. A total are of 49 ha in the western part of the island is delineated as fish sanctuary. The reef slope in the sanctuary drops at an angle of o. Based on the 1996 survey conducted by DENR, live coral is estimated at 50% and considered to be in good condition as adopted from Gomez et al. (1994). Hard corals dominate the lower reef slope and soft corals are abundant in the upper portion of the reef. In the eastern portion of the island is the non-reserve zone, where fishers frequently fish. The reed in this area gradually slopes from o. Live coral cover is still in good condition. Highest cover of sand and rubble are observed in this area (Aliño et al., in prep.). Sombrero Island Sombrero Island is a small high island approximately 0.2 km along its north-south axis. It lies at the northeastern point of Maricaban Island, at 13 o N latitude and 120 o E longitude. On the north and south portions, the platform rounds downward into a gradual slope. On the west side, a platform approximately 0.2 km drops off shraply into a steep wall from approximately12-30 m. Much of the east side consists of a steep sand slope reaching from shore to over 30 m deep. The southeastern portion, however, supports a coral covered platform of m in width prior to a steep drop-off with a diminishing coral cover to over 30 m in depth. Coral reef communities abound making the area among the best dive sites in the Batangas area although benthic cover is quite low at 7.8% within depths of 6-10 m. The corals belong to 45 genera dominated by Acropora. Above 10 m depth, corals include arborescent, corymbose, and caespitose Acropora, Pocillopora, and massive Porites. Below this depth corals include corymbose Acropora, encrusting Montipora, Porites and Pachyseris (Aliño et al., in prep.). Tubbataha Reefs Tubbatha Reef is 192 km southeast of Puerto Princesa City, Palawan. It is located within 8 o 43-8 o 57 N latitude and 119 o o 3 E longitude almost at the center of the Sulu Sea, Philippines. The north atoll is approximately 10 nautical miles long and 3 nautical miles wide. Its reef flat is a continuous platform m wide completely enclosing a sandy substrate 8-24 m deep. The reef flat terminates to a wall on the seaward side. On the other hand, the south atoll is 5 nautical miles long and 3 nautical miles wide. The drop-off reaches a depth of m found at the seaward side. 113
115 The coral community in the reefs includes 46 genera exhibiting diverse morphology. Acropora, Porites, Millepora, and Pocillopora have the highest percentage cover. Zonation is evident along the transition from the drop-off to the backreef. Pachyseris, Leptoseris, and Montipora commonly inhabit the deeper stretches of the drop-off while the Porites micro-atolls characterize the backreef. This distribution can be attributed to the different morphological types of each genus with its adaptation to the environment it inhabits (Aliño et al., in prep.). Based on surveys of reefs and coral communities in over 600 site-time combinations, information show that in the late 1970s, 5.3% of the reefs had excellent cover (at least 75% live coral cover). Licuanan and Gomez (2000) analyzed secondary data obtained from surveys conducted in the 1990s showing reefs with excellent coral cover is down slightly to 4.3%. It showed that 20% of the 245 sites had at least half of the corals already dead. Figures 4.7 to 4.10 show percent coral cover in various reef areas in the Philippines. Databases on coral reefs show that the Visayas is the most at risk, with the number of excellent reefs reduced to half its original number and the number of good reefs reduced to one third of the 1991 inventory (Licuanan and Gomez, 2000). Within the ecoregion, hermatypic corals predominate particularly the genera Acropora, Porites, Pocillopora, Millepora, Montipora, Favia, Goniastrea, and Pavona. In addition to the corals within the reefs, a multitude of species are found inhabiting these highly productive areas. Numerous birds, fish species, marine mammals, and reptiles, all of which are of special concern, are found associated with the reefs. These will be further discussed in the subsequent chapter. 114
116 Figure 4.7 Reefs with 0-25% coral cover 115
117 Figure 4.8 Reefs with 25-50% coral cover 116
118 Figure 4.9 Reefs with 50-75% coral cover 117
119 Figure 4.10 Reefs with % coral cover 118
120 ASSOCIATED REEF FISH COMMUNITIES The Philippines, Indonesia and New Guinea have been recognized to harbor the greatest number of species of marine plants and animals in the world (Randall et al., 1990). The Great Barrier Reef of Australia and the adjoining reefs of the Coral Sea registered the highest number of reef-associated fishes with 1,111 species and the Philippines come in second with approximately 1,030 species. Both areas are part of the Indo-Pacific region which constitute approximately 4,000 species (18%) of all living reef-associated fishes. Aliño et al. (in prep.) listed 736 species of coral reef fish observed through underwater visual census in 19 sites in the Philippines. The area covered included 4 within the SSME, namely: Southern Luzon (402 species), the Visayan seas (271 species), Northern Mindanao (226 species), Sulu Sea (577) and Sulawesi Sea (214). Southern Luzon o o o o Balayan Bay, Batangas Initial fish surveys in the early 80 s using extensive underwater visual surveys and collection with rotenone reported 240 species, while visual census confined within line transects done in 1980 around the island resulted to 4,167 individuals identified to 168 species (McManus et al., 1981). With the continued monitoring effort by the Marine Parks/Recerve Development Inter-Agency Task Force technical working group, a record of some 329 reef fish species were reported within the bay area (MPDITF-NRMC, 1982). Apo Reef, Sablayan, Mindoro Occidental The survey conducted by the BFAR Coral Reef Research Team in 1982 reported some 385 fish species in 85 families (BFAR-CRRP, 1983). Transect surveys and reconnaissance dives were done on several portions of this semi-atoll, which was being proposed as a marine park under the MPDITF. Calancan Bay and vicinities, Sta. Cruz, northern Marinduque Fish species recording was done through underwater visual census in four different artificial reef sites and in some nearby reefs already affected by mine tailings within and outside the bay). A total of 108 species were observed underwater. Fish catch composition were obtained from records of catch by different local fishing gear (fish corral, gill net, bottom lines, spear, and handline) and showed that 24.8% of the sample catch are reef fishes while 66.6% are mostly pelagic species (ITF-CBRP, 1991). Ragay Gulf in Quezon and Camarines Sur Two fish sanctuaries are located within the Bay namely: Alibijaban and Acha Reef. Fish visual census resulted to 296 species under 18 families. Most dominant species are the labrids (wrasses), caesionids (fusiliers), pomacentrids (damselfishes), and chaetodontids (butterflyfishes). On the other hand, the pelagic and soft bottom species are among the dominant commercially caught fish 119
121 in the gulf. The pelagics include the sardines, anchovies, herrings, scads, mackerels and tuna-like species while the soft bottom species are the leiognathids (slipmouths), gerrids (mojarras), theraponids (tigerfish), synodontids (lizardfishes), mullids (goatfishes) and nemipterids (threadfin-bream). Whale sharks are commonly seen in the area during the northeast monsoon. o o Masbate Reef areas in the northwestern, northern, and northeastern portions of Masbate were surveyed by the UP-MSI through the UNEP-CITES project which were described to be mostly reef patches. A total of 112 fish species in 34 families were observed through underwater fish visual census. Wrasses were the most abundant in terms of biomass representing 23% of the total fish biomass in the area. Puerto Galera, Mindoro Oriental In the reef survey of Puerto Galera, Mindoro under the ASEAN- Australia Coastal Living Resources Project (CLRP), some 234 reef-fish species were recorded (Hilomen and Yap, 1991). Dominant species were those of the pomacentrids and labrids representing 50% of the total fish composition. The Visayan Seas o o o Sumilon Island Reserve, Cebu The upper reef zone of the reserve is haven for 142 fish species in 25 families while the lower reef zone is home for some 170 spp. in 28 families. Seven families are considered commercially important in the area, namely: caesionids, carangids, holocentrids, lutjanids, scombrids, serranids, and siganids. The whitetip reef shark is often sighted in the area with previous sightings of whale sharks, manta rays, and barracudas. Olango and adjacent islands, Cebu This area is located east of Mactan Island, Cebu. The other adjacent smaller islands are Sulpa, Caohagan, Panganan and Camungi. Olango Island is a Wildlife Sanctuary. Fish visual census done by Silliman University Marine Laboratory recorded some 107 reef fish species under 23 families. Dominant species belong to the families Pomacentridae and Labridae. The commercially important food fish noted are surgeonfishes, fusiliers, emperor breams, snappers, goatfishes, parrotfishes and groupers. Some of the earliest collections of two species of the rare flashlight fish (Photoblepharon sp. and Anomalops kaloptron) were taken around this area by the BFAR Coral Reef Research Project (CRRP) in 1977 particularly in the drop-offs of Mactan Island (BFAR-CRRP pers. comm.). Panglao Island, Bohol Recent fish census around the island reported some 109 fish species in 24 families with damselfishes and groupers as the most abundant. Local fishers often sight sharks and manta rays around Panglao. The nearby Cervera shoal is noted for its sea snakes while an adjacent island called Balicasag offers variety of reef fishes in 120
122 the drop-off portions which include some rare species of angelfishes and butterflyfishes. o o Sagay Marine Reserve, northern Negros Occidental This marine reserve started off as the first municipal coral reef Park in the Philippines (Castaneda and Miclat, 1981). It was officially declared as a fish sanctuary through Municipal Ordinance No. 59 series of 1983 and several years later as a marine reserve through Presidential Proclamation No Recent surveys of the two reef areas in Sagay, namely Macahulom and Carbin reefs, recorded 58 species of reef fishes (Aliño et al., in prep.) which is not an impressive record for a marine reserve area. Danjugan Island Marine Reserve According to the survey conducted in 1995 by the Coral Cay Conservation Ltd. (CCC) and Philippine Reef and Rainforest Conservation Foundation, Inc. (PRRCFI), 450 species of fishes were recorded in the area (Aliño et al., in prep.). In the nearby barangay Caliling, Cauayan is a CITES Project site called Hulao- Hulao Reef which was officially declared a marine sanctuary on June The survey recorded 22 families of finfish broken down to 115 species. Dominant species recorded are those of the damselfishes and wrasses. Around 33 target species belonging to the families of snappers, groupers jacks, emperor breams were observed in the area. Sightings of sharks and stingrays were also noted. o Apo Island This small island in the southeastern coast of Negros Oriental was declared a municipal reserve through a municipal ordinance, and later a marine reserve and tourist zone by a proclamation and presently a protected landscape and seascape with another proclamation through the DENR. The 1991 survey in the area showed a record of 126 fishes (80% reef fishes and 20% non-reef fishes). Other sites with fish survey records with less significant fish species count include the areas of Bantayan Island, northern Cebu (73spp in 19 families); southwestern Cebu near Moalboal (55 spp in 15 families); Tulapos, Enrique Villanueva, Siquijor (76 spp in 19 families); Cang-alwang, Siquijor (117 spp in 26 families); Maribojoc Bay, southwestern Bohol (49 spp in 10 families); Bongalonan Marine Reserve, Basay, Negros Occidental (150 spp in 26 families); Dumaguete City waters, Negros Oriental (112 spp in 23 families); Bais Bay, Negros Oriental (62 spp in 18 families); Guimaras Island (129 spp in 24 families). o Antique province During the fisheries resource assessment of coastal and marine waters of Antique province conducted in by the Pacific Rim Innovation and Management Exponents (PRIMEX) team for the Antique Integrated Area Development (ANIAD) Foundation, some 196 fish species were recorded from catches by different gear (PRIMEX, 1993). On the other hand, the reef fish survey 121
123 conducted through underwater visual census accounted for a total of 171 species belonging to 32 families of which 70% represents the major species (pomacentrids, labrids, acanthurids and others), 19% target species (serranids, lutjanids, haemulids, carangids, caesionids); and 11% indicator species (chaetodontids). SEAFDEC-AQD in Tigbauan conducted a more detailed study of one of the islands called Malalison, which was recommended for a marine sanctuary site for Antique under the ANIAD Program. Species recorded through underwater visual census from seven permanent transect stations established around the island numbered to 238 species in 34 families during the period (Aliño et al., in prep.). Northern Mindanao o o o Baliangao Marine Sanctuary Located in Danao Bay in the northern part of Misamis Occidental. An initial survey in 1993 by the DENR, some 48 fish spp were recorded and the re-survey of the area after one year showed an increase in species count to 75. Iligan Bay Iligan Bay covers three provinces, namely: Misamis Occidental, Lanao del Norte and Misamis Oriental. For the seven sites surveyed by the Mindanao State University (MSU) Naawan in the southern and eastern portion, some 175 fish species in 29 families were recorded. The study showed damselfishes dominant in the area followed by serranids, wrasses, cardinalfishes, and sea catfishes. On the other hand, the western portion including Murcielagos Bay recorded about 175 spp in 28 families. Within the Bay is the Initao Marine Park that is managed under the DENR-PAWB protected landscape and seascape (PLS) program. A survey conducted in 1994 indicated some 106 spp of reef fishes under 33 families. Misamis Oriental Other areas in Misamis Oriental with reef fish inventories are Jasaan in Macajalar Bay with 132 species in 26 families; Agutayan Island, located north of Jasaan with 192 species in 31 families; and Camiguin Island, north of Macajalar Bay with 153 species in 31 families. Surveys were also conducted in the northern coastal waters between Macajalar and Gingoog bays, which yielded a total of 149 species in 26 families. Sulu Sea o Palawan (Northwestern and Northeastern, Tubbataha Reefs and outlying areas) The three-year work on marine fishes of Schroeder (1980) in the Western Sulu Sea, recorded 525 species representing 105 families. The study and collection of fish specimens were carried out in the inshore waters of Puerto Princesa, Roxas, 122
124 Balabac Island (the far western Sulu Sea) and at the Cagayan Islands (north central Sulu Sea). In the Central Sulu Sea, the Tubbataha National Marine Park has been extensively studied through scientific expeditions since the early 1980s. A month-long survey conducted by the marine park inter-agency task force technical working group (NRMC, BFAR, and UP-MSC) under the auspices of the then Ministry of Natural Resources (MNR) now the Department of Environment and Natural Resources (DENR), resulted to a record of some 379 fish species under 40 families. These fishes were mostly coral reef-related species including the larger species of sharks, barracudas, manta rays, jacks, Spanish mackerel, and tunas thriving in and around the two atolls comprising the Tubbataha Reefs (NRMC et al., 1983). The 1992 studies conducted in Tubbataha Reefs by Earthwatch Expedition accounted for 226 fish species in Tubbataha, the list of which is published in Arquiza and White (1994). A more recent fish survey by the same group acounted for more than 400 spp. Alcala (1993) reported that Tubbataha Reefs is an important site for the study of larval dispersal in the Sulu Sea. The area is believed to be the spawning and breeding ground of many reef and pelagic species, which provide a good source of planktonic larvae of reef fishes which may re-stock the fisheries of the Sulu Sea. o Turtle Islands Heritage Protected Area (South Sulu Sea) A total of ten islands comprise the Turtle Islands Group located in the southern portion of Sulu Sea northeast of Sandakan, Malaysia. Seven islands belong to the Philippines (Great Bakkungan, Taganak, Baguan, Langaan, Sibaung, Boaan, and Lihiman) while three belong to Malaysia (P.Selingaan, P. Bakkungan Kechil and P. Gulisaan). Reef fish visual census in conjunction with coral reef survey was conducted by KKP in 1997, which resulted to a record of 155 species in 25 families (SEASTEMS, 1998c). The study indicates that plankton feeding (planktivores) and fish eating (piscivores) species dominate reef fishes of the Turtle Islands. A summary of fish inventory in the Sulu Sea as reported in Aliño et al. (in prep.) indicates about 577 species. Sulawesi Sea o o Davao Gulf Three sites within Davao Gulf were surveyed by the MSU-Naawan in 1996 to gather baseline information on reef assessment. These were Marisa Uno Reef near Samal Island, Sigaboy Island off Governor Generoso, Davao Oriental, and Tinaytay and Burias reefs on the coast of San Isidro, also of Davao Oriental. Reef fish species count of the sites were 108 spp, 106 spp, and 105 spp, respectively. Moro Gulf Illana Bay, which comprises most of the coastal waters of Zamboanga del Sur, is located in the northern portion of Moro Gulf. Two sites within the Bay were 123
125 surveyed namely: Calibon Pt. and Daodao Island, which resulted to 147 reef fish species belonging to 31 families. o Sarangani Bay In a survey conducted by Dames Moore in Sarangani Bay in 1992, the fish underwater censuses conducted in 21 sites indicate that, areas which are not fished, tend to have larger fish individuals representing most of the families. While those reefs that were heavily fished have less presence of predator species (e.g., snappers and groupers) if and when present are less in number and are smaller in size. In general, most fish were small with very few species of commercial value except for three sites located at the mouth of the Bay where large schooling jacks, rainbow runners and snappers were observed. The number of species from the 28 stations ranged from Dominant species include those of the pomacentrids, labrids and acanthurids. Importance ECONOMIC BENEFITS Coral trade International trade in ornamental corals, shells, sea turtles and other coral reef organisms flourished in the 1970s. Tons of the corals and reef-associated organisms were extracted yearly for export to other countries mostly in the United States. The volume of coral export reached 1.8M m 3 of corals annually (White and Cruz-Trinidad, 1998.) Reef fisheries Intact reefs serve as habitats for numerous invertebrates and reef associated fishes. Economically, these highly productive areas provide livelihood to millions of Filipino fishers. Fishery products from reef areas include not only food but export products as well as extracts for pharmaceutical purposes. Live fish trade The live fish industry started to flourish in the late 1970s, specifically the aquarium fish trade. However, due to the poor method of collection, mainly with the use of cyanide, the Philippines was one of several countries banned by importing countries. This started the decline in the once vigorous trade. The live-fish trade mostly for table food started in the late 1960s and continue to flourish. The most common target species is the Plectropomus leopardus and other species of a lesser degree such as grouper, rock lobsters, stonefish and others. In 1996, about 840 tons were exported from the Philippines. 124
126 Tourism revenues Reef areas are the favorite tourist destinations for snorkeling, skin diving, scuba diving, and underwater photography. The pristine waters, magnificent beaches, and underwater diversity are the main attractractions for foreign as well as local visitors. Revenues from tourism alone bring in millions of dollars to the country giving locals a source of income. White and Cruz-Trinidad (1998) made a conservative estimate of revenue from tourist arrival in Panglao, Bohol. The revenue from entrance fees alone was estimated at over US$ 26,000. ECOLOGICAL SIGNIFICANCE Coral reefs rival that other great tropical community, the rain forest, in their majesty, richness, and complexity. But in terms of abunance of readily observable animal life, even the mighty rain forest takes a back seat. They are easily the richest and most complex of all marine ecosystems. Coral reefs are such massive structures that they must be considered not only biological communities but geological structures, the largest geological features built by organisms. Coral reefs, despite being notoriously low in nutrients, harbor a super abundance of life and provide habitats for various plant and animal species. They serve as nurseries and feeding grounds for juveniles and home to demersal as well as some pelagic species. The numerous mirohabitats and the huge number of species is a direct reflection of the opportunities afforded by this environment. A single coral head may contain more than a hundred species of worms and a numerous assortment of other organisms! Symbiotic relationships are also extremely common, thus, favoring the coexistence of a multitude of organisms. The coral s associate zooxanthellae provide the vital first step in the coral reef food chain. Many reefs also supply larvae and gametes to nearby sink areas where they grow and proliferate. In this manner, diversity is maintained not just within a locality but throughout the entire region. But why is it so important to maintain diversity? Simply put, a more diverse ecosystem is a more stable one, just as there is strength in numbers. Though diversity is more than just a game of numbers, but also of types. As mentioned earlier in this section, reef areas in the Philippines serve as the center of biodiversity in Southeast Asia. Within SSME, particularly in Central Visayas, Panglao in Bohol, Negros Oriental, and selected areas in Mindanao where coral reefs are still in relatively good condition, biodiversity is maintained. Other noteworthy sources of larvae and gametes are the Tubbataha Reef National Marine Park, The Apo Island Reserve, and various marine protected areas in the region. 125
127 Threats and Issues ANTHROPOGENIC SOURCES The main sources of threats to coral reefs are human-induced. Among the most pressing issues are: Destructive fishing methods o o o Use of poisonous substances The use of cyanide in the collection of aquarium fish started in the 1950s and presently continues to a lesser extent. Figure 4.11 idicates the reefs where cyanide fishing is practiced. The drop in this practice is due to the decline in the demand for aquarium fish from the Philippines, mostly caused by the notoriety by which the fish are captured. However, the use of cyanide for catching live fish for table food has increased over the years (Pratt et al., 2000). The coral trout Plectropomus leopardus is the most commonly targetted species in the live reef fish food trade (Pratt et al., 2000). Fisheries specialists foresee overexploitation of this species should the current practice continue. Blast fishing Beause the number of blast fishers have been reported to decrease in recent years, coral communities are slowly recovering. But due to the intense damage wrought in most reefs (Figure 4.12), recovery will take some time. One simulation study indicated that 30% reduction in the current level of destructive fishing activities would allow slow recovery of corals and gradually enhance biodiversity (Alcala, 2000). Other destructive fishing methods Trawling, muro-ami and the use of non-selective fishing gears are among the most common problems that amplify coral reef destruction. Since a large volume of fish are caught at one time, depletion of fish stocks are feared to ensue. Besides overfishing of food fish, by-catch has scaled up at an alarming rate. These fish, which are either juveniles or non-consumable species, only end up as waste. Habitat destruction Habitat destruction results from various causes such as high sediment load, destructive fishing methods, and pollution generated by households (domestic wastes) and industrial operations. Land conversion and deforestation from upland areas are pointed out to be the ultimate source of marine habitat destruction. Pollution incidents such as major oil spills also contribute to the destruction of coral reefs. Chronic spills along ports and harbors and from motorized banca also pose a risk to the survival of coral communities. 126
128 NATURAL SOURCES Besides the glaring effect of human-induced threats to coral reefs, natural phenomena also factor out. Among the most notable cases are: Coral bleaching episodes Six bleaching reports were documented from 1980 to 1997 in Bolinao, Pangasinan, Northern Luzon. Arceo et al. (1999) documented the bleaching and mortality of corals due to elevated sea surface temperatures (SSTs). In 1999, Arceo et al. using coral bleaching report forms, video transect surveys and NOAA s satellite data, documented for the first time in the Philippines a mass bleaching event. Elevated SSTs that surpassed the upper thermal limits of corals were suspected as the major cause of bleaching. Analyses of before and after bleaching episodes showed that live coral cover significantly decreased (0.7% to 46%) while dead coral cover significantly increased (3% to 49%). Crown-of-thorns outbreak Crown-of-thorns outbreaks have been reported in different parts of the country over the last 20 years. In 1998, the Cebu-Bohol area was badly affected, while in 2000 eastern Palawan was severely devastated by the onslaught. This sea star can destroy a significant amount of living hard corals by covering the coral colony with its stomach and digesting away the live coral tissue. Much is yet to be studied about the factors that trigger these outbreaks. Resource Management LEGISLATIONS National legislations were passed during the 1970 s including the coral ban, and environmental laws defining limits to industrial discharges such as mine tailings. Setting maximum allowable limits to specific parameters in the water allowed the maintenance and protection of good water quality that translates to better conditions for corals and associated flora and fauna to thrive. Ordinances promulgated by local government units (LGU) have tremendously promoted the protection of coastal areas. These include support for national legislation and the local implementation of environmental and fishery laws. 127
129 Figure 4.11 Reefs where cyanide fishing is practiced 128
130 Figure 4.12 Reefs where blast fishing is praticed 129
131 MARINE PROTECTED AREAS The declaration of coral reefs as Marine Protected Areas (MPAs) was initiated by the LGUs. Over 700 MPAs are now recorded in the country but less than 10% are being effectively managed (Aliño et al., 2000). The proclamation of the Tubbataha Reef National Marine Sanctuary as a World Heritage Park have resulted in greater awareness of the need to protect the country s marine resources. It also called the attention of conservationists worldwide to intensity conservation efforts to protect these highly valuable resources. Many more MPAs have been designated nationwide with the participation of local communities. RESTORATION EFFORTS Because of the escalating stress mounted upon our coral reefs, the rate of its destruction is increasing alarmingly. There is, thus, an urgent need to save the few intact reefs we have and restore the ones that have been ruined. Several institutions like the Marine Science Institute (MSI) in Central Luzon and Silliman University (SU) in the Visayas have set up programs to restore reefs within their respective areas. Where coral recruitment was once the prolific mode of rehabilitation, recently coral transplantation has gained popularity in refurbishing damaged reefs. Although still in the experimental stage, MSI together with the Philippine Tourism Authority (PTA) and the Bureau of Aquatic Research (BAR), has been transplanting corals in Padre Burgos, Quezon and the Hundred Islands and Bolinao in Pangasinan. 130
132 IV. THE SOFT BOTTOM ECOSYSTEM Flordeliz Guarin, Hildie Maria E. Nacorda, and Johanna Pe-Montebon Very little published information was found on this subject although the soft bottom communities are included in studies such as resource assessments for coastal management and environmental impact assessments. Benthic Faunal Assemblages A resource assessment conducted in Panguil Bay s soft bottom communities show the predominance of meiobenthic over the macrobenthic fauna (FSP, undated b). The meiobenthic fauna was composed of the following: nematodes, copepods, polychaetes, turbellaria, ostracods, oligochaetes, amphipods, shrimp larvae, crab larvae, kinorhynchs, and tardigrades. The macrobenthic fauna include young crabs, lingula larvae, bivalves, gastropods and bigger nematodes. Additional macrobenthic fauna such as juvenile and adult shrimps, crab megalopae, juveniles of demersal fishes, polychaetes, echinoderm juveniles and adults were found using different sampling equipment. The meiofaunal population using cored samples showed 45,465 individulas per 0.1 m 2 while 510 individuals per 0.1 m 2 were found for the macrofauna. For the Ockelman sledge, the mean abundance varied in nearshore (2 to 1, 629 individuals per 300 m 2 ) and in the offshore areas (26 to 73 individuals per 300 m 2 ). Monsoons were found to affect the biomass of both the meio and macrofauna where the highest biomass for macrofauna was during the northeast monsoon. The nearshore stations were organically richer than the offshore stations. Grain size distribution and the monsoons are believed to affect the total mean population densities of both meio and macrofauna. A similar study was conducted on soft bottom communities in Carigara Bay. The dominant species are nematodes, clams, oysters and sipunculids. Table 4.7 presents the list of meiofauna found in Carigara Bay (FSP, 1994). Importance Meiofaunal organisms serve as important food sources of larger organisms, many of which are economically important species. Thus, the loss of these species could have profound ecological and economic effects. Being sedentary they also bioaccumulate certain heavy metals such as mercury, cadmium, etc, thus they serve as excellent biological indicators. Benthic sediments are sites of processes important to the functioning of marine ecosystems. Dead organic matter accumulates at those sites, where it becomes subject to microbial decomposition. This degradation requires a supply of oxygen and leads to a 131
133 release of nutrients to the overlying water. The diffusive sublayer of the benthic boundary layer presents a barrier to the downward flux of oxygen and the upward flux of nutrients (Mann and Lazier, 1996). Table 4.7 Meiofaunal communities in Cariga Bay (1994) Phylum Annelida Class Polychaeta Arthropoda Class Crustacea Mollusca Class Bivalvia Class Gastropoda Cnidaria/ Coelenterata Nemertea/Rhynchocoela Chaetognatha Brachiopoda Priapulida Sipunculida Platyhelminthes Nematoda Echinodermata Chordata Common name Segmented worms, common worms Shrimps, crabs, lobsters Snails, slugs, clams, oysters Clams Snails Jellyfishes, anemones, corals Marine bottom dwelling worms Arrow worms Free swimming crustaceans Worm-like marine animals Unsegmented worms Flatworms Roundworms Sea stars, brittle stars, sand dollar, etc. Amphioxus Threats ANTHROPOGENIC FACTORS Human activities almost always leave lasting impacts in the ecosystem. For soft-bottom communities these include: accumulation of organic matter and silt due to waste dumping, excessive river runoff, stirring of shallow benthic areas due to destructive fishing methods such as trawling and dredging. Due to their sedentary nature, benthic organisms are susceptible to contamination from silt and sediments. They could be directly buried by large sized grains such as those from mine tailings or dredged spoils dumped in coastal areas. During construction of development projects, fine silt can affect the filter feeding mechanisms of benthic organisms, which can cause lower productivity or disrupt reproductive functions. 132
134 Coastal developments result in either temporary or permanent loss of habitat and the elimination of sensitive organisms. Building of ports and harbors cause the alteration of the habitat. NATURAL DISTURBANCES Two types of natural disturbances that affect meiofaunal populations are the following: (1) disturbances caused by currents and wave action and (2) alteration of grain size by animal activities. These can have profound effects on the sizes of meiofaunal communities and the species comprising them. V. MARINE PLANKTON AND ECOSYSTEM LINKAGES Rudolf Hermes and Flordeliz Guarin Plankton are small drifting organisms, some of which are able to swim actively, but not against strong currents. This group is comprised of tiny plants (phytoplankton), animals (zooplankton) and other microorganisms (fungi and bacterioplankton). The separation from nekton, especially in view of the planktonic early life history stages (distinguished as meroplankton from the holoplankton ), is not clearly defined. Plankton represent essential links or trophic levels in the marine food webs and is part of the very critical early life history stages, as eggs and larvae, of the vast majority of marine organisms. Phytoplankters are the primary producers in tropical waters, producing biomass and generating oxygen through photosynthesis. The primary consumers are the herbivorous zooplankton that graze upon the phytoplankton. Very important zooplankton are copepods and other small crustaceans that serve as food for planktivorous fish, and jellyfish (that feed upon planktonic fish eggs and larvae). Planktivorous small fish are the secondary consumers in the marine ecosystem. Only relatively few planktonic organisms are directly the object of fisheries. In some regions of the Philippines, e.g. the Samar Sea, the jellyfish are harvested commercially for export as processed food. The fisheries for a small sergestid crustacean and the fry of the fish of the goby family, in certain estuarine areas are further examples of regionally important plankton fisheries. Milkfish (Chanos chanos) fry fisheries and the capture of shrimp larvae constitute a special case of plankton harvest with subsequent aquaculture activity. 133
135 Dynamics and Linkages PLANKTON IN TROPICAL OCEANS The critical factor determining primary production in tropical oceans in general is not availability of light, but rather the rate of supply of nutrients. Nutrients are almost continuously present but usually at very low concentrations. Coastal influences even at some distance offshore, local climate, terrestrial run-off, local upwelling, and other factors such as local gyres or internal waves, which could be responsible for on-shelf transport of nutrients, can all influence productivity and even simulate a seasonal cycle. In the nearshore coastal areas, phytoplankton production is enhanced through increased nutrient availability due to coastal enrichment and faster regeneration. Land-mass effects include the input of nutrients and trace metals, but also of organic factors such as humic acids and other bacterial products. This nutrient supply, together with other physical, chemical and biological factors, is subject to extreme variations in shallow tropical waters. Primary production rates of 1500 mgc/m 3 /day ( gc/m 2 /yr) have been measured at the surface in the coastal Indian Ocean. Sudden increases in production and blooms are at best shortlived and follow pulses of increased nutrient supply (run-off after heavy rains or increased turbulent mixing due to monsoonal winds or typhoons). In recent years, there are indications of more frequent harmful algal blooms that pose serious public health issues and entail major economic losses. In areas adjacent to the Sulu and Sulawesi Seas, these are almost exclusively caused by the thecate dinoflagellate Pyrodinium bahamense var. compressum. As can be expected, breeding cycles of marine organisms tend towards a pattern such that larvae or meroplankton are more abundant when nutritional conditions are favorable. This often coincides with the spring season in higher latitudes. There are indications that breeding periods are also fairly specific for tropical benthic animals though reproductive periods may be extended. The main characteristics of warm waters is that different benthic species breed at different times, the period ranging over most of the year, so that at any time a considerable abundance of meroplanktonic larvae may be found in neritic waters- and further offshore- in contrast to the observations for temperate seas. Lunar periodicity and monsoonal influences are also known to play a role in meroplankton abundance and breeding cycles. Meroplankton such as crab, shrimp and polychaete larvae, may be particularly significant in coral reefs and atolls. Overall abundance is known to undergo diurnal variations, with swarms of ostracods and other epibenthic forms dominating during nighttime. Zooplankton drifting across a reef can be depleted significantly by the various reef predators, most prominently the coral polyps themselves. Open ocean plankton is known to include meroplankton (Raymont, 1983). Typical examples are among decapod crustaceans such as the phyllosoma larvae of lobsters, which remain drifting for more than two months. They appear to be able to delay metamorphosis when occurring over great depths. Such ability would increase the 134
136 chances of survival and successful settlement. They share this characteristic with other species over a wide range of invertebrate taxa, e.g. cirriped crustaceans, bivalve mollusks, and polychaetes, but little is known about the physical, chemical and biological factors controlling the acceleration or delay in metamorphosis. Transport of larvae by currents across marginal seas such as the Sulu and Sulawesi Seas and much larger distances is therefore entirely possible. However, the fact remains that meroplankton remains near the coast, and only a small percentage of the stragglers swept offshore will survive. Among the tropical ichthyoplankton the characteristic leaf-like leptocephalus larvae of anguilliform fishes is the best-known example of an extended duration of larval period. In the span of two weeks, a drifting fish larva can be transported almost 1000 km by currents at the moderate speed of 2 knots. PLANKTON IN THE SSME The Sulu and Sulawesi Seas which are bordered by major islands with important river systems (particularly on the island of Borneo) have in general a much higher primary productivity ( gc/m 2 /yr) than the open tropical ocean. This primary productivity would translate into a secondary production of mgc/m 3. One of the early references on the plankton of the Sulu and Sulawesi Seas confirms that a distinct seasonal change in the abundance of zooplankton occurs with an appreciable increase from spring to summer (Raymont, 1983). Recent studies at the University of the Philippines Marine Science Institute (UPMSI) and collaborating insitutions on the influence of the South China Sea on Philippine shelf reef systems investigated nutrient characteristics and quantified depth-integrated primary productivity rates in the Sulu Sea as 195 gc/m 2 /yr. This value is slightly higher than those measured for both the oceanic and shoal areas of the South China Sea (San Diego- McGlone et al., 1999a). A study conducted by UPMSI addressed the effect of internal waves, a fortnightly occurrence due to topography and tidal currents (Apel et al., 1985), on the potential larval transport within Sulu Sea. It was found that the relative strength of the lead wave affects the distribution and densities of plankton, causing meroplankton accumulation. It was concluded that the internal wave may be an important transport mechanism for larvae and could contribute to the enhancement of shelf productivity (Juinio-Menez et al., 1999). Ongoing studies on plankton within the SSME are in areas between Tubbataha Reef and the eastern coast of Palawan (Juinio-Menez et al., 1999), in the Kalayaan Island Group, and Palawan waters (Tamse, 1999). 135
137 Importance SIGNIFICANCE TO THE FISHERIES WITHIN SSME The importance of plankton in the Sulu and Sulawesi Seas is best illustrated by its effect on the major economically important pelagic fish species dependent on it for food. The roundscads of the genus Decapterus are entirely plankton feeders and have their population center within this region and adjacent shallow seas. The scads rank second to the skipjack tuna among the fish resources of the Western Central Pacific Ocean. High zooplankton abundance coincides well with the main Decapterus fishing grounds. A similar situation is true for the mackerel Rastrelliger which depend on a wide range of phytoplankton and zooplankton for food, and the sardines of the genus Sardinella. All of the above mentioned fish taxa form part of the plankton community during the earliest stages of their respective life cycles. Hermes and Villoso (1987) measured the zooplankton biomass distribution in Sulu Sea during two seasons in 1982 and Relatively uniform biomass values (wet weight) from 3.1 to 8.7 g/100m 3 (wet weight equivalent to g/m 2 for the upper 100 m of the water column) were recorded in October. Values were more variable in February and reached a maximum of 24.8 g/100m in the eastern portion of Sulu Sea where local upwelling conditions could exist during this period (northeast monsoon). Studies on the potential transport and its significance to the distribution pattern of fish larvae were conducted. Larvae of Chanos chanos in the eastern part of the Sulu Sea was reported by Kumagai and Bagarinao (1979). During the northeast monsoon period the surface current provided a transport system from the westcoast of Panay towards northeastern Palawan, but was directed eastward during the southwest monsoon. Baguilat (1987) found tuna and tuna-like larvae belonging to the skipjack, yellowfin and bullet tuna widespread but never in large numbers. During October 1982, yellowfin and skipjack larvae were more abundant while bullet tuna concentrated in the southern Sulu Sea and dominated in February This coincides well with the reported seasonal peak spawning of the species. Larval and early juvenile fishes of the Sulu Sea and adjacent waters show that the most abundant larvae in belonged to the oceanic myctophid (26/100m 3 ) and gonostomatid (5/100m 3 ) families (Armada, 1997). Larvae of the largely benthic gobiid family were also abundant both in offshore areas and near the southeast coast of Palawan. Other important taxa near the slope/shelf of Palawan included the engraulid, bregmacerotid, lutjanid, and acanthurid families. In Tubbataha Reef, Dolar and Alcala (1993) found that fish larvae densities ranged from 0 to 47/m
138 ALGAL BLOOMS AND THEIR EFFECTS Red tide occurrence in the Philippines has been reported as early as The first outbreak of a toxic red tide occurred in Samar in June The dinoflagellate species causing the Paralytic Shellfish Poisoning (PSP) in the Philippines has been identified as Pyrodinium bahamense var. compressum. The first outbreak detected in Maqueda Bay, Samar spread to other areas reaching Calbayog the following month. The bays affected by red tide that year include Bulan, Sorsogon, and Balete Bay in Mati, Davao Oriental. Appendix 3 summarizes the historical occurrence of PSP in the Philippines from 1983 to 1996 while Figures 4.13 to 4.18 illustrate the spread of red tide within a span of 6 years. The sequential appearance of Pyrodinium in the Philippines as well as in Papua New Guinea and Western Borneo suggests a northerly spread of blooms and that major blooms coincide with ENSO (El Nino Southern Oscillation). Although a lot of research work has already been done on PSP, the direct cause of the sudden outbreak of PSP could not be confirmed. Some of the suspected causes of toxic blooms include the sudden and high influx of nutrients from the nearby lands and the occurrence of the southwest monsoon which brings a lot of rain. Low concentrations of the dinoflagellates, though, do not produce any toxic effects as exemplified by some areas found to harbor this dynaflagellate throughout the year without producing PSP. The upper limit of toxin levels for safe consumption of shellfish is 80µg/100 g of fish. A suspected transport route of the dinoflagellate include ballast water from ships. Threats The threats to the plankton component of the oceanic ecosystems are basically the same as those already well known as threats to the marine environment in general, but some of these affect plankton in a more direct way. The most problematic is probably the threat through eutrophication. Eutrophication has the potential to alter the composition of the plankton more dramatically by changing entire food webs. Furthermore, the deliberate fertilization of oligotrophic seas such as the Sulu Sea, in order to increase their production potential, may breed unforeseen catastrophes. Since our understanding of the plankton and the role of nutrients in primary production processes is still very limited at best, it cannot yet be predicted which of the primary producers would most benefit from additional nutrients. A shift in species composition and increased incidences of red tides must be expected as one of the consequences of any deliberate manipulation. It could well happen that the intervention would lead to explosive growth of non-indigenous and economically unusable or even toxic organisms, and irreversible damage to the environment. Therefore any attempts to fertilize oligotrophic sea areas should be strongly discouraged. 137
139 Figure 4.13 Red tide occurrences in
140 Figure 4.14 Red tide occurrences in
141 Figure 4.15 Red tide occurrences in
142 Figure 4.16 Red tide occurrences in
143 Figure 4.17 Red tide occurrences in
144 Figure 4.18 Red tide occurrences in
145 Overfishing is certainly not limited to changes in the composition of multispecies fish stocks, but the loss of top predators can temporarily lead to increases in the number of plankton feeders and, ultimately, the number of economically less valuable or even undesirable species. Increase in jellyfish populations are considered as one of the negative consequences of ecosystem overfishing. The consequences of global warming, which may contribute to increased irradiation, sea level rise, and increased turbulence, has the potential to effect changes in entire current systems, but can not be predicted with any high degree of certainty at present. However, it must be expected that primary productivity and therefore complete food webs will be greatly affected. One example is the possible increase in the frequency of red tides or the spread of diseases to marine organisms, resulting in damage to coral reefs, seagrass beds, and fish kills. Although, it is not very obvious, heavy metal and chemical pollution, sedimentation, and the impacts of human activities, pose indirect threats. The magnification or accumulation of pollutants such as heavy metals or pesticides through planktivores (filter feeding or otherwise) is already a well established fact. Sedimentation and siltation, apart from damaging delicate marine organisms such as corals through direct physical contact or abrasion, also effectively reduce the light penetration and therefore the rate of photosynthesis. Since ecosystems are linked through the food web, impacts wrought on one link will damage the entire system. VI. MARINE FISHERY RESOURCES OF NERITIC ECOSYSTEMS Ramon I. Miclat, Flordeliz Guarin and A. Rex F. Montebon Neritic ecosystems are among the most diverse ecosystems in the marine environment. Marine resources in this zone have been exploited as fisheries including those that use the zone as part of their migratory path. Herre (1953) listed approximately 2,145 fish species in the Philippine waters. These fishes are the bony fishes that constitute most of the fisheries in the coastal waters of the country. Stocks of migratory fishes such as tunas (e.g. yellowfin, skipjacks, etc), billfishes and seerfishes swim over large distances and have been recognized as a shared resource that are economically important fisheries in the SSME (Figure 4.19). Major Fishing Grounds within SSME The Philippines, Sulu and Sulawesi Seas cover four designated fishing regions, namely, Regions I, II, III, and IV out of the six regional fishing grounds in the Philippines used in the assessment of Philippine fisheries potential. The designation was based on the operational characteristics of the exploiting fisheries. The four fishing regions in the SSME cover some 15 statistical fishing areas of the BFAR. In the estimates done for the different statistical fishing areas in 1980, it was shown that Region IV (West Sulu Sea, 144
146 Palawan and Mindoro) had the highest potential estimates (462,000 MT) for demersal and pelagic fisheries. Major Fishery Resources of the Region COMMERCIAL VS. MUNICIPAL FISHERIES Marine fisheries in the Philippines are conventionally categorized into municipal and commercial fisheries based on gross tonnage of the fishing vessel. Small-scale fisheries that utilize boats of less than 3 gross tons and those which do not involve the use of water crafts fall under municipal fisheries. Fishing using vessels of 3 GT and above are considered commercial. Municipal fishing activities are allowed in coastal waters within 15 km from the shoreline. Commercial fishing is allowed only beyond the 15 km limit from the shoreline. Production estimates Table 4.8 exhibits the total marine fisheries production in the Sulu-Sulawesi Seas and its contribution to Philippine production. Production peak was attained in 1980 and 1986, contributing 43.29% and 42.11% respectively. A decline in production was experienced afterwards, dropping to 30.75% in Historically, municipal fisheries were the major contributor to fisheries. In 1987, commercial fisheries started to contribute more to the total landings coming mainly from the Moro Gulf and South Sulu Sea (WWF, 1998). This growth has not been sustained. Commercial production in Sulu-Sulawesi went down from 63% in 1970 to 54% in 1987 and finally to 33% in The combined average landing in from the Moro Gulf and South Sulu Sea totalled only 30%. Gear used The Sulu-Sulawesi area is characterized by multiple-gear fishery. The purse seine ranked first as commercial gear with 53% highest landings between (WWF, 1998). Figures 4.20 and 4.21 present the various commercial and municipal gear utilized in the SSME, respectively. Within the Sulawesi Sea, fishing is done with the aid of fish aggregating devices (FADs). These structures, which are anchored to the bottom, have floating platforms, usually made of bamboo while the subsurface parts have fronds of nipa or coconut leaves down to the depths of about 50 ft. 145
147 Figure 4.19 Fishery resource distribution in the SSME 146
148 Ring net 16% Bag net 16% Purse seine 51% Traw l 8% Muro-ami 4% Hook & line 3% Others 1% Danish seine 1% Figure 4.20 Commercial gear contribution to Sulu-Sulawesi s marine landings Beach seine, 11% Gill net, 16% Hook and line, 30% Purse seine/ ring net, 9% Bag net, 18% Spear, 2% Fish corral, 6% Long line, 2% Others, 17% Fish spot, 1% Figure 4.21 Municipal gear contribution to Sulu-Sulawesi s marine landings 147
149 Table 4.8 Total marine fisheries production (commercial and municipal) in the Sulu-Sulawesi Seas from 1978 to Year Cuyo Pass Moro Gulf East Sulu South Sulu West Sulu Total % Contribution to Philippine prodxn ,719 58, ,706 8, , ,498 57, , , , ,523 74, , , , , ,079 71, , , , , ,844 74, , , , , , ,601 98, , , , , ,741 94, , , , , ,634 94, , , , , ,475 99, , , , , ,485 93, , , ,393 46,190 24, ,417 17, , , , , ,035 13, , , , , ,258 8, , , ,016 96, ,085 13, , , ,290 90, , , (Entries for West Sulu for years and lack the data. Using available data from , an average of 7.5% was contributed by the municipal fosheries in West Sulu to the whole of Sulu- Sulawesi marine landings. Missing data in , due to differences in methodology, coincided with the transfer of data collection from BFAR to BAS. No municipal data were available in 1991). PELAGIC FISHERIES PRODUCTION Pelagic fisheries refer to the exploitation of a diverse group of fishes living near the surface that include small pelagics, tuna and tuna-like fishes and large pelagics. Small pelagics are characterized by short life spans having an average of about 2.3 years, fast growth rate and high mortality rates (WWF, 1998) while large pelagics have long lifespans, relatively slow growth rates and low turnover rates. Mean annual landings of pelagics for totalled 380,000 metric tons contributed by small pelagics (238,631 MT or 63%), tuna and tuna like fishes (125,163MT or 33%) and large pelagics (16,724 MT or 4%) (WWF, 1998). 148
150 Small pelagics The small pelagic fisheries in the Sulu-Sulawesi are composed of roundscads (Decapterus spp.) as the dominant species contributing 35%. The others include sardines (Sardinella spp.), anchovies (Stolephorus spp.) and mackerels (Rastrelliger spp.). Large pelagics The large pelagics landing is dominated by cavallas (43%), Spanish mackerel (19.6%) and barracuda (12.1%). They contributed 75% of the mean large pelagic catch from (WWF, 1998). Other large pelagics include marlin, sailfish, swordfish and rainbow runner. Tuna and tuna-like fisheries Tuna fisheries in the Philippines are undertaken by both municipal and commercial fishers. General Santos City serves as one of the tuna capital of the Philippines where tuna fishing occurs the entire year though influenced by the monsoon months. Other important tuna fishing grounds are depicted in Figure Municipal fishing operations of tuna commonly employ handlines with yellowfin and bigeye tuna as target species. The handliners operate around payaos which were introduced in Sarangani Bay. The lucrative tuna fishery later filled the entire bay with payaos which are now seen even farther offshore. Frigate tuna (Auxis thazard) and bullet tuna (Auxis rochei) dominate the landings of tuna and tuna like fishes contributing 32%. Yellowfin tuna (Thunnus albacares) and big eye (Thunnus obesus) make up 27% while skipjack (Katsuwonus pelamis) 27% and eastern little tuna (Euthynnus affinis) contribute 13%. These six species are among the twentyone species of tuna that have been identified in the Philippines and compose the tuna fishery due to their high export value. A tuna research project was implemented in which undertook the tuna tagging activities to determine the biology including the migration route of selected species of tuna (Figures 4.23 to 4.24). Eight areas were monitored for landed catch of tuna. Of these eight areas monitored in 1993, % of the total landed catch came from the sampling sites of Zamboanga City, 34.36% from General Santos and 4.69% from Pagadian City (all in Mindanao). The remaining 3% came from various areas namely, Masinloc and Subic (Zambales), Atimonan (Quezon), Puerto Princesa City (Palawan) and Tandag. Skipjack Skipjacks are distributed in tropical and subtropical waters across the Pacific. In the western Pacific they are found between 40 o N-40 o S in areas associated with warm poleward flowing currents while in the eastern Pacific, they are distributed between 30 o N- 30 o S due to colder currents flowing toward the equator (Figure 4.25; PRIMEX and SPC, 1993). Distribution of juvenile skipjack (smaller than 15 cm) is between the northern and southern limits of the 24ºC surface isotherm. The highest larval concentration is between 10 o N and 10 o S. 149
151 The patchy distribution of skipjack may be associated with the similarly patchy distribution of zooplankton and micronekton. Skipjack larvae are abundant in Samar Sea during February and March while Ticao Pass and Burias Pass show abundance during July and September. In the Sulu Sea, skipjack tuna are reported to be more abundant during October and November and less abundant in February and March. Yellowfin The distribution of yellowfin tuna in the Pacific is similar to that of skipjack, ranging from 40 o N 35 o S in the western Pacific and 35 o N-33 o S in the eastern Pacific (Figure 4.26; PRIMEX and SPC, 1993). In 1993, it was reported that yellowfin are restricted to the area bounded by the 26 o C isotherm being found in tropical waters the whole year and in higher latitudes only during the summer months. Yellowfin tuna has a broader distribution than skipjack due to its physiological makeup. The presence of swimbladder and large pectoral fins allow them to maintain hydrostatic equilibrium at a basal swimming speed slower than that of skipjack. This allows for lower metabolic rate and lower oxygen consumption permitting them to move around warm surface waters and in cooler subsurface waters. Like the skipjack tuna, the distribution of yellowfin tuna coincide with areas of high plankton concentration occurring in waters surrounding the Philippine archipelago. Both juvenile and adults were recorded to be abundant in Moro Gulf and Sulu Sea throughout the year. Yellowfin larvae are suspected to be present all over the Philippine waters, however, documentation were made only in limited areas such as the Sulu Sea, Ragay Gulf, Burias Pass, Ticao Pass, and Northern Samar Sea. Juvenile yellowfin are caught the whole year in Philippine waters. The larvae are reported in February and March, May and September in Ragay Gulf, Burias Pass and Ticao Pass (PRIMEX and SPC, 1993). In the Sulu Sea, considered as a breeding ground, yellowfin larvae occur during February and March and October and November. Bigeye Bigeye tuna are distributed across the Pacific Ocean between about 45 o N and 40 o S in the west and 40 o N and 35 o S. Bigeye tuna larvae are widely distributed in the equatorial waters of the western, central, and eastern Pacific. Compared to the skipjack and yellowfin tuna, bigeye tuna have a higher tolerance to low oxygen and a higher thermoregulatory ability, allowing them to dive to greater depths. Bigeye larvae are distributed in the western Pacific between 30 o N and 20 o S and in the eastern Pacific between the equator and 20 o N (Figure 4.27; PRIMEX and SPC, 1993). 150

152 Figure 4.22 Important tuna fishing grounds for commercial fisheries 151
The Maltese Islands: Geography
 The Maltese Islands: Geography The Maltese Archipelago comprises a group of small low islands aligned in a NW-SE direction. At their extreme points the Maltese Islands fall within the following points:
Protection of the Sulu Sulawesi Marine Ecoregion Philippines Experience
 Protection of the Sulu Sulawesi Marine Ecoregion Philippines Experience Presented during the EAS Congress 2015 On 18 November 2015 in Danang, Vietnam Presentation Outline I. Philippines SSME II. Issues
SCALING AND AMPLIFYING MPAS FOR THE EFFECTIVE CONSERVATION OF THE CENTER OF CENTER OF MARINE BIODIVERSITY,
 SCALING AND AMPLIFYING MPAS FOR THE EFFECTIVE CONSERVATION OF THE CENTER OF CENTER OF MARINE BIODIVERSITY, THE VERDE ISLAND PASSAGE A. Rex F. Montebon, Ph.D. 2015 EAS Congress Furama Resort, Danang, Vietnam
Contribution of Marine Protected Areas to the Blue Economy and Sustainable Fisheries
 2015/HLPD-FSBE/012 Session: 1 Contribution of Marine Protected Areas to the Blue Economy and Sustainable Fisheries Purpose: Information Submitted by: Philippines High Level Policy Dialogue on Food Security
SOLIDARIDAD 2020 AGENDA
 SOLIDARIDAD 2020 AGENDA A Four-Part National Development Agenda for the Philippines I. Solidaridad 2020 Main Agenda (Food and Bioenergy Park) II. Solidaridad 2020 River Basin Agenda III. Solidaridad 2020
Title/Name of the area: Chwaka Bay, Zanzibar
 Title/Name of the area: Chwaka Bay, Zanzibar Presented by: Dr. Charles Lugomela, Ag. Head, Department of Aquatic Sciences and Fisheries, University of Dar es Salaam, P.O. Box 35064 Dar es Salaam, Tanzania
Glacial Origins and Features of Long Island
 Glacial Origins and Features of Long Island Interior Coastal Plain Continental Shelf Long Island s Geology 0 Ma Phanerozoic 540 Ma Proterozoic 2500 Ma Archean 3800 Ma Hadean 4600 Ma C M P Geologic Time
Virginian Atlantic (Ecoregion 8)
") Virginian Atlantic (Ecoregion 8) Background The Virginian Atlantic Ecoregion extends from the south side of Cape Cod to Cape Hatteras in North Carolina. The waters of the ecoregion are a mix of cold and
Virginian Atlantic (Ecoregion 8) Background The Virginian Atlantic Ecoregion extends from the south side of Cape Cod to Cape Hatteras in North Carolina. The waters of the ecoregion are a mix of cold and
ReefFix. May, For the Organization of American States (OAS) and the Inter-American Biodiversity Information Network (IABIN)
 and the Inter-American Biodiversity Information Network (IABIN)") Fondation pour la Protection de la Biodiversité Marine FoProBiM B.P. 642 www.foprobim.org (mail) 6011 Henning St. Port-au-Prince, Haiti Bethesda, MD 20817 ReefFix Rapid Assessment of the Economic Value
Fondation pour la Protection de la Biodiversité Marine FoProBiM B.P. 642 www.foprobim.org (mail) 6011 Henning St. Port-au-Prince, Haiti Bethesda, MD 20817 ReefFix Rapid Assessment of the Economic Value
Chapter Objectives. Describe the dominant landforms and natural resources of Southeast Asia. Discuss Southeast Asia s climate and vegetation.
 Chapter Objectives Describe the dominant landforms and natural resources of Southeast Asia. Discuss Southeast Asia s climate and vegetation. The Land Section 1 Objectives Describe how tectonic plates and
Coral Reef Monitoring in the Philippines
 Coral Reef Monitoring in the Philippines HAZEL O. ARCEO The Marine Science Institute College of Science, University of the Philippines Diliman, Quezon City 1101 State and Pressures of Coral Reefs Philippine
LATIN AMERICA / CARIBBEAN COIBA NATIONAL PARK PANAMA
 LATIN AMERICA / CARIBBEAN COIBA NATIONAL PARK PANAMA WORLD HERITAGE NOMINATION IUCN TECHNICAL EVALUATION COIBA NATIONAL PARK (PANAMA) ID Nº 1138 Bis Background note: Coiba National Park was nominated for
The Regional Coral Reef Task Force and Action plan. 27 th ICRI. Cairns Australia July 2012
 The Regional Coral Reef Task Force and Action plan 27 th ICRI Cairns Australia July 2012 Western Indian Ocean Region East Africa mainland states Indian Ocean Islands states Biogeographic division of the
Mar Jerie Meacham / DENR MOO 2012 Photo Competition
 Mar Jerie Meacham / DENR MOO 2012 Photo Competition Within ADB s Southeast Asia Department, CTI is a subprogram of the Brunei-Indonesia-Malaysia-Philippines East ASEAN Growth Area. ADB support to the Coral
Provincial Development and Physical Framework Plan Province of Capiz
 3.2.3 Protection Areas Protection areas (Map 11) which include areas under the categories of NIPAS, Non-NIPAS, environmentally constrained and the military reservations are described as follows: a) NIPAS
Tubbataha Reefs Natural Park Philippines
 EVALUATION REPORT Tubbataha Reefs Natural Park Philippines Location: Cagayancillo, Palawan, Philippines; Sulu Sea, Pacific Ocean Global Ocean Refuge Status: Nominated (2017), Evaluated (2017) MPAtlas.org
Alaskan/Fjordland Pacific (Ecoregion 22)
") Alaskan/Fjordland Pacific (Ecoregion 22) Background The Alaskan/Fjordland Pacific Ecoregion is an area of abundant marine resources. The ecoregion begins at Vancouver Island and moves up the Gulf of Alaska
Alaskan/Fjordland Pacific (Ecoregion 22) Background The Alaskan/Fjordland Pacific Ecoregion is an area of abundant marine resources. The ecoregion begins at Vancouver Island and moves up the Gulf of Alaska
Coverage of Mangrove Ecosystem along Three Coastal Zones of Puerto Rico using IKONOS Sensor
 Coverage of Mangrove Ecosystem along Three Coastal Zones of Puerto Rico using IKONOS Sensor Jennifer Toledo Rivera Geology Department, University of Puerto Rico, Mayagüez Campus P.O. Box 9017 Mayagüez,
ECOREGIONAL ASSESSMENT EQUATORIAL PACIFIC EXECUTIVE SUMMARY
 ECOREGIONAL ASSESSMENT EQUATORIAL PACIFIC The Nature Conservancy, Fundación Agua, EcoCiencia, Fundación Jatun Sacha, CDC Ecuador, CDC UNALM 2004. Portafolio de Sitios Prioritarios para la Conservación
How South Africa is making progress towards the Aichi 2020 Target 11
 How South Africa is making progress towards the Aichi 2020 Target 11 Montreal, Canada 2 May 2016 Oceans and Coasts Content Protected area considerations and progress 1994-2010 Terrestrial Protected Area
Twelve Apostles Marine National Park Australia
 EVALUATION REPORT Twelve Apostles Marine National Park Australia Location: Victoria, Australia coastal waters Global Ocean Refuge Status: Nominated (2017), Evaluated (2017) MPAtlas.org ID: 7703885 Manager(s):
Bazaruto Archipelago National Park-Mozambique. Mozambique. Workshop on MPAs- Is MPAs a useful tool In Fisheries management?
 Bazaruto Archipelago National Park-Mozambique Workshop on MPAs- Is MPAs a useful tool In Fisheries management? Norway ; 24-25 25 October 2006 By Paula Santana Afonso Institute for Fisheries Research Mozambique
Information on Ecological and Biological Significant Marine Areas in Albania
 Information on Ecological and Biological Significant Marine Areas in Albania The report is assembled from the draft strategic plan for marine and coastal protected areas in Albania, supported by the GEF-UNDP
Kermadec. Ocean Sanctuary
 Kermadec Ocean Sanctuary Kermadec Ocean Sanctuary, New Zealand Pacific Remote Islands National Marine Monument, United States Coral Sea Marine Reserve, Australia Proposed Pitcairn Marine Reserve, United
Clam Framework Map Book NEFMC Habitat Advisory Panel Meeting, April 3, 2018
 #3 Clam Framework Map Book NEFMC Habitat Advisory Panel Meeting, April 3, 218 Page 4 Management areas relevant to Clam dredge framework. Includes Great South Channel Habitat Management Area, divided into
Chapter 3 PHYSICAL FEATURES
 44 CHAPTER 3 PHYSICAL FEATURES 45 Chapter 3 PHYSICAL FEATURES T his chapter provides background information on the land characteristics, hydrology, water quality, and climate of the profile area, which
Unit 1 Lesson 1: Introduction to the Dry Tortugas and Sustainable Seas Expedition
 Unit 1 Lesson 1: Introduction to the Dry Tortugas and Sustainable Seas Expedition Lesson Objectives: Introduce students to the historical, geographic, and ecological importance of the Dry Tortugas. Introduce
The Geological Pacific Northwest. Wednesday February 6, 2012 Pacific Northwest History Mr. Rice
 The Geological Pacific Northwest Wednesday February 6, 2012 Pacific Northwest History Mr. Rice 1 Free Response #2 Please do not simply list the items for this response. Full sentences!!! Minimum of 3-5
2012. Proceedings of the 11 European Geoparks Conference. AGA Associação Geoparque Arouca, Arouca, 5-6.
 References to this volume It is suggested that either the following alternatives should be used for future bibliographic references to the whole or part this volume: th Sá, A.A., Rocha, D., Paz, A. & Correia,
Monitoring the Environmental Status of the Heart of Borneo
 Monitoring the Environmental Status of the Heart of Borneo By: Stephan Wulffraat The Heart of Borneo conservation initiative has been going on now for several years and has gained increasing support from
Luke 6:38 JUNE 1, 2017 JANUARY 31, 2018 (E.Y )
") Luke :8 GIVE, AND IT WILL BE GIVEN TO YOU. A GOOD MEASURE, PRESSED DOWN, SHAKEN TOGETHER AND RUNNING OVER, WILL POURED INTO YOUR LAP. FOR WITH THE MEASURE YOU USE, IT WILL BE MEASURED TO YOU. JUNE 1, 2017
Luke :8 GIVE, AND IT WILL BE GIVEN TO YOU. A GOOD MEASURE, PRESSED DOWN, SHAKEN TOGETHER AND RUNNING OVER, WILL POURED INTO YOUR LAP. FOR WITH THE MEASURE YOU USE, IT WILL BE MEASURED TO YOU. JUNE 1, 2017
ECORREGIONAL ASSESSMENT: EASTERN CORDILLERA REAL ORIENTAL PARAMOS AND MONTANE FORESTS
 ECORREGIONAL ASSESSMENT: EASTERN CORDILLERA REAL ORIENTAL PARAMOS AND MONTANE FORESTS The Nature Conservancy, EcoCiencia y Fundación AGUA. 2005. Evaluación Ecorregional de los Páramos y Bosques Montanos
GLACIER STUDIES OF THE McCALL GLACIER, ALASKA
 GLACIER STUDIES OF THE McCALL GLACIER, ALASKA T John E. Sater* HE McCall Glacier is a long thin body of ice shaped roughly like a crescent. Its overall length is approximately 8 km. and its average width
TOWARDS SUSTAINABLE MANAGEMENT OF MARINE AND COASTAL HABITATS ASIA- PACIFIC DAY FOR THE OCEAN
 TOWARDS SUSTAINABLE MANAGEMENT OF MARINE AND COASTAL HABITATS WANNAKIAT THUBTHIMSANG PHUKET MARINE BIOLOGICAL CENTER, DMCR, THAILAND ASIA- PACIFIC DAY FOR THE OCEAN 20 NOVEMBER 2018, CONFERENCE ROOM 4,
Submission of REPUBLICA ORIENTAL DEL URUGUAY. to the COMMISSION ON THE LIMITS OF THE CONTINENTAL SHELF
 Submission of REPUBLICA ORIENTAL DEL URUGUAY to the COMMISSION ON THE LIMITS OF THE CONTINENTAL SHELF pursuant to provisions of article 76, paragraph 8, of the United Nations Convention on the Law of the
Chapter 20. The Physical Geography of Africa South of the Sahara
 Chapter 20 The Physical Geography of Africa South of the Sahara Chapter Objectives Identify the major landforms, water systems, and natural resources of Africa south of the Sahara. Describe the relationship
Case Study: 1. The Clarence River Catchment
 Case Study: 1. The Clarence River Catchment The NSW coastline is a great natural asset, making an enormous contribution to the economy. The resources of coastal catchments such as the Clarence River Catchment,
Region 1 Piney Woods
 Region 1 Piney Woods Piney Woods 1. This ecoregion is found in East Texas. 2. Climate: average annual rainfall of 36 to 50 inches is fairly uniformly distributed throughout the year, and humidity and temperatures
There are actually six geographic sub-regions, three in both the uplands and the lowlands.
 6 Regions of AR Although Arkansas is most easily divided into two distinct geographical regions, the northwestern uplands and the southeastern lowlands, this description does not accurately portray the
Ocho Rios, Jamaica GEF-IWCAM AND IABIN INDICATORS MECHANISM WORKSHOP March TNC s Marine Protected Area Work.
 TNC s Marine Protected Area Work in the Caribbean GEF-IWCAM AND IABIN INDICATORS MECHANISM WORKSHOP 10-12 March 2008 Ocho Rios, Jamaica Caribbean Decision-Support System 3 years (2003-2006) $2.2 million
APPENDIX A TERMS OF DESIGNATION
 247 248 ABOUT THIS DOCUMENT On May 11, 1994 the National Oceanic and Atmospheric Administration (NOAA) published the final Olympic Coast National Marine Sanctuary Regulations (59 FR 24586). This official
What is an Marine Protected Area?
 Policies, Issues, and Implications of Marine Protected Areas Kara Anlauf University of Idaho Before the House Subcommittee on Fisheries Conservation, Wildlife and Oceans April 29, 2003 What is an Marine
Spatial Distribution and Characteristics of At-Risk Species in the Southeast U.S.
 Nicholas Institute for Environmental Policy Solutions Scoping Document Part 2 Exploratory Analysis of Characteristics and Trends of At-Risk Species in the Southeast U.S. Spatial Distribution and Characteristics
Areas Beyond National Jurisdiction and CTI CFF Seascape Concept Hendra Yusran Siry
 Areas Beyond National Jurisdiction and CTI CFF Seascape Concept Hendra Yusran Siry Secretary for Coordination and External Affairs Interim-Regional Secretariat, The Coral Triangle Initiative on Coral Reefs,
Elkhorn Slough Tidal Wetland Project
 Elkhorn Slough Tidal Wetland Project Joint Meeting Strategic Planning Team and Science Panel September 23, 2009 Funding National Oceanic and Atmospheric Admin. David and Lucille Packard Foundation Resources
Michipicoten Island Regional Plan
 Michipicoten Island Regional Plan This is one of twenty Regional Plans that support implementation of the Lake Superior Biodiversity Conservation Strategy (Strategy). The Strategy, prepared and overseen
SUPPORT TO WATER RESOURCES MANAGEMENT IN THE DRINA RIVER BASIN DRAFT ROOF REPORT INTRODUCTION AND GENERAL APPROACH
 SUPPORT TO WATER RESOURCES MANAGEMENT IN THE DRINA RIVER BASIN DRAFT ROOF REPORT INTRODUCTION AND GENERAL APPROACH Nadja Zeleznik, REC Public Concultation Beograd, Serbia, 4 July 2017 1 1. Introduction
STUDY GUIDE. The Land. Chapter 29, Section 1. Both. Terms to Know DRAWING FROM EXPERIENCE ORGANIZING YOUR THOUGHTS
 Chapter 29, Section 1 For use with textbook pages 719 724. The Land Terms to Know cordilleras Parallel mountain ranges and plateaus (page 719) archipelago A group of islands (page 720) insular Relating
Estuaries of South America
 Gerardo M.E. Perillo Maria Cintia Piccolo Mario Pino-Quivira (Eds.) Estuaries of South America Their Geomorphology and Dynamics With 102 Figures and 20 Tables Springer 1 What Do We Know About the Geomorphology
Modification of the Stratification and Velocity Profile within the Straits and Seas of the Indonesian Archipelago
 DISTRIBUTION STATEMENT A. Approved for public release; distribution is unlimited. Modification of the Stratification and Velocity Profile within the Straits and Seas of the Indonesian Archipelago Arnold
The Regional Coral Reef Task Force and Action plan. Indian Ocean Day. Reunion December 2011
 The Regional Coral Reef Task Force and Action plan Indian Ocean Day Reunion December 2011 Western Indian Ocean Region East Africa mainland states Indian Ocean Islands states Biogeographic division of the
Water quality management in the Lake Baikal region of Russia
 Lomonosov Moscow State University Faculty of Geography Department of Environmental Management Water quality management in the Lake Baikal region of Russia Dr., Prof. Sergey Kirillov Dr., Prof. Mikhail
ECOREGION PLANNING AND CONSERVATION IN FIJI FOR A SUSTAINABLE OCEAN. (From planning to mobilization into action)
") ECOREGION PLANNING AND CONSERVATION IN FIJI FOR A SUSTAINABLE OCEAN (From planning to mobilization into action) By Ms Kesaia Tabunakawai and Mr Francis Areki World Wide Fund for Nature South Pacific Programme
ECOREGION PLANNING AND CONSERVATION IN FIJI FOR A SUSTAINABLE OCEAN (From planning to mobilization into action) By Ms Kesaia Tabunakawai and Mr Francis Areki World Wide Fund for Nature South Pacific Programme
Geoscape Toronto The Oak Ridges Moraine Activity 2 - Page 1 of 10 Information Bulletin
 About 13,000 years ago as the Laurentide Ice Sheet melted, glacial meltwater accumulated between the ice sheet and the Niagara Escarpment. This formed a lake basin into which gravel and sand were deposited.
FOR SALE Belize s World Heritage
 FOR SALE Belize s World Heritage The Pelican Cayes A Hotspot of Biodiversity and Destruction In the Belize Barrier Reef Reserve World Heritage Site March 2003 In the Pelican Cays, mangrove cays exhibit
47I THE LAS ANIMAS GLACIER.
 THE LAS ANIMAS GLACIER. ONE of the largest of the extinct glaciers of the Rocky Mountains was that which occupied the valley of the Las Animas river. This stream originates in the San Juan mountains in
EXECUTIVE SUMMARY. Partial Amended Submission to the Commission on the Limits of the Continental Shelf in Respect of the North Area
 EXECUTIVE SUMMARY Partial Amended Submission to the Commission on the Limits of the Continental Shelf in Respect of the North Area Pursuant to Article 76 of the United Nations Convention on the Law of
Section 2 North Slope Ecoregions and Climate Scenarios
 Section 2 North Slope Ecoregions and Climate Scenarios North Slope Ecoregions The geographic/ecological scope of the workshop will be freshwater and terrestrial systems of the North Slope of Alaska, with
Alpine Glacial Features along the Chimney Pond Trail, Baxter State Park, Maine
 Maine Geologic Facts and Localities September, 2009 Alpine Glacial Features along the Chimney Pond Trail, Baxter State Park, Maine 45 54 57.98 N, 68 54 41.48 W Text by Robert A. Johnston, Department of
THE STORY OF MALDIVES. DR MARIYAM SHAKEELA Minister Of Environment and Energy Republic Of Maldives
 THE STORY OF MALDIVES DR MARIYAM SHAKEELA Minister Of Environment and Energy Republic Of Maldives Significance of ecotourism & coral reefs on regional economy Coral reefs are among the most diverse and
2.0 PARK VISION AND ROLES
 2.0 PARK VISION AND ROLES 2.1 Significance in the Protected Area System Marble Range and Edge Hills provincial parks protect 6.8% of the Pavillion Ranges Ecosection, which is located in the Southern Interior
Malpelo Fauna and Flora Sanctuary Colombia
 EVALUATION REPORT Malpelo Fauna and Flora Sanctuary Colombia Location: South Pacific Global Ocean Refuge Status: Nominated (2017), Evaluated (2017) MPAtlas.org ID: 3803 Manager(s): Nancy Murillo Bohórquez
What Is An Ecoregion?
 Ecoregions of Texas What Is An Ecoregion? Ecoregion a major ecosystem with distinctive geography, characteristic plants and animals, and ecosystems that receives uniform solar radiation and moisture Sometimes
HOSPITALITY INVESTMENT CONFERENCE PHILIPPINES 2016 TOURISM INVESTMENT IN THE PHILIPPINES
 HOSPITALITY INVESTMENT CONFERENCE PHILIPPINES 2016 TOURISM INVESTMENT IN THE PHILIPPINES TOURISM ENTERPRISE ZONES AND FLAGSHIP TEZS A New Look in Tourism Development R.A. 9593 Tourism Act of 2009 tourism
Seismic Microzonation in Hurghada City (EGYPT)
") Available online at www.sciencedirect.com Procedia Engineering 14 (2011) 2856 2863 The Twelfth East Asia-Pacific Conference on Structural Engineering and Construction Seismic Microzonation in Hurghada
Available online at www.sciencedirect.com Procedia Engineering 14 (2011) 2856 2863 The Twelfth East Asia-Pacific Conference on Structural Engineering and Construction Seismic Microzonation in Hurghada
THE TWENTY FIRST ANNUAL SOUTHERN AFRICA REGIONAL CLIMATE OUTLOOK FORUM MID-SEASON REVIEW AND UPDATE
 STATEMENT FROM THE TWENTY FIRST ANNUAL SOUTHERN AFRICA REGIONAL CLIMATE OUTLOOK FORUM (SARCOF-21) MID-SEASON REVIEW AND UPDATE, SADC HEADQUARTERS, GABORONE, BOTSWANA, 5 8 DECEMBER 2017. SUMMARY The bulk
Hudson Bay Lowlands Proposed Protected Areas
 Hudson Bay Lowlands Proposed Protected Areas Hudson Bay Lowlands Proposed Protected Areas The Protected Areas Initiative has identified portions of the Hudson Bay Lowlands region that have significant
GLACIATION. The Last Ice Age (see Chapter 12) and. Pleistocene Ice Cap. Glacial Dynamics 10/2/2012. Laurentide Ice Sheet over NYS
 and. Pleistocene Ice Cap. Glacial Dynamics 10/2/2012. Laurentide Ice Sheet over NYS") GLACIATION and New York State Prof. Anthony Grande The Last Ice Age (see Chapter 1) The Pleistocene Epoch began 1.6 mya. During this time, climates grew colder. There were numerous ice ages starting 100,000000
GLACIATION and New York State Prof. Anthony Grande The Last Ice Age (see Chapter 1) The Pleistocene Epoch began 1.6 mya. During this time, climates grew colder. There were numerous ice ages starting 100,000000
NOTICE OF INTENT MAPS WITH DESCRIPTIONS
 NOTICE OF INTENT MAPS WITH DESCRIPTIONS Location Map(s) to Accompany Notice of Intent The small corner map embedded in the lower left corner of the large map above shows the location of the three national
3.0 OVERVIEW OF HUECO BOLSON
 3.0 OVERVIEW OF HUECO BOLSON The Hueco Bolson covers about 2,500 square miles, or 1.6 million acres in New Mexico, Texas, and Chihuahua (Figure 3-1). In Texas, the Hueco overlies portions of El Paso and
Mark West Creek Flow Study Report
 Mark West Creek Flow Study Report Biology and Geology of Mark West Creek The headwaters of Mark West Creek are located in the Mayacamas Mountain range, which border Napa and Sonoma County, where it then
Wednesday, April 4, 2018
 Wednesday, April 4, 2018 Physical Geography of Japan Objective: Outline the countries and territories that are included in East Asia. Describe the main physical features and climate types of each country.
IMPACTS OF THE RECENT TSUNAMI ON THE BUNDALA NATIONAL PARK THE FIRST RAMSAR WETLAND IN SRI LANKA
 IMPACTS OF THE RECENT TSUNAMI ON THE BUNDALA NATIONAL PARK THE FIRST RAMSAR WETLAND IN SRI LANKA by C.N.B. Bambaradeniya, IUCN The World Conservation Union, Sri Lanka Country Office (Email: cnb@iucnsl.org)
RE Code Names Each regional ecosystem is given a three part code number e.g For example
 REGIONAL ECOSYSTEMS vegetation communities in a bioregion that are consistently associated with a particular combination of geology, landform & soil. The Queensland Herbarium regularly reviews and updates
Significant Ecological Marine Area Assessment Sheet
 Name: Doubtless Bay Significant Ecological Marine Area Assessment Sheet Summary: The reef systems of Doubtless Bay and adjoining reef edges of soft bottom habitat score as a high ranking ecological area.
The following ministries, departments and agencies of the Government of the Solomon Islands involved in the preparation of the Submission:
 Joint Submission to the Commission on the Limits of the Continental Shelf concerning the Ontong Java Plateau by the Federated States of Micronesia, Papua New Guinea and the Solomon Islands The Joint Submission
AGAP Antarctic Research Project Visualizing Data Learning About Antarctica From RADAR Data? Student Version
 AGAP Antarctic Research Project Visualizing Data Learning About Antarctica From RADAR Data? Student Version Name Date Image of Subglacial Lake network courtesy of NSF Ice Sheet: A large glacier that covers
Latin America. Physical Geography
 + Latin America Physical Geography + I. Landforms A. Caribbean & Central America 1. Mexico is dominated by two mountain chains, collectively called the Sierra Madre. A high plateau is situated in between.
LITTLE LOST MAN CREEK (LLM) (formerly USGS Gaging Station No )
 (formerly USGS Gaging Station No )") LITTLE LOST MAN CREEK (LLM) (formerly USGS Gaging Station No. 11482468) LOCATION: In Redwood National and State Park approximately 0.8 miles upstream from confluence with Prairie Creek and 3.2 miles northeast
LITTLE LOST MAN CREEK (LLM) (formerly USGS Gaging Station No. 11482468) LOCATION: In Redwood National and State Park approximately 0.8 miles upstream from confluence with Prairie Creek and 3.2 miles northeast
INTRODUCTION Background: Definitions Wetlands in Egypt Threats to Wetlands Wetland Services
 INTRODUCTION Background: Definitions Wetlands in Egypt Threats to Wetlands Wetland Services NATIONAL STRATEGY Mission: Goal Guiding Principles Objectives and Bases of Action Actions to Achieve Objectives
U.S. Activities in Puerto Rico, U.S. Virgin Islands and the Wider Caribbean. NOAA and the US Coral Reef Task Force
 U.S. Activities in Puerto Rico, U.S. Virgin Islands and the Wider Caribbean NOAA and the US Coral Reef Task Force U.S. Coral Reef Task Force Co-Chairs: National Oceanic and Atmospheric Administration (NOAA)
Economic valuation of Nha Trang Bay Marine Protected Area (MPA) to suggest a sustainable financing mechanism
 to suggest a sustainable financing mechanism") Economic valuation of Nha Trang Bay Marine Protected Area (MPA) to suggest a sustainable financing mechanism Student: Dang Nguyet Anh Supervisor: Prof. Naoko Kaida 28 th June 2012 Background What is Marine
Economic valuation of Nha Trang Bay Marine Protected Area (MPA) to suggest a sustainable financing mechanism Student: Dang Nguyet Anh Supervisor: Prof. Naoko Kaida 28 th June 2012 Background What is Marine
Proposed National Marine Conservation Area Reserve Southern Strait of Georgia PROJECT UPDATE Spring 2012
 Proposed National Marine Conservation Area Reserve Southern Strait of Georgia PROJECT UPDATE Spring 2012 National marine conservation areas (NMCAs) are established to protect, conserve and present examples
CITY OF LYNDEN STORMWATER MANAGEMENT PROGRAM REPORT MARCH 1, 2016
 CITY OF LYNDEN STORMWATER MANAGEMENT PROGRAM 2015 WATER QUALITY MONITORING REPORT CITY OF LYNDEN 300 4 TH STREET LYNDEN, WASHINGTON 98264 PHONE (360) 354-3446 MARCH 1, 2016 This document serves as an attachment
Glaciers Earth 9th Edition Chapter 18 Mass wasting: summary in haiku form Glaciers Glaciers Glaciers Glaciers Formation of glacial ice
 1 2 3 4 5 6 7 8 9 10 11 12 13 14 15 Earth 9 th Edition Chapter 18 Mass wasting: summary in haiku form Ten thousand years thence big glaciers began to melt - called "global warming." are parts of two basic
OUR COUNTRY INDIA L OCATIONAL SETTING
 7 India is a country of vast geographical expanse. In the north, it is bound by the lofty Himalayas. The Arabian Sea in the west, the Bay of Bengal in the east and the Indian Ocean in the south, wash the
Malpelo Fauna and Flora Sanctuary Colombia
 EVALUATION REPORT Malpelo Fauna and Flora Sanctuary Colombia Location: South Pacific Global Ocean Refuge Status: Nominated (2017), Evaluated (2017) MPAtlas.org ID: 3803 Manager(s): Paola Andrea Rojas Malagón,
Natural Resources Management in the Philippines
 Natural Resources Management in the Philippines Edgardo E Tongson VP-Programmes Programmes,, WWF-Philippines Presented at Swedish Biodiversity Centre s annual conference Sept. 28-29, 29, 2006 Outline Background
Glaciers and Glaciation Earth - Chapter 18 Stan Hatfield Southwestern Illinois College
 Glaciers and Glaciation Earth - Chapter 18 Stan Hatfield Southwestern Illinois College Glaciers Glaciers are parts of two basic cycles: 1. Hydrologic cycle 2. Rock cycle A glacier is a thick mass of ice
6DAYS/5NIGHTS (A) ITINERARY
 ITINERARY") 6DAYS/5NIGHTS (A) ITINERARY 2012/2013 6-Day Cruise A : Saturday to Thursday Isabela & Fernandina Islands 6 DAYS / 5 NIGHTS A OCEAN SPRAY 2012 /2013 OUTLINE ITINERARY SATURDAY AM: Baltra arrival and transfer
6DAYS/5NIGHTS (A) ITINERARY 2012/2013 6-Day Cruise A : Saturday to Thursday Isabela & Fernandina Islands 6 DAYS / 5 NIGHTS A OCEAN SPRAY 2012 /2013 OUTLINE ITINERARY SATURDAY AM: Baltra arrival and transfer
ICRI Monaco January 2010
 Economic Valuation of Coral Reefs in the Caribbean ICRI Monaco January 2010 Lauretta Burke World Resources Institute (WRI) Beautiful Valuable Valuable Valuable Valuable Valuable Photos: Krishna Desai Valuable
2009 No ANTARCTICA. The Antarctic (Amendment) Regulations 2009
 Regulations 2009") STATUTORY INSTRUMENTS 2009 No. 2354 ANTARCTICA The Antarctic (Amendment) Regulations 2009 Made - - - - 23rd August 2009 Laid before Parliament 1st September 2009 Coming into force - - 22nd September 2009
STATUTORY INSTRUMENTS 2009 No. 2354 ANTARCTICA The Antarctic (Amendment) Regulations 2009 Made - - - - 23rd August 2009 Laid before Parliament 1st September 2009 Coming into force - - 22nd September 2009
Dr. Melissa Grigione And Kurt Menke. Jaguar -Arturo. Jaguarundi -Arturo. Ocelot -Arturo. Caso. Caso. Caso
 Identifying Priority Conservation Areas in the U.S.- Mexico Border Region for America s Neotropical Cats, the Jaguar, Jaguarundi and Ocelot: An International Effort Dr. Melissa Grigione And Kurt Menke
Cave-Dwelling Bats in the Philippines: Conservation Status, Threats & Needs
 Cave-Dwelling Bats in the Philippines: Conservation Status, Threats & Needs Presented by: REIZL JOSE & JOHN ARIES TABORA gzl_4@yahoo.com/johnariestabora@gmail.com 1 1. National Karst Area: 35,000 km 2
Adapting to climate change by promoting sustainable livelihoods, human and food security, and resilient ecosystems
 Adapting to climate change by promoting sustainable livelihoods, human and food security, and resilient ecosystems ICRI Indian Ocean Day December 13, 2011 Regional Challenges Atlantic Caribbean Challenge
A Brief Introduction to the Wetlands Phang Nga Marine National Park. Yuppayao Saichan Department of Marine and Coastal Resources Thailand
 A Brief Introduction to the Wetlands Phang Nga Marine National Park Yuppayao Saichan Department of Marine and Coastal Resources Thailand Wetlands Phang Nga Marine National Park Location: Muang and Ta kau
ITINERARY DAYS/5NIGHTS
 ITINERARY 2016 6 DAYS/5NIGHTS Tuesday to Sunday (every 15 days) Day 1 Tuesday Cerro Colorado, San Cristóbal Upon arrival at San Cristobal Airport, travelers pass through an airport inspection point to
Town of Oakfield Agricultural and Farmland Protection Plan
 SECTION III COMMUNITY OVERVIEW A. Regional Setting / Location The Town of Oakfield is located in the northwestern portion of Genesee County. Located west of New York's Finger Lakes, the Town is uniquely
Terrestrial Protected Area Nomination: Central Mangrove Wetland South-West, Grand Cayman
 Terrestrial Protected Area Nomination: Central Mangrove Wetland South-West, Grand Cayman The attached nomination, proposing that a parcel of land in the Central Mangrove Wetland be made a Protected Area
WORLD HERITAGE NOMINATION - IUCN TECHNICAL EVALUATION ST. PAUL SUBTERRANEAN RIVER NATIONAL PARK (PHILIPPINES)
") WORLD HERITAGE NOMINATION - IUCN TECHNICAL EVALUATION ST. PAUL SUBTERRANEAN RIVER NATIONAL PARK (PHILIPPINES) 1. DOCUMENTATION i) IUCN/WCMC Data Sheet: (4 references). ii) iii) Additional Literature Consulted:
WORLD HERITAGE NOMINATION - IUCN TECHNICAL EVALUATION ST. PAUL SUBTERRANEAN RIVER NATIONAL PARK (PHILIPPINES) 1. DOCUMENTATION i) IUCN/WCMC Data Sheet: (4 references). ii) iii) Additional Literature Consulted: