MAJOR SPORT AND EVENT CENTRE
|
|
|
- Jane Richardson
- 5 years ago
- Views:
Transcription


1 Feasibility Study for a MAJOR SPORT AND EVENT CENTRE in the City of Peterborough Council Presentation March 2018

2 1 Phase 1 Purpose 2 Key questions/matters of inquiry addressed in this interim reporting Q1: Is the PMC worth re-investing in as a multi-use sport and event centre (MUSEC)? Q2: Should the City be involved in the events business? Q3: What is the Market for Events? 3 Continuing Work City of Peterborough Feasibility Study for a Major Sport and Event Centre 2
3 KEY ISSUES/QUESTIONS


4 Q1: Is the PMC worth re-investing in as a MUSEC? City of Peterborough Feasibility Study for a Major Sport and Event Centre 4
5 Q1: Is the PMC worth re-investing in as an MUSEC? Illustrative Investment and Challenges History of Investment Approximate Capital Costs Date Nominal $ , M , , M M M 2020 to M TOTAL $25.21 M+ Source: City of Peterborough Building Challenges Functional Challenges Building Condition Functional Challenges Site & Context Ice Surface Circulation Utilization & Location Site Challenges Parking is not evenly distributed around the facility, and the main entry points off Landsdowne & Locke Street have a poor relationships to the primary parking area. A lack of sidewalks, lighting, wayfinding, and general poor condition of the site. City of Peterborough Feasibility Study for a Major Sport and Event Centre

6 Q1: Is the PMC worth re-investing in as an MUSEC? Illustrative Investment and Challenges PRIMARILY LOW DENSITY SIGNLE FAMILY HOMES City of Peterborough Feasibility Study for a Major Sport and Event Centre 6
7 Q1: Is the PMC worth re-investing in as an MUSEC? Illustrative Investment and Challenges City of Peterborough Feasibility Study for a Major Sport and Event Centre 7
8 Q1: Is the PMC worth re-investing in as an MUSEC? Illustrative Investment and Challenges Circulation Functional Challenges Event Level General lack of breathing room; undersized for maximum capacity events; Tight circulation is further compromised by: a limited number of access points queuing, and poor placement of kiosks and vendor tables. These issues are particularly pronounced in the north corners of the building. Spectator Level Seat spacing is tight throughout the facility, with steep and restricted access aisles. These aspects negatively affect spectator level circulation. Access to seating areas is convoluted, and challenged to accommodate maximum capacity events. This is particularly evident in the north corners of the building, where barrier free viewing locations are often compromised. Participants cross spectator circulation areas when moving to and from the ice surface. This is particularly pronounced by the front-of-house placement of the Petes and Visiting Team rooms. City of Peterborough Feasibility Study for a Major Sport and Event Centre 8
9 Q1: Is the PMC worth re-investing in as an MUSEC? Illustrative Investment and Challenges City of Peterborough Feasibility Study for a Major Sport and Event Centre 9
10 Q1: Is the PMC worth re-investing in as an MUSEC? Illustrative Investment and Challenges City of Peterborough Feasibility Study for a Major Sport and Event Centre 10
11 Q1: Is the PMC worth re-investing in as an MUSEC? Illustrative Investment and Challenges City of Peterborough Feasibility Study for a Major Sport and Event Centre 11

12 Q1: Is the PMC worth re-investing in as an MUSEC? Illustrative Investment and Challenges City of Peterborough Feasibility Study for a Major Sport and Event Centre 12
13 Q1: Is the PMC worth re-investing in as an MUSEC? Illustrative Investment and Challenges Utilization/Location Functional Challenges Event Level The number of public washroom facilities appear to be undersized; Petes team space is undersized, and poorly arranged with respect to current OHL and Major Series Lacrosse standards. The Centre falls significantly short in meeting basic demands of contemporary shows and special events. Undersized: back of house loading, staging, media broadcasting, dedicated dressing rooms, green room, event power, communications, sound system, dedicated rigging points, and roof height. Key Takeaway: Given the robust nature of the Centre s concrete structure, and the placement of the executive suites, the total seat count is fixed for the foreseeable future. Spectator Level The number of public washroom facilities appear to be undersized, and fixtured for maximum occupancy events. The north corners of the spectator area are underserved, and should have their own washroom facilities. Access to seating areas is convoluted, and challenged to accommodate maximum capacity events, and causes spectator participant circulation conflicts. City of Peterborough Feasibility Study for a Major Sport and Event Centre 13

14 Q1: Is the PMC worth re-investing in as an MUSEC? Illustrative Investment and Challenges City of Peterborough Feasibility Study for a Major Sport and Event Centre 14
15 Q1: Is the PMC worth re-investing in as an MUSEC? Illustrative Investment and Challenges SPECTATOR ACCESS -CONVOLUTED -EXPERIENCE -MANAGEMENT The top of the bowl access is quite tight and requires additional ushers to manage the circulation Prepost & During game. It also conflicts with Participant (Player & Official) movement from the ice surface. City of Peterborough Feasibility Study for a Major Sport and Event Centre 15
16 Q1: Is the PMC worth re-investing in as an MUSEC? Illustrative Investment and Challenges Facility Condition Challenges Significant components that have been identified for replacement through to 2023: Exterior building envelope, windows, and doors; Interior millwork, floor, wall, and ceiling finishes; Domestic water, rainwater and sanitary plumbing systems upgrades; and Exterior site work, landscaping, and fencing. Key Takeaway: Given the order of magnitude of the functional and building condition currently facing the existing Peterborough Memorial Centre, the anticipated capital costs associated with addressing them in a substantial manner, and the local low density residential context, it is becoming increasingly timely for the City of Peterborough to consider a new special events facility to host Major/Junior sports, entertainment, and special events. City of Peterborough Feasibility Study for a Major Sport and Event Centre 16
17 Q1: Is the PMC worth re-investing in as an MUSEC? Illustrative Investment and Challenges City of Peterborough Feasibility Study for a Major Sport and Event Centre 17

18 Classification of Events Games/Tournaments: are defined to include Petes and Lakers Competitive Games and Exhibitions and can include community tournaments. Other Sport Events: examples include national bid events, figure skating, boxing, Harlem Globetrotters etc. Concerts: are defined to include international, national and regional music performances. Theatre/Live Shows: may include stand-up comedy, live theatre etc. Family Entertainment: any category of matinee and evening performance that uses the rink surface (e.g. monster truck shows, circus performances). Trade Shows and Conventions: may include home shows, expos etc. Q2: Should the City be involved in the events business? City of Peterborough Feasibility Study for a Major Sport and Event Centre 18

 2013 2014 2015 2016 2017 Excluding sporting events which can vary from year-to year; a portion of")
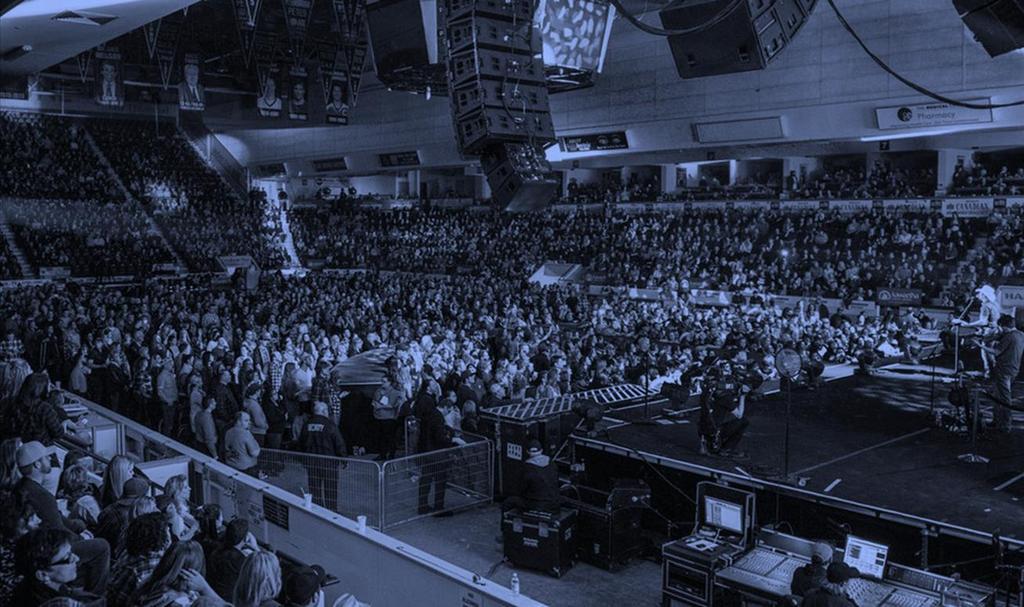
19 Q2: Should the City be involved in the events business? Key Takeaway: The PMC has and continues to be a player in the Eastern Ontario Events Market. This is illustrated in the roster of events hosted at the facility year-over-year, as well as recent tour flows for major North American acts. Based on detail event booking data, the PMC observed a 23% (14 events) increase in the number events hosted between 2013 and A portion of this is attributable to the Petes making the OHL Playoffs in 2017 (around 4 extra games) Excluding sporting events which can vary from year-to year; a portion of this growth can be attributed to a steady increase in the number of concerts hosted at the PMC (anywhere from 1 to 2 additional concerts per annum in the last 2 years). Source: City of Peterborough City of Peterborough Feasibility Study for a Major Sport and Event Centre 19
 2013 2014 2013 2014* 2015 2016* 2017* 5-Year Total 5 Year Average Lakers Petes 14 36 16 40 15 39 16 39 15 41 76 195")
 Family Entertainment 1% Tradeshows/Conventions 5% Live Theatre/Shows 1%")
20 Q2: Should the City be involved in the events business? Exhibit 2: 5-Year Event Hosting Trends at the PMC (Total Events by Type of Event) * * 2017* 5-Year Total 5 Year Average Lakers Petes Other Sports Events Concerts Theatre/Live Show Family Entertainment Trade Shows/Convention *Excludes 'Merchandise' days and 'Season Ticket' Sale Days Exhibit 3: Breakdown of PMC Events by Type ( ) Family Entertainment 1% Tradeshows/Conventions 5% Live Theatre/Shows 1% Concerts 6% Lakers 23% Source: City of Peterborough Other Sport 6% Petes 58% City of Peterborough Feasibility Study for a Major Sport and Event Centre 20
21 Q2: Should the City be involved in the events business? Exhibit 4: 5-year Trend In Sporting Events ( ) Exhibit 5: 5-year Trend In Non-sporting Events ( ) Lakers Petes Other Sport Concerts Live Theatre/Shows Family Entertainment Tradeshows/Conventions 4,000 Exhibit 6: Average Paid Attendance at the PMC by Event Type ( ) 3,500 3,000 2,500 Petes, 2,684 Tradeshows/Conventions, 3,300 2,000 Concerts, 1,967 Family Entertainment, 2,052 1,500 Lakers, 2,712 1, Other Sport, 1,425 Live Theatre/Shows, 1,512 - City of Peterborough Feasibility Study for a Major Sport and Event Centre 21
.")
22 Q2: Should the City be involved in the events business? Key Takeaway: Despite fewer occurrences, concerts accounted for 28% gross revenues for the PMC following tenant hockey events (49%). Average gross revenues per concert are estimated at $160,000 (compared to $86,000 for Theatre/Live Shows and $20,000 to $40,000 for sporting events). Exhibit 7: 2017 Breakdown of Gross Revenues by Event Source Concerts 28% Live Theatre/Shows 3% Family Entertainment 4% Lakers 9% The following table provides a comparative review of revenues, event-related expenses/payments and sell-out/attendance shares for the various types of events hosted at the PMC. Other Sport 7% Petes 49% Exhibit 8: 2017 Event Performance (Revenues, Event-Related Payments/Expenses by Type of Event) Gross Revenues Payments Payments as a share of Gross Revenues Avg Gross Revenues per Event Lakers $306,056 $194,975 64% $20,404 Petes $1,641,045 $1,118,913 68% $40,025 Other Sports Events $242,657 $133,304 55% $40,443 Concerts $958,900 $653,413 68% $159,817 Theatre/Live Show $86,065 $63,392 74% $86,065 Family Entertainment $133,965 $13,455 10% $66,983 Trade Shows/Convention N/A N/A N/A N/A *Total revenues reflect the 'Event Deferred' category. *** Revenues and payments data for Family Entertainment is partial. City of Peterborough Feasibility Study for a Major Sport and Event Centre 22
23 Q3: What is the Market for Events? City of Peterborough Feasibility Study for a Major Sport and Event Centre 23
24 Q3: What is the Market for Events? Tour Flows The Concert Market for the Existing PMC: The Acts that Came The Acts: Tour Flows Tour Flows provide an indication of the existing market for non-sporting events for a MUSEC in Peterborough. The following analysis provides a comparative look at select acts, specifically concerts, that: 1) Were hosted at the PMC; and 2) Were hosted in venues in Eastern Ontario but not at the PMC. This analysis provides a look at the capacity of the venues visited by these touring acts. Observations have been made as to how the PMC is situated within the market on this basis. City of Peterborough Feasibility Study for a Major Sport and Event Centre 24

")
25 Q3: What is the Market for Events? Tour Flows The Concert Market for the Existing PMC: The Acts that Came BRAD PAISLEY - LIFE AMPLIFIED WORLD TOUR 2017 Place Venue Capacity Sault Ste. Marie, ON Essar Centre 5,000 Sudbury, ON Sudbury Arena 5,100 Peterborough, ON Peterborough Memorial Centre 5,442 (4,000 fixed) Kingston, ON Rogers K-Rock Centre 6,800 (5,200 fixed) Moncton, NB Moncton Coliseum Complex 7,500 Sydney, NS Centre 200 6,500 City of Peterborough Feasibility Study for a Major Sport and Event Centre 25


26 Q3: What is the Market for Events? Tour Flows The Concert Market for the Existing PMC: The Acts that Came DEAN BRODY BEAUTIFUL FREAKSHOW TOUR 2017 Place Venue Capacity Hamilton, ON Hamilton Place Theatre 2,200 London, ON Budweiser Gardens 9,000 Kingston, ON Rogers K-Rock Centre 6,800 Oshawa, ON Tribute Communities Centre 6,400 Kitchener, ON Centre in the Square 2,100 Sudbury, ON Sudbury Community Arena 5,100 Peterborough, ON Peterborough Memorial Centre 5,422 City of Peterborough Feasibility Study for a Major Sport and Event Centre 26


27 Q3: What is the Market for Events? Tour Flows The Concert Market for the Existing PMC: The Acts that Came DALLAS SMITH SIDE EFFECTS TOUR 2017 Place Venue Capacity Halifax, NS Cunard Event Centre 4,000 Owen Sound, ON Bayshore Community Centre 4,000 Ottawa, ON TD Arena 10,500 (9,500 fixed) Kingston, ON Rogers K-Rock Centre 6,800 Oshawa, ON Tribute Communities Centre 6,400 Sudbury, ON Sudbury Community Arena 5,100 Hamilton, ON Hamilton Place/FirstOntario Concert Hall 2,200 Kitchener, ON Centre In The Square 2,100 St Catherines, ON Meridian Centre 6,000 Peterborough, ON Peterborough Memorial Centre 5,442 (4,000 fixed) London, ON Centennial Hall 2,200 City of Peterborough Feasibility Study for a Major Sport and Event Centre 27
 17,300")
28 Q3: What is the Market for Events? Tour Flows The Acts that did not visit the PMC BOB DYLAN & BAND: TOUR 2017 Place Venue Capacity Kingston, ON Rogers K-Rock Centre 6,800 Ottawa, ON Canadian Tire Centre (Richcraft Live) 17,300 Montreal, QC Centre Bell 7,300 Barrie, ON Molsen Centre 5,000 Oshawa, ON Tribute Communities Centre 7,300 Toronto, ON Air Canada Centre 19,800 London, ON Budweiser Gardens 9,000 City of Peterborough Feasibility Study for a Major Sport and Event Centre 28

29 Q3: What is the Market for Events? Tour Flows The Acts that did not visit the PMC ARKELLS, KNOCKING AT THE DOOR TOUR 2017 Place Venue Capacity Oshawa, ON Tribute Communities Centre 7,300 Kingston, ON Rogers K-Rock 6,800 London, ON Budweiser Gardens 9,000 City of Peterborough Feasibility Study for a Major Sport and Event Centre 29


30 Q3: What is the Market for Events? Tour Flows The Acts that did not visit the PMC TIM HICKS, SHAKE THESE WALLS TOUR 2017 Place Venue Capacity Hamilton, ON Hamilton Place/FirstOntario Concert Hall 2,200 Oshawa, ON Tribute Communities Centre 7,300 London, ON Budweiser Gardens (RBC Theatre) 3,200 Sudbury, ON Sudbury Community Arena 5,100 Moncton, NB Molson Canadian Centre at Casino NB 2,500 Halifax, NS Halifax Forum Multi-Purpose Centre 2,200 City of Peterborough Feasibility Study for a Major Sport and Event Centre 30
31 Q3: What is the Market for Events? PMC and future Peterborough MUSEC Profiling the Market Area The market area for an MUSEC spans a geographic area of over 5,000 km and largely comprises the following areas: Peterborough County (southern portion); Northumberland County (including Cobourg and portions of Alnwick/Haldimand); Kawartha Lakes (Just north of Lindsay); and Durham Region (east of Oshawa). Ontario Ministry of Finance projections (July 2017 update) identified that the populations for these combined county areas totalled 976,740 in 2016 and were planned to growth by 31% to 1,283,304 by The City of Peterborough is planned to grow to 115,000 by 2041 (per the 2017 Provincial Growth Plan for the Greater Golden Horseshoe Area) up from 82,094 residents in 2016 (Census). City of Peterborough Feasibility Study for a Major Sport and Event Centre 31
32 Q3: What is the Market for Events? PMC and future Peterborough MUSEC Profiling the Market Area Exhibit 9: Provincial Age Profile (2016) Exhibit 10: City of Peterborough Age Profile (2016) 85 years and over 80 to 84 years 75 to 79 years 70 to 74 years 65 to 69 years 60 to 64 years 55 to 59 years 50 to 54 years 45 to 49 years 40 to 44 years 35 to 39 years 30 to 34 years 25 to 29 years 20 to 24 years 15 to 19 years 10 to 14 years 5 to 9 years 0 to 4 years -10% -8% -6% -4% -2% 0% 2% 4% 6% 8% 10% 85 years and over 80 to 84 years 75 to 79 years 70 to 74 years 65 to 69 years 60 to 64 years 55 to 59 years 50 to 54 years 45 to 49 years 40 to 44 years 35 to 39 years 30 to 34 years 25 to 29 years 20 to 24 years 15 to 19 years 10 to 14 years 5 to 9 years 0 to 4 years -10% -8% -6% -4% -2% 0% 2% 4% 6% 8% 10% Female Male Female Male Source: Statistics Canada, 2016 Census of Population City of Peterborough Feasibility Study for a Major Sport and Event Centre 32

33 Q3: What is the Market for Events? PMC and future Peterborough MUSEC Profiling the Market Area Map 1: Market Area within 50-minute drive time to the Peterborough Memorial Centre The following provides a profile of the patron market for events for a MUSEC in Peterborough, including: The size of the market population; Demographic trends; and Household spending on sport and non-sport events Source: Sierra Planning and Management based on Business Analyst by ESRI, 2017 Demostats by Environics The market for an MUSEC is defined to be residents and households within a 50-minute drivetime of the existing PMC. This is corroborated by place of residence data for recent patrons/ticket purchasers at the PMC. City of Peterborough Feasibility Study for a Major Sport and Event Centre 33
34 Q3: What is the Market for Events? PMC and future Peterborough MUSEC Profiling the Market Area Populations and Households The market area for an MUSEC in Peterborough is home to approximately 299,000 residents and is characterized by a relatively younger demographic compared to the City s population. Key Takeaway: The market area for an MUSEC in Peterborough is relatively younger than the local population in Peterborough and spends more (in actual dollars) on live events per annum when compared to the Provincial average. In 2017, the market comprised of 85,743 households with an average household income of $91,985 (2017 Est.). In comparison to provincial households, households in the MUSEC market area spent comparatively more on live events per annum. Source: Sierra Planning and Management based on Business Analyst by ESRI, 2017 Demostats by Environics City of Peterborough Feasibility Study for a Major Sport and Event Centre 34
35 Q3: What is the Market for Events? PMC and future Peterborough MUSEC Profiling the Market Area Source: Sierra Planning and Management based on Business Analyst by ESRI, 2017 Demostats by Environics City of Peterborough Feasibility Study for a Major Sport and Event Centre 35

36 Q3: What is the Market for Events? PMC and future Peterborough MUSEC Profiling the Market Area Map 2: Concert Ticket Sales by Postal Code for the 2017 for the Peterborough Memorial Centre Source: Sierra Planning and Management based on data provided by the City of Peterborough City of Peterborough Feasibility Study for a Major Sport and Event Centre 36
37 Q3: What is the Market for Events? PMC and future Peterborough MUSEC Profiling the Market Area 2010 Events Attendance (excl. OHL and Lakers) General Area Patrons % 1 City of Peterborough 11, % 2 Peterborough County and North Hastings County 3, % Lindsay, Kawartha Lakes, Haliburton, West 3 Northumberland County 1, % Belleville, Trenton, Cobourg, Port Hope, Quinte 4 Shores East 1, % 5 Oshawa, Whitby, Pickering, Ajax, West Durham % 6 Bowmanville, Newcastle, Courtice, East Durham % 7 Toronto % 8 Frontenac, Lennox and Addington County % 9 Other: Renfrew /Lanark % 10Port Perry/Uxbridge % Sub-Total 20, % Other 2, % Total 22, % 2014 Events Attendance (excl. OHL and Lakers) General Area Patrons % 1 City of Peterborough 9, % 2 Peterborough County and North Hastings County 2, % Lindsay, Kawartha Lakes, Haliburton, West 3 Northumberland County 1, % Belleville, Trenton, Cobourg, Port Hope, Quinte 4 Shores East 1, % 5 Toronto % 6 Ottawa and National Capital Region % 7 Oshawa, Whitby, Pickering, Ajax, West Durham % 8 Bowmanville, Newcastle, Courtice, East Durham % Port Perry/Uxbridge, Keswick, Barrie, Lake Simcoe 9 North Shore, Newmarket % 10 Mississauga, Burlington, Hamilton, Brampton Caledon % 11 International % 12 Kingston % 13 Other: Renfrew /Lanark % Sub-Total 17, % Other 1, % Total 19, % 2017 Events Attendance (excl. OHL and Lakers) General Area Patrons % 1 City of Peterborough 10, % 2 Peterborough County and North Hastings County 4, % Lindsay, Kawartha Lakes, Haliburton, West 3 Northumberland County 2, % Belleville, Trenton, Cobourg, Port Hope, Quinte 4 Shores East 1, % 5 Oshawa, Whitby, Pickering, Ajax % 6 Bowmanville, Newcastle, Courtice, East Durham % 7 Toronto % 8 International % 9 Other: Renfrew /Lanark, London % 10 Port Perry/Uxbridge, Keswick, Barrie % Sub-Total 20, % Other 2, % Total 23, % City of Peterborough Feasibility Study for a Major Sport and Event Centre 37

38 Q3: What is the Market for Events? Comparative Market Review Other Eastern Ontario MUSECs and the GTA A comparison of other markets serviced by similar neighbouring venues (i.e. MUSECs) is important in determining the relative activity and spending preferences and which can be expected to impact the performance of an MUSEC in Peterborough. Major comparable and competitive venues in Eastern Ontario are the newly renovated Yardmen Arena in Belleville and the Rogers K-Rock Centre in Kingston. Map 3: Market Area within 50-minute drive time to the Peterborough Memorial Centre, Yardmen Arena (Belleville ON) and the K-Rock Centre (Kingston ON) City of Peterborough Feasibility Study for a Major Sport and Event Centre 38


39 Q3: What is the Market for Events? Rogers K-Rock Centre Comparative Market Review Other Eastern Ontario MUSECs and the GTA Map 4: Market Area within 50-minute drive time to the Rogers K-Rock Centre Source: Sierra Planning and Management based on Business Analyst by ESRI, 2017 Demostats by Environics City of Peterborough Feasibility Study for a Major Sport and Event Centre 39


40 Q3: What is the Market for Events? Belleville Yardmen Arena Comparative Market Review Other Eastern Ontario MUSECs and the GTA Map 5: Market Area within 50-minute drive time to the Belleville Yardmen Arena Source: Sierra Planning and Management based on Business Analyst by ESRI, 2017 Demostats by Environics City of Peterborough Feasibility Study for a Major Sport and Event Centre 40

41 Median Age Q3: What is the Market for Events? Comparative Market Review Other Eastern Ontario MUSECs and the GTA COMPARATIVE SIZE AND AGE OF MARKETS Exhibit 12: Median Age of Market Area Population for Eastern Ontario MUSECs PMC Market Area K-Rock Centre Market Area Yardmen Arena Market Area Key Takeaway: The Market for an MUSEC in Peterborough is estimated to be larger than comparable Eastern Ontario venues given its relatively proximity the GTA communities (compared to Kingston or Belleville) Source: Sierra Planning and Management based on Business Analyst by ESRI, 2017 Demostats by Environics City of Peterborough Feasibility Study for a Major Sport and Event Centre 41
42 Q3: What is the Market for Events? Comparative Market Review Other Eastern Ontario MUSECs and the GTA Exhibit 13: Market Area Household Projections (based on a 50-minute drivetime) for Eastern Ontario MUSECs Yardmen Arena, Belleville K-Rock Centre, Kingston 2027 Total Family Households 2022 Total Family Households COMPARATIVE SIZE AND INCOME PROFILE OF MARKETS 2020 Total Family Households Peterborough Memorial Centre 2017 Total Family Households 0 20,000 40,000 60,000 80, ,000 Total Households Exhibit 14: 2017 Average Household Income for MUSEC Market Areas $100,000 $95,000 $90,000 $85,000 Peterborough Memorial Centre K-Rock Centre, Kingston Yardmen Arena, Belleville Source: Sierra Planning and Management based on Business Analyst by ESRI, 2017 Demostats by Environics City of Peterborough Feasibility Study for a Major Sport and Event Centre 42

43 Q3: What is the Market for Events? Comparative Market Review Other Eastern Ontario MUSECs and the GTA PMC Market Area WHAT THE MARKET SPENDS ON EVENTS K-Rock Centre Market Area Yardmen Arena Market Area GTA Key Takeaway: The market for an MUSEC in Peterborough is estimated to have higher per household spending on live events (both sporting and nonsporting) per year compared to other Eastern Ontario and GTA markets. Source: Sierra Planning and Management based on Business Analyst by ESRI, 2017 Demostats by Environics City of Peterborough Feasibility Study for a Major Sport and Event Centre 43
44 Q3: What is the Market for Events? $60 $50 $40 $30 $20 Comparative Market Review Other Eastern Ontario MUSECs and the GTA Exhibit 16: Average Annual Household Spending on Live Sporting Events (2017) PMC Market Area, $33 GTA, $44 WHAT THE MARKET SPENDS ON EVENTS $10 $0 K-Rock Market Area, $15 Yardmen Arena, Market Area, $ $300 $250 $200 $150 Exhibit 17: Average Annual Household Spending on Performing Arts Events (2017) PMC Market Area, $216 Yardmen Arena, Market Area, $89 GTA, $128 Key Takeaway: The market for an MUSEC in Peterborough despite spending comparatively less on sporting events per annum compared to the GTA market is estimated to spend more on non-sport live entertainment. $100 $50 $0 K-Rock Centre, Market Area, $ Source: Sierra Planning and Management based on Business Analyst by ESRI, 2017 Demostats by Environics City of Peterborough Feasibility Study for a Major Sport and Event Centre 44
 $21 million / 40 year solution Big question: could")
 + 6")
45 Q3: What is the Market for Events? Competitive Venues A Closer Look at Performance Belleville Yardman Arena Expansion 4400 fixed seats non-fixed (4800 likely official capacity) $21 million / 40 year solution Big question: could suites be added Olympic ice reduced = bottom and top loading circulation New northern wing best seats in the house Roof truss / floor to truss height a compromise Differences to PMC: Circulation similar to a new build / has feel of a new build Northerly expansion possible Kept rake as tight as possible for good viewing lines Business Deal: 50 game event deal with Senators ( hockey) + 6 nonsport events No cost to City for operations of venue for game days City staffing of building operations and building operation costs City of Peterborough Feasibility Study for a Major Sport and Event Centre 45


46 City of Peterborough Feasibility Study for a Major Sport and Event Centre 46

47 Q3: What is the Market for Events? Competitive Venues A Closer Look at Performance Rogers K-Rock Centre, Kingston 5,700 fixed seats, with concert capacity of circa 6,800 Constructed in 2008, with 29 suites and premium seating Winner of Canadian Music & Broadcast Industry Award for Major Venue under 8,000 seats #2 on 2017 list of TopStops for venues with 5,001 to 10,000 capacity (Trade mag Venues Today ), based on # of tickets sold Differences to PMC: Larger venue capacity to attract higher-order artists/events Concourse area capable of hosting tradeshows Business Deal (*) Home venue for Kingston Frontenacs 25 of 29 suites (86%) and 475 club seats (84%) occupied through licencing agreements ranging from 2-7 years Operator (SMG) provides $550,000 financial guarantee p.a. Naming rights negotiated for arena In 2018, venue to seek out smaller trade shows/conventions/meetings which could be hosted in concourse area (e.g. graduation ceremonies) (*) Source: Venue s 2018 Annual Plan (SMG) City of Peterborough Feasibility Study for a Major Sport and Event Centre 47
 23 private suites, 4 group suites & 530 club seats")
48 Q3: What is the Market for Events? Competitive Venues A Closer Look at Performance Tribute Communities Centre, Oshawa 7,300 concert capacity (6,125 for hockey including standing room) 23 private suites, 4 group suites & 530 club seats Other event rooms with capacity of between 20 and 200 Opened in 2006 Differences to PMC: Like K-Rock Centre, a larger capacity than PMC to attract higher-order artists/events Business Deal: Home venue for Oshawa Generals 10 year arena naming rights agreement (from Nov 2016) 50/50 split between direct event and other * income in 2017: (*) Other income is defined to include rentals, leases, advertising etc.) City of Peterborough Feasibility Study for a Major Sport and Event Centre 48
49 Q3: What is the Market for Events? Competitive Venues Event Comparison Exhibit 18: Venue Event Comparison (No. of Events) Key Takeaways: The PMC hosts fewer concerts than comparable venues in Kingston and Oshawa potentially due to its relatively smaller capacity Comparable venues also appear to be well-heeled in trade shows and conventions. PMC (2017 data ) K-Rock (2016 data) Tribute CC (2017 data) PMC (2017 data) K-Rock (2016 data) Tribute CC (2017 data) Category No. Events Events % No. Events Events % No. Events Events % OHL Hockey 41 55% 41 51% 41 46% Lacrosse 15 20% 0 0% 15 17% Other Sports Events 6 8% 9 11% 7 8% Concerts 6 8% 13 16% 12 13% Theatre/Live Show 1 1% 2 3% 1 1% Family Entertainment 2 3% 2 3% 4 4% Trade Shows/Convention 3 4% 7 9% 8 9% Community 0 0% 6 8% 2 2% Total % % % Source: Sierra Planning and Management. Data for the K-Rock and Tribute facilities is based on the latest available online event calendar and published business planning reports for each of these facilities and may not be complete. City of Peterborough Feasibility Study for a Major Sport and Event Centre 49
 Concerts, 8% Theatre/ Live Show, 1% Family Entertainment, 3% Exhibit 19: PMC Events (2017) Trade Shows/Convention, 4% Theatre/Li")

50 Q3: What is the Market for Events? Competitive Venues Event Comparison Exhibit 20: K-Rock Events (2016) Concerts, 8% Theatre/ Live Show, 1% Family Entertainment, 3% Exhibit 19: PMC Events (2017) Trade Shows/Convention, 4% Theatre/Li ve Show, 2% Family Entertainment, 3% Trade Shows/Convention, 9% Community, 8% OHL Hockey, 51% Concerts, 16% Other Sports Events, 8% Lacrosse, 20% OHL Hockey, 55% Other Sports Events, 11% Source: Sierra Planning and Management. Data for the K-Rock and Tribute facilities is based on the latest available online event calendar and published business planning reports for each of these facilities and may be limited. Family Entertainment 4% Trade Exhibit 21: Tribute CC (2017) Shows/Convention 9% Community 2% OHL Hockey 46% Theatre/Live Show 1% Other Sports Events 8% Concerts 13% Lacrosse 17% City of Peterborough Feasibility Study for a Major Sport and Event Centre 50
51 Q3: What is the Market for Events? OHL Team Comparison Attendance Statistics Exhibit 22: Ontario Hockey League Attendance Stats (10 Year Comparison) by percentage filled Capacity Owen Sound Attack 83% 81% 84% 84% 87% 82% 78% 68% 69% 71% 3500 Belleville Bulls 69% 63% 69% 67% 71% 74% 80% 75% 3700 Peterborough Petes 67% 64% 62% 63% 64% 63% 68% 70% 74% 78% 4000 Plymouth Whalers 60% 62% 64% 66% 68% 67% 59% 66% 4000 Barrie Colts 90% 93% 91% 91% 91% 89% 83% 91% 85% 86% 4100 North Bay Battalion 62% 79% 82% 80% 4200 Flint Firebirds 67% 68% 4400 Guelph Storm 89% 93% 99% 95% 94% 85% 87% 88% 90% 91% 4540 Sudbury Wolves 71% 68% 81% 82% 85% 82% 75% 83% 91% 90% 4600 Sault Ste. Marie Greyhounds 74% 81% 87% 85% 83% 86% 90% 88% 89% 92% 5000 Sarnia Sting 59% 60% 55% 58% 63% 67% 59% 62% 67% 71% 5200 Niagara IceDogs 91% 86% 82% 56% 57% 56% 55% 55% 56% 52% 5300 Kingston Frontenacs 66% 76% 73% 70% 64% 47% 53% 53% 57% 49% 5400 Oshawa Generals 95% 97% 95% 88% 87% 80% 80% 76% 87% 93% 5500 Erie Otters 78% 81% 90% 81% 57% 52% 63% 65% 64% 64% 5500 Saginaw Spirit 61% 61% 65% 67% 67% 69% 71% 65% 68% 72% 5500 Mississauga Steelheads 45% 50% 48% 43% 39% 0% 0% 0% 0% 0% 6000 Brampton Battalion 37% 33% 31% 35% 40% 42% 6000 Mississauga St. Michael's Majors 41% 52% 37% 40% 36% 6000 Windsor Spitfires 77% 73% 78% 82% 88% 90% 96% 97% 78% 51% 6500 Kitchener Rangers 91% 91% 91% 92% 94% 83% 83% 81% 81% 78% 7700 London Knights 99% 99% 99% 99% 99% 98% 98% 99% 99% 99% 9100 Ottawa 67's 39% 35% 36% 43% 56% 65% 72% 75% 79% 81% Hamilton Bulldogs 24% 22% Average Attendance 71% 73% 76% 74% 72% 67% 68% 68% 69% 69% Source: Sierra Planning and Management based on the website ohlarenaguide.com City of Peterborough Feasibility Study for a Major Sport and Event Centre 51
52 Q3: What is the Market for Events? OHL Team Comparison Attendance Statistics Exhibit 23: Peterborough Petes Historic Attendance Statistics ( ) Exhibit 24: Peterborough Petes vs OHL Average Attendance Attendance OHL Average Source: Sierra Planning and Management based on the website ohlarenaguide.com City of Peterborough Feasibility Study for a Major Sport and Event Centre 52
53 Continuing Work Projection of Event Day Potential in New Venue; Market Intel and Development of Prospective (Illustrative) Core Functional Space Program: seat count/type, suites/overall scale (GFA), concession/restaurant and other spaces (not conditional on location), number of ice surfaces, colocation potential for other desired uses (cultural, community, lease, other); Site Location Choices and Their implications; Future Use Considerations for PMC; Ongoing Consultation; Capital Costing; Operating Financial Analysis; Concept Plans for Preferred Site(s); Economic Impact Assessment; and Detailed Feasibility Report. City of Peterborough Feasibility Study for a Major Sport and Event Centre 53
54 Continuing Work: Major Criteria for Locational Assessment SITE CHARACTERISTICS, LOCATION AND TRANSPORTATION Capacity to Accommodate Building Footprint Parking Availability On-site and Off - site (both public and private) Within 5 Minute Walking Radius Local and Regional Automobile Access / Egress Ease of Access via Local Public Transit COSTS AND EASE OF ACQUIRING DEVELOPMENT LAND Cost of Land Acquisition Likelihood of site (in relative terms) to generate extraordinary development costs URBAN CONTEXT / PHYSICAL ELEMENTS Capacity for Urban Regeneration Urban design opportunity to create a signature building and focus ECONOMIC IMPACT / SYNERGY WITH DOWNTOWN Impact on Existing Local Retail/Commercial Sectors Potential to Attract New Local Retail/Commercial/Accommodation etc. City of Peterborough Feasibility Study for a Major Sport and Event Centre 54
Appendix B Profile of Ontario Federal Program Non-Profit Housing Co-operatives January 2018
 Appendix B Ontario Federal Program Non- Profit Housing Cooperatives Federal Co-ops Federal Units Assisted Households Bedrooms Total Number 259 18,098 5,595 Average Percentage Per Co-op 31% Median Percentage
10th Annual Allstate Canada Safe Driving Study Results
 10th Annual Allstate Canada Safe Driving Study Results 10-Year Combined Ranking (2008-2018) (Per 100 Cars During 2008-2018) Increase or Decrease in Hanmer ON 1 3.8% -17% Brockville ON 2 3.9% -5% La Salle
Economic Benefits of the Kingston Sports and Entertainment Centre (LVEC)
") Economic Benefits of the Kingston Sports and Entertainment Centre (LVEC) Kingston Economic Development Corporation Economic Benefits of the Kingston Sports and Entertainment Centre (LVEC) 1 Introduction
Economic Benefits of the Kingston Sports and Entertainment Centre (LVEC) Kingston Economic Development Corporation Economic Benefits of the Kingston Sports and Entertainment Centre (LVEC) 1 Introduction
EVENT CENTRE / ARENA COMPLEX
 EVENT CENTRE / ARENA COMPLEX BUSINESS CASE ANALYSIS PRESENTATION TO COUNCIL JANUARY 14, 2019 PART A: PROJECT RECAP PART B: DETAILED ASSESSMENT OF THE FACILITY OPTIONS PART C: COMPARING THE OPTIONS PART
001 Ajax 87, , Algoma Manitoulin 51,566 76, * 003 Aurora Oak Ridges Richmond Hill 78, ,581.70
 Campaign Expense by Electoral for the 2018 General Election The total campaign expenses incurred by a registered candidate s campaign, its registered constituency association, and anyone acting on behalf
Destination: CD14 Year: 2012
 Destination: CD14 Year: 2012 Origin Other Canada US Border States Total Canada Ontario US Overseas Total Visits Total Unweighted 441 164 155 9 175 131 44 102 Total Household/Party Visits (Weighted) 1,271,307
PROVINCIAL OFFENCES COURTS IN THE PROVINCE OF ONTARIO LISTING BY COURT ID
 0160 Sault Ste. Marie 99 Foster Drive, P.O. Box 580 Sault Ste. Marie, ON P6A 5N1 705-541-7334 0161 Elliott Lake Municipal & Provincial Offences Court Service Town of Espanola 100 Tudhope, Suite 4 Espanola,
Compliance Statistics:
 Information and Privacy Commissioner of Ontario Compliance Statistics: A look at the compliance rates of government organizations Ann Cavoukian, Ph.D. Commissioner May 2008 Compliance Statistics: A look
Ontario Tourism Facts & Figures
 IN THIS ISSUE Economic Outlook Ontario and Canada Tourism Statistics International Border Crossings International Travel Account Accommodations Tourism Related Employment Visitor Inquiries Travel Price
Destination: CD14 Year: 2011
 Destination: CD14 Year: 2011 Other Canada US Border States US Non-Border States Total Canada Ontario US Overseas Total Visits Total Unweighted 349 149 140 9 113 72 41 87 Total Household/Party Visits (Weighted)
Dufferin County Housing Market Update Orangeville November 24, 2015
 Dufferin County Housing Market Update Orangeville November 24, 2015 Housing market intelligence you can count on Dufferin County Core Housing Need 25% 2006 2011 20% 19.8% 20.1% 18.1% 15% 15.2% 10% 10.5%
TRANSIT WINDSOR REPORT
 TRANSIT WINDSOR REPORT MISSION STATEMENT: PROVIDING SAFE, RELIABLE AND AFFORDABLE PUBLIC TRANSIT FOR THE COMMUNITY THROUGH CONTINUOUS IMPROVEMENT IN CUSTOMER CARE, ENVIRONMENTAL STEWARDSHIP AND EMPLOYEE
National Market Report
 National Market Report November 2015 In November 2015, the national hotel sample experienced a 2.8 point decrease in occupancy from November 2014 to 57.8%. The November 2015 average daily room rate for
GREENFIELD DEVELOPMENT PROJECTS
 GREENFIELD DEVELOPMENT PROJECTS Highlights of development pipeline as at December 31, 2011, are as follows: Estimated square feet upon completion of the development project (thousands of square feet, except
ridesharing and taxi modernization: an achievable balance
 ridesharing and taxi modernization: an achievable balance First published February 2016, revised July 2018 Ridesharing regulations and taxi modernization involve complex issues around safety, equity, and
(905) , Extension 2725
 , Extension 2725") TO: CITY OF HAMILTON CITY MANAGER S OFFICE Strategic Partnerships and Communications and PUBLIC WORKS DEPARTMENT Energy, Fleet & Facilities Management Division Mayor and Members General Issues Committee
TO: CITY OF HAMILTON CITY MANAGER S OFFICE Strategic Partnerships and Communications and PUBLIC WORKS DEPARTMENT Energy, Fleet & Facilities Management Division Mayor and Members General Issues Committee
Sales & Average Price By Major Home Type 1,7 April 2014 Average Price Total Total
 April 2014 Economic Indicators Real GDP Growth i Q4 2013 t 2.9% Toronto Employment Growth ii March 2014 t 2.1% Toronto Unemployment Rate March 2014 u 8.0% Inflation (Yr./Yr. CPI Growth) ii March 2014 t
communication tower means a tower or structure built to support equipment used to transmit communication signals;
 Ontario Ministry of Natural Resources Subject Communication Tower Sites on Crown Land Compiled by - Branch Lands & Waters Section Land Management Policy PL 4.10.02 Replaces Directive Title Communication
Powerade Centre Overview. Budget Committee October 2015
 Powerade Centre Overview Budget Committee October 2015 Powerade Centre Background City established the Brampton Sports Park in late 1980s on lands acquired from the province The park was developed for
Ontario A Strategic Location & Innovation Corridor A Strategic location With just-in-time delivery the standard, location is critical and Ontario s is
 Ontario A Strategic Location & Innovation Corridor A Strategic location With just-in-time delivery the standard, location is critical and Ontario s is ideal. In fact, for advanced manufacturers eager to
2017 Market Rent Index Table
 Market Rent Index Table CMHC Rent CMHC Rent Barrie Barrie CMA 3.7% 1.5% 1.5% 5.3% 1.5% 1.5% Barrie Zone 1 - South 3.7% 1.5% 1.5% 5.3% 1.5% 1.5% Barrie Zone 2 - North 3.7% 1.5% 1.5% 5.3% 1.5% 1.5% Belleville
Sales & Average Price By Major Home Type 1,7 November 2013 Average Price Total Total
 November 2013 Economic Indicators Real GDP Growth i Q3 2013 t 2.7% Toronto Employment Growth ii October 2013 t 3.5% Toronto Unemployment Rate October 2013 t 8.0% Inflation (Yr./Yr. CPI Growth) ii October
THE GTA S GUIDE TO SUMMER CAMP
 THE GTA S GUIDE TO SUMMER CAMP NEW IN 2018: CAMP SEARCH SEE PG.5 Pround Member of the 2018 MEDIA KIT MAGAZINE AUDIENCE DISTRIBUTED BY THE #1 CAMP PUBLICATION WHEN LOOKING AT FAMILIES IN THE GREATER TORONTO
Sales & Average Price By Major Home Type 1,7 August 2013 Average Price Total Total
 Market Watch August 2013 Economic Indicators Real GDP Growth i Q2 2013 t 1.7% Toronto Employment Growth ii July 2013 t 4.7% Toronto Unemployment Rate July 2013 q 7.8% Inflation (Yr./Yr. CPI Growth) ii
2016 CENSUS BULLETIN #1 POPULATION & DWELLING COUNTS
 CENSUS BULLETIN #1 POPULATION & DWELLING COUNTS February 8 th, 2017 Bulletin Highlights: Brampton s : Brampton is 9 th largest City in Canada Brampton is 4 th largest City in Ontario Brampton is 3 rd largest
Low-Rise Home Types Drive June Price Growth
 June 2012 Economic Indicators Real GDP Growth i Q1 2012 t 1.9% Toronto Employment Growth ii May 2012 t 1.6% Toronto Unemployment Rate May 2012 t 8.6% Inflation (Yr./Yr. CPI Growth) ii May 2012 u 1.2% Bank
PASSENGER FARE TARIFF AND SALES MANUAL
 SECTION TABLE OF CONTENTS Restriction Codes... 8.2 and 8.3 TARIFF DESCRIPTON PAGES 210ER 1-day advance purchase senior fares... 8.4 EX231 1-day advance purchase fares... 8.5 EXO43 City-Specific Reduced
Toronto Pearson Master Plan Greater Toronto Airports Authority October 4, 2017
 Toronto Pearson Master Plan 2017-2037 Greater Toronto Airports Authority October 4, 2017 Stakeholder engagement The GTAA has been proactively engaging stakeholders to outline how it is preparing to meet
Metrics Sales Average Price Total Total
 Market Watch August 2018 Economic Indicators i Real GDP Growth Q2 2018 2.9% For All TREB Member Inquiries: (416) 443-8152 For All Media/Public Inquiries: GTA REALTORS Release August Stats TORONTO, ONTARIO,
2010 Nova Scotia Visitor Exit Survey Regional Report
 2010 Nova Scotia Visitor Exit Survey Regional Report A Look at Visitors Who Included Cape Breton in their Trip to Nova Scotia Reproduction in whole or in part is not permitted without the express permission
2 YORK REGION TRANSIT MOBILITY PLUS 2004 SYSTEM PERFORMANCE REVIEW
 2 YORK REGION TRANSIT MOBILITY PLUS 2004 SYSTEM PERFORMANCE REVIEW The Joint Transit Committee and Rapid Transit Public/Private Partnership Steering Committee recommends the adoption of the recommendation
Sales & Average Price By Major Home Type December 2015 Metrics Sales Average Price Total Total
 Market Watch December 2015 Economic Indicators i Real GDP Growth Q3 2015 2.3% Toronto Employment Growth ii November 2015 Month Mortgage Rates December 2015 1 Year -- 3 Year -- 5 Year -- 4.1% Toronto Unemployment
CAIRNS RECTANGULAR PITCH STADIUM NEEDS STUDY PART 1 CAIRNS REGIONAL COUNCIL DRAFT REPORT SEPTEMBER 2011
 CAIRNS RECTANGULAR PITCH STADIUM NEEDS STUDY PART 1 CAIRNS REGIONAL COUNCIL DRAFT REPORT SEPTEMBER 2011 CAIRNS RECTANGULAR PITCH STADIUM NEEDS STUDY PART 1 Cairns Regional Council September 2011 Coffey
PASSENGER FARE TARIFF AND SALES MANUAL
 REDUCED CITY SPECIFIC S This section is includes all student discounts and fare programs as shown in the Table of Contents for this section. All general rules and regulations shown in Section 7, National
Detached 986 3,143 4,129 $793,842 $597,404 $644,313 Yr./Yr. % Change 20.7% 19.6% 19.8% 6.5% 8.0% 7.6%
 July 2013 Economic Indicators Real GDP Growth i Q1 2013 t 2.5% Toronto Employment Growth ii June 2013 t 5.1% Toronto Unemployment Rate June 2013 u 7.8% Inflation (Yr./Yr. CPI Growth) ii June 2013 t 1.2%
Created by the Downtown Oshawa BIA with the assistance of the City of Oshawa s Economic Development Office OPEN GROW INVEST
 Created by the Downtown Oshawa BIA with the assistance of the City of Oshawa s Economic Development Office OPEN GROW INVEST $$ Downtown Oshawa Opportunity Site New Development Park Space Recent Opening
ROUTE A Monday, December 18, 2017 Tuesday, December 19, 2017 Wednesday, December 20, 2017 Thursday, December 21, 2017 Friday, December 22, 2017
 ROUTE A Kemptville depot (Arena) Kemptville depot (Arena) Kemptville depot (Arena) Kemptville depot (Arena) Ottawa Public Ottawa Public Ottawa Public Arnprior Public SOLS ROUTES Renfrew Public Clarence-
Sales & Average Price By Major Home Type 1,7 January 2014 Average Price Total Total
 January 2014 Economic Indicators Real GDP Growth i Q3 2013 t 2.7% Toronto Employment Growth ii December 2013 t 1.7% Toronto Unemployment Rate December 2013 t 8.4% Inflation (Yr./Yr. CPI Growth) ii December
Sales & Average Price By Major Home Type 1,7 December 2014 Average Price Total Total
 December 2014 Economic Indicators Real GDP Growth i Q3 2014 t 2.8% Toronto Employment Growth ii November 2014 u 1.0% Toronto Unemployment Rate November 2014 u 7.8% Inflation (Yr./Yr. CPI Growth) ii November
The Travel and Tourism Industry in Vermont. A Benchmark Study of the Economic Impact of Visitor Expenditures on the Vermont Economy 2005
 The Travel and Tourism Industry in Vermont A Benchmark Study of the Economic Impact of Visitor Expenditures on the Vermont Economy 2005 INTRODUCTION GENERAL November, 2006 This 2005 update of the original
Moderator: Greg Guatto, President & CEO, Aspen Properties
 Session C2 2:10pm ONE SIZE DOES NOT FIT ALL: UNDERSTANDING THE FACTS & FALLACIES BETWEEN EDMONTON & CALGARY AND HOW THEY ARE PERFORMING IN TODAY S ECONOMY Moderator: Greg Guatto, President & CEO, Aspen
Tight Market Drives Double-Digit Price Growth
 March 2012 Economic Indicators Real GDP Growth i Q4 2011 t 1.8% Toronto Employment Growth ii February 2012 u 1.3% Toronto Unemployment Rate February2012 q 8.6% Inflation (Yr./Yr. CPI Growth) ii February
Ontario Tourism Facts & Figures
 Winter 2006 Vol. 5, No. 4 Ontario Tourism Facts & Figures In This Issue Economic Outlook Canada and Ontario Tourism Statistics International Travel Account International Border Crossings Accommodations
Markham Sports, Entertainment & Cultural Centre April 20, 2012
 Markham Sports, Entertainment & Cultural Centre April 20, 2012 Opportunity Markham has been offered a unique opportunity to partner on a Sports, Entertainment & Cultural Centre ( the Centre ), with approximately
MARKET PROFILE LEASING INFORMATION: MACERICH.COM
 MARKET PROFILE PROPERTY TYPE: Outlet TOTAL SQUARE FEET: 686,000 MORE THAN 200 DESIGNER OUTLETS MAJOR RETAILERS: Burberry, Coach, Columbia Sportswear, DAVIDsTEA, Disney, BOSS Outlet, J. Crew, kate spade
CRYSTAL CENTRE COUNCIL UPDATE PRESENTATION
 CRYSTAL CENTRE Market-Driven Master Plan COUNCIL UPDATE PRESENTATION Conrad Boychuk CEI Architecture Planning Interiors Ron Bidulka PricewaterhouseCoopers LLP Stephen Eborall Bird Construction PRESENTATION
Business Profile. oakville
 Business Profile oakville Location and Transportation When you locate in Oakville, you re connected to the world. Situated at the epicentre of Canada s golden horseshoe, Oakville is a dynamic community
Urban Growth Centres in the Greater Golden Horseshoe
 Urban Growth Centres in the Greater Golden Horseshoe Prepared by Ontario Growth Secretariat Issue I Winter 2005 Table of Contents Section 1 Introduction... 1 Analysis... 3 Future Analysis... 5 Section
Sales & Average Price By Major Home Type. Metrics Sales Average Price Total Total
 Market Watch January 2016 Economic Indicators i Real GDP Growth Q3 2015 2.3% Toronto Employment Growth ii December 2015 4.5% Toronto Unemployment Rate December 2015 -- 7.0% Strong Start to 2016 For All
2 Orangeville Northmen 2 St. Catharines Athletics 2 Windsor Warlocks. 3 Oakville Hawks 3 Nepean Knights 3 Nepean Knights
 2018 Ontario Lacrosse Association A Qualifiers REGULAR SEASON STANDINGS Rank Pee Wee Team Rank Bantam Team Rank Midget Team 1 Oshawa Blue 1 1 2 2 St. Catharines Athletics 2 Windsor Warlocks 3 3 3 4 Kitchener-Waterloo
2010 Nova Scotia Visitor Exit Survey Regional Report
 2010 Nova Scotia Visitor Exit Survey Regional Report A Look at Visitors Who Included Yarmouth and Acadian Shores in their Trip to Nova Scotia Reproduction in whole or in part is not permitted without the
Investing in Brampton s downtown
 Investing in Brampton s downtown 1 REVITALIZING DOWNTOWN BRAMPTON The Next Chapter Public Information Session November 2, 2011, 7 9 pm AGENDA Welcome and opening remarks: City of Brampton Southwest Quadrant
Average Home Price Up Strongly in 2012
 December 2012 Economic Indicators Real GDP Growth i Q3 2012 t 0.6% Toronto Employment Growth ii November 2012 t 4.1% Toronto Unemployment Rate November 2012 u 8.4% Inflation (Yr./Yr. CPI Growth) ii November
Clarington. Proud Home of Darlington Nuclear. Multi-Sector Based Community. Building our life Science Sector. Great Commercial Opportunity ttumi ilhf
 Proud Home of Darlington Nuclear Multi-Sector Based Community Building our life Science Sector Great Commercial Opportunity ttumi ilhf Board of Trade and NUCLEAR SUPPLY CHAIN - OPPORTUNITIES IN CLARINGTON
Sales & Average Price By Major Home Type 1,7 July 2012 Average Price Total Total
 July 2012 Economic Indicators Real GDP Growth i Q1 2012 t 1.9% Toronto Employment Growth ii June 2012 t 0.2% Toronto Unemployment Rate June 2012 q 8.6% Inflation (Yr./Yr. CPI Growth) ii June 2012 t 1.5%
Ontario Sport Tourism Statistics 2014
 Ontario Sport Tourism Statistics 2014 Tourism Research Unit Winter 2017 This report summarizes key characteristics of visitors and visitor spending of trips in Ontario which included: Attend a sports event
Sales & Average Price By Major Home Type 1,7 February 2012 Average Price Total Total
 February 2012 Economic Indicators Real GDP Growth i Q4 2011 t 1.8% Toronto Employment Growth ii January 2012 u 0.9% Toronto Unemployment Rate January 2012 q 8.6% Inflation (Yr./Yr. CPI Growth) ii January
Sales & Average Price By Major Home Type 1,7 October 2013 Average Price Total Total
 October 2013 Economic Indicators Real GDP Growth i Q2 2013 t 1.7% Toronto Employment Growth ii September 2013 t 4.2% Toronto Unemployment Rate September 2013 t 7.9% Inflation (Yr./Yr. CPI Growth) ii September
Director, Community Planning, Toronto and East York District
 STAFF REPORT October 25, 2005 To: From: : Subject: Toronto and East York Community Council Director, Community Planning, Toronto and East York District Status Report OPA & Rezoning Application 05 117524
Number of New MLS Listings Single-Family Residential Breakdown 21.8%
 For Further Information: 443-8152 November, 1998 The Toronto Real Estate Board 7000 6000 5000 4000 3000 2000 1000 0 Jan Feb Mar Number of MLS Sales S.F.D P.O.T. Apr May June July Aug Sept Oct Nov Dec TREB
Ontario Arts and Culture Tourism Profile Executive Summary
 Ontario Arts and Culture Tourism Profile Executive Summary Prepared by for Ontario Arts Council November 2012 ONTARIO ARTS AND CULTURE TOURISM PROFILE EXECUTIVE SUMMARY The Ontario Arts Council (OAC) commissioned
Detached 1,050 3,421 4,471 $1,042,405 $709,116 $787,388 Yr./Yr. % Change 4.3% 17.3% 14.0% 15.9% 10.0% 10.9%
 March 2015 Economic Indicators Real GDP Growth i Q4 2014 t 2.4% Toronto Employment Growth ii February 2015 u 1.0% Toronto Unemployment Rate February 2015 u 7.6% Inflation (Yr./Yr. CPI Growth) ii February
Sports and Entertainment Centre. Council Meeting April 9 th, 2013
 Sports and Entertainment Centre Council Meeting April 9 th, 2013 Community Vision Establish City Centre as the focal point in the Region Memorable public realm with safe and comfortable spaces and streets
State of the Economy St. John's Metro
 State of the Economy St. John's Metro Published by: Department of Economic Development, Tourism & Culture City of St. John's Email: business@stjohns.ca Although every effort has been made to ensure the
Special Events Internal or External
 Merit Winners The Regional Municipality of Durham Kerri King The Regional Municipality of Durham Whitby, Ontario, Canada Need/Opportunity / The Regional Municipality of Durham is the largest geographic
BOSTON PIZZA - STORE LIST - ONTARIO (Store #) Updated April 27.15
 Updated April 27.15") 402 Arthur Street 217 W. Arthur Street Thunder Bay, ON P7E 5P7 807-577-4201 403 Memorial Avenue 505 Memorial Avenue Thunder Bay, ON P7B 3Y6 807-345-6622 404 Goderich 490 Huron Road Goderich, ON N7A 3X8
402 Arthur Street 217 W. Arthur Street Thunder Bay, ON P7E 5P7 807-577-4201 403 Memorial Avenue 505 Memorial Avenue Thunder Bay, ON P7B 3Y6 807-345-6622 404 Goderich 490 Huron Road Goderich, ON N7A 3X8
Strong Sales/Price Growth Continue in 2012
 For All TREB Member Inquiries: (416) 4438152 January 2012 Economic Indicators Real GDP Growth i Q3 2011 t 3.5% Toronto Employment Growth ii December 2011 u 0.6% Toronto Unemployment Rate December 2011
ONroute. Digital Signage Network. Media Kit. Driving sales across southern Ontario
 ONroute Digital Signage Network Media Kit 2013 Driving sales across southern Ontario ONroute overview The stretch of Highway 401 that extends from Windsor to the Quebec border, together with Highway 400,
Sales & Average Price By Major Home Type. Metrics Sales Average Price Total Total
 Market Watch February 2016 Economic Indicators i Real GDP Growth Q4 2015 0.8% Toronto Employment Growth ii January 2016 Month Mortgage Rates February 2016 2016 1 Year -- 3 Year -- 5 Year -- 4.8% Toronto
THE MISSION. A PUBLIC PROCESS FROM BEGINNING TO END.
 THE MISSION. A PUBLIC PROCESS FROM BEGINNING TO END. URBAN DESIGN PRINCIPLES. QUALCOMM STADIUM SITE. I-5 805 15 I-8 DEVELOPMENT PATTERNS. I-5 805 I-I5 I-8 EMBRACE THE RIVER AND PARK SYSTEM. FROM THE MOUNTAINS
Ontario Tourism Facts & Figures
 IN THIS ISSUE Economic Outlook Ontario and Canada Tourism Statistics International Travel Account International Border Crossings Accommodations Travel Price Index Tourism-Related Employment Food Service
Strong Average Price Growth in September
 September 2012 Economic Indicators Real GDP Growth i Q2 2012 t 1.8% Toronto Employment Growth ii August 2012 t 1.6% Toronto Unemployment Rate August 2012 q 8.5% Inflation (Yr./Yr. CPI Growth) ii August
Philadelphia Casino Application Review September 24, 2013 AKRF.COM
 Philadelphia Casino Application Review September 24, 2013 AKRF.COM AKRF s Analysis Objectives 1. Third-party review of applications 2. Normalize estimates 3. Competitive effects net fiscal revenue 4. Induced
Descriptions of routes identified in the Province-wide Cycling Network
 Descriptions of routes identified in the Province-wide Cycling Network As shown on the map posted on the Ministry of Transportation (MTO) web site East Region Along the Ottawa river from Québec Border
Sales & Average Price By Major Home Type 1,7 April 2013 Average Price Total Total
 Market Watch April 2013 Economic Indicators Real GDP Growth i Q4 2012 t 0.6% Toronto Employment Growth ii March 2013 t 4.1% Toronto Unemployment Rate March 2013 q 8.4% Inflation (Yr./Yr. CPI Growth) ii
NEWBORO AND PORTLAND HARBOUR REDVELOPMENT PLANS
 INTRODUCTION The Municipal docks in both Newboro and Portland were transferred to the Township of Rideau Lakes by Parks Canada in 2002. Little has been done to improve the docks physical condition or role
Sales & Average Price By Major Home Type 1,7 August 2014 Average Price Total Total
 August 2014 Economic Indicators Real GDP Growth i Q2 2014 t 3.1% Toronto Employment Growth ii July 2014 u 0.6% Toronto Unemployment Rate July 2014 t 8.2% Inflation (Yr./Yr. CPI Growth) ii July 2014 u 2.1%
Location / Folder Title Description/Publisher Type Year
 Location / Folder Title Description/Publisher Type Year Brantford, Ontario Joseph Brant: Warrior, Statesman, Chief of the Six Nations Historical Pamphlet- Biography 1776 Brantford, Ontario Brantford Transit
Interim Growth Management Policies City of Brampton Council
 Interim Growth Management Policies City of Brampton Council October 24, 2007 Agenda City of Brampton 2006 Official Plan Brampton s Growth Management Initiatives Provincial Growth Plan Brampton s Growth
Locations of 87 New Grocery Stores Authorized to Sell Beer and Cider February 2, :00 A.M.
 NEWS Ministry of Finance Locations of 87 New y Stores Authorized to Sell Beer and Cider February 2, 2018 6:00 A.M. Eighty-seven new independent and large grocery stores in communities across Ontario will
Sales & Average Price By Major Home Type November 2015 Metrics Sales Average Price Total Total
 Market Watch November 2015 Economic Indicators i Real GDP Growth Q3 2015 2.3% Toronto Employment Growth ii October 2015 Month Mortgage Rates November 2015 1 Year 3 Year 5 Year -- -- 4.5% Toronto Unemployment
List of: Fonds F 4598 Dominion Stores Limited storefront photographs collection
 List of: Fonds -0-0-1 Alliston -0-0-2 Amherstburg 1927-6 March 1965 [Before 1932] 9 May 1956-0-0-3 Amherstburg (102 Richmond St.) [1957] -0-0-4 Arnprior -0-0-5 Arnprior [1960] -0-0-6 Aylmer -0-0-7 Barrie
Sales & Average Price By Major Home Type 1,7 June 2014 Average Price Total Total
 June 2014 Economic Indicators Real GDP Growth i Q1 2014 t 1.2% Toronto Employment Growth ii May 2014 t 1.7% Toronto Unemployment Rate May 2014 t 7.6% Inflation (Yr./Yr. CPI Growth) ii May 2014 t 2.3% Bank
Vibrant Communities Canada Cities Reducing Poverty
 Region VC Community Calgary (Community), Calgary (City), Corresponding Community Data Consortium Calgary Calgary Lethbridge, Medicine Hat, Red Deer, Consortium under consideration Edmonton, Grande Prairie,
Municipality of West Grey
 Municipality of West Grey The Municipality of West Grey is located in southwestern Grey County, and is an amalgamation of the former Townships of Bentinck, Glenelg, Normanby, the Town of Durham and the
Sales & Average Price By Major Home Type 1,7 March 2014 Average Price Total Total
 March 2014 Economic Indicators Real GDP Growth i Q4 2013 t 2.9% Toronto Employment Growth ii February 2014 t 1.8% Toronto Unemployment Rate February 2014 u 8.3% Inflation (Yr./Yr. CPI Growth) ii February
HEALTH SECTOR ECONOMIC INDICATORS REPORT
 HEALTH SECTOR ECONOMIC INDICATORS REPORT For: Mid North Coast Local Health District Report prepared by: April 2013 Table of Contents Introduction 3 Executive Summary 4 Output 5 Value-Added 7 Workforce
STAFF REPORT ACTION REQUIRED
 nsert TTC logo here STAFF REPORT ACTION REQUIRED Presentation: Preliminary 2016 TTC Operating Budget: Fare Scenarios Date: September 15, 2015 To: From: TTC Budget Committee Chief Executive Officer Summary
Welcome. Conversations about our future. Please sit at any of the front tables We will get started at 6:30 pm
 Welcome Toronto Pearson Connects: Conversations about our future Please sit at any of the front tables We will get started at 6:30 pm Childcare? Please take your child to registration Cantonese? There
2017 EDCO Awards of Excellence
 EDCO Leadership Awards 2017 EDCO Awards of Excellence EDCO President s Award (2) Lauren Millier City of Toronto EDCO Young Influencer of the Year Savanna Myers, Grey County Joseph A Montgomery Economic
DISCLAIMER. Please contact with any questions. Altus Group Limited altusgroup.com/datasolutions
 DISCLAIMER This presentation, or any part thereof, may not be reproduced or transmitted in any form by any means, without the express written permission of Altus Group in each instance. The material in
HOUSEHOLD TRAVEL SURVEY
 HOUSEHOLD TRAVEL SURVEY Household Travel Survey i TABLE OF CONTENTS Page 1.0 INTRODUCTION... 1 2.0 SUMMARY OF TRAVEL... 2 2.1 All-Day Travel Patterns... 2 2.1.1 Automobile Availability... 2 2.1.2 Trip
Lodging Outlook. Canadian August What Does a Franchise Cost? computers and reservation personnel.
 Canadian August 2005 Lodging Outlook SMITH TRAVEL RESEARCH What Does a Franchise Cost? By: Stephen Rushmore, MAI, CHA - HVS International - New York T he selection of an appropriate hotel franchise affiliation
February Price Growth Continues in February. Economic Indicators. TorontoMLS Sales Activity 1,7. TorontoMLS Average Price 1,7 $510,580 $500,249
 February 2013 Economic Indicators Real GDP Growth i Q4 2012 t 0.6% Toronto Employment Growth ii January 2013 t 4.6% Toronto Unemployment Rate January 2013 u 8.2% Inflation (Yr./Yr. CPI Growth) ii January
2018 Airport Master Plan. Public Meeting and Open House February 7, 2018
 2018 Airport Master Plan Public Meeting and Open House February 7, 2018 Overview PortsToronto and Billy Bishop Airport Background on Airport Master Plan process, objectives and key components Managed Growth
UNLV Campus Improvement Authority Board Estimated Event Utilization and Financial Projections. May 22, 2014
 UNLV Campus Improvement Authority Board Estimated Event Utilization and Financial Projections May 22, 2014 1 CIAB WORK SESSION 2 CIAB WORK SESSION RECAP KEY TAKE-AWAYS: There is a need in the market for
Federal Budget Submission. Prepared for the House of Commons Standing Committee on Finance. Greater Toronto Airports Authority
 2018-2019 Federal Budget Submission Prepared for the House of Commons Standing Committee on Finance Greater Toronto Airports Authority - August 2017 - Contact: Lorrie McKee Director, Public Affairs and
Transit System Performance Update
 Clause 5 in Report No. 4 of Committee of the Whole was adopted, without amendment, by the Council of The Regional Municipality of York at its meeting held on March 29, 2018. 5 2017 Transit System Performance
2009 Muskoka Airport Economic Impact Study
 2009 Muskoka Airport Economic Impact Study November 4, 2009 Prepared by The District of Muskoka Planning and Economic Development Department BACKGROUND The Muskoka Airport is situated at the north end
Report on Palm Beach County Tourism Fiscal Year 2007/2008 (October 2007 September 2008)
") Report on Palm Beach County Tourism Fiscal Year 2007/2008 (October 2007 September 2008) Prepared for: Tourist Development Council of Palm Beach County Prepared by: 4020 S. 57 th Avenue Lake Worth, FL 33463
Report on Palm Beach County Tourism Fiscal Year 2007/2008 (October 2007 September 2008) Prepared for: Tourist Development Council of Palm Beach County Prepared by: 4020 S. 57 th Avenue Lake Worth, FL 33463