Transit System Performance Update
|
|
|
- Jonathan Armstrong
- 5 years ago
- Views:
Transcription
1 Clause 5 in Report No. 4 of Committee of the Whole was adopted, without amendment, by the Council of The Regional Municipality of York at its meeting held on March 29, Transit System Performance Update Committee of the Whole recommends: 1. Receipt of the presentation by Ann-Marie Carroll, General Manager, Transit, Transportation Services. 2. Adoption of the following recommendation contained in the report dated February 16, 2018 from the Commissioner of Transportation Services: 1. This report be received for information. Report dated February 16, 2018 from the Commissioner of Transportation now follows: 1. Recommendations It is recommended this report be received for information. 2. Purpose This report provides Council with 2017 York Region Transit (YRT) ridership and overall system performance information. 3. Background Transit measures service performance in a number of ways. Revenue and operating data is generated through a variety of software that is gathered into a business intelligence system. Reports are generated and used by staff to monitor system-wide performance, as well as making operational and financial decisions. Staff also monitors service in real-time to manage the day-to-day operation. The most common service performance measures used by the transit industry include: Committee of the Whole 1 Transportation Services March 1, 2018
2 2017 Transit System Performance Update Revenue ridership - the number of paying travellers using the service. Net cost per passenger net cost to operate a route divided by the number of travellers On-time performance the reliability of the service provided to the traveller. This is a key indicator for the overall success of the Operation and Maintenance contracts Revenue-to-cost ratio revenue collected through transit fares compared to the cost to operate service 4. Analysis and Implications YRT s revenue ridership increased by 1.2 per cent from approximately 22.8 million in 2016 to 23.1 million in 2017 In 2017, 131 routes and 519 Region-owned buses provided service across York Region s large geographic area. Revenue ridership across the Greater Toronto and Hamilton Area continues to grow, as shown in Table 1. Agencies seeing healthy ridership growth, such as Brampton Transit, have recently introduced new or expanded rapid transit services and improved frequencies along core route feeding their rapid transit network. Table 1 Greater Toronto and Hamilton Area 2016/2017 Revenue Ridership Transit Agency Change Revenue Ridership (+/- %) Brampton Transit Oakville Transit Burlington Transit ,129,596 2,851,369 1,898,105 27,391,889 2,945,877 1,956,884 GO Transit ,838,152 68,464,543 York Region Transit MiWay (City of Mississauga) Toronto Transit Commission ,822,806 39,014, ,595,000 23,091,613 39,400, ,200,000 Hamilton Street Railway Durham Region Transit -0.3 n/a* 21,480,017 10,189,642 21,406,608 n/a* *Ridership not yet reported for 2017 Committee of the Whole 2 Transportation Services March 1, 2018
3 2017 Transit System Performance Update The college faculty member strike from October 16, 2017 to November 20, 2017, had a negative impact on transit ridership across the Greater Toronto and Hamilton Area. In York Region, the estimated total revenue ridership loss is estimated at 49,500, or 0.2 per cent. Viva service experienced an overall ridership increase of 2.6 per cent in 2017 In 2017, Viva services experienced the highest overall ridership increase with an average of 24,134 travellers per weekday. Ridership increased the most on completed sections of rapidway in the Towns of Richmond Hill and Newmarket, and the City of Markham: Viva Purple ridership in the City of Markham and Town of Richmond Hill increased 5.3 per cent over 2016 Viva Pink ridership in the City of Markham and Town of Richmond Hill increased 5.3 per cent over 2016 Viva Yellow ridership in the Town of Newmarket increased 12.7 per cent over 2016 Conventional service experienced an overall ridership increase of 0.1 per cent in 2017 Conventional service carried 53,951 travellers per weekday with Express Services, High School Specials and routes operating on major corridors carrying the most travellers. Key destinations in 2017 included Toronto Transit Commission (TTC) Subway Stations, Vaughan Mills Mall, York University, Canada s Wonderland, Markham Stouffville Hospital, Markham City Centre, Markville Mall and Upper Canada Mall. Mobility Plus service experienced an overall ridership increase of 0.1 per cent and on-demand of 84 per cent In 2017, Mobility Plus carried an average of 1,416 travellers per weekday, or 408,190 overall. In 2017, Mobility Plus launched the Council-approved On-Demand Transit Strategy, to reduce conventional service operating costs. The strategy provides service delivery options for low-demand areas and expanded Family of Service options, and helps to improve service efficiency for the entire system. Committee of the Whole 3 Transportation Services March 1, 2018
4 2017 Transit System Performance Update On-demand service delivered an additional 8,913 trips in Additional ondemand services will be implemented in 2018, and subsequent years, to improve the efficiency of operating transit services in low-demand areas of the Region. Net-cost-per-passenger improved system-wide in 2017 Net-cost-per-passenger is calculated in February and September each year. In 2017, 64 routes operated rush hour services within the one-time and two-time average fare categories. Routes within these categories carry significantly more travellers per trip, reducing the cost to operate the service. Routes operating at a higher subsidy per traveller operate less frequent service in suburban and rural areas. Attachment 1 shows the September 2017 net-costper-passenger for the YRT system. On-time performance continued to improve in 2017 On-time performance is a measure of the quality of service scheduled by YRT and delivered by its operating contractors. Staff monitor on-time performance both on-street and through the centralized control centre. Using data processed through a business intelligence system, staff determines the on-time performance at every timing point on every route, makes system adjustments and measures the delivery of service by the each contractor. The on-time performance target for conventional service is 90 per cent, Viva service is 95 per cent and Mobility Plus service is 92 per cent. These targets continued to be met in 2017, as shown in Figure 1. Committee of the Whole 4 Transportation Services March 1, 2018

5 2017 Transit System Performance Update Figure On-Time Performance YRT maintained a revenue-to-cost ratio of 40 per cent in 2017 Total revenue collected in 2017 was approximately $72.0 million and total direct operating expenditures were $178.8 million. This allowed YRT to remain at a 40 per cent revenue-to-cost ratio transit initiatives are intended to be cost-neutral and funded by identified operating efficiencies. A revenue-to-cost ratio of 40 per cent is expected to be maintained in Figure 2 shows revenue-to-cost ratio trends on an annual basis and Table 2 identifies the revenue-to-cost ratios for transit agencies operating in the Greater Toronto and Hamilton area. Committee of the Whole 5 Transportation Services March 1, 2018

6 2017 Transit System Performance Update Figure 2 Revenue-to-Cost Ratio Trends Annual trends show the revenue-to-cost ratio for the entire system averaging at 40 per cent. Viva maintained a 50 per cent or higher revenue-to-cost ratio and this can be attributed to the frequency of service to major destinations and running on high-demand corridors. Some YRT conventional services operate below the 40 per cent average because they are community-based and less frequent. Table 2 Greater Toronto and Hamilton Area 2016 Revenue-to-Cost Ratio Transit Agency* Revenue-to-Cost Ratio (2016) GO Transit 70% Toronto Transit Commission 70% Hamilton Street Railway 50% MiWay (City of Mississauga) 48% Brampton Transit 46% York Region Transit 40% Durham Region Transit 39% Burlington Transit 35% Oakville Transit 30% *Transit agencies have not yet reported revenue-to-cost ratio for 2017 Committee of the Whole 6 Transportation Services March 1, 2018
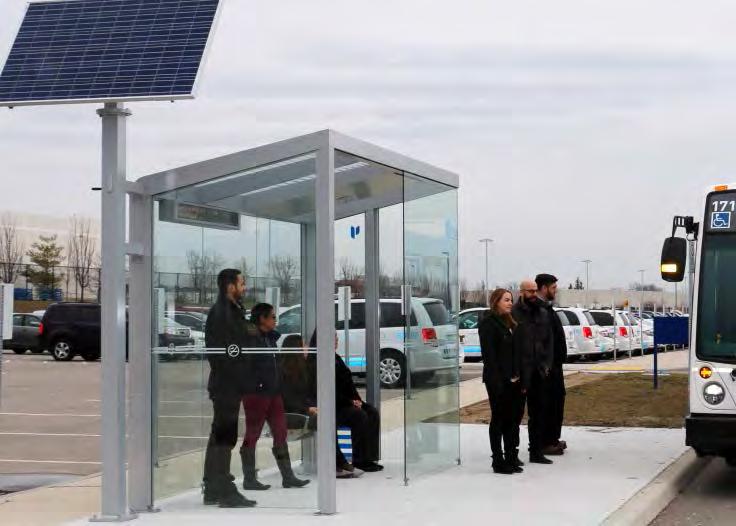
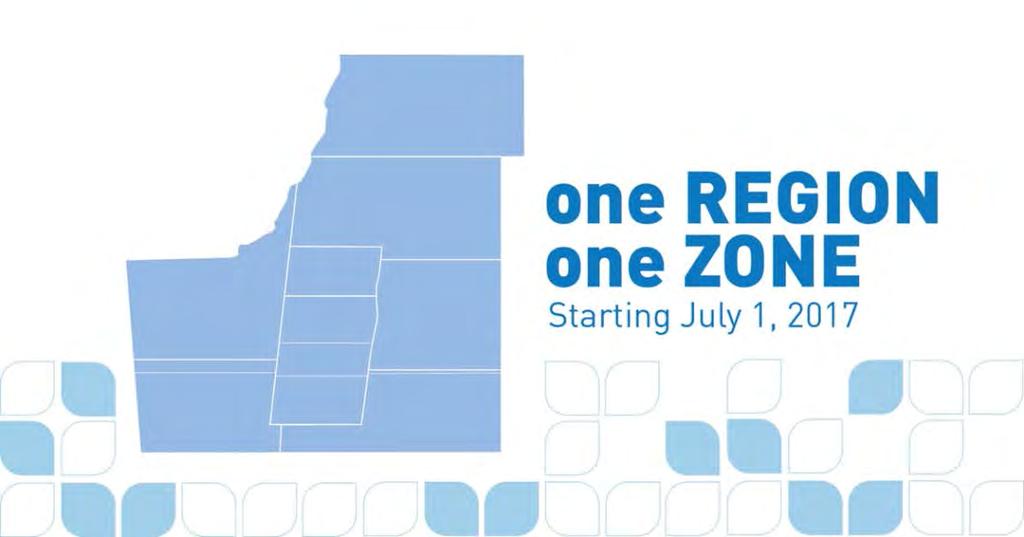
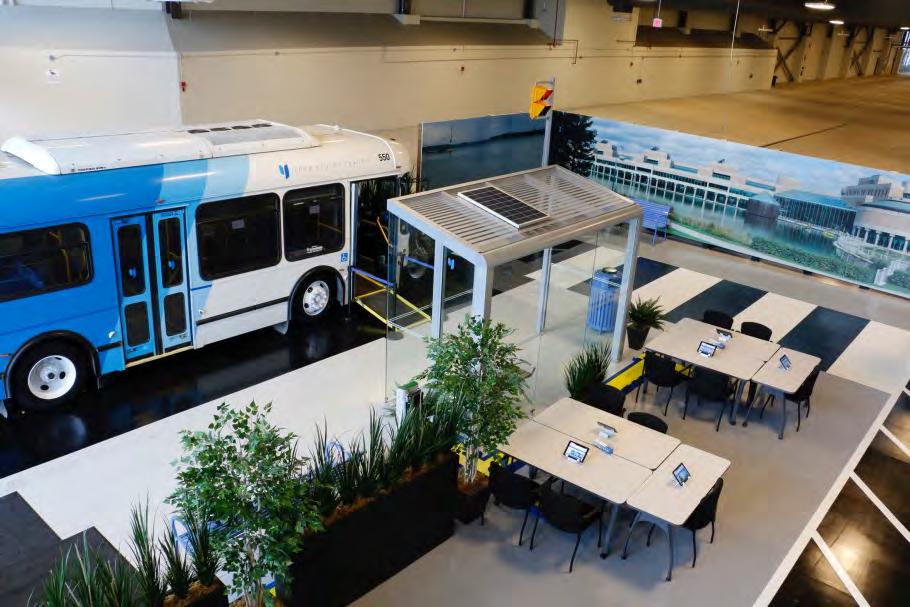
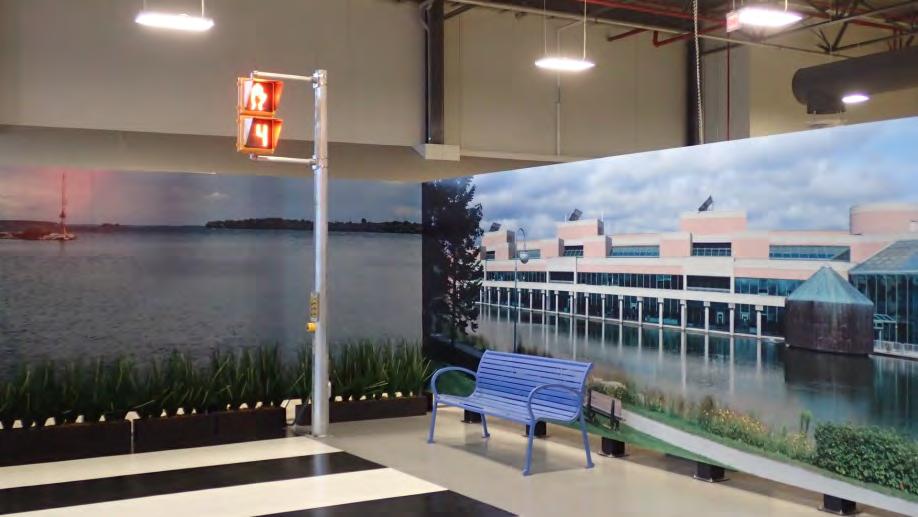
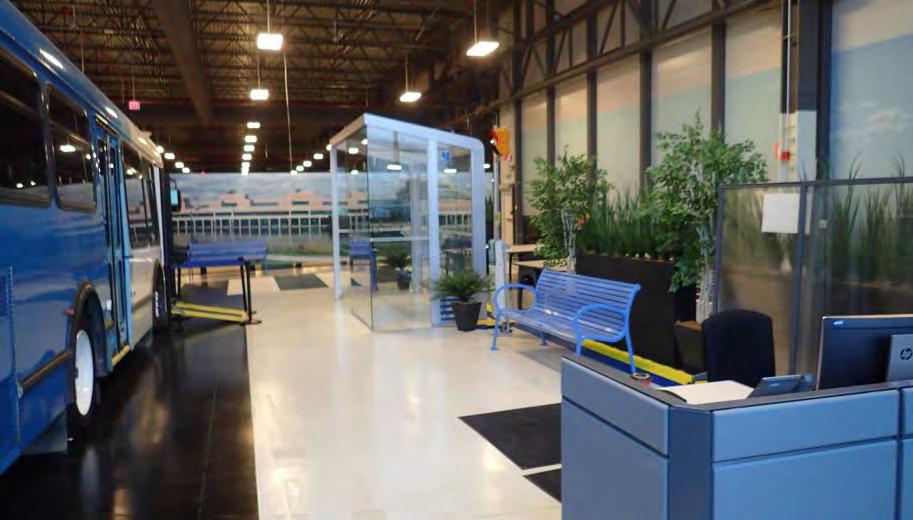
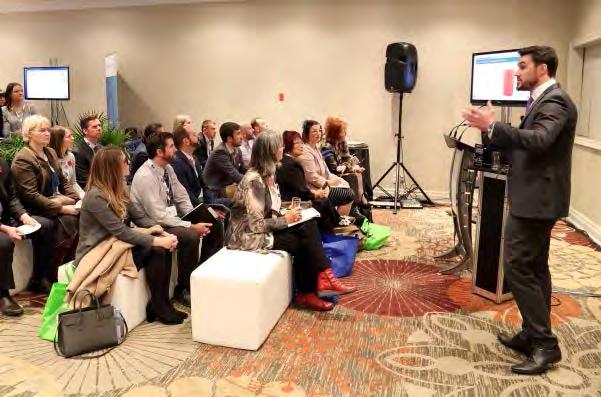
7 2017 Transit System Performance Update YRT s revenue-to-cost ratio aligns with other transit agencies operating services in similar geographic areas to York Region. In 2017, YRT implemented new projects and programs to enhance the overall traveller experience 2017 Transit initiatives included: Realigned transit services to the TTC Line 1 Subway Extension and began operating service to two new bus terminals, with the third to open in 2018 Launched a new Viva Purple branch in the City of Markham Restructured Viva Orange to service the Richmond Hill Centre Terminal Converted four TTC contracted services over to YRT service Made service improvements on select base routes Launched the YRT Pay App, removed all fare zones and began the process of becoming a paperless transit system Began construction of a vendor space at Richmond Hill Centre Terminal Implemented Wi-Fi at all YRT transit terminals Built and opened the YRT Travel Training Centre Hosted the 2017 Canadian Urban Transit Association Fall Forum Designed and launched YRT Live Chat Additional measures were implemented to operate services more effectively In 2017, Council approved the new On-Demand strategy. Staff began to convert routes operating in the three and four-times the average fare categories to On- Demand service. As part of the 2018/2019 Annual Service Plan process, additional poor performing conventional routes will be identified for conversion to On-Demand service. In December 2017, with the opening of the Line 1 Subway, YRT began operating 60-foot articulated buses on Jane Street. This reduced the need to add extra buses to accommodate passengers travelling in this high-demand corridor. Committee of the Whole 7 Transportation Services March 1, 2018
8 2017 Transit System Performance Update Articulated vehicles provide additional capacity for travellers at no additional cost to operate the service. Council approved the Ridership Growth Strategy in November 2017 Staff will continue implementing the YRT Ridership Growth Strategy, specifically focusing on the following primary initiatives: Raising community awareness Continuing to find fare and service integration opportunities with other transit agencies Increasing communication within York Region Reviewing and implementing opportunities to invest in new service initiatives Focusing service in areas of concentrated urban form Continuing to implement special pass programs Monitoring changing demographics to identify opportunities to tailor specific transit services 5. Financial Considerations YRT S 2017 revenue was approximately $72.0 million Fare revenue specifically from increased ridership totalled $0.8 million. In addition to fare revenue, conventional bus and shelter advertising resulted in an additional $1.7 million in non-fare revenue. In 2017, Pattison Outdoor Advertising successfully completed the second year of their five-year contract selling advertising on conventional YRT buses. In the second year of the contract, they brought in $1.3 million in non-fare revenue for the system. Conventional bus shelter advertising, sold by Outfront Media, brought in $0.4 million. Committee of the Whole 8 Transportation Services March 1, 2018
9 2017 Transit System Performance Update 6. Local Municipal Impact Well-planned transit helps to shape and connect communities. The Region s investment in public transit provides citizens with an enhanced, efficient and reliable transportation choice. Reliable, safe, traveller-friendly transportation options attract new citizens, businesses and investors to York Region and provide economic benefits. 7. Conclusion Transit met its primary service objectives in 2017 Transit ridership in York Region exceeded staff s forecast for A 1.7 per cent ridership increase is being forecasted for Staff will monitor development along the more densely developed corridors and continue to align service strategies, such as the Frequent Transit Network identified in the Region s Transportation Master Plan, to take advantage of ridership potential. Revenue-to-cost ratio of 40 per cent was achieved in 2017 and is forecasted to be maintained into Service quality remains high with on-time performance exceeding the expected standard. For more information on this report, please contact Ann-Marie Carroll, General Manager, York Region Transit at ext The Senior Management Group has reviewed this report. February 16, 2018 Attachments (1) Accessible formats or communication supports are available upon request Committee of the Whole 9 Transportation Services March 1, 2018
10 $50.00 Routes with R/C above 100% Routes with R/C between 100% to 40% Routes with R/C of 40% or less Notes/Assumptions: Net Cost Per Passenger - Weekday Rush Hour Service Direct Contractor Cost (September 2017) Net cost for all weekday rush hour service routes: $75,613/day Attachment 1 $6,856/day Cost to operate all >4x weekday rush hour services Net Cost per Passenger ($) $40.00 $30.00 $20.00 $10.00 Average fare - $3.08 (September Finance) Ridership based on September 2017 Billable hours = Service hours + layover + deadhead (Based on September 2017) Costs = Contractor Rate + Fuel (September Finance) 40% R/C - budgeted system average (September Finance) $57,650/day Cost to operate all <2x weekday rush hour services <2x Avg Fare - $6.16 $8,724/day Cost to operate all 2-3x weekday rush hour services <3x Avg Fare - $9.24 <4x Avg Fare - $12.32 >4x Avg Fare $2,383/day Cost to operate all 3-4x weekday rush hour services $- 20 blue/blue A 300 4/4A /A/B/E 2 yellow purple 99 1 orange /90B pink TTC 68B 85/85C /77A TTC 35D 360 TTC 105/105B TTC 129A 22/22A TTC 165D/165F TTC 107B/107C /98E TTC /83A 33/33A TTC 17A 57/57A green TTC 102D /55B /223A DAR $10.00 YRT/Viva Routes Notes: Viva orange ridership includes Route Queen Züm ridership Page 1
11 $50.00 Routes with R/C above 100% Routes with R/C between 100% to 40% Routes with R/C of 40% or less Notes/Assumptions: Net Cost Per Passenger - Weekday Non-Rush Hour Service Direct Contractor Cost (September 2017) Net cost for all weekday non-rush hour routes: $92,969/day $81.96 $90.84 $40.00 Average fare - $3.08 (September Finance) Ridership based on September 2017 $5,381/day Cost to operate all 3-4x weekday non-rush hour services $17,259/day Cost to operate all >4x weekday non-rush hour services Net Cost per Passenger ($) $30.00 $20.00 $10.00 Billable hours = Service hours + layover + deadhead (Based on September 2017) Costs = Contractor Rate + Fuel (September Finance) 40% R/C - budgeted system average (September Finance) $46,118/day Cost to operate all <2x weekday non-rush hour services $- blue orange purple 90/90B 91/A/B/E 18 5 yellow 8 22/22A 4/4A (inc. 98/99) 2 85/85C TTC 105A/105D 77/77A /57A TTC 165D /55B TTC 129A 33/33A 9 83/83A TTC TTC 102D TTC 107B/107C /590 TTC 68B / DAR 52 DAR 31/32/84 DAR DAR DAR 560 DAR North 40 DAR 44 DAR <2x Avg Fare - $ DAR $24,211/day Cost to operate all 2-3x weekday non-rush hour services <3x Avg Fare - $9.24 <4x Avg Fare - $12.32 >4x Avg Fare -$10.00 YRT/Viva Routes Notes: Viva orange ridership includes Route Queen Züm ridership. *Zone 1 DAR is weekday midday zone-based Dial-a-ride in the Oak Ridges area (Route 84 - Oak Ridges) *Zone 2 DAR is weekday evening and Saturday zone-based Dial-a-ride in the Aurora and Oak Ridges area Page 2
12 $50.00 Routes with R/C above 100% Routes with R/C between 100% to 40% Routes with R/C of 40% or less Notes/Assumptions: Net Cost Per Passenger - School Special Service Direct Contractor Cost (September 2017) Net cost for all School Special routes: $2,135/day Net Cost per Passenger ($) $40.00 $30.00 $20.00 $10.00 Average fare - $3.08 (September Finance) Ridership based on September 2017 Billable hours = Service hours + layover + deadhead (Based on September 2017) Costs = Contractor Rate + Fuel (September Finance) 40% R/C - budgeted system average (September Finance) $1,851/day Cost to operate all <2x school special services $180/day Cost to operate 2-3x school special service $104/day Cost to operate 3-4x school special service $ <2x Avg Fare - $6.16 3x Avg Fare - $9.24 4x Avg Fare -$10.00 YRT/Viva School Special Routes Page 3
13 $50.00 Routes with R/C above 100% Routes with R/C between 100% to 40% Routes with R/C of 40% or less Notes/Assumptions: Net Cost per Passenger - Saturday Service Direct Contractor Cost (September 2017) Net cost for all Saturday routes: $78,563/day $75.46 $ $ $ $ $ Net Cost per Passenger ($) $40.00 $30.00 $20.00 Average fare - $3.08 (September Finance) Ridership based on September 2017 Billable hours = Service hours + layover + deadhead (Based on September 2017) Costs = Contractor Rate + Fuel (September Finance) 40% R/C - budgeted system average (September Finance) $49,799/day Cost to operate all <2x Saturday services $10.00 $- blue /91A /4A 5 orange 99 TTC 160 purple TTC 129A yellow TTC 165D TTC 105/105B TTC 102D 24 57A TTC 107C/107D /33A 40 TTC 68B / DAR <2x Avg Fare - $ DAR 31/32/84 52 DAR 56 DAR 44 DAR 10 DAR 15 DAR 50A DAR 41 DAR 40 DAR 3x Avg Fare - $9.24 $10,979/day Cost to operate all 2-3x Saturday services 4x Avg Fare - $12.32 $5,870/day Cost to operate all 3-4x Saturday services >4x Avg Fare $11,888/day Cost to operate all >4x Saturday services -$10.00 YRT/Viva Routes Note: Viva orange ridership includes Route Queen Züm ridership. *Zone 2 DAR is weekday evening and Saturday zone-based Dial-a-ride in the Aurora and Oak Ridges area (Route 32 - Aurora South / Routes 84 - Oak Ridges) Page 4
14 $50.00 Routes with R/C above 100% Routes with R/C between 100% to 40% Routes with R/C of 40% or less Notes/Assumptions: Net Cost per Passenger - Sunday/Holiday Service Direct Contractor Cost (September 2017) Net cost for all Sunday/Holiday routes: $57,828/day $11,362/day Cost to operate all >4x Sunday/Holiday services $90.84 $ $ $ Net Cost per Passenger ($) $40.00 $30.00 $20.00 Average fare - $3.08 (September Finance) Ridership based on September 2017 Billable hours = Service hours + layover + deadhead (Based on September 2017) Costs = Contractor Rate + Fuel (September Finance) 40% R/C - budgeted system average (September Finance) $30,984/day Cost to operate all <2x Sunday/Holiday services $10.00 $- 760 blue purple /4A TTC 129A 99 TTC 160 orange yellow 80 TTC 165D 2 TTC 105/105B TTC 102D A TTC 68B <2x Avg Fare - $6.16 TTC 107C/107D / DAR 10 DAR 50A DAR 15 DAR <3x Avg Fare - $9.24 $8,242/day Cost to operate all 2-3x Sunday/Holiday services <4x Avg Fare - $12.32 $7,240/day Cost to operate all 3-4x Sunday/Holiday services >4x Avg Fare -$10.00 YRT/Viva Routes Note: Viva orange ridership includes Route Queen Züm ridership. Page 5


15 York Region Transit 2017 System Performance Presentation to Committee of the Whole Ann-Marie Carroll March 1,


16 Agenda System Performance Traveller Enhancements 2
17 System Performance Measurements Metric Revenue Ridership Net cost per passenger On-time performance Revenue-to-cost ratio Definition Number of paying travellers using the service. Does not include transfers. Net cost to operate a route divided by the number of travellers. Reliability of the service provided to the traveller. This is a key indicator for the overall success of the Operation and Maintenance Contracts. Revenue collected through transit fares compared to the cost to operate service. Customer feedback is also used to adjust and plan service 3

18 Revenue Ridership 39 per cent of YRT travellers are age 25 to 44 4

19 Mobility Plus Ridership Mobility Plus ridership remained stable 5

20 On-Demand Ridership On-Demand ridership grew by approximately 84 per cent in
21 Revenue Ridership Transit Agency Change % (preliminary results) Brampton Transit ,129,596 27,391,889 Oakville Transit 3.3 2,851,369 2,945,877 Burlington Transit 3.1 1,898,105 1,956,884 GO Transit ,838,152 68,464,543 York Region Transit ,822,806 23,091,613 MiWay (City of Mississauga) ,014,497 39,400,996 Toronto Transit Commission ,595, ,200,000 Hamilton Street Railway ,480,017 21,406,608 Durham Region Transit n/a 10,189,642 n/a Ridership across the GTHA continues to grow at a moderate rate 7


22 Net Cost Per Passenger Weekday rush-hour 8
23 On-Time Performance On-time performance targets are 90 per cent for YRT; 95 per cent for Viva and 92 per cent for Mobility Plus 9

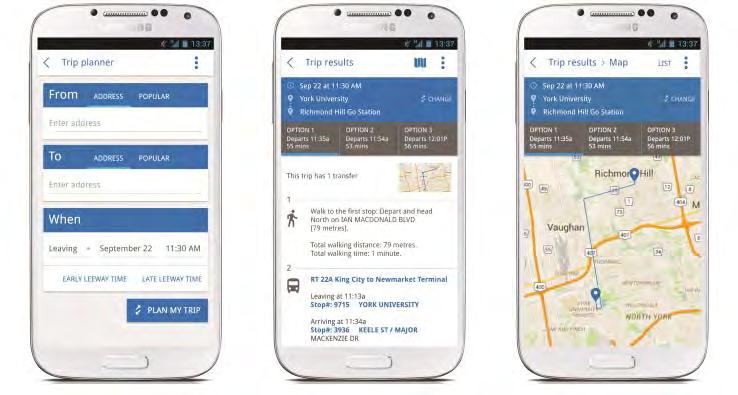
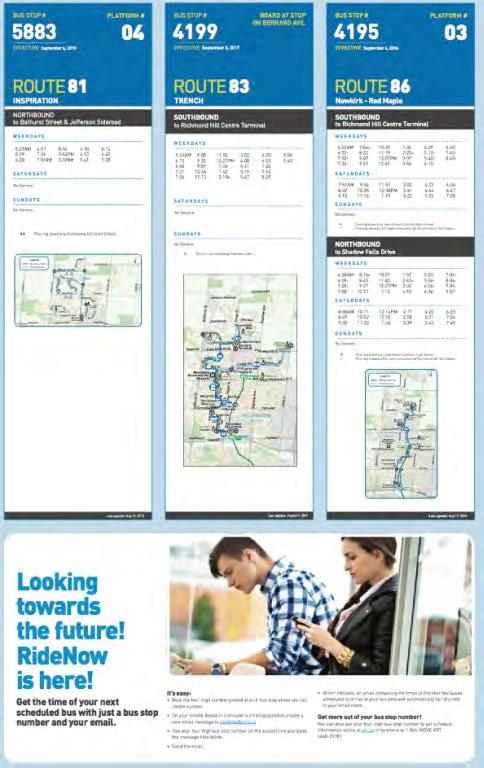

24 Next Bus Information YRT offers travellers many options to view their route information 10

25 Revenue-to-Cost Ratio In 2017, YRT/Viva met its revenue-to-cost ratio target of 40 per cent 11
26 Revenue-to-Cost Ratio Transit Agency Revenue-to-Cost Ratio 2016 Service Area Square Kilometres GO Transit 70% Inter-Regional Toronto Transit Commission 70% 632 Hamilton Street Railway 50% 235 MiWay (City of Mississauga) 48% 179 Brampton Transit 46% 267 York Region Transit 40% 1,776 Durham Region Transit 39% 406 Burlington Transit 35% 98 Oakville Transit 30% 104 YRT s revenue-to-cost ratio aligns with other GTHA transit systems 12

27 2017 Traveller Enhancements 13


28 Pay App and Zone Removal 14

29 2018 Annual Service Plan 15

30 On-Demand Transit Strategy Travellers can request transit services when and where they need it 16

31 Travel Training Centre 17


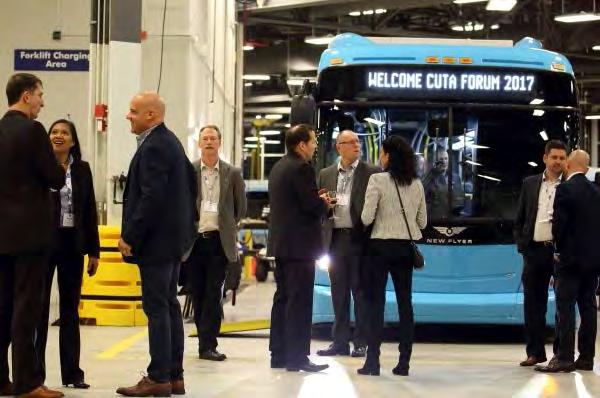
32 Hosted the CUTA Fall Forum 18

33 Ridership Growth Strategy 19


34 Special Pass Programs YRT is implementing fare programs to offer even more convenient payment options for travellers 20

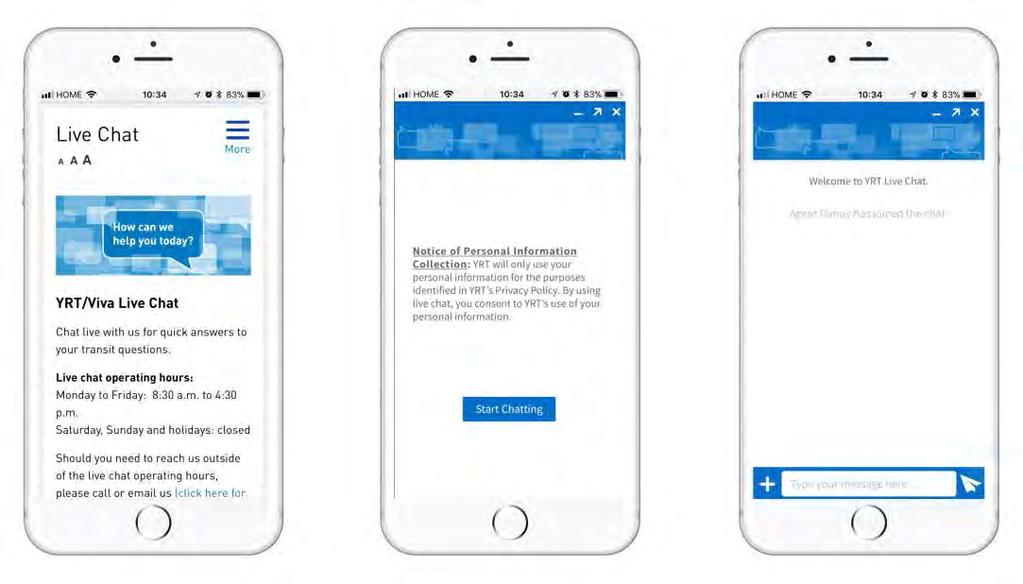

35 Live Chat Pilot 21

36 Wi-Fi at Terminals 22


37 Line 1 Subway Extension 23


38 Increased Traveller Capacity YRT now operates articulated buses on high-demand corridors 24


39 Richmond Hill Centre Terminal 25
40
2016 Annual Service Plan
 YRT/Viva Five-Year Strategic Plan 2016 Annual Service Plan Presentation to the City of Markham Development Services Committee November 16, 2015 Adrian Kawun Overview 1. System Overview YRT/Viva Services
8 CROSS-BOUNDARY AGREEMENT WITH BRAMPTON TRANSIT
 8 CROSS-BOUNDARY AGREEMENT WITH BRAMPTON TRANSIT The Transportation Services Committee recommends the adoption of the recommendations contained in the following report dated May 27, 2010, from the Commissioner
YRT/VIVA PROPOSED FARE INCREASE
 Report No. 7 of the Transportation Services Committee Regional Council Meeting of September 22, 1 2012 YRT/VIVA PROPOSED FARE INCREASE The Transportation Services Committee recommends: 1. Receipt of the
1 YORK REGION TRANSIT/ VIVA SYSTEM PERFORMANCE
 Report No. 6 of the Transportation Services Committee Regional Council Meeting of June 23, 2011 1 YORK REGION TRANSIT/ VIVA SYSTEM PERFORMANCE The Transportation Services Committee recommends: 1. Receipt
14 YORK REGION TRANSIT (YRT/VIVA) SOUTHWEST DIVISION OPERATIONS AND MAINTENANCE CONTRACT EXTENSION
 SOUTHWEST DIVISION OPERATIONS AND MAINTENANCE CONTRACT EXTENSION") Clause No. 14 in Report No. 13 of the was adopted, without amendment, by the Council of The Regional Municipality of York at its meeting held on September 11, 2014. 14 YORK REGION TRANSIT (YRT/VIVA) SOUTHWEST
Clause No. 14 in Report No. 13 of the was adopted, without amendment, by the Council of The Regional Municipality of York at its meeting held on September 11, 2014. 14 YORK REGION TRANSIT (YRT/VIVA) SOUTHWEST
4 YORK REGION TRANSIT DON MILLS SUBWAY STATION ACCESS AGREEMENT
 4 YORK REGION TRANSIT DON MILLS SUBWAY STATION ACCESS AGREEMENT The Transit Committee recommends the adoption of the recommendations contained in the following report, September 20, 2007, from the General
2 YORK REGION TRANSIT MOBILITY PLUS 2004 SYSTEM PERFORMANCE REVIEW
 2 YORK REGION TRANSIT MOBILITY PLUS 2004 SYSTEM PERFORMANCE REVIEW The Joint Transit Committee and Rapid Transit Public/Private Partnership Steering Committee recommends the adoption of the recommendation
2017 Annual Service Plan
 2017 Annual Service Plan 2017 Annual Service Plan 2017 Annual Service Plan Objectives Transition to a Frequent Transit Network (FTN) with a strong grid network Preparing the Viva Network Expansion Plan
IT S BACK TO SCHOOL WITH YRT
 FALL 2018 MyTransit > > Follow #RiderAlert on Twitter, @YRTViva, for major service updates > > Have questions? Find the answers on talk2yrt.ca or submit your own questions IT S BACK TO SCHOOL WITH YRT
The Importance of Service Frequency to Attracting Ridership: The Cases of Brampton and York
 The Importance of Service Frequency to Attracting Ridership: The Cases of Brampton and York Jonathan English Columbia University CUTA Conference May 2016 Introduction Is density the most important determinant
General Issues Committee Item Transit Operating Budget Ten Year Local Transit Strategy
 General Issues Committee Item 4.1 2017 Transit Operating Budget Ten Year Local Transit Strategy January 27, 2017 Presentation Outline 2017 Operating Budget Overview Ten Year Local Transit Strategy 2 2017
Memorandum. Committee of the Whole. Paul Jankowski Commissioner of Transportation Services. Date: September 4, 2018
 Office of the Commissioner Transportation Services Memorandum To: From: Committee of the Whole Paul Jankowski Commissioner of Transportation Services Date: September 4, 2018 Re: York University Transit
Kathleen Llewellyn-Thomas, Commissioner of Transportation Services
 Transportation Services Department MEMORANDUM TO: FROM: Transportation Services Committee Kathleen Llewellyn-Thomas, Commissioner of Transportation Services DATE: January 21, 2011 RE: December 2010 Transit
EX28.6 REPORT FOR ACTION. Advancing Fare Integration SUMMARY. Date: October 16, 2017 To: Executive Committee From: City Manager Wards: All
 EX28.6 REPORT FOR ACTION Advancing Fare Integration Date: October 16, 2017 To: Executive Committee From: City Manager Wards: All SUMMARY In July 2016, City Council considered a current state assessment
Appendix VII TTC Routes
 Appendix VII TTC Routes Route: TTC 17A Birchmount Type: Local Description: A main north-south route operating along Birchmount Road in Markham southward to Warden Subway Station with peak service to Royal
TECHNOLOGY QUALITY OF LIFE CAREER CHOICES INNOVATION GTA RAPID TRANSIT URBAN LIVING TOP RANKED SCHOOLS FUN HOUSING OPTIONS ARTS NATURE STYLE CULTURE
 CAREER CHOICES INNOVATION QUALITY OF LIFE TECHNOLOGY HOUSING OPTIONS ARTS CULTURE URBAN LIVING GTA RAPID TRANSIT TOP RANKED SCHOOLS FUN NATURE STYLE DIVERSITY MARKHAM VAUGHAN RICHMOND HILL NEWMARKET AURORA
Date: 11/6/15. Total Passengers
 Total San Diego Metropolitan Transit System POLICY 42 PERFORMANCE MONITORING REPORT Page 1 of 6 OBJECTIVE Develop a Customer-Focused and Competitive System The following measures of productivity and service
GOVERNMENT PARTNERSHIP CELEBRATES LAUNCH OF ZÜM BUS RAPID TRANSIT SERVICE IN BRAMPTON
 No. H105/10 For release September 17, 2010 GOVERNMENT PARTNERSHIP CELEBRATES LAUNCH OF ZÜM BUS RAPID TRANSIT SERVICE IN BRAMPTON BRAMPTON, ONTARIO David Tilson, Member of Parliament for Dufferin-Caledon;
STAFF REPORT ACTION REQUIRED
 STAFF REPORT ACTION REQUIRED TTC Fare Policy Principles Date: September 28, 2015 To: From: TTC Board Chief Executive Officer Summary This report will take the form of a presentation recommending the high
CITY OF VAUGHAN EXTRACT FROM COUNCIL MEETING MINUTES OF JANUARY 25, 2011
 Item 1, Report No. 1, of the Priorities and Key Initiatives Committee, which was adopted without amendment by the Council of the City of Vaughan on January 25,. 1 RAPID TRANSIT UPDATE TORONTO-YORK SPADINA
STAFF REPORT ACTION REQUIRED
 nsert TTC logo here STAFF REPORT ACTION REQUIRED Presentation: Preliminary 2016 TTC Operating Budget: Fare Scenarios Date: September 15, 2015 To: From: TTC Budget Committee Chief Executive Officer Summary
COUNCIL AGENDA REPORT
 COUNCIL AGENDA REPORT Meeting Date: 6 June 2016 Subject: Boards Routed Through: 2017 Airdrie Transit s Community Services Advisory Board Date: 9 May 2016 Issue: Council is being asked to endorse the 2017
2 YORK REGION TRANSIT VEOLIA AGREEMENT AMENDMENT 91 CALDARI ROAD
 2 YORK REGION TRANSIT VEOLIA AGREEMENT AMENDMENT 91 CALDARI ROAD The Transit Committee recommends the following: 1. Receipt of the presentation by Rick Takagi, Manager, Operations, York Region Transit;
Att. A, AI 46, 11/9/17
 Total s San Diego Metropolitan Transit System POLICY 42 PERFORMANCE MONITORING REPORT Page 1 of 6 Date: 11/8/17 OBJECTIVE Develop a Customer-Focused and Competitive System The following measures of productivity
York Region Rapid Transit Corporation. City of Vaughan VMC Sub-Committee October 18, 2017
 York Region Rapid Transit Corporation City of Vaughan VMC Sub-Committee October 18, 2017 0 Agenda Construction update >> current projects in Vaughan > Bathurst & Centre > Highway 7 West > Highway 7 Vaughan
Fare Guide. YRT/Viva Pay app and PRESTO
 Fare Guide YRT/Viva Pay app and PRESTO How do I pay on YRT and Viva routes? For YRT routes, customers pay when they board the bus. Viva is our rapid transit service that operates on a pre-paid, proof-of-payment
Mobility Plus News DEAR MOBILITY PLUS CUSTOMER, FALL 2015
 FALL 2015 Mobility Plus News DEAR MOBILITY PLUS CUSTOMER, I have often heard the saying: Mother Nature has the best box of crayons, and that is so true of the autumn season in York Region. The season also
TRANSIT WINDSOR REPORT
 TRANSIT WINDSOR REPORT MISSION STATEMENT: PROVIDING SAFE, RELIABLE AND AFFORDABLE PUBLIC TRANSIT FOR THE COMMUNITY THROUGH CONTINUOUS IMPROVEMENT IN CUSTOMER CARE, ENVIRONMENTAL STEWARDSHIP AND EMPLOYEE
THE BIG MOVE. Transforming Transportation in the Greater Toronto & Hamilton Area (GTHA) W. Michael Fenn, CEO October 23, 2008
 W. Michael Fenn, CEO October 23, 2008") THE BIG MOVE Transforming Transportation in the Greater Toronto & Hamilton Area (GTHA) W. Michael Fenn, CEO October 23, 2008 Halton Real Estate Forum 1 Today 1. Case for Change 2. The Plan 3. Paying for
THE BIG MOVE Transforming Transportation in the Greater Toronto & Hamilton Area (GTHA) W. Michael Fenn, CEO October 23, 2008 Halton Real Estate Forum 1 Today 1. Case for Change 2. The Plan 3. Paying for
Cv-c; Re: Hotel Development Charges in York Region. March 24, 2016
 Regional Clerk's Office Corporate Services Department The Regional Municipality of York, 17250 Yonge Street, Newmarket, Ontario L3Y 6Z1 Tel: 1-877-464-9675 Fax: 905-895-3031 Internet: www.york.ca /C. Martin
TORONTO TRANSIT COMMISSION REPORT NO.
 Form Revised: February 2005 TORONTO TRANSIT COMMISSION REPORT NO. MEETING DATE: May 6, 2010 SUBJECT: LAKE SHORE BOULEVARD STREETCAR SERVICE ACTION ITEM RECOMMENDATION It is recommended that the Commission
1 SUBWAY EXTENSION TO VAUGHAN CORPORATE CENTRE - OPERATING AGREEMENT UPDATE
 1 Report No. 1 of the Chief Administrative Officer Regional Council Meeting of June 21, 2007 THE REGIONAL MUNICIPALITY OF YORK REPORT NO. 1 OF THE REGIONAL CHIEF ADMINISTRATIVE OFFICER For Consideration
9 VIVA DIRECT UNDERGROUND CONNECTION TO THE TORONTO-YORK SPADINA SUBWAY EXTENSION AT THE VAUGHAN METROPOLITAN CENTRE
 9 VIVA DIRECT UNDERGROUND CONNECTION TO THE TORONTO-YORK SPADINA SUBWAY EXTENSION AT THE VAUGHAN METROPOLITAN CENTRE The Finance and Administration Committee recommends the adoption of the recommendations
Chairman and Members of the Planning and Development Committee. Edward R. Sajecki, Commissioner of Planning and Building
 LA.09.TOR TORONTO DATE: TO: FROM: SUBJECT: Chairman and Members of the Planning and Development Committee Edward R. Sajecki, Commissioner of Planning and Building Proposed Rezoning and Master Plan Union
Ridership Growth Strategy (RGS) Status Update
 Status Update") For Information Ridership Growth Strategy (RGS) Status Update Date: July 10, 2018 To: TTC Board From: Deputy Chief Executive Officer Summary The TTC s Ridership Growth Strategy (RGS), with all its components,
For Information Ridership Growth Strategy (RGS) Status Update Date: July 10, 2018 To: TTC Board From: Deputy Chief Executive Officer Summary The TTC s Ridership Growth Strategy (RGS), with all its components,
We re listening: service changes to help get you where you re going
 February 2013 MyTransit We re listening: service changes to help get you where you re going More than 40 YRT / Viva service changes will take effect Sunday, February 24. Schedule and frequency adjustments
Interim Growth Management Policies City of Brampton Council
 Interim Growth Management Policies City of Brampton Council October 24, 2007 Agenda City of Brampton 2006 Official Plan Brampton s Growth Management Initiatives Provincial Growth Plan Brampton s Growth
KING STREET TRANSIT PILOT
 KING STREET TRANSIT PILOT Update toronto.ca/kingstreetpilot #kingstreetpilot HIGHLIGHTS TRANSIT RIDERSHIP TRANSIT CAPACITY To respond to this growth in ridership, the TTC has increased the capacity of
Transit Performance Report FY (JUNE 30, 2007)
") Transit Performance Report FY 2006-2007 (JUNE 30, 2007) J ANUARY 2008 TRANSIT PERFORMANCE REPORT FY 2006 2007 (JUNE 30, 2007) Transit Performance Report I SSUED: JANUARY 2008 The Transit Performance Report
Transit Performance Report FY 2006-2007 (JUNE 30, 2007) J ANUARY 2008 TRANSIT PERFORMANCE REPORT FY 2006 2007 (JUNE 30, 2007) Transit Performance Report I SSUED: JANUARY 2008 The Transit Performance Report
Chapter 3. Burke & Company
 Chapter 3 Burke & Company 3. WRTA RIDERSHIP AND RIDERSHIP TRENDS 3.1 Service Overview The Worcester Regional Transit Authority (WRTA) provides transit service to over half a million people. The service
YORK UNIVERSITY BUSWAY SERVICE CHANGES
 Form Revised: February 2005 TORONTO TRANSIT COMMISSION REPORT NO. MEETING DATE: April 27, 2009 SUBJECT: YORK UNIVERSITY BUSWAY SERVICE CHANGES ACTION ITEM RECOMMENDATIONS It is recommended that the Commission:
TORONTO TRANSIT COMMISSION REPORT NO.
 Revised: March/13 TORONTO TRANSIT COMMISSION REPORT NO. MEETING DATE: March 26, 2014 SUBJECT: KENNEDY INTERCHANGE STATION: METROLINX EGLINTON CROSSTOWN LIGHT RAIL TRANSIT PROJECT - PRELIMINARY CONCEPT
MEETING DATE: February 17, 2010 SUBJECT: ACTION ITEM TORONTO TRANSIT COMMISSION REPORT NO. ACCESSIBLE TRANSIT SERVICES PLAN: 2009 STATUS REPORT
 TORONTO TRANSIT COMMISSION REPORT NO. MEETING DATE: February 17, 2010 SUBJECT: ACCESSIBLE TRANSIT SERVICES PLAN: 2009 STATUS REPORT ACTION ITEM RECOMMENDATION It is recommended that the Commission forward
Board of Directors Information Summary
 Regional Public Transportation Authority 302 N. First Avenue, Suite 700, Phoenix, Arizona 85003 602-262-7433, Fax 602-495-0411 Board of Directors Information Summary Agenda Item #6 Date July 11, 2008 Subject
2018 OPERATING BUDGET BRIEFING NOTE Toronto Transit Commission: Options to Address Bus Overcrowding, Bus Availability & Garage Storage Capacity
 BN# 39 Jan 12 Richard Leary Acting CEO Toronto Transit Commission Toronto Transit Commission 1900 Yonge Street, Toronto, Ontario, M4S1Z2 Tel: (416) 393-3890 Fax: (416) 488-6198 Richard.Leary@ttc.ca www.ttc.ca
DESIGN-BUILD OPPORTUNITY
 DESIGN-BUILD OPPORTUNITY BUILDING FOR YOUR FUTURE Metro East Business Park is 64 acres Situated minutes from Highway Metro East Business Park is First Gulf is a market leader with of employment land conveniently
APPENDIX 2 TORONTO TRANSIT COMMISSION SERVICE STANDARDS AND DECISION RULES FOR PLANNING TRANSIT SERVICE
 APPENDIX 2 TORONTO TRANSIT COMMISSION SERVICE STANDARDS AND DECISION RULES FOR PLANNING TRANSIT SERVICE Contents 1 Introduction... 1 2 Network Design Standards... 2 2.1 Transit Service Classifications...
CURRENT SHORT-RANGE TRANSIT PLANNING PRACTICE. 1. SRTP -- Definition & Introduction 2. Measures and Standards
 CURRENT SHORT-RANGE TRANSIT PLANNING PRACTICE Outline 1. SRTP -- Definition & Introduction 2. Measures and Standards 3. Current Practice in SRTP & Critique 1 Public Transport Planning A. Long Range (>
TORONTO TRANSIT COMMISSION REPORT NO.
 Form Revised: February 2005 TORONTO TRANSIT COMMISSION REPORT NO. MEETING DATE: March 1, 2011 SUBJECT: PROCUREMENT AUTHORIZATION AMENDMENT CONTRACT AMENDMENT NO. 8 ACTION ITEM RECOMMENDATION It is recommended
York Region Rapid Transit Corporation Board of Directors. Mary-Frances Turner, President
 Meeting of the Board of Directors On June 9, 2011 To: From: Subject: Ref: York Region Rapid Transit Corporation Board of Directors Mary-Frances Turner, President Spadina Subway Project Update YORK-#3369547
Transit in Toronto. Chair Adam Giambrone Sunday, October
 Chair Adam Giambrone Sunday, October 19 2008 1 TTC is a City of Toronto Commission Transit in Toronto 2 2 Serving Toronto since 1921 Transit in Toronto 3 3 Canada s largest transit agency Annual customer-trips,
2017/2018 Q3 Performance Measures Report. Revised March 22, 2018 Average Daily Boardings Comparison Chart, Page 11 Q3 Boardings figures revised
 2017/2018 Q3 Performance Measures Report Revised March 22, 2018 Average Daily Boardings Comparison Chart, Page 11 Q3 Boardings figures revised Contents Ridership & Revenue... 1 Historical Revenue & Ridership...
TRANSPORTATION SERVICE Actual
 PERFORMANCE REPORT-THIRD QUARTER VISION TO DELIVER REGIONAL MULTI-MODAL TRANSPORTATION SERVICES AND INFRASTRUCTURE IMPROVEMENTS THAT SIGNIFICANTLY AND CONTINUALLY INCREASE TRANSIT MARKET SHARE. MISSION
MONTHLY REPORT SEPTEMBER 2017
 MONTHLY REPORT 2017 SUN SHUTTLE RIDERSHIP ROUTE PASSENGERS: CURRENT YEAR PRIOR YEAR AMOUNT PERCENTAGE BUDGET AMOUNT PERCENTAGE TOTAL PASSENGERS 17,250 20,318 (3,068) -15.1% 18,231 (981) -5.4% CALENDAR
SAMTRANS TITLE VI STANDARDS AND POLICIES
 SAMTRANS TITLE VI STANDARDS AND POLICIES Adopted March 13, 2013 Federal Title VI requirements of the Civil Rights Act of 1964 were recently updated by the Federal Transit Administration (FTA) and now require
TORONTO TRANSIT COMMISSION REPORT NO.
 Form Revised: February 2005 TORONTO TRANSIT COMMISSION REPORT NO. MEETING DATE: March 30, 2012 SUBJECT: TTC SERVICE TO GEORGE BROWN COLLEGE WATERFRONT CAMPUS ACTION ITEM: RECOMMENDATIONS It is recommended
METROPOLITAN EVANSVILLE TRANSIT SYSTEM Part I: Comprehensive Operations Analysis Overview July 9 th, 2015 Public Information Meeting
 METROPOLITAN EVANSVILLE TRANSIT SYSTEM Part I: Comprehensive Operations Analysis Overview July 9 th, 2015 Public Information Meeting AGENDA 5:30 5:40 Open House 5:40 6:30 Presentation Comprehensive Operations
ridesharing and taxi modernization: an achievable balance
 ridesharing and taxi modernization: an achievable balance First published February 2016, revised July 2018 Ridesharing regulations and taxi modernization involve complex issues around safety, equity, and
Metrics Sales Average Price Total Total
 Market Watch August 2018 Economic Indicators i Real GDP Growth Q2 2018 2.9% For All TREB Member Inquiries: (416) 443-8152 For All Media/Public Inquiries: GTA REALTORS Release August Stats TORONTO, ONTARIO,
Sales & Average Price By Major Home Type. Metrics Sales Average Price Total Total
 Market Watch January 2016 Economic Indicators i Real GDP Growth Q3 2015 2.3% Toronto Employment Growth ii December 2015 4.5% Toronto Unemployment Rate December 2015 -- 7.0% Strong Start to 2016 For All
AGENDA GUEMES ISLAND FERRY OPERATIONS PUBLIC FORUM
 AGENDA GUEMES ISLAND FERRY OPERATIONS PUBLIC FORUM Wednesday, August 17, 211 6: p.m. Guemes Island Community Hall ~ 7549 Guemes Island Road Thank you for attending the second Annual Public Forum in 211.
The RGS Work Plan 2018 provides a detailed annual work schedule for the actions within each initiative.
 Report for Action Ridership Growth Strategy 2018-2022 Date: January 25, 2018 To: TTC Board From: Chief Executive Officer Summary The TTC s Ridership Growth Strategy (RGS), with all its components, is an
Capacity Improvements on Bus and Subway Services
 For Action Capacity Improvements on Bus and Subway Services Date: May 8, 2018 To: TTC Board From: Chief Customer Officer Summary On February 12, 2018 Mayor Tory and TTC Chair Colle announced a Ten-Point
2017/ Q1 Performance Measures Report
 2017/2018 - Q1 Performance Measures Report Contents Ridership & Revenue... 1 Historical Revenue & Ridership... 1 Revenue Actual vs. Planned... 3 Mean Distance Between Failures... 5 Maintenance Cost Quarter
NTARIO S INFR STRUCTURE
 INVESTING IN NTARIO S INFR STRUCTURE MOVING ONTARIO FORWARD Infr structure solutions. Made in ntario. Ontario s new 10-year economic plan includes over $130 billion in infrastructure investments to create
New System. New Routes. New Way. May 20, 2014
 Route Optimization I N I T I A T I V E New System. New Routes. New Way. May 20, 2014 1 Welcome Blueprint for Transportation Excellence (BTE) 20 year strategic plan Blueprint 2020 JTA s five-year plan for
ARLINGTON COUNTY, VIRGINIA. County Board Agenda Item Meeting of February 22, 2014
 ARLINGTON COUNTY, VIRGINIA County Board Agenda Item Meeting of February 22, 2014 DATE: January 23, 2014 SUBJECT: Request to authorize advertisement of a public hearing to consider an ordinance amending
FY Transit Needs Assessment. Ventura County Transportation Commission
 FY 18-19 Transit Needs Assessment Ventura County Transportation Commission Contents List of Figures and Appendices.. 2 Appendices... 1 Chapter 1: Introduction What is the Ventura County Transportation
Sales & Average Price By Major Home Type. Metrics Sales Average Price Total Total
 Market Watch February 2016 Economic Indicators i Real GDP Growth Q4 2015 0.8% Toronto Employment Growth ii January 2016 Month Mortgage Rates February 2016 2016 1 Year -- 3 Year -- 5 Year -- 4.8% Toronto
Sales & Average Price By Major Home Type November 2015 Metrics Sales Average Price Total Total
 Market Watch November 2015 Economic Indicators i Real GDP Growth Q3 2015 2.3% Toronto Employment Growth ii October 2015 Month Mortgage Rates November 2015 1 Year 3 Year 5 Year -- -- 4.5% Toronto Unemployment
RACINE COUNTY PUBLIC TRANSIT PLAN:
 RACINE COUNTY PUBLIC TRANSIT PLAN: 2013-2017 Recommended Transit Service Improvement Plan NEWSLETTER 3 SEPTEMBER 2013 This newsletter describes the final recommended public transit plan for the City of
Sales & Average Price By Major Home Type 1,7 July 2012 Average Price Total Total
 July 2012 Economic Indicators Real GDP Growth i Q1 2012 t 1.9% Toronto Employment Growth ii June 2012 t 0.2% Toronto Unemployment Rate June 2012 q 8.6% Inflation (Yr./Yr. CPI Growth) ii June 2012 t 1.5%
TORONTO TRANSIT COMMISSION REPORT NO.
 Revised: March/13 TORONTO TRANSIT COMMISSION REPORT NO. MEETING DATE: November 18, 2013 SUBJECT: YONGE-EGLINTON AND EGLINTON WEST INTERCHANGE STATIONS METROLINX EGLINTON CROSSTOWN LIGHT RAIL TRANSIT PROJECT
SAMTRANS SERVICE PLAN
 Agenda Overview Part I: Key Findings Market Assessment Service Evaluation Part II: Service Development Framework Metrics Criteria Part III: Next Steps SAMTRANS SERVICE PLAN Preliminary Analysis and Criteria
October REGIONAL ROUTE PERFORMANCE ANALYSIS
 October 2018 2017 REGIONAL ROUTE PERFORMANCE ANALYSIS The Council s mission is to foster efficient and economic growth for a prosperous metropolitan region Metropolitan Council Members Alene Tchourumoff
Memorandum. DATE: May 9, Board of Directors. Jim Derwinski, CEO/Executive Director. Fare Structure Study Fare Pilot Program
 Memorandum DATE: May 9, 2018 TO: FROM: SUBJECT: Board of Directors Jim Derwinski, CEO/Executive Director Fare Structure Study Fare Pilot Program RECOMMENDATION Board action is requested to approve an ordinance
Base Adult Single Fares Current Fare Increase $ $5.69 $0.00 $ $6.50 $0.40 $ $8.25 $0.50 > $8.25 $0.60
 Memorandum To: From: Metrolinx Board of Directors Greg Percy President, GO Transit Date: December 3, 2015 Re: Proposed GO Transit Fare Increase Executive Summary As part of the annual business plan process,
February Price Growth Continues in February. Economic Indicators. TorontoMLS Sales Activity 1,7. TorontoMLS Average Price 1,7 $510,580 $500,249
 February 2013 Economic Indicators Real GDP Growth i Q4 2012 t 0.6% Toronto Employment Growth ii January 2013 t 4.6% Toronto Unemployment Rate January 2013 u 8.2% Inflation (Yr./Yr. CPI Growth) ii January
Central Oregon Intergovernmental Council
 Central Oregon Intergovernmental Council Regional Transit Master Plan (RTMP) Technical Advisory Committee March 8, 2013 Agenda Introductions (5 min) Project Update (5 min) Updated Demand Estimates (5 min)
WESTERN EL DORADO COUNTY SHORT AND LONG-RANGE TRANSIT PLAN Executive Summary
 WESTERN EL DORADO COUNTY SHORT AND LONG-RANGE TRANSIT PLAN Executive Summary Prepared for the El Dorado County Transportation Commission Prepared by The El Dorado County Transportation Commission (EDCTC)
INFORMATION ONLY. Subject: Metrolinx Presentation Date: June 22, 2015
 INFORMATION ONLY Subject: Metrolinx Presentation Date: June 22, 2015 At its meeting on June 22, 2015, the TTC Board will receive a presentation on Metrolinx from Robert Prichard, Metrolinx Board Chair
TENANT BROCHURE CORE CONSULTANTS REALTY. TORONTO OFFICE 555 Richmond St. West Suite #1111 Toronto, ON M5V 3B1
 CORE CONSULTANTS REALTY TENANT BROCHURE TORONTO OFFICE Toll Free. 800-908-6718 Fax. 416-900-0944 info-on@coreconsultantsrealty.com Toll Free. 866-406-CORE (2673) Fax. 514-819-8841 info-qc@coreconsultantsrealty.com
COMMITTEE OF THE WHOLE (WORKING SESSION) APRIL 19, 2011 YORK REGION RAPID TRANSIT HIGHWAY 7 BUS RAPID TRANSIT- VMC STATION WARD 4.
 APRIL 19, 2011 YORK REGION RAPID TRANSIT HIGHWAY 7 BUS RAPID TRANSIT- VMC STATION WARD 4.") COMMITTEE OF THE WHOLE (WORKING SESSION) APRIL 19, 2011 YORK REGION RAPID TRANSIT HIGHWAY 7 BUS RAPID TRANSIT- VMC STATION WARD 4 Recommendation The Commissioner of Engineering and Public Works and the
COMMITTEE OF THE WHOLE (WORKING SESSION) APRIL 19, 2011 YORK REGION RAPID TRANSIT HIGHWAY 7 BUS RAPID TRANSIT- VMC STATION WARD 4 Recommendation The Commissioner of Engineering and Public Works and the
METROBUS SERVICE GUIDELINES
 METROBUS SERVICE GUIDELINES In the late 1990's when stabilization of bus service was accomplished between WMATA and the local jurisdictional bus systems, the need for service planning processes and procedures
Sales & Average Price By Major Home Type December 2015 Metrics Sales Average Price Total Total
 Market Watch December 2015 Economic Indicators i Real GDP Growth Q3 2015 2.3% Toronto Employment Growth ii November 2015 Month Mortgage Rates December 2015 1 Year -- 3 Year -- 5 Year -- 4.1% Toronto Unemployment
TORONTO TRANSIT COMMISSION REPORT NO.
 Form Revised: February 2005 TORONTO TRANSIT COMMISSION REPORT NO. MEETING DATE: October 29, 2009 SUBJECT: TORONTO-YORK SPADINA SUBWAY EXTENSION PROJECT STEELES WEST STATION APPROVAL OF CONCEPTUAL DESIGN
Why we re here: For educational purposes only
 Transportation 2050 Why we re here: For educational purposes only Transportation 2050 Bus Elements PUBLIC TRANSIT DEPARTMENT City of Phoenix Citizens Committee on the Future of Phoenix Transportation (CCFPT)
Average Price up in March and First Quarter
 March 2013 Economic Indicators Real GDP Growth i Q4 2012 t 0.6% Toronto Employment Growth ii February 2013 t 4.6% Toronto Unemployment Rate February 2013 t 8.4% Inflation (Yr./Yr. CPI Growth) ii February
Public Meeting. December 19 th, 2018
 Public Meeting December 19 th, 2018 AGENDA Welcome Market Analysis Existing Services Peer Evaluation Outreach Summary Recommendations Discussion Next Steps MARKET ANALYSIS 3 Demographics 50% of population
INTERACTIVE COMMUTE MAP CLICK ON YOUR CITY OF RESIDENCE ON THE MAP BELOW TO EXPLORE YOUR COMMUTE OPTIONS
 INTERACTIVE COMMUTE MAP CLICK ON YOUR CITY OF RESIDENCE ON THE MAP BELOW TO EXPLORE YOUR COMMUTE OPTIONS Amaranth East Garafraxa Mono Orangeville Adjala- Tosorontio Caledon New Tecumseth King Vaughan Newmarket
4 VIVA PHASE 2 YONGE STREET - Y2, AND HIGHWAY 7 - H3 CORRIDORS PRELIMINARY ENGINEERING UPDATE
 4 VIVA PHASE 2 YONGE STREET - Y2, AND HIGHWAY 7 - H3 CORRIDORS PRELIMINARY ENGINEERING UPDATE The Rapid Transit Public/Private Partnership Steering Committee recommends the following: 1. The presentation
Low-Rise Home Types Drive June Price Growth
 June 2012 Economic Indicators Real GDP Growth i Q1 2012 t 1.9% Toronto Employment Growth ii May 2012 t 1.6% Toronto Unemployment Rate May 2012 t 8.6% Inflation (Yr./Yr. CPI Growth) ii May 2012 u 1.2% Bank
SRTA Year End Fixed Route Ridership Analysis: FY 2018
 SRTA Year End Fixed Route Ridership Analysis: FY 2018 2018 Contents Introduction... 1 A. Key Terms Used in this Report... 1 Key Findings... 2 A. Ridership... 2 B. Fare Payment... 4 Performance Analysis
Attachment C: 2017/2018 Halifax Transit Year End Performance Report. 2017/2018 Year End Performance Measures Report
 Attachment C: 2017/2018 Halifax Transit Year End Performance Report 2017/2018 Year End Performance Measures Report Contents Annual Key Performance Indicators (KPIs)... 1 Weekday Cost per Passenger... 1
York Region Rapid Transit Corporation Board of Directors
 Meeting of the Board of Directors on March 12, 2015 To: From: York Region Rapid Transit Corporation Board of Directors Mary-Frances Turner, President Subject: Project Status Quarterly Q3 and Q4 2014 Ref:
Sales & Average Price By Major Home Type 1,7 April 2013 Average Price Total Total
 Market Watch April 2013 Economic Indicators Real GDP Growth i Q4 2012 t 0.6% Toronto Employment Growth ii March 2013 t 4.1% Toronto Unemployment Rate March 2013 q 8.4% Inflation (Yr./Yr. CPI Growth) ii
Detached 1,050 3,421 4,471 $1,042,405 $709,116 $787,388 Yr./Yr. % Change 4.3% 17.3% 14.0% 15.9% 10.0% 10.9%
 March 2015 Economic Indicators Real GDP Growth i Q4 2014 t 2.4% Toronto Employment Growth ii February 2015 u 1.0% Toronto Unemployment Rate February 2015 u 7.6% Inflation (Yr./Yr. CPI Growth) ii February
TORONTO TRANSIT COMMISSION REPORT NO.
 Revised: March/13 TORONTO TRANSIT COMMISSION REPORT NO. MEETING DATE: SUBJECT: Resubmitted: November 18, 2013 October 23, 2013 TTC Fare Policy - Requests for Fare Discounts ACTION ITEM RECOMMENDATION It
PUBLIC TRANSIT IN KENOSHA, RACINE, AND MILWAUKEE COUNTIES
 PUBLIC TRANSIT IN KENOSHA, RACINE, AND MILWAUKEE COUNTIES #118404v1 Regional Transit Authority June 19, 2006 1 Presentation Overview Existing Public Transit Transit System Peer Comparison Recent Transit