The Sydney CBD is in the midst of a supply drought
|
|
|
- Benedict Whitehead
- 6 years ago
- Views:
Transcription


1 RESEARCH


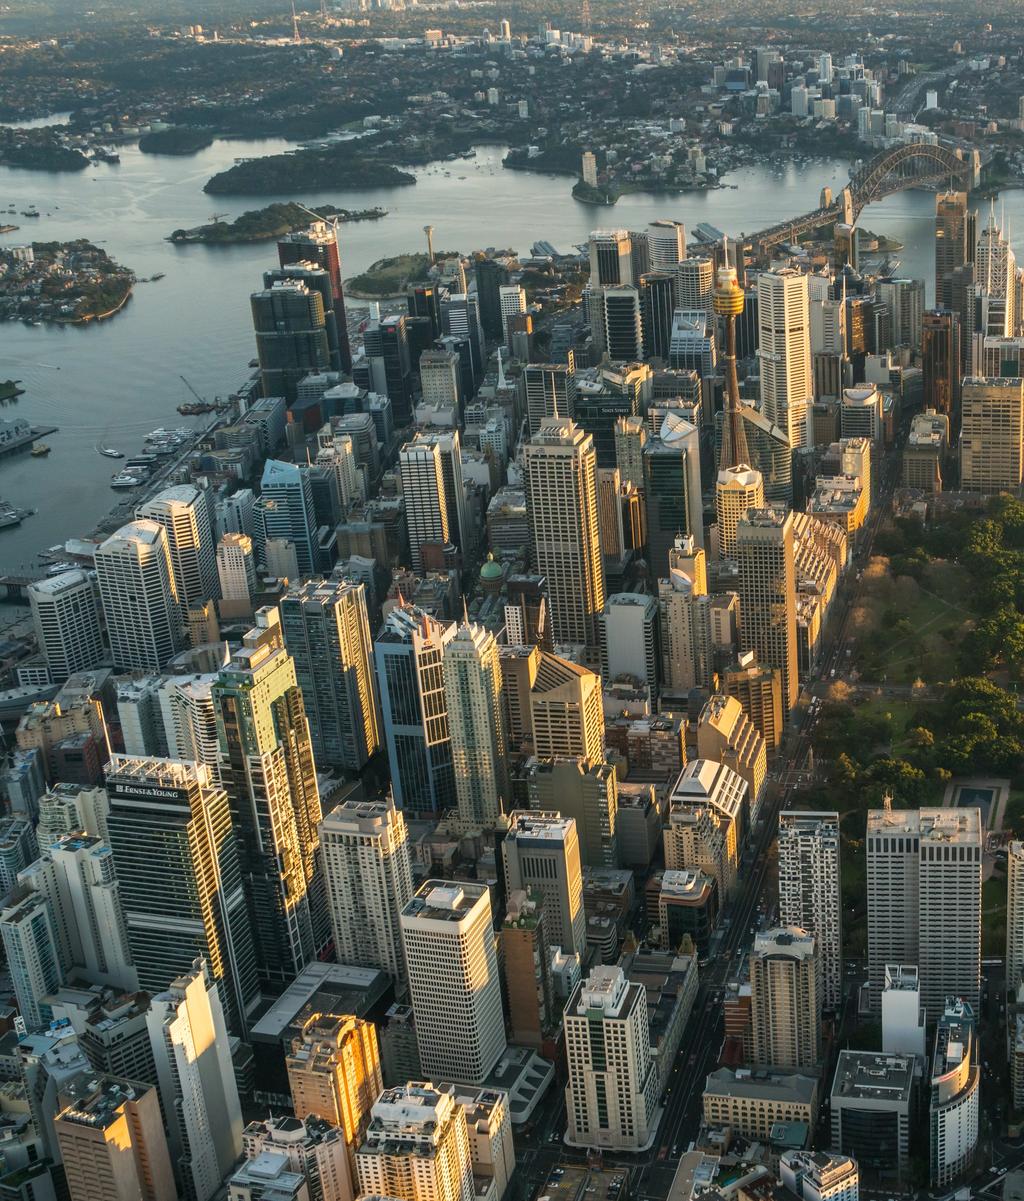
2 Stock withdrawals continue to have a bearing on the Sydney CBD office market with a total of 99,695 sq m (2.% of stock) withdrawn from the market during H Sydney CBD s white-collar employment has grown by 5,682 over the past year, representing an annual growth rate of 1.9%, 68bps above the 1 year average. Sustained strong demand amid tight supply has resulted in further contraction of vacancy, which declined from 5.8% in July 217 to 4.6% in January 218, the lowest level since July 28. Robust effective rental growth rates of 8.52% and 11.36% have been recorded for prime and secondary stock respectively over the past 12 months. Foreign investors and unlisted funds have underpinned strong investor demand in the CBD, which saw volumes up by 28% YoY to reach $4.98 billion in 217. Prime and secondary yields experienced further tightening of 2-4bps over the year to range between 4.5%-5.25% and 5.5% -6.% as at January 218. Associate Director, Research The Sydney CBD is in the midst of a supply drought Stock withdrawals have remained a key feature of the Sydney CBD office market over the past six months, highlighted by a total of 99,695 sq m (2.% of stock) withdrawn from the market. Of this amount, 22,483 sq m was permanently withdrawn for conversion to alternative uses. Prominent office buildings taken off -line over the past six months include 39 Martin Place (16,746 sq m), taken down for the construction of the Martin Place Metro Station, and 5 Bridge Street (54,98 sq m), to be demolished for the Quay Quarter Tower development. Additionally, four buildings along 9-13 Young Street, 2-1 Loftus Street, 2 Loftus Street and Young Street (totalling 19,594 sq m) have been withdrawn for conversion to super-prime residential developments as part of Quay Quarter Sydney precinct. Over the past two years, a total of 411,96 sq m of existing office space has been taken offline, equivalent to 8.1% of the total stock at the beginning of 216. Of this amount, 175,516 sq m has occurred over the past 12 months. While withdrawals were significant, new supply has been limited over the past six months with only 37,376 sq m added to the market, resulting in a negative net supply figure of 62,319 sq m (Figure 1). The supply shortage was further exacerbated by the fact that the majority of new additions had been precommitted prior to completion. New supply over the past six months has derived primarily from refurbished spaces stemming from 1 Shelley Street (27,718 sq m), which was fully committed by Suncorp, and Darling Park Tower 2 at 21 Sussex Street (2,773 sq m), primarily leased to IAG. The only new building completed during this period was the International House Sydney building at Barangaroo (6,885 sq m), fully occupied by Accenture relocating from Pyrmont. Limited speculative completions on the horizon Looking forward, new office supply in the Sydney CBD will be significantly constrained in the next two years, while stock withdrawals will continue to have a major effect on the market. The only new addition over the next 12 months is 151 Clarence Street (22, sq m), which is almost fully pre-leased by ARUP and Pfizer. The supply shortage is expected to stay in place at least until late 219/early 22 when 6 Martin Place (38,6 sq m reportedly pre-committed by Henry Davis York/Norton Rose Fulbright and Banco Chambers), and 275 George Street (6,363 sq m) are expected to come online. Beyond 22, the supply pipeline is projected to gradually improve although speculative supply is not expected to be significant. Future completions from 22 will include; Lendlease s second timber building (C1 Site) at the Barangaroo precinct (circa 11,25 sq m being considered by a co-working operator H1 22), Brookfield and AMP Capital s Wynyard Place project (68,2 sq m 53% pre-committed by NAB & Allianz H2 22), AMP Capital s Quay Quarter Tower (QQT) (88,274 sq m 4% precommitted by AMP Capital H2 22), Lendlease s Circular Quay Tower (CQT) (circa 55, sq m potentially end of 22 or early 221) and George Street (17, sq m potentially being pre-leased to a foreign co-working operator H2 221). Sydney CBD Office Market Indicators as at January 218 Grade Total Stock (sq m) Vacancy Rate (%) Annual Net Absorption (sq m) Annual Net Additions (sq m) Average Gross Face Rent* ($/sq m) Average Incentive* (%) Average Core Market Yield (%) Prime 2,97, ,435 42,936 1,1 1, Secondary 2,53, ,68-97, , Total 5,23, ,827-54,66 8-1, * 2
![SYDNEY CBD OFFICE MARCH 218 RESEARCH 1 477 Pitt St# - 18, sq m (ex Rail Corp) ISPT - H1 218 2 151 Clarence St - 22, sq m [ARUP, Pfizer] Investa - Q3 218-84% committed 3 21 & 27 Kent St# - 5,536 sq m](/docs-images/79/79458663/images/3-1.jpg "(ex ARUP) Cromwell / Investa- Q3 218 4 1 Broadway - 5,447 sq m Frasers/Seksui - H2 218 5 1 Oxford St# (ex Dept of Education) - 13,943 sq m Memocorp - H1 219 6 185 Clarence St - 9,5 sq m Built - H1 22")
3 SYDNEY CBD OFFICE MARCH 218 RESEARCH Pitt St# - 18, sq m (ex Rail Corp) ISPT - H Clarence St - 22, sq m [ARUP, Pfizer] Investa - Q % committed 3 21 & 27 Kent St# - 5,536 sq m (ex ARUP) Cromwell / Investa- Q Broadway - 5,447 sq m Frasers/Seksui - H Oxford St# (ex Dept of Education) - 13,943 sq m Memocorp - H Clarence St - 9,5 sq m Built - H George St# - 36,151 sq m (ex IAG) Investa/Brookfield - H Martin Place - 38,6 sq m [Banco Chambers] Investa/Gwynvill Group - H1 22-7% committed 9 44 Martin Pl# - 9,5 sq m (ex Henry Davis York) Gwynvill Group - H Wynyard Pl - 58,974 sq m [NAB, Allianz] Brookfield - H % committed George St - 6,363 sq m John Holland - H Market St# - 22,3 sq m (ex Westpac) Mirvac - H Barangaroo C1 - c. 11, sq m LLOneITST - H Elizabeth St# - 22,964 sq m (ex Telstra) Charter Hall - H Pitt St# - 29,159 sq m (ex Telstra) ARA - H Market# - 18,99 sq m (ex Allianz) Allianz/Charter Hall - H George St# - 22,5 sq m (ex NAB) AMP - H Quay Quarter Tower (QQT) - 88,274 sq m AMP - H % committed 19 Circular Quay Tower (CQT), 182 George St - 55, sq m Lendlease - H George St - 17, sq m Poly Real Estate - H Bligh St - 26, sq m Energy Australia/Investa - Mooted Pitt St - 3, sq m+ Mirvac Darling Park Tower 4-7, sq m GPT/Brookfield/AMP Harrington St# - 6,37 sq m (ex Dimension Data) Harrington St Investments - H Alfred St# - 32,353 sq m (ex AMP Capital) AMP Capital - H Market St - c.12, sq m CBUS/Scentre - H Central Barangaroo - 45, sq m Grocon/Aqualand/Scentre Martin Place Metro Station North Tower (ex-55 Hunter St) TBC± Source of map: Knight Frank 29 Martin Place Metro Station South Tower (ex-39 Martin Pl) TBC± Refurbished Supply New Addition (Under Construction/Pre-committed) York St - 6, sq m NIG Investment - Mooted 4-6 Bligh St - 6,137 sq m SC Capital Partners - Early Feasibilty New Addition (Planned/Mooted/Early Feasibility) NB. Dates are Knight Frank Research estimates. Includes select CBD major office supply (NLA quoted) Major tenant precommitment in [brackets] next to NLA # Major refurbishment/backfill ± Macquarie Group has submitted an unsolicited proposal for the sites, which is being considered by the State Government. 3
4 Jan-8 Jan-9 Jan-1 Dec-7 Dec-8 Dec-9 Dec-1 Dec-11 Dec-12 Dec-13 Dec-14 Dec-15 Dec-16 Dec-17 Dec-18 Dec-19 Jan-8 Jan-9 Jan-1 Tenant demand is driven by strong white-collar employment growth Tenant demand in the Sydney CBD continues to gain traction on the back of solid employment growth. Over the 12 months to December 217, a total of 5,682 new office jobs have been created in the Sydney CBD, representing an annual growth rate of 1.9%. This is 68 basis points above the 1 year average growth rate of 1.23% per annum. Looking ahead, employment growth is forecast to accelerate over the next 24 months (Figure 2) indicating a positive outlook for strong demand. Propelling the solid job growth in the CBD last year was the Information Media and Telecommunications sector, which experienced above-average growth of 2.6% over the 217 calendar year. These trends are clearly reflected in the active engagement by co-working tenants in the Sydney CBD over the past 12 months. Recent examples include the inauguration of the Sydney Startup Hub across 17, sq m at York Street in February 218 and Hub Australia s newest location across 4,3 sq m at 223 Liverpool Street. Additionally, WeWork continues its aggressive expansion plan in the Sydney CBD across numerous locations, which are yet to be publicly disclosed. They currently occupy 15,26 sq m across three locations in the CBD and Pyrmont and are set to more than double in size over the next 24 months, according to Knight Frank Research s estimates. The exponential growth of co-working space in the Sydney CBD is showing no signs of slowing with a number of sizable enquires by co-working operators, both local and offshore, yet to be satisfied. Those include Chinese co-working operator Naked Hub, in negotiation for a 1, sq m lease in the CBD, Singapore-based The Great Room seeking up to 4, sq m, Work Inc looking for between 1, and 2,5 sq m and CreativeCubes.Co requiring 1,5 2,3 sq m. The strong leasing activity by co-working operators further reinforces the strength of the TAMI sector (Technology, Advertising, Media & Information). According to Access Economics forecasts, employment in the TAMI sector is projected to grow by 1,98 jobs over the next 12 months. This will see TAMI occupiers overtaking the traditional FIRE sector (Finance, Insurance & Real Estate) as the largest occupiers of space in the Sydney CBD. Lack of available space is a constraint on demand While pent-up demand continued to accumulate, the overall net absorption in the CBD has been constrained by the lack of available stock due to space withdrawals and limited new supply. The net absorption over the twelve months to January was a mere 345 sq m, while the total for the year was 24,827 sq m. The market continues to see the polarisation of demand with the premium segment of the market experiencing the strongest level of take-up with 29,849 sq m of space absorbed over the past six months, as available stock was more adequate. Over the year to January 218, premium net absorption measured 68,45 sq m, more than double the 1 year average of circa 33, sq m per year. On the other hand, the secondary market recorded negative absorption of 7,581 sq m over the past six months. Amidst the rapid depletion of stock and falling vacancy, many B-Grade tenants have become more space efficient or upgraded to the prime market. Vacancy has declined across the board On the back of positive tenant demand amid negative net supply, the overall vacancy rate in the Sydney CBD has declined from 5.8% in July 217 to 4.6% in January 218. This is the lowest level of vacancy since July 28 and 27bps below the 1 year average of 7.3%. Furthermore, the current vacancy in the market is not evenly distributed, but heavily concentrated at the Barangaroo precinct. Exclusive of the Barangaroo towers, the overall vacancy rate in the Sydney CBD is extremely tight at 3.7% as at January 218 based on our calculations. The only time that the market registered a lower vacancy rate (3.6%) was back in January 199, when the PCA began tracking the market. Both prime and secondary markets experienced similar levels of decline in Sydney CBD Office Supply Per six month period (sq m) Source of Employment Growth Annual Change in White-Collar Employment Sydney CBD Vacancy Rate Prime vs secondary (%) - Past decade 2, 2, Projection 12% 15, 15, 1% 1, 1, 8% 5, 5, 6% -5, 4% -1, -5, 2% -15, -1, % GROSS SUPPLY WITHDRAWALS NET SUPPLY TAMI FIRE OTHER TOTAL PRIME SECONDARY OVERALL 4
5 Jan-8 Jan-9 Jan-1 Jan-19 Jan-2 Jan-8 Jan-9 Jan-1 Jan-19 Jan-2 SYDNEY CBD OFFICE MARCH 218 RESEARCH vacancy rates. While the prime vacancy rate has declined from 5.8% to 4.9%, the secondary vacancy rate has fallen from 5.6% to 4.2% over the past six months. Within the prime segment, the A-Grade market registered a tighter vacancy rate at 3.7% compared to the Premium-Grade market at 6.9%, albeit this level has almost halved from the peak of 12.5% twelve months ago when the Barangaroo towers were completed. The latest tenant to call Barangaroo home is Cathay Pacific signing up circa 65 sq m at Tower 1, while Facebook is reportedly close to finalising a deal for around 5, sq m in Tower 2. Additionally, the second Barangaroo timber building (C1 site) is reportedly being contemplated by an international co- working operator. Face and effective rents continue to rise The declining vacancy rates have supported further rental growth in the CBD over the past 12 months across all grades, but more so in the secondary market where the space shortage is more severe. The average prime gross face rent has increased by 5.6% over the 217 calendar year to $1,166/sq m ($992/sq m net face). Additionally, prime incentives have declined to between 2-24% on average as at January 218 from above 25% a year ago. As a result, the effective face rental growth was boosted to 8.5% YoY. In the secondary market, the average secondary gross face rent increased by 11.2% YoY to $885/sq m ($749/sq m net). Secondary incentives for full-floor, midrise levels varied between 17% and 2% as at January 218, although incentives for smaller suites are well below 17%. Consequently, the average secondary effective gross face rent has increased by 11.4% to $77/sq m over the past year. Looking forward, Knight Frank anticipates prime and secondary gross face rents to grow by 5.-6.% and 4.-5.% respectively while vacancy is projected to fall below 4.% over the next two years. Sydney CBD Vacancy Rate By Precinct (%) - July Net Absorption & Vacancy Sydney CBD, per six month period ( s sq m, %) Projection 12% 8% 4% % -4% -8% Average Gross Effective Rents Sydney CBD ($/sq m) 1,1 1, Projection % 1. NET ABSORPTION 6 MTHS TO...(m²)-LHS TOTAL VACANCY (%)-RHS PRIME SECONDARY Recent Leasing Activity Sydney CBD Address Precinct NLA (sq m) Term (yrs) Lease Type Tenant Sector Start Date 6 Martin Pl Core 7,2 12 New HDY & NRF Legal Jan George St Core 1,58 5 Renewal BRI Ferrier Accounting Nov George St Core 2,83 1 New Sonic Healthcare Healthcare Oct-18 1 Barangaroo St Walsh Bay 7,765 1 New Origin Energy Energy Jul Sussex St Western c.6, 1 New Dimension Data IT Jul-18 1 Barangaroo St Walsh Bay c.65 U/D New Cathay Pacific Aviation Jul Phillip St Core 2,888 7 New NSW Treasury Corp Finance Jun-18 1 Barangaroo St Walsh Bay 1,82 1 New Morningstar Finance May-18 1 Barangaroo St Walsh Bay 4,939 U/D New ICBC Finance Apr Sussex St Western 1, New Spruson & Ferguson Legal Apr George St Midtown 1,721 1 New Investa Real Estate Apr-18 8 Clarence St Western New/Expansion Liquid Learning Education Apr Clarence St Western New Specialist Recruitment Employment Apr-18 1 Barangaroo St Walsh Bay 1,4 7 New Ferrier Hodgson Finance Mar Liverpool St Midtown 1,661 6 New Evolution Mining Mining Mar Pitt St Core Renewal Guidewire Software IT Mar-18 5
6 Volumes rise on the back of demand from offshore and unlisted funds In line with Knight Frank s expectations, investment volumes in the Sydney CBD picked up in 217, following a decline in 216 due to restricted stock. Total investment volumes jumped by a impressive 28% YoY to reach $4.98 billion. This strong surge in transaction activity can be attributed to the increased number of core assets being put on the market, in conjunction with solid investor demand led by offshore investors and local unlisted trusts. Foreign buyers continued to expand their footprint aggressively in the Sydney CBD market buying more office buildings last year than any other buyer type. In total, offshore buyers acquired $1.98 billion worth of assets in 217, up 24% YoY. They were followed by local unlisted trusts, which purchased $1.2 billion (24% of total) over the year. While unlisted trusts have picked up fewer assets than offshore buyers, they dominated the upper end of the market with big-ticket transactions. Singapore and Hong Kongbased investors dominate cross-border activity Cross-border capital flows have remained undeterred by the sharpening yields and rising property prices in the CBD. Leading the way was Hong Kong and Singaporebased investors, while Mainland Chinese buyers appeared to take a breather. A total of $1.28 billion was poured in the CBD market from Hong Kong and Singapore last year, accounting for more than 65% of the total foreign investment value. Prominent foreign buyers over the year included ARA/Straits Real Estate, Ascendas-Singbridge, PA Realty (a joint venture between Mitsubishi Estate Co & CLSA Real Estate), Early Light International and K Wah International. Further yield compression The strong investor competition for CBD assets continued to see tightening in yields with a further 2 4 basis point compression across the grades over the past 12 months. Prime trophy assets are now regularly trading on sub-5% core market yields with the pool of capital remaining deep. The largest single transaction last year was conducted by AMP Capital Wholesale Office Fund in conjunction with UniSuper, acquiring a 5% stake in the Wynyard Place project (1 Carrington Street) for $898.2 million. The fundthrough deal, to be completed in mid- 22, reflected a core market yield of 4.75%. More than half of the Premiumgrade building has been secured to NAB and Allianz, while there will be a rental guarantee for the remaining vacant areas for up to four years from completion. Another prominent deal was the sale of a 5% share in the MLC Centre (19-29 Martin Place) to Dexus Group for $722.5 million. The 73,14 sq m A-Grade property was transacted on a core market yield of 4.95% and with a WALE by income of 4.8 years. The building has recently gone through an extensive redevelopment of the retail podium. In the secondary market, sustained investor appetite continues to be backed up by offshore capital and opportunistic buyers. Core market yields for secondary assets with five years WALEs currently Recent Sales Activity Sydney CBD Address Price ($ mil) Core Mkt Yield (%) NLA (sq m) $/sq m NLA WALE (yrs) Purchaser Vendor 75 Pitt St 43.5 U/D 2,422 17,857 VP Undisclosed Thai Airways Mar Elizabeth St * 5,974 15, Offshore Investor Private Investor Feb-18 1 York St 25. c ,428 11, Blackstone HNA Group Feb-18 1 Castlereagh St ,432 19,7 2.3 Early Light Blackstone Dec Pitt St ,968 2, PA Realty^ ICPF Dec Elizabeth St ,275 14, Charter Hall REIT Bright Ruby Resources Dec York St ,5 14, Private Investor The Primo I.P. Co Pty Dec-17 1 Barrack St , AEW Capital Bright Ruby Resources Dec-17 2 Hunter St ,852 19, K Wah International TH Real Estate Oct-17 9 Hunter St ,548 12, Investec CorVal Oct Kent St * 1,569 15, Offshore Investor Warwick Sherman Oct-17 5 Pitt St ,873 16, AEW Capital TrustCapital Advisors Sep-17 1 Spring St ,871 19, APPF Centuria Sep-17 1 Carrington St ,8 24,64 c.1. AMP/UniSuper Brookfield Sep-17 Sale Date 6
7 AREIT Developer Offshore Owner Occupier Private Investor Super Fund Unlisted/Syndicate Jan-8 Jan-9 Jan-1 SYDNEY CBD OFFICE MARCH 218 RESEARCH Sydney CBD Sales $1 million+ By Purchaser Type ($m) Sydney CBD Purchaser/Vendor $1 million+ sales CY217 Sydney CBD Yields & Spread Core Market Yields - Prime vs Secondary 7, 6, 5, 4, 2,5 2, 1,5 1, 5-5 9% 8% 7% 6% bps , -1, -1,5 5% 3 2, -2, -2,5 4% 2 1, -3, 3% 1 2% AREIT GOVERNMENT OWNER OCCUPIER SUPER FUND DEVELOPER OFFSHORE PRIVATE INVESTOR UNLISTED/SYNDICATE BUYERS SELLERS NET PRIME YIELD SPREAD OVER BOND (RHS) PRIME YIELD SECONDARY YIELD range between 5.5% and 6.%, about 4bps lower than a year ago. Nevertheless, B-Grade assets with repositioning potential and shorter WALEs are trading at similar yields to premium assets at sub-5% reflecting repositioning potential. A key example was the $22 million purchase of 1 Castlereagh Street purchased at 4.57% core market yield by Hong Kong-based Early Light International, which also acquired 2 Bridge Street earlier in the year for $335 million (4.73% core market yield). A more recent deal exchanged earlier in 218 was 1 York Street purchased for $25 million by Blackstone from HNA Group. The core market yield was 5.94% have provided early indication for further yield compression this year. Additionally, 299 Elizabeth Street and 75 Pitt Street are reported have been sold on sub-4% initial yields. By number of transactions, there were 27 properties ($1 million+) exchanged in 217. Even though the number of assets transacted has decreased from last year (33), the average deal size increased by 56% YoY to $184 million per transaction. This is reflective of both the increase in the number of prime assets being transacted as well as the rising value in the Sydney CBD. These trends are expected to continue over the next 12 months with volumes projected to continue to rise. More than $664 million worth of assets have already transacted over the first two months of 218, more than double the corresponding period a year ago. Outlook New supply will be relatively constrained between now and late 219, when 6 Martin Place and 275 George Street are scheduled for completion although speculative supply is limited. The overall vacancy rate in the CBD is forecast to trend down towards circa 3.5% over the next two years. SMEs, TAMI (Technology, Advertising, Media and Information) and co-working sectors are expected to be the major drivers of tenant demand growth in the CBD over the coming years. Gross face rental growth over the next two years is forecast to be between 5. 6.% and 4. 5.% p.a. for prime and secondary stock respectively. Growth in prime stock is expected to be strong given the already strong growth and high rental base in secondary stock that is now pushing through to A-Grade stock. Prime and secondary incentives are projected to trend towards 22% and 15% respectively over the next two years, although incentives being offered for new developments over will likely be higher for pre-committing tenants. The leasing market over the next 24 months will see a rise in precommitments deals as landlords seek to secure tenants for the future developments currently under construction. The supply pipeline is expected to gradually pick up beyond 22 with major completions including; Wynyard Place (68,2 sq m 53% pre-committed by NAB & Allianz H2 22), Quay Quarter Tower (QQT) (88,274 sq m 4% pre-committed by AMP Capital H2 22) and Circular Quay Tower (CQT) (circa 55, sq m potentially end of 22 or early 221). Investor demand is expected to remain strong, supported by offshore investors and unlisted funds while secondary assets continue to attract opportunistic buyers and developers. Given the strength of demand and the spread between prime yields and real bond rates still above 4 basis points, we consider that there is still scope for further yield tightening over the next 12 months. However, expectations of a rising interest rate environment will be a major influence on investors demand. 7


8 RESEARCH Ben Burston Group Director, Research & Consulting Ben.Burston@au.knightfrank.com Alex Pham Associate Director, NSW Alex.Pham@au.knightfrank.com Marco Mascitelli Research Analyst, NSW Marco.Mascitelli@au.knightfrank.com CAPITAL MARKETS Ben Schubert Joint Head of Institutional Sales, Australia Ben.Schubert@au.knightfrank.com Paul Roberts Joint Head of Institutional Sales, Australia Paul.Roberts@au.knightfrank.com John Bowie Wilson Head of Commercial Sales, NSW John.Bowiewilson@au.knightfrank.com Dominic Ong Head of Asian Markets Dominic.Ong@au.knightfrank.com OFFICE LEASING Aaron Weir Head of Office Leasing, NSW Aaron.Weir@au.knightfrank.com Knight Frank Research provides strategic advice, consultancy services and forecasting to a wide range of clients worldwide including developers, investors, funding organisations, corporate institutions and the public sector. All our clients recognise the need for expert independent advice customised to their specific needs. Sydney Industrial Vacancy Analysis February 218 Australian Office Top Transactions CY 217 Student Housing 218 Knight Frank Research Reports are available at KnightFrank.com.au/Research Active Capital 217 Tina Raftopoulos Director, Office Leasing Tina.Raftopoulos@au.knightfrank.com Robin Brinkman Director, Office Leasing Robin.Brinkman@au.knightfrank.com Nick Lau Director, Office Leasing Nick.Lau@au.knightfrank.com Al Dunlop Director, Office Leasing Al.Dunlop@au.knightfrank.com VALUATIONS David Castles National Director David.Castles@au.knightfrank.com Knight Frank 218 This report is published for general information only. Although high standards have been used in the preparation of the information, analysis, views and projections presented in this report, no legal responsibility can be accepted by Knight Frank Research or Knight Frank for any loss or damage resultant from the contents of this document. As a general report, this material does not necessarily represent the view of Knight Frank in relation to particular properties or projects. Reproduction of this report in whole or in part is not permitted without prior consent of, and proper reference to Knight Frank Research.
Strong growth momentum in the first half of 2018
 RESEARCH Withdrawal activity in the Sydney CBD has slowed to its lowest level since July 215. A total of 45,122 sq m has been withdrawn from the market over the past six months. Net absorption over the
Annual Net Absorption (sq m) Annual Net Additions (sq m)
 Annual Net Additions (sq m)") RESEARCH Jan-8 Jan-9 Jan-1 Jan-11 Jan-12 Jan-13 Jan-19 Jan-2 CBD total vacancy fell from 6.5% to 4.6% in the 12 months to January 218, the lowest level since July 28. The CBD recorded the strongest net
RESEARCH Jan-8 Jan-9 Jan-1 Jan-11 Jan-12 Jan-13 Jan-19 Jan-2 CBD total vacancy fell from 6.5% to 4.6% in the 12 months to January 218, the lowest level since July 28. The CBD recorded the strongest net
Briefing Sydney CBD Office September 2018
 Savills Research New South Wales Briefing Sydney CBD Office Highlights Vacancy fell to 4.6% in June 2018 with an outlook to continue to fall until 2019/2020; Rental and capital growth continued with signs
Briefing Sydney CBD Office August 2018
 Savills Research New South Wales Briefing Sydney CBD Office Highlights Prime yields tightened further in the year to March 2018 as demand for prime assets continued unabated from both local and overseas
Sydney CBD Office Market
 WINTER 2016 MARKET TRENDS Leasing demand strong, led by take-up in the property services, education and finance and insurance sectors. Supply levels high over 2015 Stock withdrawals to increase in 2016
Sydney CBD Market Commercial Market Overview - Jul 2015
 Sydney CBD Market Commercial Market Overview - Jul 2015 Contents The Sydney CBD Market... 4 The Sydney CBD Market - Summary... 5 The Sydney CBD Market - Overview... 6 The Sydney CBD Market - Commercial
LMW Link. Brisbane CBD Office ~ August For more information. Brisbane CBD Office Indicators
 ~ August 216 Indicators Indicator Jul 214 Jan 215 Jul 215 Jan 216 Jul 216 Total Stock 2,199,1 2,193,83 2,158,29 2,157,34 2,261,878 Vacancy Rate 14.7% 15.5% 14.9% 14.9% 16.9% Annual Net Absorption (sq m)
74 Pirie Street (1,500m²), a 7 storey building is currently being refurbished by Maras Group and is expected to be completed in Q
, a 7 storey building is currently being refurbished by Maras Group and is expected to be completed in Q") RESEARCH Jul-7 Jul-8 Jul-9 Jul- Jul-11 Jul-12 Jul-13 Jul-14 Jul-15 Jul-16 Jul-17 Jul-18 Jul-19 Jul-2 CBD prime yields firmed by 12 basis points from an average of 7.13% to 7.1% in the six months to January
RESEARCH Jul-7 Jul-8 Jul-9 Jul- Jul-11 Jul-12 Jul-13 Jul-14 Jul-15 Jul-16 Jul-17 Jul-18 Jul-19 Jul-2 CBD prime yields firmed by 12 basis points from an average of 7.13% to 7.1% in the six months to January
MELBOURNE CBD RESEARCH OFFICE MARKET OVERVIEW SEPTEMBER 2017 HIGHLIGHTS
 RESEARCH MELBOURNE CBD OFFICE MARKET OVERVIEW SEPTEMBER 2017 HIGHLIGHTS New supply in the Melbourne CBD office market will be significantly constrained over the next 12 months, with vacancy projected to
New CBD office supply is improving the quality of stock
 Australia Office, Q3 215 New CBD office supply is improving the quality of stock National CBD WCE Jun-15.9% p.a National CBD Net Absorption 215 153,sqm F National CBD Net Supply 215 361,sqm F National
Buoyant Melbourne CBD office market underpinned by a healthy economy
 RESEARCH CBD total vacancy fell from 5.9% to 3.6% in the 12 months to July 2018, the lowest level recorded in ten years. Prime and secondary effective rents grew by 7.2% y.o.y and 14.5% y.o.y respectively
NORTH SHORE OFFICE SEPTEMBER 2018 RESEARCH
 Strong tenant demand across the North Shore is expected to see net absorption average 55, sq m per annum over the next two years, underpinned by new market entrants and continued employment growth. Gross
CANBERRA OFFICE MARKET BRIEF MARCH 2017
 CANBERRA OFFICE MARKET BRIEF MARCH 017 Key Facts As at January 017, Canberra s overall vacancy rate measured 1.6%, down from 1.0% in July 016 and 14.6% a year prior. Two speculative developments totalling
Net supply was negative during 2017 and will remain so in 2018
 RESEARCH From total vacancy of 16.2% at the start of 2018 the Brisbane CBD will see improvement, moving to sub 13.5% by the end of the year. Prime and secondary effective rents grew by 3.4% p.a and 3.0%
RESEARCH. With the majority of new supply over the next two years precommitted,
 RESEARCH With the majority of new supply over the next two years precommitted, vacancy rates are forecast to remain low across both the North Shore and Macquarie Park precincts. Strong demand for secondary
ADELAIDE RESEARCH OFFICE MARKET OVERVIEW AUGUST 2017 HIGHLIGHTS
 ADELAIDE OFFICE MARKET OVERVIEW AUGUST HIGHLIGHTS Average Prime incentives in the CBD Core now average 36.3% and typically range between 35% to 4%, compared with 3% to 35% in the second half of 216. Offshore
CI AUSTRALIA SYDNEY CBD SEPTEMBER 2018 OFFICE MARKET UPDATE - SYDN E Y C B D
 CI AUSTRALIA O F F I C E M A R K E T U P D AT E SYDNEY CBD SEPTEMBER 2018 OFFICE MARKET UPDATE - SYDN E Y C B D 1 EXECUTIVE SUMMARY. Welcome to our September 2018 Office Market Update. We explore leasing
Briefing West Perth Office April 2018
 Savills Research Briefing West Perth Office Highlights Recentralisation to the CBD remains a feature in West Perth, with a number of tenants relocating from West Perth to the CBD, contributing to the rise
Briefing Melbourne CBD Office August 2018
 Savills Research Victoria Briefing Melbourne CBD Office Highlights Tenant demand has been steady and on the back of strong economic indicators, Grade A stock is now recording its lowest vacancy rate in
m3commentary MELBOURNE CBD OFFICE
 m3commentary MELBOURNE CBD OFFICE Spring 2016 Key Research Contacts: Jennifer Williams National Director NSW (02) 8234 8116 Erin Obliubek Research Manager VIC (03) 9605 1075 Casey Robinson Research Manager
Briefing Melbourne CBD Office April 2018
 Savills Research Victoria Briefing Melbourne CBD Office Highlights Victorian jobs ads have been positive for past five years and currently are at their highest level since May 2009; This growth in professional
Positive economic outlook for South Australia
 RESEARCH The Adelaide CBD vacancy rate declined from 15.% to 1.7% in the six months to July 1. This tightening of the vacancy rate is expected to continue due to the increase in the level of tenant enquiries
Briefing Brisbane Fringe Office February 2018
 Savills Research Briefing Brisbane Fringe Office Highlights The Queensland economy continues to show strong signs of recovery, with economic growth for the state recorded at 3.0% over the year to September
Sydney Metropolitan Office
 CBRE Sydney Metropolitan Office www.cbre.com.au/research Third Quarter 211 Quick Stats Change from last Yr. Qtr. Economic Growth White collar employment New supply Net absorption Total Vacancy Prime rents
BRISBANE CBD RESEARCH OFFICE MARKET OVERVIEW MAY 2017 HIGHLIGHTS
 BRISBANE CBD OFFICE MARKET OVERVIEW MAY 2017 HIGHLIGHTS With only 18,400m² of refurbished stock to come on line in 2017 and no major new supply expected prior to late 2018, the growing tenant demand and
Development Activity
 The North Sydney s vacancy rate has fallen from 7.3% in January 217 to 6.4% in July 217 on the back of positive tenant demand stemming from both expansion and inbound migration. Stock withdrawals will
GOLD COAST OFFICE OVERVIEW
 GOLD COAST OFFICE OVERVIEW JANUARY 2014 Gold Coast OVERVIEW Gold Coast office stock at January 2014 totalled 459,890 sqm, down by almost 4,000 sqm on the mid-year stock level. Around 2,000 sqm of refurbished
Brisbane CBD Office Market Indicators as at July 2017
 RESEARCH Total vacancy was 15.7% as at July 2017, still down from the cyclical high of 16.9% in mid- 2016 but up from the start of 2017. Prime and secondary effective rents grew by 4.7% p.a and 2.6% p.a
CBD OFFICE First Half 2018
 Research and Forecast Report Accelerating success. CBD OFFICE First Half 2018 1 EXPERTS IN PROPERTY DATA & INSIGHTS Colliers Edge is a subscription service developed by our in-house property research specialists,
Briefing Brisbane CBD Office August 2017
 Savills Research Queensland Briefing Brisbane CBD Office Highlights A turnaround has become evident in Brisbane with absorption of prime grade stock leading the nation and double digit growth evident in
Briefing Parramatta Office February 2018
 Savills Research Briefing Parramatta Office Highlights The overall vacancy rate in Parramatta s office market fell further in December 2017 to 3.0% from 4.6% a year prior; Interest from local institutional
ADELAIDE RESEARCH OFFICE MARKET OVERVIEW SEPTEMBER 2016 HIGHLIGHTS
 RESEARCH ADELAIDE OFFICE MARKET OVERVIEW SEPTEMBER 216 HIGHLIGHTS The Adelaide CBD vacancy rate increased from 14.1% to 15.8% in the six months to July 216. This was largely the result of an increase in
Sydney CBD Investment Market Review and 2013 Outlook
 Sydney CBD Investment Market Review and 2013 Outlook Introduction and 2012 review Investment in the Sydney CBD reached $4.29Bn in 2012, the highest level on record (since JLL began recording in 1988) and
Briefing Adelaide Fringe Office February 2018
 Savills Research South Australia Briefing Adelaide Fringe Office Highlights A slight rise in the vacancy rate was led by the return of refurbished floor space, the largest level since 2013, reflecting
Research and Forecast Report. Accelerating success. CBD OFFICE. Second Half 2018
 Research and Forecast Report Accelerating success. CBD OFFICE Second Half 2018 1 EXPERTS IN PROPERTY DATA & INSIGHTS Colliers Edge is a subscription service developed by our in-house property research
GOING PLACES MACARTHURCOOK OFFICE PROPERTY TRUST
 GOING PLACES MACARTHURCOOK OFFICE PROPERTY TRUST ANNUAL REPORT 2006 1 2 3 4 1 2 181 Miller Street, North Sydney, NSW 150 170 Leichhardt Street, Spring Hill, Brisbane, QLD 3 4 38 Akuna Street, Canberra,
130 PITT STREET, SYDNEY NOW LEASING PITT
 130 PITT STREET, SYDNEY NOW LEASING 130 PITT Investa Property Group is pleased to offer superior quality space in the heart of Sydney s CBD. LEASING OPPORTUNITY > Whole floors > Small suites > Fitted out
GREATER SYDNEY SUPPLY & DEMAND. Tourism Accommodation Australia 31 May 2017
 GREATER SYDNEY SUPPLY & DEMAND Tourism Accommodation Australia 31 May 2017 OVERVIEW 1 Trading Performance 4 Summary 2 Supply & Demand 5 Questions 3 Hotel Investment Market TRADING PERFORMANCE Sydney City
Withdrawals dominated the Brisbane Fringe during 2017
 RESEARCH Total vacancy has remained elevated at 14.1%. The vacancy rate is expected to rise again in mid-2018 to 14.8%, before beginning to ease. Prime effective rents remain stagnant. Increases to face
QUARTERLY UPDATE 31 MARCH 2017
 AUSTRALIAN PROPERTY OPPORTUNITIES FUND QUARTERLY UPDATE 31 MARCH 2017 The Australian Property Opportunities Fund (APOF I or the Fund) is pleased to provide this update for the March quarter 2017 (Q1 2017)
m3commentary INNER BRISBANE OFFICE CBD and Fringe
 m3commentary INNER BRISBANE OFFICE CBD and Fringe Spring 2017 Key Research Contacts: Casey Robinson Research Manager QLD (07) 3620 7906 Jennifer Williams National Director NSW (02) 8234 8116 Amita Mehrotra
Demand set to continue for Sydney Suburban Office
 March 2012 Demand set to continue for Sydney Suburban Office Key Points Buyer activity was steady in the Sydney Suburban office market, with interest directed towards prime Suburban assets. Prime yields
Briefing Adelaide CBD Office February 2018
 Savills Research South Australia Briefing Adelaide CBD Office Highlights Adelaide CBD office market has recorded two consecutive periods of positive net absorption, also the highest level seen in five
Briefing Perth CBD Office August 2017
 Savills Research Western Australia Briefing Perth CBD Office Highlights The Perth CBD office market has started to see some gains from flight to quality and centralisation trends, resulting in the highest
Commonwealth Games to raise profile
 RESEARCH Total vacancy has continued to steadily fall, now 10.6%. Prime vacancy is now at 10 year lows, falling to 8.9%. Despite steady and sustained net absorption over the past four years the pipeline
Briefing Perth CBD Office February 2019
 Savills Research Western Australia Briefing Perth CBD Office Highlights Continued recovery of the leasing market has been the trend in the Perth CBD, with vacancy now at its lowest point since June 2015;
DEXUS Property Group (ASX: DXS) ASX release
 ASX release") 6 May 2013 DEXUS and DWPF to acquire strategic office investment in Perth DEXUS Property Group (DEXUS or DXS) and DEXUS Wholesale Property Fund (DWPF) today announced the joint acquisition of a strategic
6 May 2013 DEXUS and DWPF to acquire strategic office investment in Perth DEXUS Property Group (DEXUS or DXS) and DEXUS Wholesale Property Fund (DWPF) today announced the joint acquisition of a strategic
Office Market Report. Australian CBD. First Half 2017 HIGHLIGHTS INSIDE THIS ISSUE: Australian Overview 2. Sydney 3. Melbourne 6.
 1 Office Market Report Australian CBD First Half 217 HIGHLIGHTS Over the last five years, Australia s total office stock increased by 4.8% to over twenty five million square metres. Sydney CBD s office
Office Market Report January 2013 Presented by Adrian Harrington Head of Funds Management - Folkestone
 Office Market Report January 2013 Presented by Adrian Harrington Head of Funds Management - Folkestone Jan-95 Jan-96 Jan-97 Jan-98 Jan-99 Jan-00 Jan-01 Jan-02 Jan-03 Source: Property Council of Australia
New supply has declined across the suburban market
 RESEARCH Sydney suburban office vacancy rate decreased by 16bps over the past 12 months to 6.1% as at January 2018, well below the historical average of 8.4%. Prime effective rents increased by 13% YoY
Investor Report. Connecting the best of both worlds
 Investor Report Connecting the best of both worlds Executive summary Project & display address 1015 Pacific Highway, Roseville, NSW 2069 Project description Rose is a mixed-use development located within
market-view Australian housing markets report Residential construction on the rise - higher and higher?
 Australian housing markets report Residential construction on the rise - higher and higher? Dr Andrew Wilson Chief Economist Domain Group October 2016 Copyright 2016 Dr Andrew Wilson all rights reserved
UNITED KINGDOM BIRMINGHAM OFFICES QUARTER
 UNITED KINGDOM OFFICES QUARTER 4 2 TAKE-UP 753,329 SQ FT 113,713 KEY DEAL 118,240 SQ FT TO BCU AT BELMONT WORKS, EASTSIDE CITY CENTRE SERVICED OFFICES SQ FT HEADLINE RENT 33 PSF Take-up > Annual take-up
CBD OFFICE Second Half 2017
 Research and Forecast Report Accelerating success. CBD OFFICE Second Half 2017 1 EXPERTS IN PROPERTY DATA & INSIGHTS Colliers Edge is a subscription service developed by our in-house property research
SEPTEMBER 2013 ADELAIDE OFFICE
 RESEARCH SEPTEMBER 01 ADELAIDE OFFICE Market Brief HIGHLIGHTS The July 01 vacancy results reflected an increase over the six month period to 1.1% for the Adelaide CBD up from 9.5% as at January. The Adelaide
Leasing market posts increase in take-up Slow activity on investment market
 Düsseldorf Office Leasing and Investment Q1 2015 MARKET REPORT Leasing market posts increase in take-up Slow activity on investment market LARS ZENKE Research Analyst Düsseldorf Office take-up (in 1,000
UNITED KINGDOM MANCHESTER OFFICES QUARTER
 UNITED KINGDOM MANCHESTER OFFICES QUARTER 2 2018 2 327,035 SQ FT 53,839 SQ FT by WSP PRIME YIELDS 4.50% Following a record first quarter takeup, the Manchester office market saw 327,035 sq ft in 76 deals
PERTH CBD OFFICE RESEARCH HIGHLIGHTS. Market Overview
 RESEARCH MARCH 12 PERTH CBD OFFICE Market Overview HIGHLIGHTS The Property Council of Australia s total vacancy rate was 3.3% for January 12 down from 7.8% in July 11. Premium-grade vacancy is now only
Office Market Report
 1 Office Market Report Australian CBD Second Half 2016 HIGHLIGHTS Over the ten years to January 2017, Australia s total stocks of office space increased by 22.6%, to over 25 million square metres of space.
Perth CBD Office. March 2014 RESEARCH HIGHLIGHTS. Market Overview
 RESEARCH March 14 Perth CBD Office Market Overview HIGHLIGHTS The effects of a soft Perth CBD leasing market during 13 have materialised with negative net absorption of 46,442m 2 recorded for the twelve
m3commentary BRISBANE CBD OFFICE
 m3commentary BRISBANE CBD OFFICE Autumn 2017 Key Research Contacts: Casey Robinson Research Manager QLD (07) 3620 7906 Jennifer Williams National Director NSW (02) 8234 8116 Erin Obliubek Research Manager
Australian Capital Markets Q Accelerating success. THE HUNT FOR YIELD. Australian Capital Markets Q The Hunt For Yield
 Australian Capital Markets Q3 2016 Accelerating success. THE HUNT FOR YIELD Australian Capital Markets Q3 2016 The Hunt For Yield Global unease position Australia favourably as an investment destination
A CUSHMAN & WAKEFIELD RESEARCH PUBLICATION SYDNEY S NORTH SHORE. Office Markets DECEMBER 2017 CITIES INTO ACTION
 A CUSHMAN & WAKEFIELD RESEARCH PUBLICATION SYDNEY S NORTH SHORE Office Markets DECEMBER 2017 CITIES INTO ACTION CITIES INTO ACTION CONTENTS MARKET OVERVIEW...3 HIGHLIGHTS...4 LEASING MARKET...9 INVESTMENT
Brisbane Fringe Office Market Indicators as at October 2017
 RESEARCH Total vacancy has remained elevated at 14.4%. Prime vacancy has increased to 12.4%, while secondary vacancy is also higher at 16.7%. Prime effective rents remain stagnant. While face rents have
A Conversation With Folkestone. November 2017
 A Conversation With Folkestone November 2017 1 POPULATION GROWTH BY STATE Australian Population Growth by State: March 2017 Population (m) Growth in Year ( 000) % Change in Year VIC 6.3 149.4 2.4 ACT 0.4
The Melbourne CBD: What is driving centralisation?
 November 2013 The Melbourne CBD: What is driving centralisation? Key Points Jones Lang LaSalle recorded a notable increase in the number of city Fringe 1 occupiers migrating to the Melbourne CBD over the
Paris. Research. Office market report - Q Contents. Market Summary
 Research Paris Office market report - 2008 Contents Paris 2 Ile-de-France map Market breakdown 3 Market data 4 Market Summary With more than 590,000 sq m let in the second quarter of 2008, the office market
RESEARCH INDUSTRIAL SNAPSHOT
 RESEARCH INDUSTRIAL SNAPSHOT GREATER LONDON AND WESTERN HOME COUNTIES H2 2017 GREATER LONDON & WESTERN HOME COUNTIES LOGISTICS & INDUSTRIAL RESEARCH Introduction As the UK economy continues to grow so
APRIL 2011 SYDNEY CBD OFFICE
 RESEARCH APRIL 2011 SYDNEY CBD OFFICE Market Overview HIGHLIGHTS Many landlords took the opportunity to complete refurbishment programs on vacant buildings over 2010 in an effort to reposition the asset
ADELAIDE RESEARCH OFFICE MARKET OVERVIEW SEPTEMBER 2015 HIGHLIGHTS
 RESEARCH ADELAIDE OFFICE MARKET OVERVIEW SEPTEMBER 215 HIGHLIGHTS The Adelaide CBD vacancy rate remains unchanged at 13.5% in the six months to July 215. However, vacancy in prime space has decreased while
Key Findings RESEARCH & CONSULTING. Population growth in Newcastle expected to average 1,770 persons per annum between 2014 and 2031
 RESEARCH & CONSULTING Key Findings Population growth in Newcastle expected to average 1,77 persons per annum between 214 and 231 Gross Regional Product (GRP) was estimated to be $14.23 billion as at 214,
UNITED KINGDOM MANCHESTER OFFICES QUARTER
 UNITED KINGDOM MANCHESTER OFFICES QUARTER 3 2 479,637 SQ FT 225,000 SQ FT Pre-let to Booking.com INVESTMENT VOLUME 147m Leasing activity in the Manchester office market for the first three quarters of
RESEARCH A REVIEW OF MAJOR OFFICE MARKET TRANSACTIONS AND TRENDS IN 2017
 RESEARCH A REVIEW OF MAJOR OFFICE MARKET TRANSACTIONS AND TRENDS IN 217 RESEARCH $17.9 billion of office assets transacted during 217, CBD investment bounced back, accounting for 66% of sales. Sydney retained
The Residential Outlook for South Australia
 The Residential Outlook for South Australia Matthew King Economist HOUSING INDUSTRY ASSOCIATION February 2011 Overview Economic backdrop Other important matters Interest rates & bank lending Renovations
GOLD COAST OFFICE OVERVIEW
 GOLD COAST OFFICE OVERVIEW Q1 2015 Gold Coast OVERVIEW Gold Coast office stock at January 2015 totalled 472,022sqm, up by just over 12,000sqm over the past year. The only new building completed in 2014,
Location Report. Coffs Harbour U Retire ( ) Retire with Property
 Retire with Property") Location Report Coffs Harbour Retire with Property 1300 U Retire (873 847) www.superannuationproperty.com Coffs Harbour Location Coffs Harbour is a regional town on the North Coast of New South Wales
Location Report Coffs Harbour Retire with Property 1300 U Retire (873 847) www.superannuationproperty.com Coffs Harbour Location Coffs Harbour is a regional town on the North Coast of New South Wales
Australian Property Directions Survey Commercial, Industrial, Retail and Trusts
 Australian Property Directions Survey Commercial, Industrial, Retail and Trusts NOVEMBER 2016 This is the 36th API Australian Property Directions Survey conducted by the Australian Property Institute.
BRISBANE INDUSTRIAL MARKET OVERVIEW API State of the Market Brisbane Industrial 22 nd of March 2018
 BRISBANE INDUSTRIAL MARKET OVERVIEW API State of the Market Brisbane Industrial 22 nd of March 2018 QLD GROWTH QLD KEY DRIVERS OF GROWTH Fueled by Tourism up 80% over next decade $43b infrastructure Investment
MELBOURNE CBD RESEARCH HIGHLIGHTS. Office Market Overview
 RESEARCH MAY 2012 MELBOURNE CBD Office Market Overview HIGHLIGHTS In the absence of any major developments completed, total vacancy fell despite subdued tenant demand. However total vacancy is now anticipated
Briefing Perth CBD Office August 2018
 Savills Research Western Australia Briefing Perth CBD Office Highlights The Perth CBD office market has swung through the bottom of the cycle into recovery, with recent employment growth aiding positive
MARKETBEAT. Queenstown Regional. Residential
 Winter 2016 MARKETBEAT RESEARCH NEWSLETTER Queenstown Regional Queenstown is booming. A surging tourism sector drawing in more workers, coupled with an increasing wave of lifestylers and rising investor
Briefing Adelaide CBD Office September 2018
 Savills Research South Australia Briefing Adelaide CBD Office Highlights Adelaide CBD office vacancy rate declines to its lowest rate since 2014, underpinned by tenant positive demand; There are a number
The Outlook for the Residential Construction Industry Hunter and the Central Coast
 The Outlook for the Residential Construction Industry Hunter and the Central Coast Graham Wolfe HIA Chief Executive Industry Policy and Media HIA Industry Outlook Breakfast Newcastle February 2013 Backdrop:
Brisbane. Executive Summary. Economic Overview. Q Industrial Market Commentary
 Q3 2017 Industrial Market Commentary Brisbane Executive Summary The Brisbane industrial market is showing tangible signs of improvement, after relatively soft leasing conditions in 2016. Gross take-up
RESEARCH INDUSTRIAL SNAPSHOT
 RESEARCH INDUSTRIAL SNAPSHOT GREATER LONDON AND WESTERN HOME COUNTIES H1 2017 GREATER LONDON & WESTERN HOME COUNTIES LOGISTICS & INDUSTRIAL RESEARCH Introduction Our report provides an insight into the
UNITED KINGDOM MANCHESTER OFFICES QUARTER
 UNITED KINGDOM MANCHESTER OFFICES QUARTER 4 2 TAKE-UP 1,750,276 SQ FT PRIME RENTS 37 PSF INVESTMENT VOLUME 708m 64% ABOVE 10 YEAR AVERAGE TAKE-UP was a record year in the Manchester office market, with
2008 INTERIM ANNOUNCEMENT
 (Stock Code: 78) 2008 INTERIM ANNOUNCEMENT FINANCIAL HIGHLIGHTS Six months ended 30th June, 2008 (Unaudited) Six months ended 30th June, 2007 (Unaudited) HK$ M HK$ M Revenue 750.8 622.0 Operating profit
Outer East and South East regions lead gross new supply. Gross new supply in 2018 to stem from the North & West region
 RESEARCH Melbourne metropolitan office vacancy rate fell from 7.0% to 5.2% in the 12 months to March 2018, sitting below the historical average of 5.9%. Average prime net rents increased by 5.8% in the
Belgrade City Report Q City Reports
 Belgrade City Report City Reports GDP Growth Q4 (y-o-y) Net Salary February Economy / Investment Economics 1.2% Inflation February (y-o-y) 1.5% 450 Unemployment Rate Q4 18.5% Retail Sales Index February
OUTLOOK WATERLOO. Waterloo is a growing residential market, boasting high amenity that is well located to a number of major employment centres.
 OUTLOOK WATERLOO A CONTEXT ON BUSINESS, CULTURE, LIFESTYLE AND RESIDENTIAL Waterloo is a growing residential market, boasting high amenity that is well located to a number of major employment centres.
ASIA PACIFIC OVERVIEW
 OFFICE July - September ASIA PACIFIC OVERVIEW A CUSHMAN & WAKEFIELD QUARTERLY RESEARCH PUBLICATION A CUSHMAN & WAKEFIELD QUARTERLY RESEARCH PUBLICATION ASIA PACIFIC OFFICE OVERVIEW OCCUPIER CONDITIONS
Lend Lease Investment Management Australia
 Lend Lease Investment Management Australia Tarun Gupta CEO Australia Lend Lease Investment Management Appropriate photo Market Update May 2007 Australian Business Overview: Funds Under Management (FUM)
DEXUS Property Group (ASX: DXS) ASX release
 ASX release") 11 February 2016 DEXUS and DWPF acquire North Sydney site for premium office development DEXUS Property Group (DEXUS) and DEXUS Wholesale Property Fund (DWPF) today announced that they have jointly entered
11 February 2016 DEXUS and DWPF acquire North Sydney site for premium office development DEXUS Property Group (DEXUS) and DEXUS Wholesale Property Fund (DWPF) today announced that they have jointly entered
T H E N O R T H S H O R E
 THE NORTH SHORE O F F I C E M A R K E T U P DAT E SUMMER 2018 N O R T H S H O R E R E G I O N S......................................................................... 2 W H AT S T R E N D I N G..................................................................................
LEEDS PROPERTY GUIDE 2018/2019
 LEEDS PROPERTY GUIDE 2018/2019 LEEDS PROPERTY GUIDE - 2018/2019 WHY INVEST IN BUY-TO-LET? There has never been a better time to invest in buy-to-let in the UK. The number of people renting in the UK is
New breed of tenants
 Research and Forecast report Second Half 2015 Australia & New Zealand CBD OFFICE New breed of tenants Strategic owners adapt to change Accelerating success. First Half 2015 Australia First Half 2015 Australia
GRANT THORNTON BANKERS BOOT CAMP
 GRANT THORNTON BANKERS BOOT CAMP Where are we in the cycle? Yield compression slowing, rents growing Yields bottoming but the bottom could last till 2020 The end of yield compression brings income return
Key Facts RESEARCH. $28 billion of office assets transacted over the past two years, of which $18.8 billion was in CBD markets
 RESEARCH Key Facts $28 billion of office assets transacted over the past two years, of which $18.8 billion was in CBD markets Unsurprisingly, eight of the top 1 office sales in 214 were located in CBDs
Australia Office MarketView
 Australia Office MarketView Q4 212 QUARTERLY GDP.5% OFFICE JOBS GROWTH -.8% CBD OFFICE VACANCY 8.1% PRIME RENTAL GROWTH +3.2% CBRE Global Research and Consulting PRIME YIELD 7.45% Q412 INVESTMENT VOLUME
Executive summary. Project description. Project name. Project address. Apartment mix. Deposit required. Estimated construction commencement date
 Investor Report Executive summary Project name Highline westmead Project address 158 164 Hawkesbury Road,, NSW 2145 Apartment mix Studio, 1, 2 and 3 bedroom apartments Deposit required 10% Deposit (cash