Interstate 95 / Scudder Falls Bridge Traffic Study
|
|
|
- Marcia Williams
- 5 years ago
- Views:
Transcription

1 Technical Memorandum Interstate 95 / Scudder Falls Bridge Traffic Study September 2004 Delaware Valley Regional Planning Commission The Bourse Building 111 South Independence Mall East Philadelphia, PA
2
3 Technical Memorandum Interstate 95 / Scudder Falls Bridge Traffic Study September 2004 Delaware Valley Regional Planning Commission The Bourse Building 111 South Independence Mall East Philadelphia, PA This memorandum is printed on recycled paper -
4 Created in 1965, the Delaware Valley Regional Planning Commission (DVRPC) is an interstate, intercounty, and intercity agency which provides continuing, comprehensive, and coordinated planning to shape a vision for the future growth of the Delaware Valley region. The region includes Bucks, Chester, Delaware, and Montgomery counties as well as the City of Philadelphia, in Pennsylvania; and Burlington, Camden, Gloucester, and Mercer counties in New Jersey. DVRPC provides technical assistance and services, conducts high priority studies that respond to the request and demands of member state and local governments, fosters cooperation among various constituents to forge a consensus on diverse regional issues, determines and meets the needs of the private sector, and practices public outreach efforts to promote two-way communication and public awareness of regional issues and the commission. Our logo is adapted from the official DVRPC seal, and is designed as a stylized image of the Delaware Valley. The outer ring symbolizes the region as a whole while the diagonal bar signifies the Delaware River. The two adjoining crescents represent the Commonwealth of Pennsylvania and the State of New Jersey. DVRPC is funded by a variety of sources including federal grants from the U.S. Department of Transportation s Federal Highway Administration (FHWA) and Federal Transit Administration (FTA), the Pennsylvania and New Jersey departments of transportation, as well as by DVRPC s state and local member governments. This report was primarily funded by the Delaware River Joint Toll Bridge Commission (DRJTBC). The authors, however, are solely responsible for its findings and conclusions, which may not represent the official views or policies of the funding agencies. On the cover: Aerial view of the Scudder Falls Bridge and NJ 29 (River Road) interchange.
5 TABLE OF CONTENTS I. INTRODUCTION... 1 II. THE SCUDDER FALLS BRIDGE CORRIDOR... 3 A. Current Traffic Demand... 5 III. TRAVEL FORECASTING PROCEDURES A. Socio-Economic Projections Population Forecasting Employment Forecasting Scudder Falls Bridge Study Area Forecasts B. DVRPC s Travel Simulation Models Separate Peak, Midday, and Evening Models The Model Chain C. Improvement Alternatives The No-Build Alternative The Build Alternative IV. PROJECTED TRAFFIC VOLUMES A. No-Build Alternative Traffic Forecasts B. Build Alternative Traffic Forecasts i
6 LIST OF MAPS 1. Scudder Falls Bridge Corridor Area Travel Simulation Model Study Area LIST OF FIGURES 1. Current Average Daily Traffic Volumes Current AM and PM Peak Hour Traffic Volumes DVRPC s Travel Simulation Modeling Process Current Counts, 2015, and 2030 No-Build Alternative Daily Traffic Volumes No-Build Alternative AM / PM Peak Hour Traffic Volumes No-Build Alternative AM / PM Peak Hour Traffic Volumes Current Counts, 2015, and 2030 Build Alternative Daily Traffic Volumes Build Alternative AM / PM Peak Hour Traffic Volumes Build Alternative AM / PM Peak Hour Traffic Volumes LIST OF TABLES 1. Population and Employment in the Scudder Falls Study Area Comparison of Current and No-Build Alternative Daily Traffic Volumes Comparison of No-Build and Build Alternative Daily Traffic Volumes ii
7 I. INTRODUCTION The Delaware River Joint Toll Bridge Commission (DRJTBC), in cooperation with the New Jersey and Pennsylvania Departments of Transportation, and the Federal Highway Administration, is evaluating measures to improve safety and relieve congestion on the Scudder Falls Bridge and along Interstate 95 from PA Route 332 (Newtown - Yardley Road) in Lower Makefield Township, Bucks County, Pennsylvania to County Route 579 (Bear Tavern Road) in Ewing Township, Mercer County, New Jersey. The Scudder Falls Bridge carries four lanes of Interstate 95 traffic across the Delaware River, connecting Pennsylvania and New Jersey, and providing a vital link between the states for commerce and commuters. Opened in 1961, the bridge was the first section of I-95 to be completed in the Delaware Valley Region and now serves the most traffic of the 20 DRJTBC-managed bridges connecting Pennsylvania and New Jersey. In 1990, the Traffic Study of Trenton-Morrisville Bridge Crossings over the Delaware River identified congestion and safety problems on the Scudder Falls Bridge. 1 More recently, the Southerly Crossings Corridor Study concluded that the bridge's congestion and safety problems related to its narrow configuration, the proximity of adjoining interchanges, and ramps merging onto I The existing Scudder Falls Bridge is 1,740 feet long and consists of two travel lanes in each direction, separated by a concrete median barrier. The bridge lacks shoulders and breakdown lanes and does not meet current highway design standards. Congestion at the bridge is exacerbated by the proximity of the Taylorsville Road and River Road interchanges, both within a half-mile of the bridge. Neither interchange is adequate to safely handle the current volume of traffic. The interchanges have substandard geometric features, such as acceleration and deceleration lanes that are too short, lack of sufficient spacing between ramps, and ramp radii that are too tight. These features create poor merging and weaving conditions. DRJTBC has retained the Delaware Valley Regional Planning Commission (DVRPC) to develop traffic volume projections for the years 2015 and These volumes will be used to refine the design of an improved river crossing facility that addresses the safety and operational deficiencies of the existing Scudder Falls Bridge and its approaches. DVRPC is a bi-state transportation and regional planning organization. The region includes 1 Traffic Study of Trenton-Morrisville Bridge Crossings over the Delaware River, Delaware River Joint Toll Bridge Commission, Morrisville, Pennsylvania, Southerly Crossings Corridor Study - Phase I Transportation Study, The Louis Berger Group, Inc., East Orange, New Jersey, August
8 Bucks, Chester, Delaware, Montgomery, and Philadelphia counties in Pennsylvania; and Burlington, Camden, Gloucester, and Mercer counties in New Jersey. This technical memo summarizes the results of DVRPC s traffic forecasting effort. Chapter II includes a brief description of the existing Scudder Falls Bridge corridor, including current daily and peak hour traffic volumes and operational problems. Chapter III describes DVRPC's travel forecasting model and the socio-economic and land use assumptions used for this study. Finally, Chapter IV presents an analysis of future traffic volumes under the No-Build and Build alternatives for the Scudder Falls Bridge. 2
9 II. THE SCUDDER FALLS BRIDGE CORRIDOR The Scudder Falls Bridge improvement project is intended to alleviate traffic congestion and improve operational and safety conditions in the I-95 corridor from PA 332 (Newton-Yardley Road) in Lower Makefield Township, Bucks County, Pennsylvania to CR 579 (Bear Tavern Road) in Ewing Township, Mercer County, New Jersey. This 4.4 mile corridor also includes interchanges at Taylorsville Road in PA and NJ 29 (River Road) and NJ 175 (Upper River Road) in New Jersey. These facilities are shown in Map 1. Within the study area, I-95 is two lanes by direction from PA 332 to NJ 29, including the Scudder Falls Bridge. The main bridge section provides two lanes of travel for each direction separated by a concrete median. Other cross-section features include narrow emergency sidewalks, no breakdown lanes and no shoulders. Route 29 marks the transition to three lanes by direction, which extends through the Bear Tavern Road interchange. According to the Highway Capacity Manual, freeway on- and off-ramps can affect mainline traffic operations within a merge or diverge influence area, which extends 1,500 feet downstream of an on-ramp or upstream of an off-ramp. 3 Traffic in these influence areas is affected by vehicles changing lanes and adjusting speeds to complete the merge or diverge movement. The concentration of interchange ramps on either side of the Scudder Falls Bridge has a detrimental effect on traffic conditions. Just on the Pennsylvania side of the Bridge is an interchange serving traffic movements to and from Taylorsville Road. Along I-95 northbound, there is an off-ramp to Taylorsville Road followed by a loop on-ramp from Taylorsville Road southbound and an additional on-ramp from Taylorsville Road northbound. These two on-ramps, in close proximity to one another, coupled with short acceleration lanes create turbulence in the traffic stream in the merge influence area which in turn leads to or exacerbates congestion on the I-95 mainline. Compounding this problem is the off-ramp to NJ 29 just across the Delaware River. The diverge influence area of this ramp overlaps with the merge influence area of the upstream on-ramp, which creates a weaving situation on the Scudder Falls Bridge. Following this off-ramp are two additional closely spaced on-ramps, one from NJ 29 and the other from NJ Highway Capacity Manual 2000, Transportation Research Board, National Research Council, Washington, DC,

10 Map 1. Scudder Falls Bridge Corridor Area 4
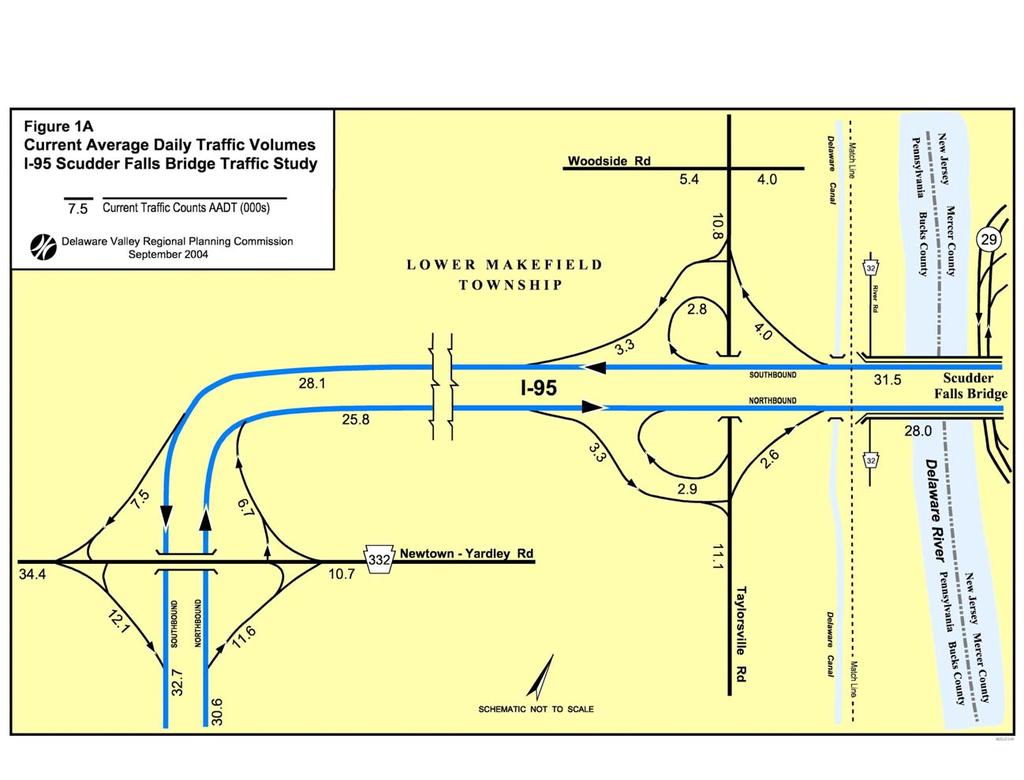
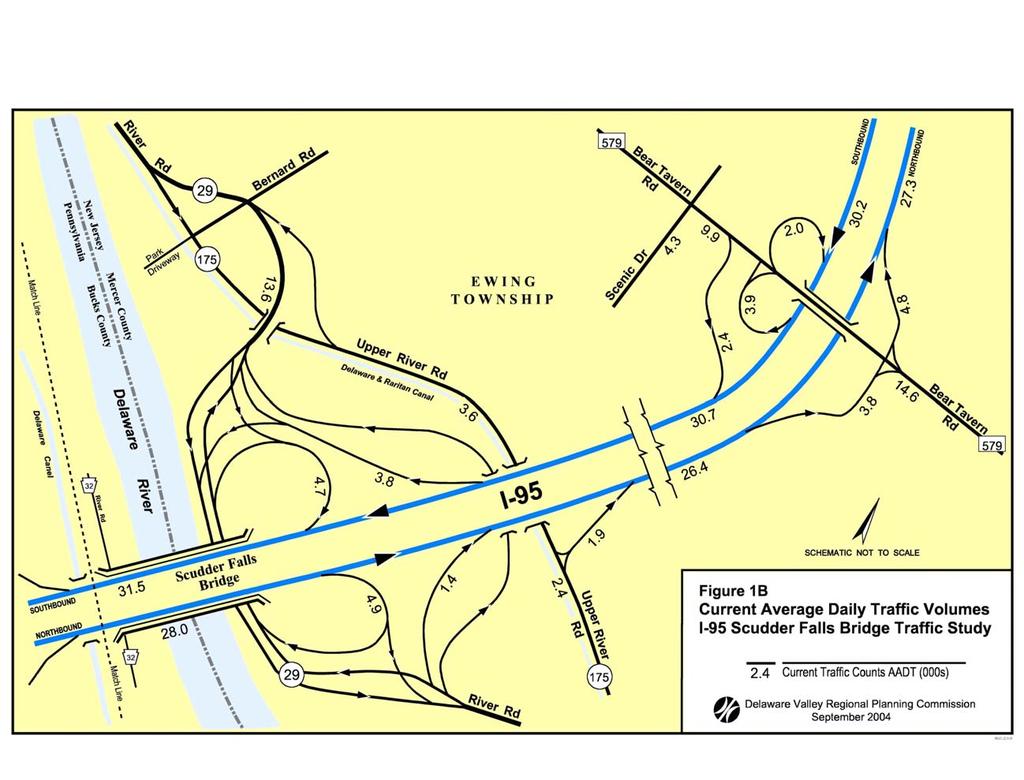
11 Similar operational issues exist in the southbound direction. Although there is only one southbound on-ramp from NJ 29, this traffic must completely stop at the I-95 merge, leading to both safety hazards and operational issues due to the considerable difference in operating speeds between the on-ramp and mainline traffic flows in the merge area. Again, merge and diverge influence areas overlap on the bridge as separate off-ramps serve traffic to Taylorsville Road northbound and southbound. A. Current Traffic Demand In order to determine current traffic demand, DRJTBC's consultants (DMJM+Harris) conducted a traffic counting program within the study corridor in Daily traffic volumes were counted on the Scudder Falls Bridge, other I-95 locations, and all on- and off-ramps between PA 332 and Bear Tavern Road. DVRPC took additional daily traffic counts on PA 332 and Taylorsville Road in Lower Makefield Township and on NJ 29, Upper River Road, and Bear Tavern Road in Ewing Township. All traffic counts were seasonally adjusted to represent average annual daily traffic (AADT) conditions. Figure 1 displays the current daily traffic volumes in the study corridor. Daily volumes in the I-95 corridor range from 53,800 between PA 332 and Taylorsville Road to 63,300 vehicles south of Newtown - Yardley Road. The Scudder Falls Bridge carries 59,500 vehicles on a typical day. On the New Jersey side, Interstate 95 volumes average about 57,000 vehicles per day (vpd). It is interesting to note that the four-lane sections of I-95 in Pennsylvania and on the Scudder Falls Bridge generally serve higher daily traffic volumes than the six-lane sections in New Jersey. The I-95 / PA 332 interchange serves the most traffic by far of all the interchanges in the study area. Ramp volumes for this interchange total nearly 40,000 vehicles per day and range from 6,700 to 12,100 vpd. The highest volumes occur on the northbound off-ramp and southbound on-ramp. Other interchanges in the study area serve from 16,700 to 18,800 vehicles per day, with individual ramp volumes between 1,400 and 4,900 vpd. Traffic volumes on the intersecting arterial streets range from 2,400 vpd on Upper River Road south of I-95 to 34,400 vpd on PA 332 west of I-95. However, most of the arterial facilities adjacent to I-95 serve volumes between 10,000 and 15,000 vehicles per day. 5
12 6
13 7
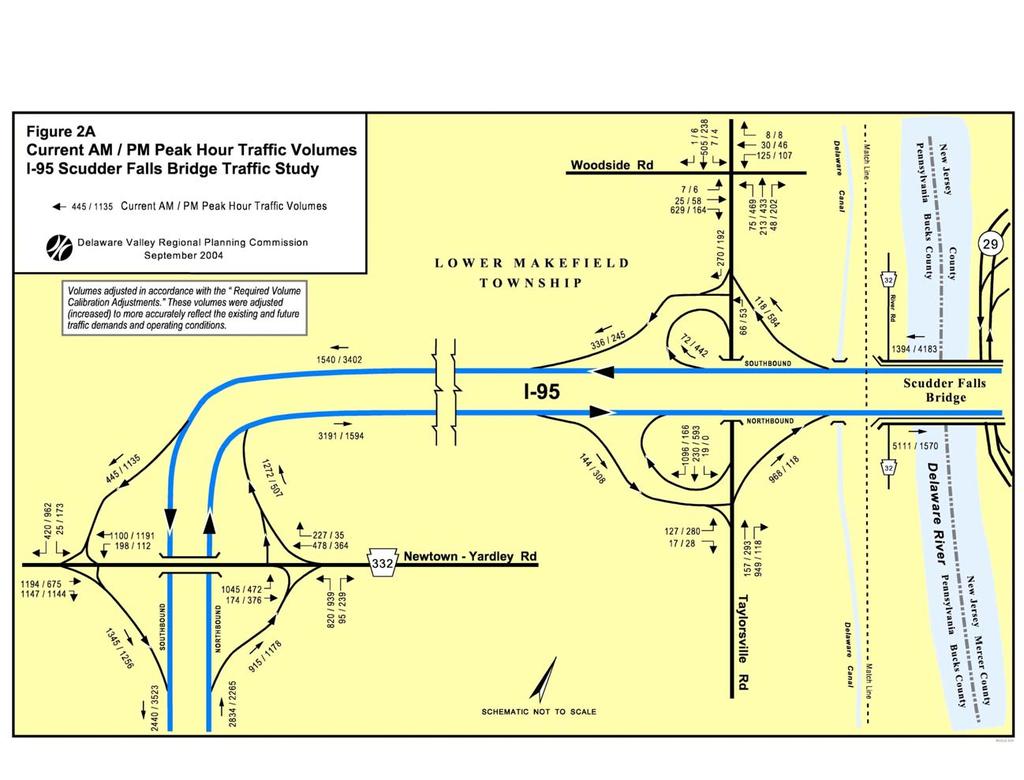
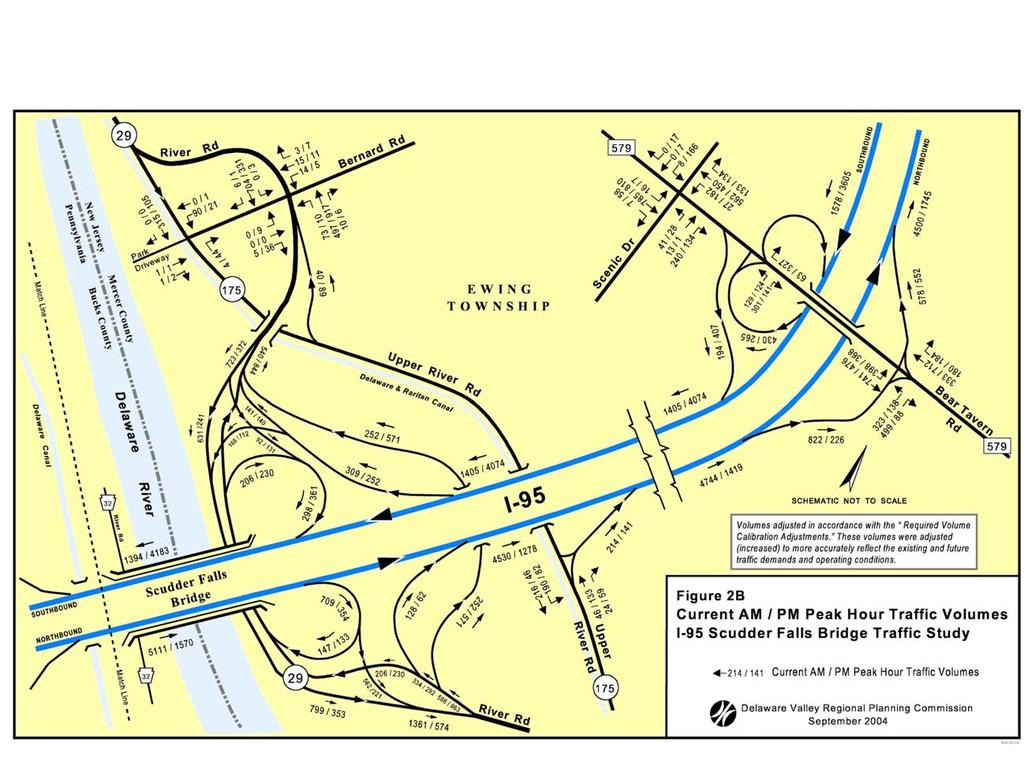
14 AM and PM peak hour traffic volumes were also recorded for the I-95 mainline and interchange ramps. In addition, peak hour turning movements were counted at key intersections within the study area, including the ramp/surface street junctions. These peak hour volumes were also seasonally adjusted to represent average annual conditions. Because peak hour traffic demand on several facilities in the corridor is currently over capacity, additional adjustments were made to the counted volumes so that they were representative of the demand, or the number of vehicles trying to access a given facility, rather than the counted number of vehicles passing that location. These adjustments were based on observations of queue length propagation at those locations where traffic currently operates at breakdown conditions. The adjusted AM and PM peak hour traffic volumes for current conditions are displayed in Figure 2. Peak hour traffic volumes are generally heaviest in the AM peak in the northbound direction. On I-95, AM peak hour volumes increase from 2,834 vehicles per hour (vph) south of the PA 332 interchange, to 3,191 vph between PA 332 and Taylorsville Road, to 5,111 vph on the Scudder Falls Bridge. Northbound AM peak hour volumes in the New Jersey portion of the corridor do not vary as much as those on the Pennsylvania side, and range from 4,500 to 4,744 vehicles per hour. PM peak hour volumes in the northbound direction are significantly lower than those of the morning peak. The highest volume, 2,265 vph, occurs just south of the PA 332 interchange. All other I-95 northbound volumes range from 1,278 to 1,745 vph; 1,570 vehicles cross the Scudder Falls Bridge northbound during the PM peak hour. In the southbound direction, the heaviest volumes occur in the PM peak hour with lighter volumes in the AM peak. Interstate 95 carries 3,605 vehicles in the PM peak hour north of Bear Tavern Road. This volume increases to 4,074 vph between Bear Tavern Road and River Road and peaks at 4,183 vph on the Scudder Falls Bridge. PM peak hour volumes on the Pennsylvania side are 3,402 vehicles between Taylorsville Road and PA 332 and 3,523 vph south of PA 332. During the AM peak hour, southbound volumes are mostly in the 1,400 to 1,500 vph range, expect for I-95 south of PA 332, which carries 2,440 vehicles. The lowest southbound volume during the AM peak is on the Scudder Falls Bridge, with 1,394 vehicles per hour. In the peak direction of travel during both the AM and PM peak hours, traffic volumes on Interstate 95 are generally heavier on the New Jersey side of the river compared to the Pennsylvania side. In the off-peak direction of travel the opposite is true, with the Pennsylvania volumes higher in both AM and PM peaks. 8
15 9
16 10
17 There are six ramps in the corridor that serve peak hour volumes close to, or greater than 1,000 vehicles per hour. All are on the Pennsylvania side. In the AM peak hour, the northbound on- and off-ramps at PA 332, both northbound on-ramps at Taylorsville Road, and the southbound on-ramp from PA 332 carry between 968 and 1,345 vph. In the PM peak hour, the northbound off-ramp to PA 332 and the southbound on- and off-ramps at PA 332 carry between 1,135 and 1,256 vph. The highest hourly arterial volumes occur on Newtown-Yardley Road (PA 332) west of Interstate 95. PA 332 carries 2,341 vph eastbound in the AM peak and 2,153 vehicles westbound in the PM peak hour. Even in the off-peak direction, hourly volumes at this location are 1,819 vehicles eastbound and 1,520 vph westbound. PA 332 serves significantly lower volumes east of its interchange with I-95: in the AM peak hour it carries 269 vehicles eastbound and 705 vehicles westbound, and in the PM peak hour it carries 615 vehicles eastbound and 399 vehicles westbound. Other arterial facilities that carry high traffic volumes during the peak hours include Taylorsville Road, Bear Tavern Road, and River Road. Taylorsville Road carries 1,106 vph and 1,259 vph approaching I-95 in the AM peak hour from the south and north, respectively and 1,104 vph northbound in the PM Peak hour north of I-95. In the southbound direction during the AM peak hour, Bear Tavern Road carries 1,033 vph approaching its interchange with I-95 and 1,240 vph away from I-95. It also carries 1,110 vph approaching I-95 in the PM peak hour, but only 564 vph away from I-95. South of Interstate 95, River Road serves 1,361 vph southbound in the AM peak hour. 11
18 12
19 III. TRAVEL FORECASTING PROCEDURES Regional travel simulation models are used to forecast future travel patterns. They utilize a system of traffic zones that follow Census tract and block group boundaries and rely on demographic and employment data, land use, and transportation network characteristics to simulate trip making patterns throughout the region. Like most interstate highway facilities, the Scudder Falls Bridge serves local, regional, and long distance travelers. Although this traffic study is primarily concerned with the I-95 corridor between PA 332 and Bear Tavern Road, the travel simulation models must consider the traffic generating impacts of a much larger area. The travel models used for this study include the entire nine-county DVRPC region, with special attention focused on lower Bucks County and all of Mercer County. Map 2 displays the focused travel simulation study area. For the Scudder Falls Bridge study, a focused simulation process is employed. A focused simulation process allows the use of DVRPC's regional simulation models but includes a more detailed representation of the study area. Local streets not included in the regional network, but of interest in this study, are added to the highway network. Traffic zones inside the study area are subdivided so that traffic from existing and proposed land use developments may be loaded more precisely on the network. The focusing process increases the accuracy of the travel forecasts within the detailed study area. At the same time, all existing and proposed highways throughout the region, and their impact on both regional and interregional travel patterns, become an integral part of the simulation process. A. Socio-Economic Projections DVRPC's long-range population and employment forecasts are revised periodically to reflect changing market trends, development patterns, local and national economic conditions, and available data. The completed forecasts reflect all reasonably known current information and the best professional judgment of predicted future conditions. The revised forecasts adopted by the DVRPC Board on February 28, 2002 reflect an update to municipal forecasts that were last completed in February DVRPC uses a multi-step, multi-source methodology to produce its population and employment forecasts at the county-level. County forecasts serve as control totals for municipal forecasts, which are disaggregated from county totals. Municipal forecasts are based on an analysis of historical data trends adjusted to account for infrastructure availability, environmental constraints to development, local zoning policy, and development proposals. Municipal forecasts are constrained using density ceilings and floors. County, and where necessary, municipal input is used throughout the process to derive the most likely population and employment forecasts for all geographic levels. 13

20 14 Map 2. Travel Simulation Model Study Area
21 1. Population Forecasting Population forecasting at the regional level involves review and analysis of six major components: births, deaths, domestic in-migration, domestic out-migration, international immigration, and changes in group quarters populations (e.g. dormitories, military barracks, prisons, and nursing homes). DVRPC uses both the cohort survival concept to age individuals from one age group to the next, and a modified Markov transition probability model based on the most recent US Census and the US Census' recent Population Estimates program to determine the flow of individuals between the Delaware Valley and the outside world. For movement within the region, Census and IRS migration data coupled with Population Estimates data are used to determine migration rates between counties. DVRPC relies on county planning offices to provide information on any known, expected, or forecasted changes in group quarters populations. These major population components are then aggregated and the resulting population forecasts are reviewed by member counties for final adjustments based on local knowledge. 2. Employment Forecasting Employment is influenced by local, national, and global political and socio-economic factors. The Bureau of Economic Analysis provides the most complete and consistent time series data on county employment by sector, and serves as DVRPC's primary data source for employment forecasting. Employment sectors include mining, agriculture, construction, manufacturing, transportation, wholesale, retail, finance/insurance, service, government, and military. Other supplemental sources of data include the U.S. Census, Dun & Bradstreet, Bureau of Labor Statistics unemployment insurance covered employment (ES 202), Occupational Privilege Tax data, and other public and private sector forecasts. As in the population forecasts, county level total employment is used as a control total for sector distribution and municipal level forecasts. Forecasts are then reviewed by member counties for final adjustments based on local knowledge. 3. Scudder Falls Bridge Study Area Forecasts As part of the Scudder Falls Bridge traffic study, DVRPC staff reviewed its most recent current population and employment estimates, its 2025 long-range population and employment forecasts, and all proposed land-use developments in the travel model study area shown in Map 2. The magnitude of any population and/or employment growth associated with each proposal was determined and compared to the Board-adopted forecast for each municipality in the study area. Based on this review, DVRPC developed revised 2025 municipal-level population and employment forecasts for use as inputs to the traffic simulation models. Table 1, below, summarizes the population and employment forecasts used for the Scudder Falls Bridge Traffic Study. 15
22 Table 1. Population and Employment in the Scudder Falls Study Area Municipality Bucks County (part) Population Change Employment Change Absolute Percent Absolute Percent Bensalem Township 58,435 61,060 2, % 37,661 40,358 2, % Bristol Borough 9,923 10, % 6,868 7, % Bristol Township 55,521 57,730 2, % 20,718 21, % Falls Township 34,865 35, % 15,509 16, % Hulmeville Borough 895 1, % % Ivyland Borough % 1,368 1, % Langhorne Borough 1,980 1, % 1,166 1, % Langhorne Manor Borough 925 1, % 1,394 2,467 1, % Lower Makefield Township 32,691 42,310 9, % 4,934 7,022 2, % Lower Southampton Township 19,275 22,170 2, % 10,612 10, % Middletown Township 44,140 53,980 9, % 20,884 27,181 6, % Morrisville Borough 10,020 11,190 1, % 4,007 4, % Newtown Borough 2,310 2, % 3,609 3, % Newtown Township 18,206 24,070 5, % 9,295 12,484 3, % Northampton Township 39,384 44,670 5, % 9,611 10,742 1, % Penndel Borough 2,420 2, % 1,149 1, % Tullytown Borough 2,035 2, % 2,039 3,767 1, % Upper Makefield Township 7,180 14,870 7, % 1,521 3,018 1, % Upper Southampton Township 15,765 19,690 3, % 8,075 13,443 5, % Warminster Township 31,383 35,740 4, % 13,546 13, % Wrightstown Township 2,840 4,240 1, % 1,276 1, % Yardly Borough 2,500 2, % 2,105 2, % Bucks County (part) Subtotal 393, ,740 59, % 177, ,012 28, % Mercer County East Windsor Township 24,915 35,150 10, % 9,167 13,775 4, % Ewing Township 35,710 39,020 3, % 28,473 31,996 3, % Hamilton Township 87,109 95,200 8, % 33,104 39,653 6, % Hightstown Borough 5,215 5, % 3,318 3, % Hopewell Borough 2,035 2, % 698 1, % Hopewell Township 16,105 23,050 6, % 8,025 29,086 21, % Lawrence Township 29,160 41,010 11, % 25,419 30,745 5, % Pennington Borough 2,695 2, % 1,158 2,549 1, % Princeton Borough 14,200 14, % 15,864 17,968 2, % Princeton Township 16,025 17,530 1, % 11,824 16,739 4, % Trenton City 85,403 89,049 3, % 58,566 60,169 1, % Washington Township 10,275 15,791 5, % 3,604 11,750 8, % West Windsor Township 21,905 29,780 7, % 21,695 43,189 21, % Mercer County Subtotal Study Area Total 350, ,186 59, % 220, ,820 81, % 743, , , % 398, , , % 16
23 In 2000, there were about 744,000 residents and 398,000 jobs within the Mercer County and lower Bucks County study area. Strong growth in both population and employment is forecast for this area. By 2025, the study area is expected to add 119,000 new residents and 118,000 additional jobs, increases of 16 and 28 percent, respectively. This growth is not concentrated in one or two municipalities, but rather spread throughout the study area. In the Bucks County portion, large growth in both population and employment occurs in Upper and Lower Makefield, Middletown, Newtown, and Upper Southampton townships. In the Mercer County portion, East and West Windsor, Hamilton, Hopewell, and Lawrence townships also experience significant increases in both residents and jobs. Both Hopewell and West Windsor townships are forecast to add over 20,000 jobs between 2000 and Although growth in Lower Makefield, Middletown, Ewing, and Lawrence townships has the most direct impact on traffic volumes in the Scudder Falls Bridge corridor, very large growth in surrounding municipalities attracts trips from a large area and affects I-95 and Scudder Falls Bridge traffic demand. For example, Hopewell Township is home to several large corporate employers, including Bristol Myers Squibb, Merrill Lynch, and Janssen Pharmaceutica, each of which is planning for, or pursuing, significant expansions of office and research space. Together these facilities represent several million square feet of new construction. B. DVRPC s Travel Simulation Models DVRPC's travel models follow the traditional steps of trip generation, trip distribution, modal split, and traffic assignment. However, an iterative feedback loop is employed from traffic assignment to the trip distribution step. The feedback loop ensures that the congestion levels used by the models when determining trip origins and destinations are equivalent to those that result from the traffic assignment step. Additionally, the iterative model structure allows trip making patterns to change in response to changes in traffic patterns, congestion levels, and improvements to the transportation system. The DVRPC travel simulation process uses the Evans Algorithm to iterate the model. Evans re-executes the trip distribution and modal split models based on updated highway speeds after each iteration of highway assignment and assigns a weight (8) to each iteration. This weight is then used to prepare a convex combination of the link volumes and trip tables for the current iteration and a running weighted average of the previous iterations. This algorithm converges rapidly to the equilibrium solution on highway travel speeds and congestion levels. About seven iterations are required for the process to converge to the equilibrium state for Scudder Falls Bridge travel patterns. After equilibrium is achieved, the weighted average transit trip tables are assigned to the transit networks to produce link and route passenger volumes. 17
24 1. Separate Peak, Midday, and Evening Models The DVRPC travel simulation models are disaggregated into separate peak, midday, and evening time periods. This disaggregation begins in trip generation where factors are used to separate daily trips into time-period specific travel. The enhanced process then utilizes completely separate model chains for peak, midday, and evening travel simulation runs. Time of day sensitive inputs to the models such as highway capacities and transit service levels are disaggregated to be reflective of time-period specific conditions. Capacity factors are used to allocate daily highway capacity to each time period. Separate transit networks were required to represent the difference in transit service. The enhanced model is disaggregated into separate model chains for the peak (combined AM and PM), midday (the period between the AM and PM peaks), and evening (the remainder of the day) periods for the trip distribution, modal split, and travel assignment phases of the process. The peak period is defined as 7:00 AM to 9:00 AM and 3:00 PM to 6:00 PM. Peak period and midday travel are based on a series of factors which determine the percentage of daily trips that occur during those periods. Evening travel is then defined as the residual after peak and midday travel are removed from daily travel. External-local productions at the nine-county cordon stations are disaggregated into peak, midday, and evening components using percentages derived from the temporal distribution of traffic counts taken at each cordon station. 2. The Model Chain The first step in the process involves generating the number of trips that are produced by and destined for each traffic zone and cordon station throughout the nine-county region Origin-destination patterns are then established and trips are proportioned between highway and transit modes. Finally, the most appropriate route for each trip is determined, and traffic volumes are assigned to individual facilities. Figure 3, below, displays a flowchart of the travel simulation modeling process. Trip Generation. Both internal trips (those made within the DVRPC region) and external trips (those which cross the boundary of the region) must be considered in the simulation of regional travel. For the simulation of current and future travel demand, internal trip generation is based on zonal forecasts of population and employment, whereas external trips are extrapolated from cordon line traffic counts and other sources. The latter also include trips which pass through the Delaware Valley region. Estimates of internal trip productions and attractions by zone are established on the basis of trip rates applied to the zonal estimates of demographic and employment data. This part of the DVRPC model is not iterated on highway travel speed. Rather, estimates of daily trip making by traffic zone are calculated and then disaggregated into peak, midday, and evening time periods. 18
25 Figure 3. DVRPC s Travel Simulation Modeling Process 19
26 Evans Iterations. The iterative portion of the Evans forecasting process involves updating the highway network restrained link travel speeds, rebuilding the minimum time paths through the network, and skimming the interzonal travel time for the minimum paths. Then the trip distribution, modal split, and highway assignment models are executed in sequence for each pass through the model chain. After convergence is reached, the transit trip tables for each iteration are weighted together and the weighted average table is assigned to the transit network. The highway trip tables are loaded onto the network during each Evans iteration. For each time period, seven iterations of the Evans process are performed to ensure that convergence on travel times is reached. Trip Distribution. Trip distribution is the process whereby the zonal trip ends established in the trip generation analysis are linked together to form origin-destination patterns in trip table format. Peak, midday, and evening trip ends are distributed separately. For each Evans iteration, a series of seven gravity-type distribution models are applied at the zonal level. These models follow trip purpose and vehicle type stratifications established in trip generation. Modal Split. The modal split model is also run separately for the peak, midday, and evening time periods. The modal split model calculates the fraction of each person-trip interchange in the trip table which should be allocated to transit, and then assigns the residual to the highway side. The choice between highway and transit usage is made on the basis of comparative cost, travel time, and frequency of service, with other aspects of modal choice being used to modify this basic relationship. In general, the better the transit service, the higher the fraction assigned to transit, although trip purpose and auto ownership also affect the allocation. The model subdivides highway trips into auto drivers and passengers. Auto driver trips are added to the truck, taxi, and external vehicle trips in preparation for assignment to the highway network. Highway Assignment. For highway trips, the final step in the focused simulation process is the assignment of current or future vehicle trips to the highway network representative of the appropriate scenario. For peak, midday, and evening travel, the assignment model produces the future traffic volumes for individual highway links that are required for the evaluation of the alternatives. The regional nature of the highway network and trip table underlying the focused assignment process allow the diversion of travel into and through the study area to various points of entry and exit in response to the improvements made in the transportation system. For each Evans iteration, highway trips are assigned to the network representative of a given alternative by determining the best (minimum time) route through the highway network for each zonal interchange and then allocating the interzonal highway travel to the highway facilities along that route. This assignment model is "capacity restrained" in that 20
27 congestion levels are considered when determining the best route. The Evans equilibrium assignment method is used to implement the capacity constraint. When the assignment and associated trip table reach equilibrium, no path faster than the one actually assigned can be found through the network, given the capacity restrained travel times on each link. Transit Assignment. After equilibrium is achieved, the weighted average transit trip tables (using the 8s calculated from the overall Evans process as weights) are assigned to the transit network to produce link and route passenger volumes. The transit person trips produced by the modal split model are "linked" in that they do not include any transfers that occur either between transit trips or between auto approaches and transit lines. The transit assignment procedure accomplishes two major tasks. First, the transit trips are "unlinked" to include transfers, and second, the unlinked transit trips are associated with specific transit facilities to produce link, line, and station volumes. These tasks are accomplished simultaneously within the transit assignment model, which assigns the transit trip matrix to the minimum impedance paths built through the transit network. There is no capacity restraining procedure in the transit assignment model. C. Improvement Alternatives Separate model runs are preformed for each future-year alternative to be tested. For this study, DRJTBC requested that DVRPC prepare traffic forecasts for a No-Build and a Build alternative. The No-Build alternative provides a useful future-year reference against which any impacts associated with the Build Alternative may be compared and quantified. The traffic forecasts and analysis are presented in Chapter IV. 1. The No-Build Alternative Under the No-Build Alternative, no operational improvements to the Scudder Falls Bridge or its Interstate 95 approaches are considered. The No-Build Alternative does, however, assume the implementation of various planned improvements to other regional facilities. Generally, the facility improvements coded into the travel simulation model networks are projects included in DVRPC s Transportation Improvement Programs (TIP) for Pennsylvania and New Jersey and its Long Range Transportation Plan. Examples of significant projects that impact the Scudder Falls Bridge corridor include an additional onramp from PA 332 (Newtown - Yardley Road) to I-95 northbound, a new interchange between I-95 and the Pennsylvania Turnpike (I-276) and associated Turnpike widening, and new rail service between West Trenton and Newark, New Jersey. 21
28 2. The Build Alternative The Build Alternative also assumes construction of all TIP and Long Range Plan projects in the region. Additionally, the following proposed improvements to the Scudder Falls Bridge and its I-95 approaches are included: Widening I-95 to three lanes per direction between the PA 332 and NJ 29 (River Road) interchanges, including a third through lane between the northbound onramps from NJ 29 and NJ 175 (Upper River Road); Consolidating the two northbound on-ramps from Taylorsville Road into a single on-ramp, and consolidating the two southbound off-ramps to Taylorsville Road into a single off-ramp; both consolidated ramps are loop ramps with signalized T-Intersections on the western side of Taylorsville Road; Providing auxiliary lanes on the Scudder Falls Bridge connecting the northbound on-ramp from Taylorsville Road to the northbound off-ramp to NJ 29, and connecting the southbound on-ramp from NJ 29 to the southbound off-ramp to Taylorsville Road; and Providing a two-lane on-ramp from Taylorsville Road to I-95 northbound with a lane-drop before reaching the northbound auxiliary lane. This Build Alternative specification is intended to allow DRJTBC and their consultants to evaluate its ability to improve safety and alleviate congestion in the corridor. Further refinements may result from the impacts associated with the traffic forecasts presented in this technical memo, or other environmental impacts such as air quality, noise quality, or construction impacts on local communities. 22
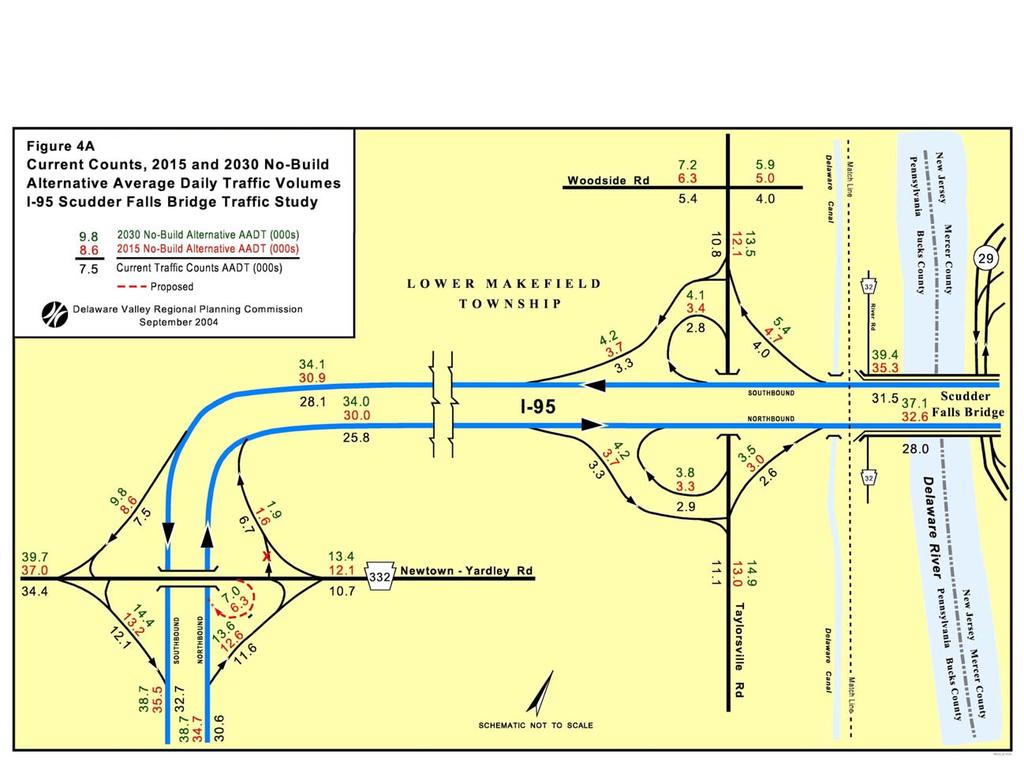
29 IV. PROJECTED TRAFFIC VOLUMES Projected daily and peak hour traffic volumes for selected highway facilities within the corridor are presented and analyzed in this chapter. Forecasts for two future years are presented: a design year of 2030 and an interim year of Following standard practice, the design year is taken to be twenty years beyond the anticipated opening year (2010). Because DVRPC s Long Range Plan has an horizon year of 2025, design year forecasts are extrapolated from current and 2025 model runs. Interim year traffic forecasts are prepared by interpolating between a current, calibration run and the 2025 runs. While the interim year forecasts provide a reference to gauge traffic volume changes over time and can be useful in developing traffic plans during construction, the analysis presented in this chapter is primarily focused on the design year traffic volumes and their associated impacts in the corridor. A. No-Build Alternative Traffic Forecasts Average annual daily traffic forecasts (AADT) under the No-Build Alternative are provided in Figure 4. In the figure, current average daily traffic volumes are shown in black, underneath the lines representing the highway links. No-Build volumes for 2015 are shown in red, above the highway links, and above those are the 2030 volumes, shown in green. Table 2 also lists these traffic volumes along with comparisons between current and future conditions. The continued growth in land-use developments in Bucks and Mercer counties results in significantly higher traffic volumes compared to the present day. By 2030 under the No-Build Alternative, traffic volumes along I-95 increase by 14,093 to 19,423 vehicles per day (vpd) throughout the corridor, with the largest increases in the New Jersey portion of the study area. These increases range from 22.3 to 33.8 percent above current volumes. The average daily traffic volume on the Scudder Falls Bridge increases by 28.6 percent, or 17,025 vpd, to 76,500 vpd. Although the largest increases in traffic occur on the New Jersey side of the river, the highest daily volume in the corridor, 77,400 vpd, continues to occur south of PA 332. The traffic volume increases on the ramps to and from I-95 range from 534 to 2,259 vpd, representing growth of 11.4 to 67.6 percent. At the PA 332 interchange in 2030, the new northbound on-ramp from PA 332 eastbound carries 7,000 vpd, which the volume on the existing northbound on-ramp to I-95 (which serves only traffic from PA 332 westbound in the future), is reduced to 1,900 vpd. The arterial streets that have an interchange with I-95 also experience significant traffic volume increases by 2030 under the No-Build Alternative. These increases range from 1,570 vpd on Upper River Road south of I-95 to 5,316 vpd on PA 332 west of I
30 24
31 25
32 26 Facility Interstate 95 Mainline Table 2. Comparison of Current and No-Build Alternative Daily Traffic Volumes Current No-Build Current to 2015 Change No-Build Current to 2030 Change Limits Volume AADT Difference Percent AADT Difference Percent I-95 US 1 to PA 332 (Newtown-Yardley Rd) 63,307 70,200 6, % 77,400 14, % I-95 PA 332 (Newtown-Yardley Rd) to Taylorsville Rd 53,827 60,900 7, % 68,100 14, % Scudder Falls Bridge Taylorsville Rd to NJ 29 (River Rd) 59,475 67,900 8, % 76,500 17, % I-95 NJ 175 (Upper River Rd) to CR 579 (Bear Tavern Rd) 57,030 66,400 9, % 76,000 18, % I-95 CR 579 (Bear Tavern Rd) to CR 611 (Scotch Rd) 57,477 67,100 9, % 76,900 19, % Interstate 95 Ramps Northbound Off-Ramp I-95 to PA 332 (Newtown-Yardley Rd) 11,606 12, % 13,600 1, % Northbound On-Ramp(s) PA 332 (Newtown-Yardley Rd) to I-95 6,720 7,900 1, % 8,900 2, % Southbound On-Ramp PA 332 (Newtown-Yardley Rd) to I-95 12,141 13,200 1, % 14,400 2, % Southbound Off-Ramp I-95 to PA 332 (Newtown-Yardley Rd) 7,547 8,600 1, % 9,800 2, % Northbound Off-Ramp I-95 to Taylorsville Rd 3,260 3, % 4, % Northbound On-Ramp Taylorsville Rd Southbound to I-95 2,914 3, % 3, % Northbound On-Ramp Taylorsville Rd Northbound to I-95 2,549 3, % 3, % Southbound On-Ramp Taylorsville Rd to I-95 3,321 3, % 4, % Southbound Off-Ramp I-95 to Taylorsville Rd Southbound 2,775 3, % 4,100 1, % Southbound Off-Ramp I-95 to Taylorsville Rd Northbound 3,991 4, % 5,400 1, % Northbound Off-Ramp I-95 to NJ 29 (River Rd) 4,857 5, % 5, % Northbound On-Ramp NJ 29 (River Rd) to I-95 1,372 1, % 2, % Northbound On-Ramp NJ 175 (North River Rd) to I-95 1,883 2, % 2,900 1, % Southbound On-Ramp NJ 29 (River Rd) to I-95 4,666 4, % 5, % Southbound Off-Ramp I-95 to NJ 29 (River Rd) 3,823 4, % 5,000 1, % Northbound Off-Ramp I-95 to CR 579 (Bear Tavern Rd) 3,795 4, % 4,800 1, % Northbound On-Ramp CR 579 (Bear Tavern Rd) to I-95 4,753 5, % 6,300 1, % Southbound On-Ramp CR 579 (Bear Tavern Rd) Southbound to I-95 2,359 2, % 3, % Southbound Off-Ramp I-95 to CR 579 (Bear Tavern Rd) 3,860 4, % 5,300 1, % Southbound On-Ramp CR 579 (Bear Tavern Rd) Northbound to I-95 2,012 2, % 2, % Crossing Streets & Local Roads PA 332 (Newtown-Yardley Rd) West of I-95 Interchange 34,384 37,000 2, % 39,700 5, % PA 332 (Newtown-Yardley Rd) East of I-95 Interchange 10,719 12,100 1, % 13,400 2, % Taylorsville Road North of I-95 Interchange 10,799 12,100 1, % 13,500 2, % Taylorsville Road South of I-95 Interchange 11,113 13,000 1, % 14,900 3, % Woodside Road West of Taylorsville Road 5,400 6, % 7,200 1, % Woodside Road East of Taylorsville Road 4,000 5,000 1, % 5,900 1, % NJ 29 (River Road) North of I-95 Interchange 13,647 15,600 1, % 17,500 3, % NJ 175 (Upper River Rd) North of I-95 Interchange 3,600 4,900 1, % 6,300 2, % NJ 175 (Upper River Rd) South of I-95 Interchange 2,430 3, % 4,000 1, % CR 579 (Bear Tavern Rd) North of I-95 Interchange 9,944 11,700 1, % 13,400 3, % CR 579 (Bear Tavern Rd) South of I-95 Interchange 14,626 16,100 1, % 17,600 2, % Scenic Drive NJ 29 (River Rd) to CR 579 (Bear Tavern Rd) 4,300 4, % 5,400 1, %
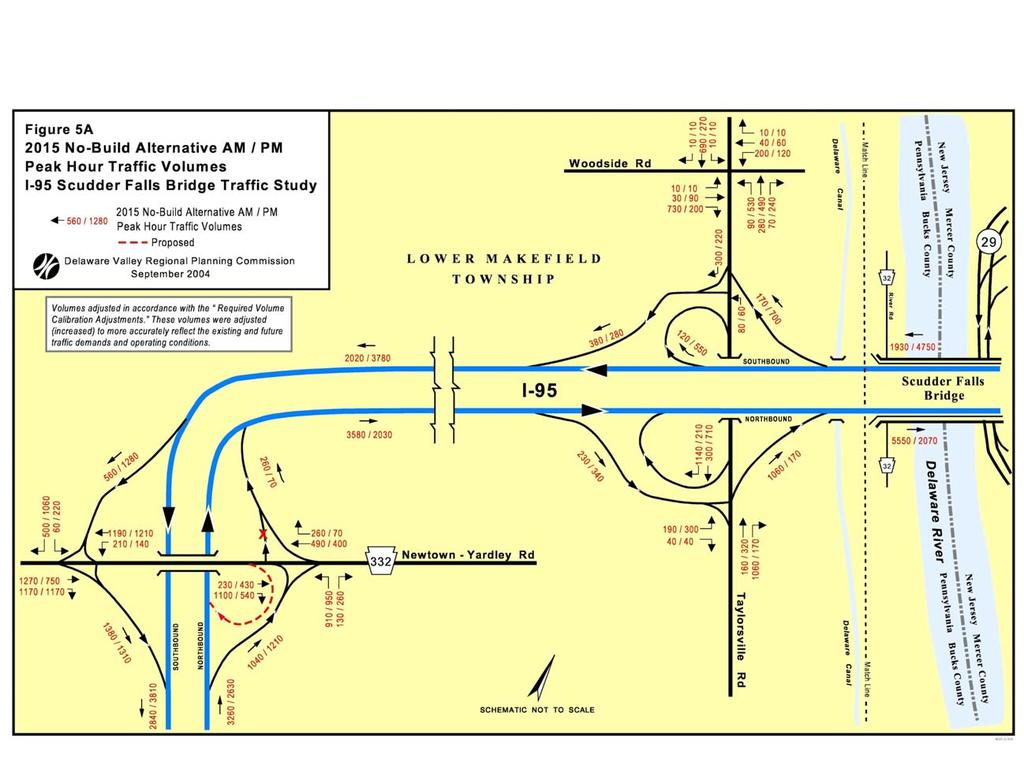
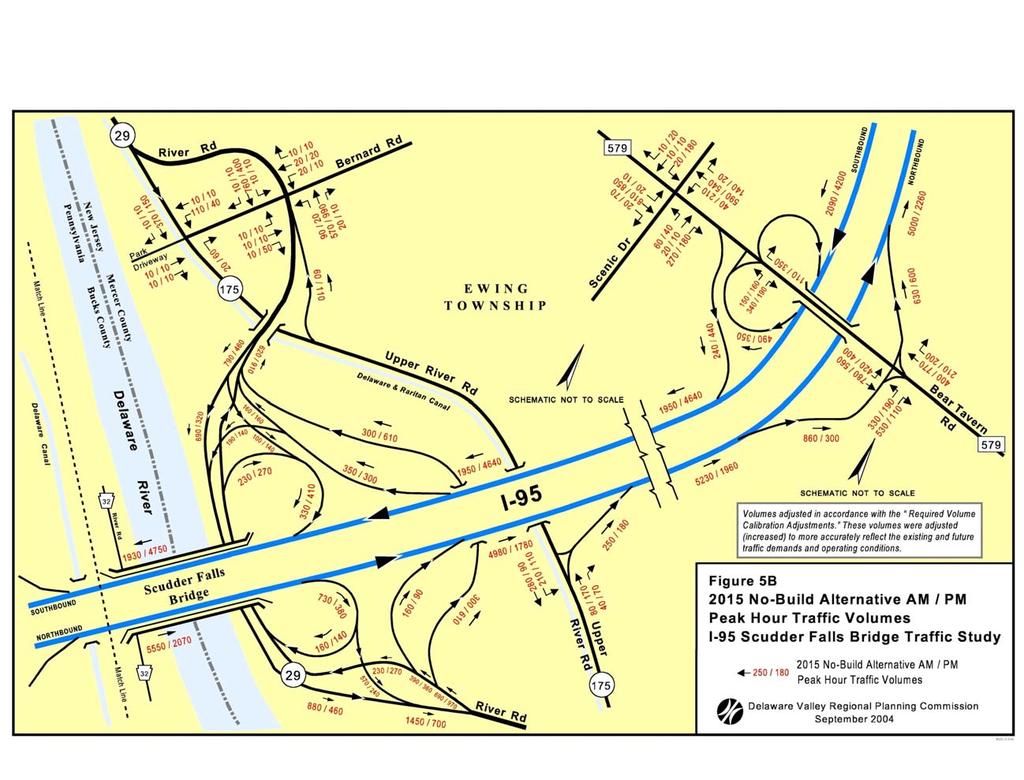
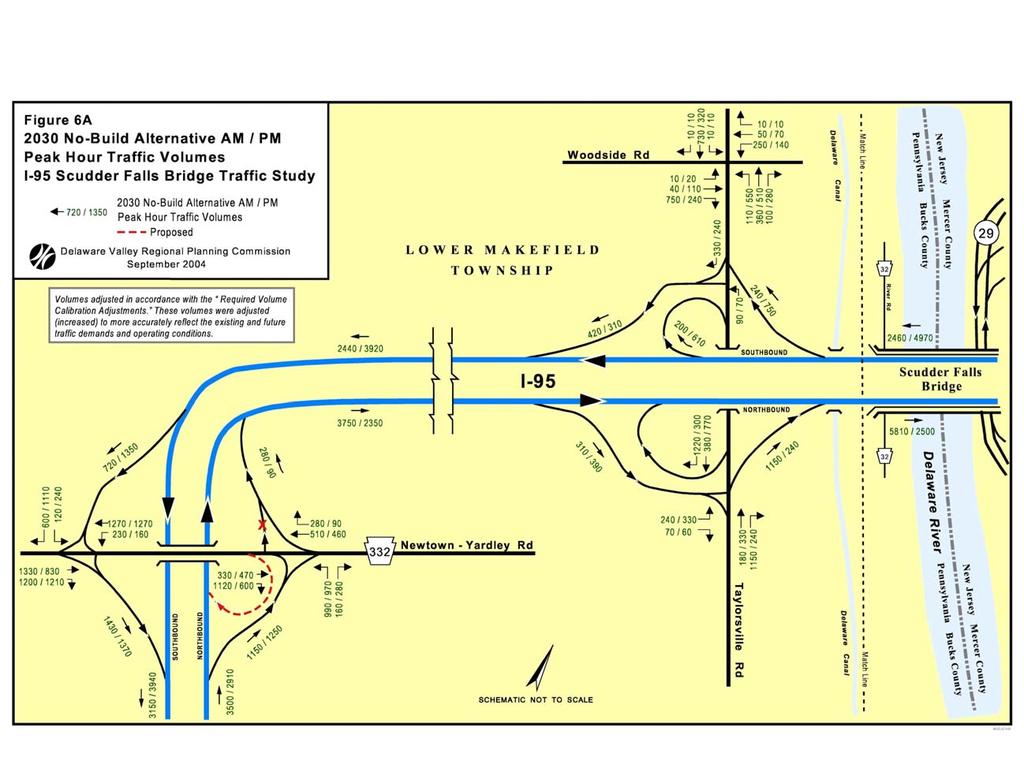
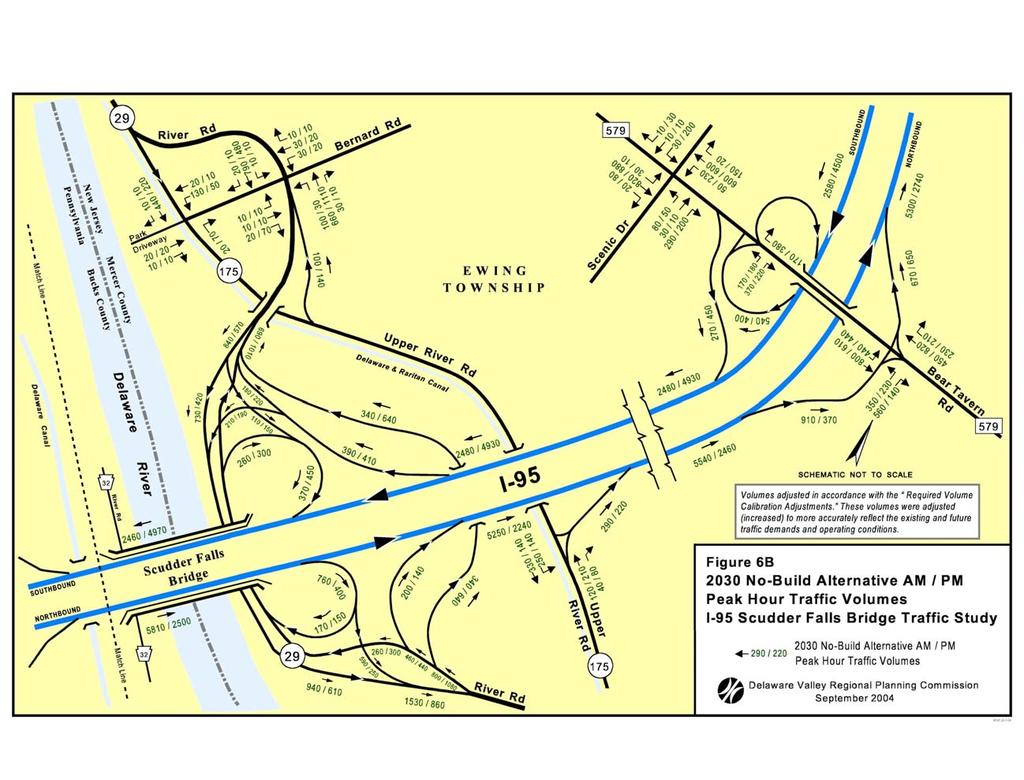
33 As can be seen in Table 2, approximately half of the increase in traffic between current and 2030 conditions occurs by For example, in 2015 the Scudder Falls Bridge is forecast to carry 67,900 vpd, or 8,400 more than currently. Between 2015 and 2030 its daily volume increases by an additional 8,600 vehicles. Similar relationships exist for most other facilities in the study corridor. Figures 5 and 6 display AM and PM peak hour volumes, including intersection turning movements under the No-Build Alternative for 2015 and 2030, respectively. The future year peak hour volumes included in this chapter are analogous to the current peak hour volumes shown in Figure 2, in that they represent peak hour demand volumes at a given location and may be greater than the hourly capacity at that location, leading to stop-andgo driving conditions and propagating traffic backups. The future year peak hour traffic volumes follow the general trends of current peak hour volumes. That is, they are heaviest in the northbound direction in the AM peak and heaviest in the southbound direction in the PM peak hour. Also, in the peak directions, the highest hourly volumes in the corridor occur on the Scudder Falls Bridge, itself. In the morning peak, the Bridge volume increases from a current volume of 5,111 vph to 5,550 vph in 2015 and to 5,810 vph by The peak hour volumes tend to increase at a slower rate in the peak direction of travel compared to the daily traffic volumes, and increase at a faster rate in the off-peak direction of travel. The growth rates in the peak direction are inhibited because worsening congestion levels tend to spread trips into the shoulders of the peak and other off-peak hours. Increasing volumes in the off-peak direction of travel during the peak hours are partly driven by a growing trend towards reverse commuting, as suburban employment is increasing at a faster rate than that of urban areas. By 2030, Interstate 95 AM peak hour volumes in the peak direction (northbound) are 3,500 vph south of the PA 332 interchange, 3,750 vph between PA 332 and Taylorsville Road, and 5,810 vph on the Scudder Falls Bridge. Northbound AM peak hour volumes in the New Jersey portion of the corridor range from 5,250 to 5,540 vehicles per hour. In the southbound direction during the PM peak hour, I-95 carries 4,500 vehicles north of Bear Tavern Road. This volume increases to 4,930 vph between Bear Tavern Road and NJ 29 and peaks at 4,970 vph on the Scudder Falls Bridge. In 2030, PM peak hour volumes on the Pennsylvania side are 3,920 vehicles between Taylorsville Road and PA 332 and 3,940 vph south of PA 332. Like the current traffic counts, the largest peak hour ramp volumes in 2015 and 2030 tend to occur at the PA 332 / I-95 interchange. The highest arterial volumes also occur on PA 332 west of I-95 and on Taylorsville Road north of its interchange with I
34 28
35 29
36 30
37 31
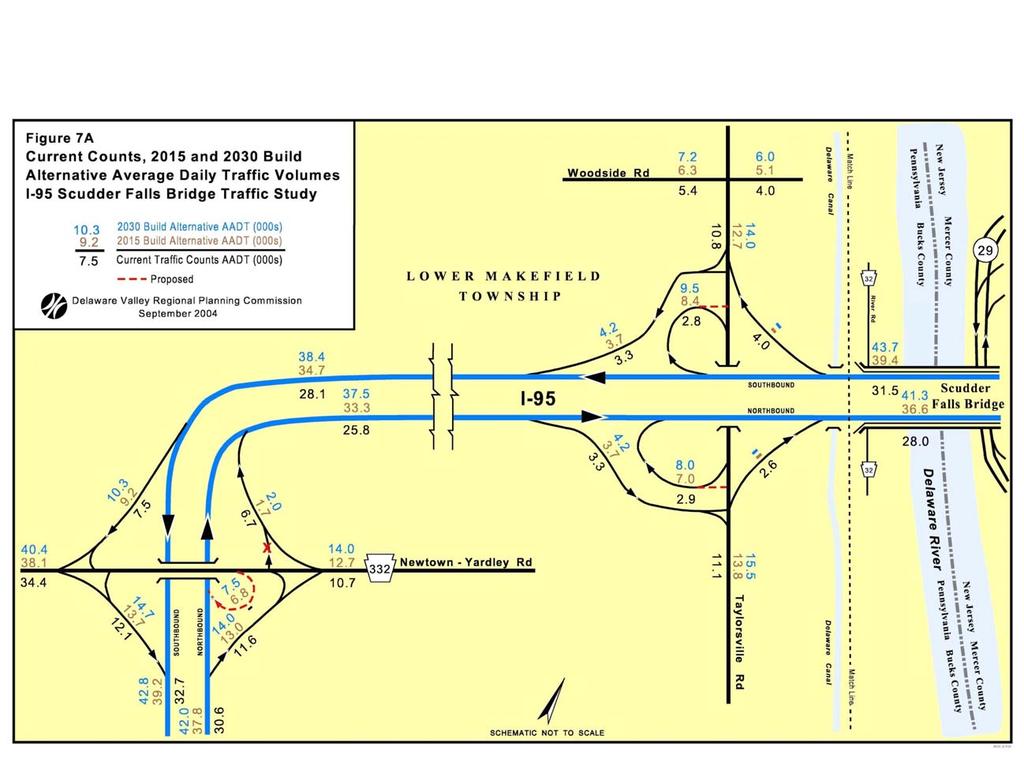
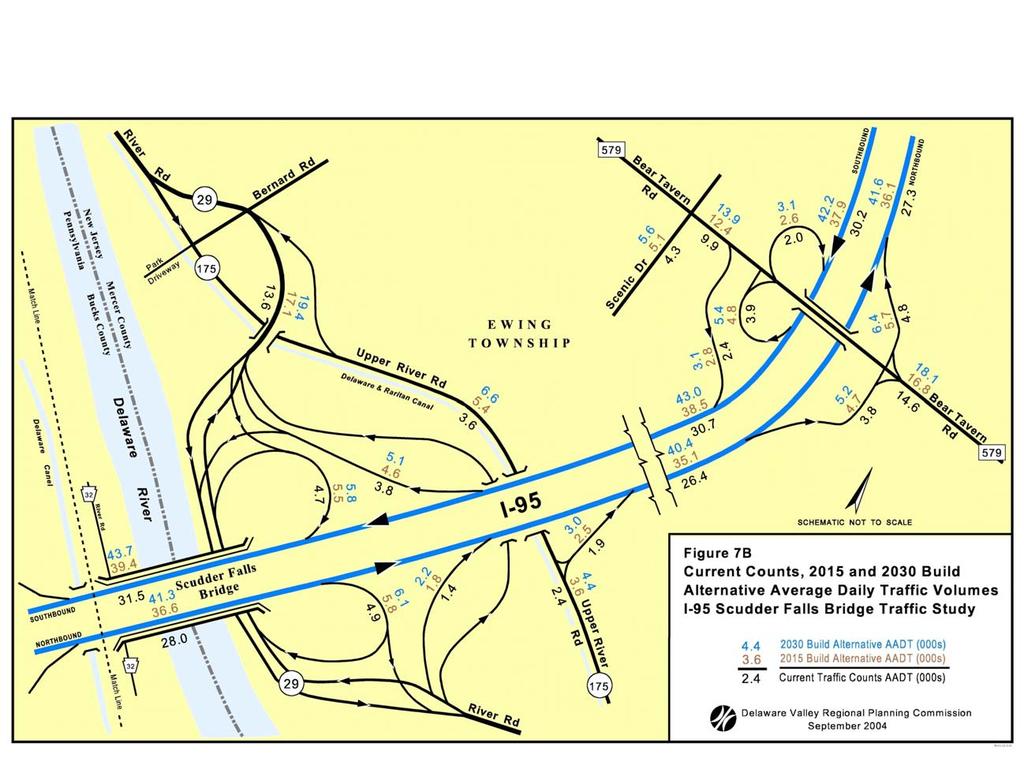
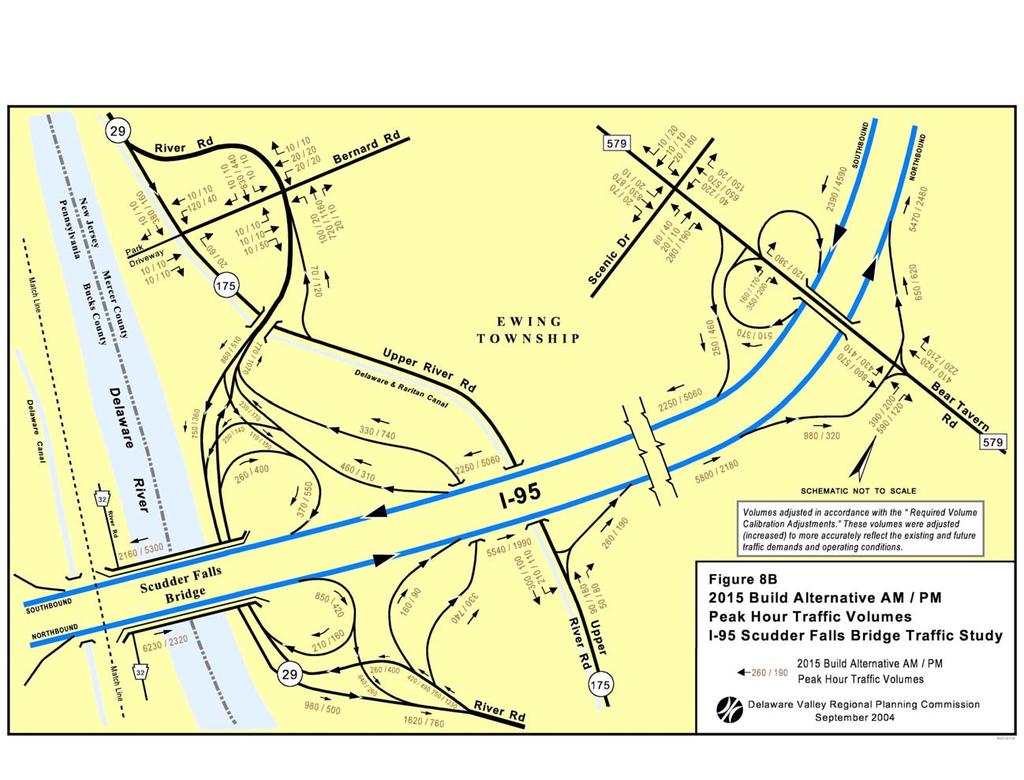
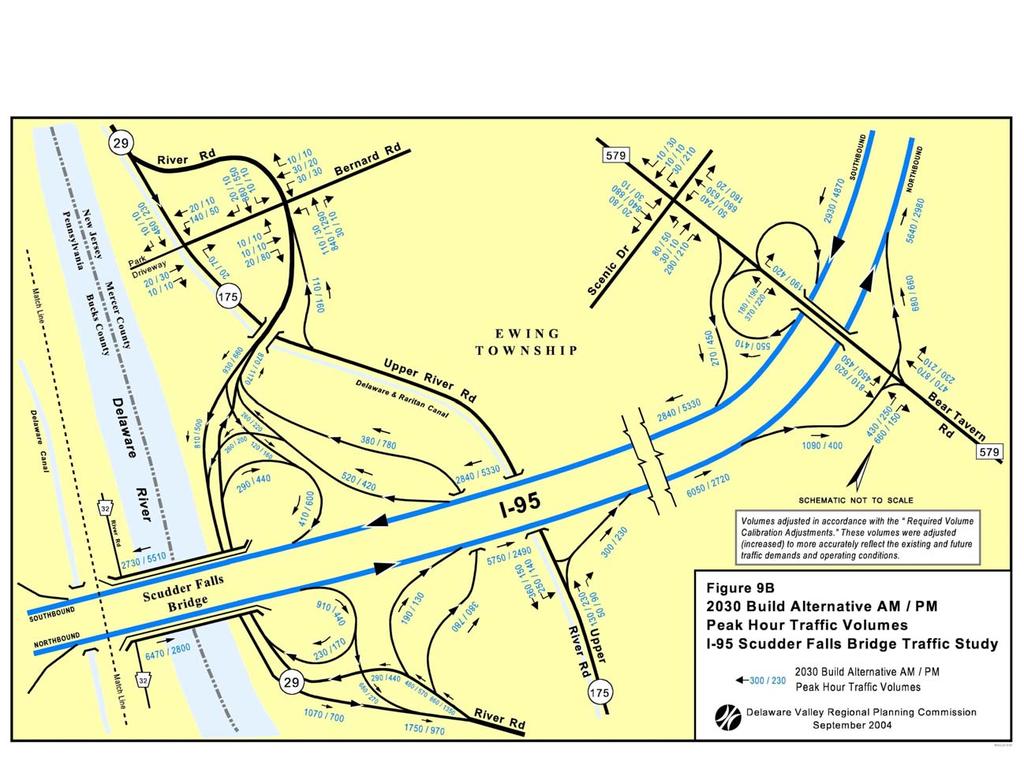
38 B. Build Alternative Traffic Forecasts Average annual daily traffic forecasts under the Build Alternative are provided in Figure 7. Figure 7 follows the same conventions as Figure 4, which displays the No-Build daily forecasts. In Figure 7, current average daily traffic volumes are shown in black, underneath the lines representing the highway links. Build volumes for 2015 are shown in brown, above the highway links, and above those are the 2030 volumes, shown in blue. Table 3 also lists these traffic volumes along with comparisons between No-Build and Build conditions for 2015 and Adding highway capacity to a given facility tends to reduce the travel time for trips served by that facility, which in turn increases the demand for travel on that facility. This increase in demand is due to both diversion of trips from other routes and modes (if there is competing transit service), and also an overall increase in the demand for travel between origin-destination pairs served by that facility. In the Scudder Falls Bridge corridor, most of the increase in traffic between the No-Build and Build alternatives is due to diversion from other routes served by the adjacent bridges between Bucks and Mercer county. The additional capacity, and corresponding reduction in congestion, increases the attractiveness of the Scudder Falls Bridge relative to the other river crossing facilities. A small portion of the Build / No-Build difference is due to new demand that results from the additional cross-river capacity provided under the Build Alternative. The new cross-river demand represents trips that do not cross the river under the No-Build Alternative, but do so under the Build Alternative. The origin-destination patterns of these trips change in response to the overall increase in river crossing capacity and corresponding decrease in congestion levels. By 2030 under the Build Alternative, traffic volumes along the I-95 corridor range from 75,900 vehicles per day between PA 332 and Taylorsville Road to 85,000 vpd on the Scudder Falls Bridge. These volumes are between 6,900 and 8,500 vpd higher than the corresponding volumes under the No-Build Alternative. In percentage terms, the difference between No-Build and Build volumes in the Interstate 95 corridor range from 9.0 to 11.5 percent. At the Taylorsville Road interchange, the single southbound off-ramp carries 9,500 vpd, which is the same volume carried by the two southbound off-ramps of the No-Build Alternative. The northbound on-ramp carries 8,000 vpd, or 700 vpd more than total of the two No-Build Alternative on-ramps. In 2030, most other ramps in the study area carry between 100 and 600 vpd more than their corresponding ramps of the No-Build Alternative. 32
39 33
40 34
41 35 Facility Interstate 95 Mainline Table 3. Comparison of No-Build and Build Alternative Daily Traffic Volumes Current 2015 AADTs Build / No-Build 2030 AADTs Build / No-Build Limits Volume No-Build Build Difference Percent No-Build Build Difference Percent I-95 US 1 to PA 332 (Newtown-Yardley Rd) 63,307 70,200 77,000 6, % 77,400 84,800 7, % I-95 PA 332 (Newtown-Yardley Rd) to Taylorsville Rd 53,827 60,900 68,000 7, % 68,100 75,900 7, % Scudder Falls Bridge Taylorsville Rd to NJ 29 (River Rd) 59,475 67,900 76,000 8, % 76,500 85,000 8, % I-95 NJ 175 (Upper River Rd) to CR 579 (Bear Tavern Rd) 57,030 66,400 73,600 7, % 76,000 83,400 7, % I-95 CR 579 (Bear Tavern Rd) to CR 611 (Scotch Rd) 57,477 67,100 74,000 6, % 76,900 83,800 6, % Interstate 95 Ramps Northbound Off-Ramp I-95 to PA 332 (Newtown-Yardley Rd) 11,606 12,600 13, % 13,600 14, % Northbound On-Ramp(s) PA 332 (Newtown-Yardley Rd) to I-95 6,720 7,900 8, % 8,900 9, % Southbound On-Ramp PA 332 (Newtown-Yardley Rd) to I-95 12,141 13,200 13, % 14,400 14, % Southbound Off-Ramp I-95 to PA 332 (Newtown-Yardley Rd) 7,547 8,600 9, % 9,800 10, % Northbound Off-Ramp I-95 to Taylorsville Rd 3,260 3,700 3, % 4,200 4, % Northbound On-Ramp Taylorsville Rd Southbound to I-95 2,914 3,300 3,800 7, % Northbound On-Ramp Taylorsville Rd Northbound to I-95 2,549 3,000 3,500 8, % Southbound On-Ramp Taylorsville Rd to I-95 3,321 3,700 3, % 4,200 4, % Southbound Off-Ramp I-95 to Taylorsville Rd Southbound 2,775 3,400 4,100 8, % Southbound Off-Ramp I-95 to Taylorsville Rd Northbound 3,991 4,700 5,400 9, % Northbound Off-Ramp I-95 to NJ 29 (River Rd) 4,857 5,200 5, % 5,500 6, % Northbound On-Ramp NJ 29 (River Rd) to I-95 1,372 1,800 1, % 2,300 2, % Northbound On-Ramp NJ 175 (North River Rd) to I-95 1,883 2,400 2, % 2,900 3, % Southbound On-Ramp NJ 29 (River Rd) to I-95 4,666 4,900 5, % 5,200 5, % Southbound Off-Ramp I-95 to NJ 29 (River Rd) 3,823 4,400 4, % 5,000 5, % Northbound Off-Ramp I-95 to CR 579 (Bear Tavern Rd) 3,795 4,300 4, % 4,800 5, % Northbound On-Ramp CR 579 (Bear Tavern Rd) to I-95 4,753 5,500 5, % 6,300 6, % Southbound On-Ramp CR 579 (Bear Tavern Rd) Southbound to I-95 2,359 2,700 2, % 3,100 3, % Southbound Off-Ramp I-95 to CR 579 (Bear Tavern Rd) 3,860 4,600 4, % 5,300 5, % Southbound On-Ramp CR 579 (Bear Tavern Rd) Northbound to I-95 2,012 2,400 2, % 2,800 3, % Crossing Streets & Local Roads PA 332 (Newtown-Yardley Rd) West of I-95 Interchange 34,384 37,000 38,100 1, % 39,700 40, % PA 332 (Newtown-Yardley Rd) East of I-95 Interchange 10,719 12,100 12, % 13,400 14, % Taylorsville Road North of I-95 Interchange 10,799 12,100 12, % 13,500 14, % Taylorsville Road South of I-95 Interchange 11,113 13,000 13, % 14,900 15, % Woodside Road West of Taylorsville Road 5,400 6,300 6, % 7,200 7, % Woodside Road East of Taylorsville Road 4,000 5,000 5, % 5,900 6, % NJ 29 (River Road) North of I-95 Interchange 13,647 15,600 17,300 1, % 17,500 19,400 1, % NJ 175 (Upper River Rd) North of I-95 Interchange 3,600 4,900 5, % 6,300 6, % NJ 175 (Upper River Rd) South of I-95 Interchange 2,430 3,200 3, % 4,000 4, % CR 579 (Bear Tavern Rd) North of I-95 Interchange 9,944 11,700 12, % 13,400 13, % CR 579 (Bear Tavern Rd) South of I-95 Interchange 14,626 16,100 16, % 17,600 18, % Scenic Drive NJ 29 (River Rd) to CR 579 (Bear Tavern Rd) 4,300 4,900 5, % 5,400 5, %
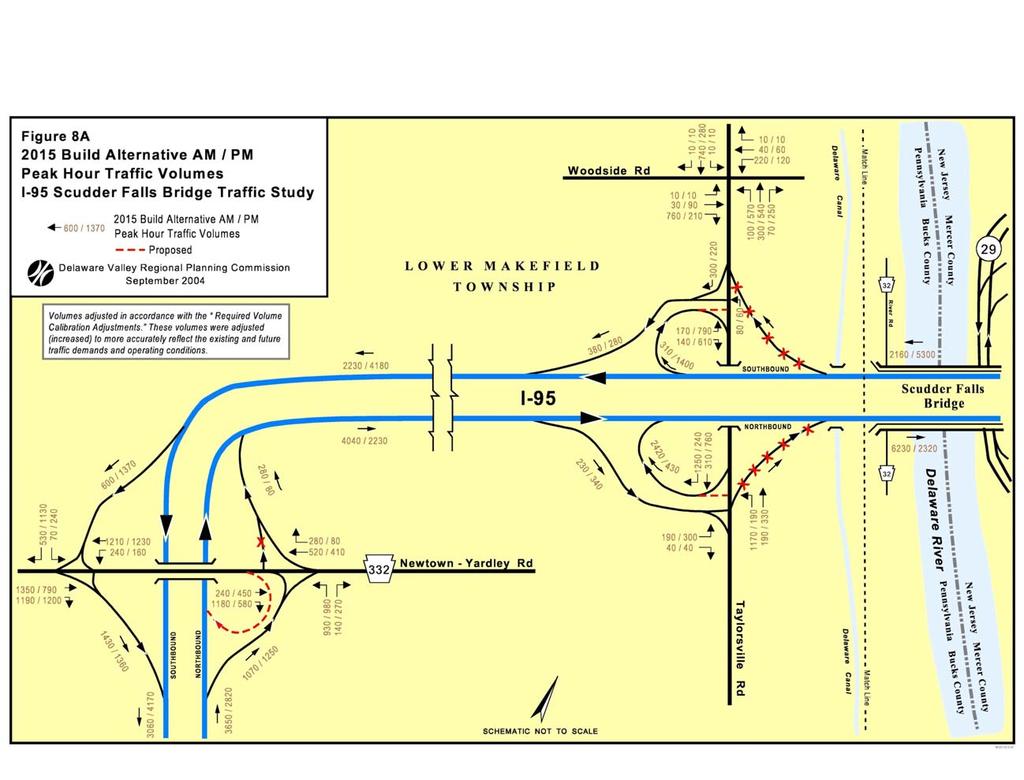
42 The 2030 traffic volumes on the study area arterials under the Build Alternative are also generally higher than the corresponding volumes for the No-Build Alternative. These increases are typically less than five percent. Only NJ 29 (River Road) experiences an increase of over 1,000 vpd compared to the No-Build Alternative. Under the Build Alternative, about 60 percent of the increase in traffic between current and 2030 conditions occurs by 2015, compared to only about half of that increase for the No- Build Alternative. In 2015, under the Build Alternative, the Scudder Falls Bridge is forecast to carry 76,000 vpd, or 16,500 more than current traffic. Between 2015 and 2030 its daily volume increases by an additional 9,000 vehicles. The faster growth between current and 2015 conditions under the Build Alternative is due to the sudden increase in I-95 corridor capacity that occurs once this alternative is opened to traffic. The increased capacity reduces travel times in the corridor and diverts cross-river trips from other facilities. Figures 8 and 9 display AM and PM peak hour volumes under the Build Alternative for 2015 and 2030, respectively. Like the current and No-Build peak hour volumes, these are also heaviest in the northbound direction in the AM peak and heaviest in the southbound direction in the PM peak hour. The highest hourly volumes in the peak direction once again occur on the Scudder Falls Bridge. By 2030, Interstate 95 AM peak hour volumes in the peak direction are 3,900 vph south of the PA 332 interchange, 4,210 vph between PA 332 and Taylorsville Road, and 6,470 vph on the Scudder Falls Bridge. Northbound AM peak hour volumes in the New Jersey portion of the corridor range from 5,640 to 6,050 vehicles per hour. Northbound PM peak hour volumes range from 2,490 vpd between the NJ 29 and NJ 175 on-ramps to 3,140 vpd south of PA 332. In the southbound direction during the PM peak hour, there are 4,870 vehicles approaching the Bear Tavern Road interchange, 5,330 vehicles between Bear Tavern Road and NJ 29, 5,510 on the Scudder Falls Bridge, 4,340 vehicles between Taylorsville Road and PA 332, and 4,320 vehicles south of PA 332. Southbound volumes in the AM peak hour range from 2,660 vph between Taylorsville Road and PA 332 to 3,360 vph south of PA 332, with 2,730 vph on the Bridge. Under the Build Alternative, the ramps with the highest volumes become the new, consolidated northbound on- and southbound off-ramps at Taylorsville Road. The twolane, northbound on-ramp carries 2,570 vehicles in the AM peak hour, while the southbound off-ramp carries 1,480 vehicles in the PM peak hour. 36
43 37
44 38
45 39
46 40
POTTSTOWN BYPASS (US 422) RECONSTRUCTION TRAFFIC STUDY Chester and Montgomery Counties, Pennsylvania
 RECONSTRUCTION TRAFFIC STUDY Chester and Montgomery Counties, Pennsylvania") POTTSTOWN BYPASS (US 422) RECONSTRUCTION TRAFFIC STUDY Chester and Montgomery Counties, Pennsylvania Prepared for Pennsylvania Department of Transportation By Delaware Valley Regional Planning Commission
POTTSTOWN BYPASS (US 422) RECONSTRUCTION TRAFFIC STUDY Chester and Montgomery Counties, Pennsylvania Prepared for Pennsylvania Department of Transportation By Delaware Valley Regional Planning Commission
A. CONCLUSIONS OF THE FGEIS
 Chapter 11: Traffic and Parking A. CONCLUSIONS OF THE FGEIS The FGEIS found that the Approved Plan will generate a substantial volume of vehicular and pedestrian activity, including an estimated 1,300
Interstate 90 and Mercer Island Mobility Study APRIL Commissioned by. Prepared by
 Interstate 90 and Mercer Island Mobility Study APRIL 2017 Commissioned by Prepared by Interstate 90 and Mercer Island Mobility Study Commissioned by: Sound Transit Prepared by: April 2017 Contents Section
Treasure Island Supplemental Information Report Addendum
 1 1 1 1 0 1 0 1 0 1 Treasure Island Supplemental Information Report Addendum Introduction Purpose The purpose of this Supplemental Information Report (SIR) Addendum is to determine if the current land
35(3$5(' )25 3(116</9$1,$ 78513,.( &200,66,21 83'$7(' %< '(/$:$5( 9$//(< 5(*,21$/ 3/$11,1* &200,66,21 -DQXDU\
25 3(116</9$1,$ 78513,.( &200,66,21 83'$7(' %< '(/$:$5( 9$//(< 5(*,21$/ 3/$11,1* &200,66,21 -DQXDU\") 3(116
3(116
MEMORANDUM. Open Section Background. I-66 Open Section Study Area. VDOT Northern Virginia District. I-66 Project Team. Date: November 5, 2015
 MEMORANDUM To: VDOT Northern Virginia District From: I-66 Project Team Date: November 5, 2015 Subject: Open Section Background The purpose of this technical memorandum is to provide narrative and technical
Memorandum. Roger Millar, Secretary of Transportation. Date: April 5, Interstate 90 Operations and Mercer Island Mobility
 Memorandum To: From: The Honorable Dow Constantine, King County Executive; The Honorable Ed Murray, City of Seattle Mayor; The Honorable Bruce Bassett, City of Mercer Island Mayor; The Honorable John Stokes,
MEMORANDUM. Lynn Hayes LSA Associates, Inc.
 MEMORANDUM To: Lynn Hayes LSA Associates, Inc. Date: May 5, 217 From: Zawwar Saiyed, P.E., Senior Transportation Engineer Justin Tucker, Transportation Engineer I Linscott, Law & Greenspan, Engineers LLG
Other Principle Arterials Minor Arterial Major Collector Minor Collector Local
 CHAPTER 10 TRANSPORTATION Introduction The system of public roads in East Pikeland Township is decidedly rural in character. Since the 1984, the road network has remained much the same, with the addition
Appendix 4.1 J. May 17, 2010 Memorandum from CTPS to the Inter Agency Coordinating Group
 Appendix 4.1 J May 17, 2010 Memorandum from CTPS to the Inter Agency Coordinating Group CTPS CENTRAL TRANSPORTATION PLANNING STAFF Staff to the Boston Region Metropolitan Planning Organization MEMORANDUM
Arlington County Board Meeting Project Briefing. October 20, 2015
 Arlington County Board Meeting Project Briefing October 20, 2015 Project Map 2 Project Context Only Interstate in the Country limited to HOV only traffic during rush hours Stoplight at the end of I-66
APPENDIX J MODIFICATIONS PERFORMED TO THE TOR
 APPENDIX J MODIFICATIONS PERFORMED TO THE TOR This appendix summarizes the modifications that were performed in years 2012 and 2017 to rectify calculation errors that were observed in the data presented
McLean Citizens Association Transportation Committee Project Briefing
 McLean Citizens Association Transportation Committee Project Briefing November 10, 2015 Project Map 2 Project Context Only Interstate in the Country limited to HOV only traffic during rush hours Stoplight
Section 106 Update Memo #1 Attachment D. Traffic Diversion & APE Expansion Methodology & Maps
 Section 106 Update Memo #1 Attachment D Traffic Diversion & APE Expansion Methodology & Maps I-65/I-70 North Split Interchange Reconstruction Project (Des. Nos. 1592385 & 1600808) Traffic Diversion and
Assessment of Travel Trends
 I - 2 0 E A S T T R A N S I T I N I T I A T I V E Assessment of Travel Trends Prepared for: Metropolitan Atlanta Rapid Transit Authority Prepared by: AECOM/JJG Joint Venture Atlanta, GA October 2011 General
5.1 Traffic and Transportation
 5.1 When it opens in 2009, the Bellevue Nickel Improvement Project will increase the number of vehicles able to travel through the study area, improve travel speeds, and improve safety by reducing the
Implementation Support Developing ransit Supplemental T 1 Corridor MARCH 2013 Service for the 61
 t r o p p u S n o i t a t n e m e l Imp Part A g n i p o l e v De t i s n a r T l a t n e m e Suppl 611 Corridor e h t r o f e Servic MARCH 2013 The Delaware Valley Regional Planning Commission is dedicated
A VISION FOR I-95. January 12, Delaware Department of Transportation
 A VISION FOR I-95 January 12, 2011 Delaware Department of Transportation The East Coast s Main Street Along with SR 1, the most significant highway in Delaware 29 miles to I ".', 2 Sponsoring / Cooperating
Watts St westbound thru
 Executive Summary At the request of the Hudson Square Business Improvement District, Sam Schwartz Engineering, DPC (Sam Schwartz) has completed a technical analysis of various congestion pricing and/or
A. From I-68 in Monongalia County, West Virginia to SR 6119 in Fayette County, Pennsylvania 1
 Mon-Fayette Transportation Project A. From I-68 in Monongalia County, West Virginia to SR 6119 in Fayette County, Pennsylvania 1 The Mon/Fayette Transportation Project (MFTP) from I-68 in West Virginia
HOV LANE PERFORMANCE MONITORING: 2000 REPORT EXECUTIVE SUMMARY
 Final Report Research Project Agreement No. T1803, Task 4 HOV Monitoring V HOV LANE PERFORMANCE MONITORING: 2000 REPORT EXECUTIVE SUMMARY by Jennifer Nee TRAC Research Engineer John Ishimaru TRAC Senior
2006 WEEKDAY TRAFFIC PROFILE. June 15, 2007
 June 15, 2007 Mr. Gary Stobb, P.E. Director of Planning/Operations Harris County Toll Road Authority 330 Meadowfern, Suite 200 Houston, TX 77067 Re: Westpark Tollway Value Pricing Analysis Dear Mr. Stobb:
FNORTHWEST ARKANSAS WESTERN BELTWAY FEASIBILITY STUDY
 FNORTHWEST ARKANSAS WESTERN BELTWAY FEASIBILITY STUDY EXECUTIVE SUMMARY The 2030 Northwest Arkansas Regional Transportation Plan developed by the Northwest Arkansas Regional Planning Commission (NWARPC)
PURPOSE AND NEED (CONCURRENCE POINT 1) NEW CANADA ROAD PROJECT FROM STATE ROUTE 1 (U.S. HIGHWAY 70) TO U.S. INTERSTATE 40
 NEW CANADA ROAD PROJECT FROM STATE ROUTE 1 (U.S. HIGHWAY 70) TO U.S. INTERSTATE 40") PURPOSE AND NEED (CONCURRENCE POINT 1) NEW CANADA ROAD PROJECT FROM STATE ROUTE 1 (U.S. HIGHWAY 70) TO U.S. INTERSTATE 40 Project Description The primary purpose of this project is to improve the major
PURPOSE AND NEED (CONCURRENCE POINT 1) NEW CANADA ROAD PROJECT FROM STATE ROUTE 1 (U.S. HIGHWAY 70) TO U.S. INTERSTATE 40 Project Description The primary purpose of this project is to improve the major
5 Rail demand in Western Sydney
 5 Rail demand in Western Sydney About this chapter To better understand where new or enhanced rail services are needed, this chapter presents an overview of the existing and future demand on the rail network
Appendix B Ultimate Airport Capacity and Delay Simulation Modeling Analysis
 Appendix B ULTIMATE AIRPORT CAPACITY & DELAY SIMULATION MODELING ANALYSIS B TABLE OF CONTENTS EXHIBITS TABLES B.1 Introduction... 1 B.2 Simulation Modeling Assumption and Methodology... 4 B.2.1 Runway
Research Report Agreement T4118, Task 24 HOV Action Plan HOV ACTION PLAN
 Research Report Agreement T4118, Task 24 HOV Action Plan HOV ACTION PLAN by John M. Ishimaru Senior Research Engineer Duane Wright Systems Analyst Programmer Mark E. Hallenbeck Director Jaime Kang Research
TABLE OF CONTENTS. Coral Springs Charter High School and Middle School Job No Page 2
 Job No. 15-019 Page 2 TABLE OF CONTENTS 1.0 INTRODUCTION... 4 2.0 EXISTING CONDITIONS... 5 3.0 TRAFFIC GENERATION... 7 4.0 TRIP DISTRIBUTION... 8 5.0 FUTURE CONDITIONS... 8 6.0 SITE ACCESS...13 7.0 CONCLUSION...13
I-66 Inside the Beltway Feasibility Study
 I-66 Inside the Beltway Feasibility Study Feasibility Study Study Process Context Sensitive Dialogues Corridor Assessments / Data Collection Problem Statement Refinement Concept Development Concept Evaluation
MARSHALL Subdivision. Township of Springwater, County of Simcoe. Traffic Brief for: Ontario Inc. Type of Document: Final Report
 MARSHALL Subdivision Township of Springwater, County of Simcoe Traffic Brief for: 489469 Ontario Inc. Type of Document: Final Report Project Number: JDE 1521 Date Submitted: October 19 th, 2016 10 / 19
PREFACE. Service frequency; Hours of service; Service coverage; Passenger loading; Reliability, and Transit vs. auto travel time.
 PREFACE The Florida Department of Transportation (FDOT) has embarked upon a statewide evaluation of transit system performance. The outcome of this evaluation is a benchmark of transit performance that
Lake Erie Commerce Center Traffic Analysis
 LOCATION: East of NYS Route 5 at Bayview Road Town of Hamburg Erie County, New York PREPARED BY: Wendel Companies 140 John James Audubon Parkway Suite 200 Amherst, New York 14228 January 2012 i ii Table
Memorandum. Fund Allocation Fund Programming Policy/Legislation Plan/Study Capital Project Oversight/Delivery Budget/Finance Contract/Agreement Other:
 Memorandum Date: March 23, 2018 To: Transportation Authority Board From: Eric Cordoba Deputy Director Capital Projects Subject: 4/10/18 Board Meeting: San Francisco Freeway Corridor Management Study Update
DISTRICT EXPRESS LANES ANNUAL REPORT FISCAL YEAR 2017 JULY 1, 2016 JUNE 30, FloridaExpressLanes.com
 DISTRICT EXPRESS LANES ANNUAL REPORT FISCAL YEAR 2017 JULY 1, 2016 JUNE 30, 2017 FloridaExpressLanes.com This page intentionally left blank. TABLE OF CONTENTS List of Figures... ii List of Tables.... ii
According to FAA Advisory Circular 150/5060-5, Airport Capacity and Delay, the elements that affect airfield capacity include:
 4.1 INTRODUCTION The previous chapters have described the existing facilities and provided planning guidelines as well as a forecast of demand for aviation activity at North Perry Airport. The demand/capacity
4. Safety Concerns Potential Short and Medium-Term Improvements
 NH Route 104 Access Management Study Page 19 4. Safety Concerns Potential Short and Medium-Term Improvements Potential safety improvement strategies are listed by priority based on field observations by
Oakland A s Gondola Economic Impact
 January 2019 Oakland A s Gondola Economic Impact KEY FINDING: The proposed gondola system, which will connect the A s planned stadium to downtown Oakland, will generate $685 million in total economic benefit
PDF compression, OCR, web optimization using a watermarked evaluation copy of CVISION PDFCompressor
 o U.S. Department Washington Division Suite 501 Evergreen Plaza of Transportation 711 South Capitol Way Olympia, Washington 98501-1284 Federa' Highway (360) 753-9480 Administration (360) 753-9889 (FAX)
10.0 Recommendations Methodology Assumptions
 10.0 Recommendations To accommodate the projected growth of the I-526 corridor, this report has summarized potential improvement strategies that were separated into four categories, TDM, Modal, Traffic
3. Aviation Activity Forecasts
 3. Aviation Activity Forecasts This section presents forecasts of aviation activity for the Airport through 2029. Forecasts were developed for enplaned passengers, air carrier and regional/commuter airline
2008 DEKALB COUNTY TRANSPORTATION PLAN (UPDATE)
") 2008 DEKALB COUNTY TRANSPORTATION PLAN (UPDATE) TABLE OF CONTENTS Introduction 1 Transportation Planning Activities 2 Identification of Problem Areas and Recommended Solutions 7 DeKalb County Projects
2008 DEKALB COUNTY TRANSPORTATION PLAN (UPDATE) TABLE OF CONTENTS Introduction 1 Transportation Planning Activities 2 Identification of Problem Areas and Recommended Solutions 7 DeKalb County Projects
CENTRAL OREGON REGIONAL TRANSIT MASTER PLAN
 Central Oregon Regional Transit Master Plan Volume II: Surveys and Market Research CENTRAL OREGON REGIONAL TRANSIT MASTER PLAN Volume IV: Service Plan Appendices A-B July 213 Nelson\Nygaard Consulting
Kingston Transportation Master Plan Draft Report Transit Forecasting 1
 TRANSIT FORECASTING Transit Forecasting 1 INTRODUCTION A spreadsheet model was developed to identify existing transit deficiencies and additional transit service requirements. The model comprised transit
7272 WISCONSIN AVENUE LOCAL AREA TRANSPORTATION REVIEW
 7272 LOCAL AREA TRANSPORTATION REVIEW AND TRANSPORTATION POLICY AREA REVIEW MONTGOMERY COUNTY, MARYLAND Submitted on behalf of Carr Properties Prepared by: Wells + Associates, Inc. Submission: July 1,
STUDY DESCRIPTION MEMORANDUM. DATE April 20, 2011
 DATE April 0, 0 TO FROM RE MEMORANDUM Congestion Management Program Files Ariel Godwin, CMP Manager Boston Region MPO Staff Limited-Access Highway Counts and Traffic Volumes, Summer 00 This memorandum
Route 29 Solutions Projects
 Your guide to the Route 29 Solutions Projects For full details & continued engagement please visit www.route29solutions.org The Route 29 Solutions Package is a $230 million investment into the improvement
1.2 Corridor History and Current Characteristics
 SECTION 1 Description and Background of Study Area 1.1 Introduction This preliminary engineering report was prepared for the Alaska Department of Transportation and Public Facilities (ADOT&PF). It is part
FEASIBILITY STUDY REFINED CONCEPT 1 PROJECT A
 VIRGINIA DEPARTMENT OF TRANSPORTATION I-85 / I-95 INTERCHANGE FEASIBILITY STUDY REFINED CONCEPT 1 PROJECT A Columbia Rd REFINED CONCEPT 1 PROJECT A Bellevue Rd COST: $3.3M Siege Rd Eliminate the loop ramp
TRANSPORTATION ELEMENT
 Transportation TRANSPORTATION ELEMENT Data, Inventory, and Analysis Prepared by Contents 1.0 INTRODUCTION... 1 2.0 EXISTING CONDITIONS... 1 2.1 Roadways... 1 2.1.1 Jurisdiction... 1 2.1.2 Functional Classification...
Texas Transportation Institute The Texas A&M University System College Station, Texas
 1. Report No. FHWA/TX-05/0-4434-P1 2. Government Accession No. 3. Recipient's Catalog No. 4. Title and Subtitle GUIDANCE FOR FUTURE DESIGN OF FREEWAYS WITH HIGH- OCCUPANCY VEHICLE (HOV) LANES BASED ON
8 CROSS-BOUNDARY AGREEMENT WITH BRAMPTON TRANSIT
 8 CROSS-BOUNDARY AGREEMENT WITH BRAMPTON TRANSIT The Transportation Services Committee recommends the adoption of the recommendations contained in the following report dated May 27, 2010, from the Commissioner
Central Coast Origin-Destination Survey
 Central Coast Origin-Destination Survey July 2016 Central Coast Origin-Destination Survey Prepared for: Santa Barbara County Association of Governments San Luis Obispo Council of Governments Ventura County
TransAction Overview. Introduction. Vision. NVTA Jurisdictions
 Introduction Vision NVTA Jurisdictions In the 21 st century, Northern Virginia will develop and sustain a multimodal transportation system that enhances quality of life and supports economic growth. Investments
INNOVATIVE TECHNIQUES USED IN TRAFFIC IMPACT ASSESSMENTS OF DEVELOPMENTS IN CONGESTED NETWORKS
 INNOVATIVE TECHNIQUES USED IN TRAFFIC IMPACT ASSESSMENTS OF DEVELOPMENTS IN CONGESTED NETWORKS Andre Frieslaar Pr.Eng and John Jones Pr.Eng Abstract Hawkins Hawkins and Osborn (South) Pty Ltd 14 Bree Street,
US 380 FEASIBILITY STUDY
 US 380 FEASIBILITY STUDY Denton County CSJ(s): 0135-10-061, 0135-10-062 Public Meeting(s): January 15 & 22, 2019 WELCOME US 380 Denton County Feasibility Study DALLAS DISTRICT PUBLIC MEETING January 15
SAMTRANS TITLE VI STANDARDS AND POLICIES
 SAMTRANS TITLE VI STANDARDS AND POLICIES Adopted March 13, 2013 Federal Title VI requirements of the Civil Rights Act of 1964 were recently updated by the Federal Transit Administration (FTA) and now require
V. DATA COLLECTION PROGRAM
 V. DATA COLLECTION PROGRAM As discussed in Section IV, an extensive data assembly and data collection program was undertaken to develop the data necessary to calibrate the existing Portway Extensions model
Washington St. & Ash Coulee Dr./43 rd Ave Intersection Study
 430 IACC Building Fargo, ND 58105 Tel 701-231-8058 Fax 701-231-1945 www.ugpti.org www.atacenter.org Washington St. & Ash Coulee Dr./43 rd Ave Intersection Study Final Report April 2007 Prepared for: City
3 Aviation Demand Forecast
 3 Aviation Demand 17 s of aviation demand were prepared in support of the Master Plan for Harrisburg International Airport (the Airport or HIA), including forecasts of enplaned passengers, air cargo, based
Transportation Improvement District (TID) Exercise New Castle County Unified Development Code
 Exercise New Castle County Unified Development Code") Transportation Improvement District (TID) Exercise New Castle County Unified Development Code Churchmans Crossing TID How should New Castle County deploy Transportation Improvement Districts (TIDs)? Site
Transportation Improvement District (TID) Exercise New Castle County Unified Development Code Churchmans Crossing TID How should New Castle County deploy Transportation Improvement Districts (TIDs)? Site
TRAFFIC IMPACT STUDY REPORT FOR PROPOSED OFFICE PROJECT AT 959 SEWARD STREET IN HOLLYWOOD SNYDER PARTNERS
 DRAFT TRAFFIC IMPACT STUDY REPORT FOR PROPOSED OFFICE PROJECT AT 959 SEWARD STREET IN HOLLYWOOD Prepared for: SNYDER PARTNERS Prepared by: Crain & Associates 2007 Sawtelle Boulevard, Suite 4 Los Angeles,
Planning. Proposed Development at the Southeast Corner of Lakeshore Road West and Brookfield Road Intersection FINAL.
 Project No. 121-22908 N o v e m b e r 2 0 1 2 Traffic Impact Study Transportation Planning th GENIVAR Inc., 600 Cochrane Drive, 5 Floor, Markham, Ontario L3R 5K3 Telephone: 905.475.7270 Fax: 905.475.5994
SOUTHBOUND YONGE STREET TO EASTBOUND HIGHWAY 401 F L Y -UNDER
 SOUTHBOUND YONGE STREET TO EASTBOUND HIGHWAY 401 F L Y -UNDER Proposal to Eliminate Traffic Gridlock in South North York Centre Area With Southbound Yonge Street to Eastbound Highway 401 Fly-UNDER A much
EXISTING CONDITIONS A. INTRODUCTION. Route 107 Corridor Study Report
 II. EXISTING CONDITIONS A. INTRODUCTION The Route 107 study area extends from the south at Chestnut Street in Lynn approximately 3.7 miles to the north to Boston Street in Salem. The study area has three
HDR itrans Consulting Inc. 100 York Blvd., Suite 300 Richmond Hill, ON L4B 1J8 Tel: (905) Fax: (905)
 Fax: (905)") !" # $ !" # $ Consulting Inc. 100 York Blvd., Suite 300 Richmond Hill, ON L4B 1J8 Tel: (905) 882-4100 Fax: (905) 882-1557 www.itransconsulting.com November 2009 %&'('$&$ 1. West Brampton Road Network...
!" # $ !" # $ Consulting Inc. 100 York Blvd., Suite 300 Richmond Hill, ON L4B 1J8 Tel: (905) 882-4100 Fax: (905) 882-1557 www.itransconsulting.com November 2009 %&'('$&$ 1. West Brampton Road Network...
The purpose of this Demand/Capacity. The airfield configuration for SPG. Methods for determining airport AIRPORT DEMAND CAPACITY. Runway Configuration
 Chapter 4 Page 65 AIRPORT DEMAND CAPACITY The purpose of this Demand/Capacity Analysis is to examine the capability of the Albert Whitted Airport (SPG) to meet the needs of its users. In doing so, this
APPENDIX H MILESTONE 2 TRAFFIC OPERATIONS ANALYSIS OF THE AT-GRADE CROSSINGS
 Draft Environmental Impact Statement/Environment Impact Report Appendix H Milestone 2 Traffic Operations Analysis of the At-Grade Crossings APPENDIX H MILESTONE 2 TRAFFIC OPERATIONS ANALYSIS OF THE AT-GRADE
SANTA CLARA COUNTY I-280 CORRIDOR STUDY
 SANTA CLARA COUNTY I-280 CORRIDOR STUDY Appendix B 2 Technical Memorandum Existing Transportation Condition Memo SANTA CLARA VALLEY TRANSPORTATION AUTHORITY (VTA) 1-1 Introduction The I-280 Corridor Study
ROUTE 20 CORRIDOR STUDY ---- Orange County, Virginia
 ROUTE 20 CORRIDOR STUDY ---- Orange County, Virginia Prepared by PARSONS Fairfax, Virginia on behalf of the: Rappahannock-Rapidan Regional Commission in cooperation with Orange County, Virginia Virginia
Public Information Meetings. October 5, 6, 7, and 15, 2015
 Public Information Meetings October 5, 6, 7, and 15, 2015 Project Map 2 Project Context Only Interstate in the Country limited to HOV only traffic during rush hours Stoplight at the end of I-66 eastbound
Evaluation of High-Occupancy-Vehicle
 TRANSPORTATION RESEARCH RECORD 1446 Evaluation of High-Occupancy-Vehicle Lanes in Phoenix, Arizona MARK J. POPPE, DAVID J.P. HOOK, AND KEN M. HOWELL High-occupancy-vehicle (HOV) lanes were first introduced
Mainline Description
 Mainline Description The Mainline component of Florida s Turnpike extends for 320 miles and consists of five distinct sections as shown in the figure above. These sections are the SR 821 (HEFT), Southern
Launceston City Council. Kings Meadows Traffic Management Report for Public Consultation
 Launceston City Council Kings Meadows Traffic Management Report for Public Consultation November 2013 This report: has been prepared by GHD for Launceston City Council and may only be used and relied on
Frequently Asked Questions on the Route 29 Solutions Improvements Projects
 Frequently Asked Questions on the Route 29 Solutions Improvements Projects Background What are the Route 29 Solutions improvement projects? These projects include the Route 29/250 Interchange ( Best Buy
Airport Planning Area
 PLANNING AREA POLICIES l AIRPORT Airport Planning Area LOCATION AND CONTEXT The Airport Planning Area ( Airport area ) is a key part of Boise s economy and transportation network; it features a multi-purpose
-.u,!rpc MAY2015 PLANNING COMMISSION. ddelawaie VALLEY
 ddelawaie VALLEY -.u,!rpc PLANNING COMMISSION MAY2015 3-42-0125-013-2012 PA Wilmington MD Baltimore DE BUCKS MERCER MONTGOMERY CHESTER PHILADELPHIA DELAWARE BURLINGTON CAMDEN GLOUCESTER New York City NJ
Major Scheme Business Case Summary Report for Programme Entry
 Paper A Heart of South West Local Transport Board Major Scheme Business Case Summary Report for Programme Entry M5 Junction 25, Taunton July 2016 1 SCHEME SUMMARY Scheme Name M5 Junction 25, Taunton Date
WELLINGTON $422 MILLION $614 MILLION $83 MILLION 22% SPEND $1.9 BILLION
 WELLINGTON WELLINGTON $1.9 BILLION FORECAST TOTAL WELLINGTON INVESTMENT The Wellington region s transport challenges are dominated by the region s concentration of population in the metropolitan cities,
Draft Concept Alternatives Analysis for the Inaugural Airport Program September 2005
 Draft Concept Alternatives Analysis for the Inaugural Airport Program September 2005 Section 1 - Introduction This report describes the development and analysis of concept alternatives that would accommodate
Construction underway. STATUS: 229 5,190 5,419 5,305 STIP REFERENCE #FR /01/2013
 FREDERICK COUNTY STATE HIGHWAY ADMINISTRATION -- Frederick County -- Line 1 PROJECT: I-7, Baltimore National Pike INTERSTATE CONSTRUCTION PROGRAM DESCRIPTION: Widen I-7 east of MD 355 to east of MD 144
TfL Planning. 1. Question 1
 TfL Planning TfL response to questions from Zac Goldsmith MP, Chair of the All Party Parliamentary Group on Heathrow and the Wider Economy Heathrow airport expansion proposal - surface access February
Business Growth (as of mid 2002)
") Page 1 of 6 Planning FHWA > HEP > Planning > Econ Dev < Previous Contents Next > Business Growth (as of mid 2002) Data from two business directories was used to analyze the change in the number of businesses
Page 1 of 6 Planning FHWA > HEP > Planning > Econ Dev < Previous Contents Next > Business Growth (as of mid 2002) Data from two business directories was used to analyze the change in the number of businesses
November 11, 2009 BY . Planning and Growth Management Department 110 Laurier Avenue West, 4 th Floor Ottawa, Ontario K1P 1J1. Dear Mr.
 November 11, 2009 Planning and Growth Management Department 110 Laurier Avenue West, 4 th Floor Ottawa, Ontario K1P 1J1 BY E-MAIL Attention: Mr. Don Herweyer Dear Mr. Herweyer: Reference: Abbott-Fernbank
MEMORANDUM. for HOV Monitoring on I-93 North and the Southeast Expressway, Boston Region MPO, November, 2011.
 MEMORANDUM Date: January 12, 2012 To: Congestion Management Process Files From: Seth Asante, Ryan Hicks, and Efi Pagitsas MPO Staff Re: Historical Trends: Travel Times and Vehicle Occupancy Levels for
Nashua Regional Planning Commission
 Nashua Regional Planning Commission Congestion Management Program Corridor Overview NH 111 is a major east-west arterial roadway that passes through 3 municipalities in the Nashua region. It enters the
Pedestrian Safety Review Spadina Avenue
 STAFF REPORT ACTION REQUIRED Pedestrian Safety Review Spadina Avenue Date: October 13, 2015 To: Toronto and East York Community Council From: Director, Transportation Services, Toronto and East York District
Peer Performance Measurement February 2019 Prepared by the Division of Planning & Market Development
 2017 Regional Peer Review Peer Performance Measurement February 2019 Prepared by the Division of Planning & Market Development CONTENTS EXECUTIVE SUMMARY... 3 SNAPSHOT... 5 PEER SELECTION... 6 NOTES/METHODOLOGY...
FHWA P/N Guidelines. Corridor Relationship. Highway 22 Segment 1 - US 169 to CSAH 2 Relevance / Documentation of Need
 Highway 22 Segment 1 - US 169 to CSAH 2 Vehicle Mobility Congestion Intersection Congestion Existing Conditions - Based on Highway Capacity Manual methodology, corridor level of service is currently LOS
rtc transit Before and After Studies for RTC Transit Boulder highway UPWP TASK Before Conditions
 rtc transit Before and After Studies for RTC Transit UPWP TASK 3403-11-14 Before Conditions Report Boulder highway June 2011 Before and After Studies for RTC Transit BOULDER HIGHWAY BEFORE STUDY UPWP Task
Project Deliverable 4.1.3d Individual City Report - City of La Verne
 Pomona Valley ITS Project Project Deliverable 4.1.3d Individual City Report - City of La Verne Prepared by: April 19, 2002 099017000.1 Copyright 2002, Kimley-Horn and Associates, Inc TABLE OF CONTENTS
The forecasts evaluated in this appendix are prepared for based aircraft, general aviation, military and overall activity.
 Chapter 3: Forecast Introduction Forecasting provides an airport with a general idea of the magnitude of growth, as well as fluctuations in activity anticipated, over a 20-year forecast period. Forecasting
EXECUTIVE SUMMARY. hospitality compensation as a share of total compensation at. Page 1
 EXECUTIVE SUMMARY Applied Analysis was retained by the Las Vegas Convention and Visitors Authority (the LVCVA ) to review and analyze the economic impacts associated with its various operations and southern
Potomac River Commuter Ferry Feasibility Study & RPE Results
 1.1 Introduction The Prince William County Department of Transportation conducted a route proving exercise (RPE) and feasibility study of a proposed commuter ferry service on the Potomac River between
Traffic Analysis Final Report
 SR-71 Widening Project Project Approval/Environmental Documentation Traffic Analysis Final Report Prepared for Caltrans District 7 August 2012 6 Hutton Centre Drive, Suite 700 Santa Ana, California 92707
FORT LAUDERDALE-HOLLYWOOD INTERNATIONAL AIRPORT ENVIRONMENTAL IMPACT STATEMENT DRAFT
 D.3 RUNWAY LENGTH ANALYSIS Appendix D Purpose and Need THIS PAGE INTENTIONALLY LEFT BLANK Appendix D Purpose and Need APPENDIX D.3 AIRFIELD GEOMETRIC REQUIREMENTS This information provided in this appendix
Time-series methodologies Market share methodologies Socioeconomic methodologies
 This Chapter features aviation activity forecasts for the Asheville Regional Airport (Airport) over a next 20- year planning horizon. Aviation demand forecasts are an important step in the master planning
CONTACT: Michelle T. Holland
 FOR IMMEDIATE RELEASE Thursday, December 7, 2017 CONTACT: Michelle T. Holland 703-586-0487 (C) Michelle.Holland@vdot.virginia.gov Jennifer McCord 571-230-2926 Jennifer.McCord@vdot.virginia.gov 66 EXPRESS
MONTEREY REGIONAL AIRPORT MASTER PLAN TOPICAL QUESTIONS FROM THE PLANNING ADVISORY COMMITTEE AND TOPICAL RESPONSES
 MONTEREY REGIONAL AIRPORT MASTER PLAN TOPICAL QUESTIONS FROM THE PLANNING ADVISORY COMMITTEE AND TOPICAL RESPONSES Recurring topics emerged in some of the comments and questions raised by members of the
Macleod Trail Corridor Study. Welcome. Macleod Trail Corridor Study Open House. Presentation of Proposed Design Concepts
 Macleod Trail Corridor Study Welcome Macleod Trail Corridor Study Open House Presentation of Proposed Design Concepts Study Purpose Develop a corridor plan for Macleod Trail that aligns with The City s:
POPULATION INTRODUCTION
 POPULATION INTRODUCTION The socio-economic data available at the time of this writing is a conglomeration of data provided by the Kentucky State Data Center, OKI Regional Council of Governments, 2010 U.S.