Chapter 3 Costly for households, costly for firms
|
|
|
- Natalie Palmer
- 5 years ago
- Views:
Transcription


1 Chapter 3 Costly for households, costly for firms African households face higher costs relative to their per capita GDP than households in other regions. According to a new study of price level indices at the urban level, based on data collected by the International Comparison Program, urban households in 39 Sub-Saharan African countries pay percent more overall than urban households in other countries at similar income levels (Nakamura and others 2016). A similar comparison of urban prices based on data from 125 cities, including nine in Sub-Saharan Africa (the Economist Intelligence Unit s Worldwide Cost of Living Survey) finds African cities to be about 31 percent more costly for households than cities in low- and middle-income countries elsewhere (Nakamura and others 2016). 87
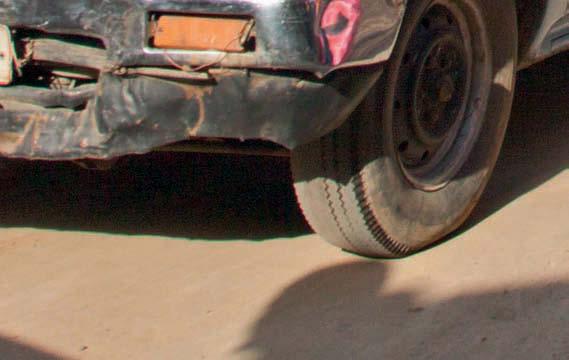
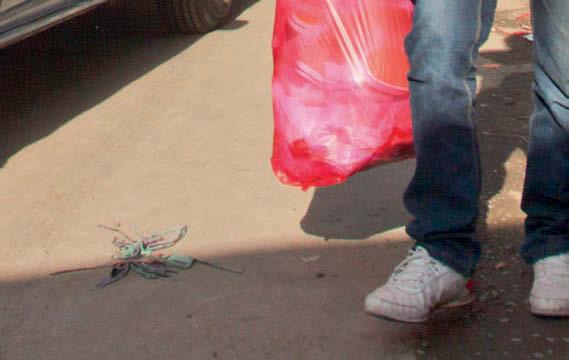
2 Africa s Cities Opening Doors to the World Housing and transport are especially costly in urban Africa. Relative to their income levels, urban residents pay 55 percent more for housing in Africa than they do in other regions. Urban transport, which includes prices of vehicles and transport services, is about 42 percent more expensive in African cities than in cities elsewhere. Urban workers in Sub-Saharan Africa incur high commuting costs or they simply cannot afford to commute by vehicle, leaving them no option but to walk (or possibly bike). The informal, often colorful minibus systems that dominate collective motorized transport in most African cities are far from costefficient: the buses small size and low load factors (passenger capacity) prevent them from realizing scale economies. For the poorest urban residents especially, the cost of vehicle transport in some cities is prohibitive. The need to walk to work limits these residents access to jobs. The price premium for food is also large (about 35 percent). In deciding where to live, households choose the best home they can afford, with the amenities they value most, and make tradeoffs in allocating their budgets over time. Some choose to live in the center of a city, where rents are higher, sacrificing size for access to amenities. When public amenities are limited, basic services lacking, and connective infrastructure deficient, households may underconsume housing and make suboptimal decisions on housing quality in order to access these services. For example, when transport systems are unavailable, households may choose to live in close-in slums so that they can access jobs, schools, or health care. Recent work suggests that low investments in formal housing may be pushing households into searching for informal solutions. The high costs and lack of amenities faced by households also matter for firms. Workers need to be compensated for the high costs of living that they face, which translates into higher wage costs for firms. Wages are generally at least 15 percent higher than wages in comparable countries. High prices, low incomes Price levels are generally higher in high-income countries, and they are higher in urban areas than rural ones (Nakamura and others 2016). Goods and services in lower-income African countries are generally less expensive than in higher-income countries. For example, the price level of food and nonalcoholic beverages in Ethiopia is almost half that in the United States. Within countries, urban areas generally have higher prices than rural, partly because the costs of commuting, land, rent, and some goods are also high. These relationships hold quite widely, but the data reveal that African cities have particularly high prices relative to their level of development. Figure 3.1 plots a measure of the cost of living in cities in various countries relative to their GDP per capita (adjusted for purchasing power parity). It confirms that richer countries generally have higher price levels, but it also shows that African countries face price levels that are higher than expected given their low income levels (Nakamura and others 2016). The figure is based on data from the 2011 round of the International Comparison Program. It covers 62 countries (including 39 in Sub-Saharan Africa), with price level index data collected mainly in urban areas. Where the price information is not entirely urban based, adjustment was made using withincountry data for urban rural differentials. 20 Price level indices are calculated by dividing the purchasing power parities by the nominal exchange rate for each country. Econometric analysis of these data show that, controlling for income levels, price levels for household expenditures (excluding housing rent) are on average 31 percent higher in Sub-Saharan African countries than in other countries. A group of relatively expensive countries includes Angola, Mozambique, Malawi, Niger, Chad, and the Central African Republic. By contrast, The Gambia, Mauritania, Madagascar, and Tanzania have relatively low price levels. Map 3.1 (overleaf) illustrates the spatial pattern in Sub-Saharan Africa by showing the residuals from the regression. 88
3 Part 2 Africa s Low Urban Development Trap Chapter 3: Costly for households, costly for firms FIGURE 3.1 African cities face high prices for their income levels Sub-Saharan African countries Other economies Fitted values Adjusted price level index Central African Republic Burundi Uganda Gambia Madagascar Congo Swaziland Congo. Dem. Rep. Guinea- Chad Ghana Bissau Mozambique Sudan Malawi Lesotho Zambia Liberia Togo Senegal Nigeria Burkina Faso Benin Niger Cameroon Mali Kenya Rwanda Guinea Sierra Leone Tanzania Mauritania Angola Namibia Gabon S. Africa Mauritius Botswana Equitorial Guinea Ethiopia Log of GDP per capita (2011 PPP$) Source: Nakamura and others (2016), based on 2011 International Comparison Program data. 89
4 Africa s Cities Opening Doors to the World Mauritania Cabo Verde The Gambia Mali Niger GuineaBissau Sudan Chad Senegal Burkina Faso Guinea Sierra Leone Eritrea Djibouti Benin Côte D Ivoire Liberia Togo Nigeria South Sudan Central African Republic Ghana Ethiopia Somalia Cameroon Equatorial Guinea Uganda Sao Tome and Principe Gabon Democratic Republic of Congo Congo to to to to to no data Kenya Rwanda Burundi Comoros Angola Malawi Madagascar Zambia Zimbabwe Namibia Mozambique Mauritius Botswana Swaziland MAP 3.1 Relative expensiveness of household consumption in Sub-Saharan Africa Source: Nakamura and others Seychelles Tanzania Lesotho South Africa
5 Part 2 Africa s Low Urban Development Trap Chapter 3: Costly for households, costly for firms Similar findings are obtained using data collected by the Economist Intelligence Unit. These data are compiled for quite different purposes the cost of living of expatriates traveling from developed countries for business. Its price survey therefore collects data on items typically consumed by expatriates. Using these data, Nakamura and others (2016) find a highly significant positive Africa effect, indicating that (controlling for income levels), African cities are about 30 percent more expensive than comparable cities elsewhere. What goods and services are most important in driving this price premium? The Africa price premium varies depending on the groups of goods and services. It is particularly large on essentially urban commodities, such as housing (55 percent), followed by communication (46 percent), and urban transport (42 percent). But food and nonalcoholic beverages are also relatively expensive in African cities (35 percent premium); particularly expensive among food items are fresh or chilled vegetables, eggs and egg-based products, and fresh milk (figure 3.2). FIGURE 3.2 Consumers in Africa face high price premiums Household consumption except for housing 31% Household consumption except for housing and food 26% Food and nonalcoholic beverages 35% Housing rent 55% Transport 42% Communication 46% Restaurants and hotels 41% Source: Nakamura and others Given the expenditure patterns of urban households in Africa, higher prices of food deepen livability challenges for households and impose a severe constraint on the choices they have on where to live or work. The budgets of the poor are spent mainly on food, reducing their opportunities to spend on health, education, and housing. According to household surveys collected in several African countries between 2003 and 2010, spending on food accounts for percent of monthly expenditures by urban households (figure 3.3). The poorest households (households in the bottom expenditure quintile) spend an even larger share on food, ranging from 44 percent in Uganda to 68 percent in Zambia. Rising incomes allow for consumption of nonfood items, such as housing, recreation, and so forth (Dasgupta and others 2014). 91
6 Africa s Cities Opening Doors to the World FIGURE 3.3 Households in African cities grapple with subsistence 80% Share of food expenditure 70% 60% 50% 40% 30% 20% 44% 44% 51% 59% 54% 60% 61% 66% 60% 66% 54% 68% 66% 10% 0% Uganda Cameroon Côte d Ivoire Niger Ghana Ethiopia Rwanda Mozambique Sierra Leon Kenya Malawi Zambia Senegal Average Poorest Source: Data from the Survey-based Harmonized Indicator Program (SHIP) of the World Bank s Poverty Reduction and Economic Management Statistics Practice Group, Africa Region. Two other observation about the cost of urban living in Africa are important. The first is that building formally is expensive. Registering property in Sub- Saharan Africa is generally more time consuming and costly (relative to property value) than in other regions of the world (figure 3.4); dealing with construction permits is fairly quick but still costly (relative to income per capita) (figure 3.5). On average in Sub-Saharan Africa, it takes 59 days and 9 percent of property value to register property more than twice as long and three times as much as in Europe and Central Asia (26.5 days and 2.8 percent of property value) and high-income OECD countries (24 days and 4.4 percent of property value). Obtaining construction permits in Sub-Saharan Africa takes on average 171 days and costs 737 percent of income per capita. This average time is comparable to other regions; it is lower than in South Asia, Latin America and the Caribbean, and Europe and Central Asia. However, the average cost is second only to South Asia and, at 84 percent of per capita income, nearly nine times as expensive relative to incomes as in the high-income OECD countries (World Bank 2015). The high costs of obtaining property registration and construction permits in Sub-Saharan cities contributes to further growth of informal settlements. 92
7 Part 2 Africa s Low Urban Development Trap Chapter 3: Costly for households, costly for firms FIGURE 3.4 Average time and cost to register property in Sub-Saharan countries and international benchmarks Time (days) Cost (% of property value) Time Cost Angola Benin Botswana Burkina Faso Burundi Cabo Verde Cameroon Chad Central African Republic Comoros Congo, Dem. Rep. Congo, Rep. Côte d Ivoire Eritrea Ethiopia Gabon Gambia, The Ghana Guinea Kenya Lesotho Liberia Madagascar Malawi Mali Mauritania Mauritius Mozambique Namibia Niger Nigeria Rwanda Guinea-Bissau São Tomé and Principe Senegal Seychelles Sierra Leone South Africa South Sudan Sudan Swaziland Tanzania Togo Uganda Zambia Zimbabwe East Asia & Pacific Europe & Central Asia 0 0 Latin America & Caribbean Middle East & North Africa OECD high income South Asia Sub-Saharan Africa Source: World Bank 2015, based on data from Doing Business. 93
8 Africa s Cities Opening Doors to the World FIGURE 3.5 Average time and cost to deal with construction permits in Sub-Saharan countries and international benchmarks Time (days) Cost (% of warehouse value) Time Cost Angola Benin Botswana Burkina Faso Burundi Cabo Verde Cameroon Central African Republic Chad Comoros Congo, Dem. Rep. Congo, Rep. Côte d Ivoire Ethiopia Gabon Gambia, The Ghana Guinea Guinea-Bissau Kenya Lesotho Liberia Madagascar Malawi Mali Mauritania Mauritius Mozambique Namibia Niger Nigeria Rwanda São Tomé and Principe Senegal Seychelles Sierra Leone South Africa South Sudan Sudan Swaziland Tanzania Togo Uganda Zambia Zimbabwe East Asia & Pacific Europe & Central Asia 0 0 Latin America & Caribbean Middle East & North Africa OECD high income South Asia Sub-Saharan Africa Source: World Bank 2015, based on data from Doing Business. 94
9 Part 2 Africa s Low Urban Development Trap Chapter 3: Costly for households, costly for firms The second observation is that there appears to be a positive association between urban costs and the extent to which a city fails to provide density or is fragmented. Estimates of the cost of proving urban infrastructure indicate that doubling urban density reduces the per capita cost of a package of infrastructure improvements by about 25 percent (Foster and Briceno-Garmendia 2010). The decrease is particularly large for infrastructure associated with high capital cost per capita, as shown in figure 3.6. Figure 3.7 also shows that a fragmented urban form is associated with higher costs. Using the Puga measure of urban fragmentation (discussed in chapter 2), higher exposure for the largest city in a country is associated with a lower urban price index. When the urban form is fragmented, economies of scale in service delivery are sacrificed, opportunities for agglomeration economies are lost, and transportation is more expensive, because people are dispersed and more kilometers of road network are needed. Ordinary least squares regressions show that a 1 percent increase in the Puga index is associated with urban costs that are lower by 12 percent, controlling for income levels and city population. Alongside high urban costs, lack of urban amenities and high congestion reduces household wellbeing in Africa s cities. FIGURE 3.6 Infrastructure costs per capita decrease with density 1,400 Secondary City 1,200 1,000 $ per capita ,000 10,000 15,000 20,000 25,000 30,000 Density (people/km 2 ) Private tap High quality roads Power grid Source: Foster and Briceno-Garmendia Source: Foster and Briceno-Garmendia
10 Africa s Cities Opening Doors to the World FIGURE 3.7 A fragmented urban form is associated with higher urban costs 4 2 Price index People within 10km of average worker Source: Henderson and Nigmatulina 2016 and Nakamura and others Note: Figure shows a residual-on-residual plot. The x-axis plots the residuals from a regression of the Puga10 Index, log scale (based on Henderson and Nigmatulina 2016), controlling for log GDP per capita, log population, a dummy for Sub-Saharan Africa, and the percent of urban population. The y-axis plots the residuals of the adjusted price index, log scale (based on Nakamura and others 2016) on the same controls. The lower the number of people within 10 kilometers of the average worker, the higher the price index. High wages, high costs of doing business Chapters 1 and 2 point to many aspects of African cities that impose costs on firms. An important additional factor is that firms need to pay high nominal wages to compensate workers for their high cost of living as well as for their poor living conditions. African firms pay significantly higher nominal wages than firms in other regions at comparable levels of real income. Data from World Bank Enterprise Surveys indicate that urban wages in manufacturing are higher in African cities than in other cities at comparable levels of economic development. Manufacturing firms in African cities pay a wage premium of about 15 percent (in nominal terms) over equivalent firms in other developing country cities (figure 3.8). Slightly larger estimates can be found when comparing industrial labor costs across countries with the same data: African firms paid 50 percent more in labor costs than equivalent firms elsewhere (Gelb, Meyer, and Ramachandran 2013). Higher wages may be one reason why Africa s manufacturing sector is so small and has been declining (as a share of global output) since the 1980s (UNIDO 2009). Today, the average firm in Africa hires about 20 percent fewer employees than equivalent firms elsewhere (Iacovone, Ramachandran, and Schmidt 2014). 96
11 Part 2 Africa s Low Urban Development Trap Chapter 3: Costly for households, costly for firms FIGURE 3.8 Nominal manufacturing wages in African cities are higher than in other developing country cities 10 Africa Log nominal wage, 2010 US$ Blantyre Other developing countries Buenos Aires Fitted values Fitted values Santiago Johannesburg Beirut Sao Paulo Belgrade Montevideo Minsk Tunis Djibouti Beijing Bogota San Asuncion Lima Jose Amman Mexico Harare Kingston S Domingo Skopje La Paz Guat Tirana Panama city Dakar Juba Casablanca Tegucigalpa Ulan Batar Sofia Kigali Managua Nairobi Kiev Mumbai Tbilisi Bishkek Cairo Noukchott Dar Jakarta Kabul Yerevan Addis Dhaka Accra Ababa Lusaka Ouaga Vientienne Abidjan Kampala Kinshasa Bamako 6 Conakry Log GDP per Capita, 2010 US$ Log GDP per capita, 2010 US$ Source: Data from World Bank Enterprise Surveys. 97

12 Africa s Cities Opening Doors to the World FIGURE 3.9 Sales revenue per worker in African and other developing-country cities Log sales pwer worker, 2010 US$ Blantyre Kinshasa Africa Other developing countries Fitted values Fitted values Addis Ababa Kigali Ouaga Kampala Harare Nairobi Dakar Noukchott Bamako Kabul Bishkek Dar Dhaka Djibouti Asuncion Casablanca La Paz Guat Tegucigalpa Managua Juba Accra Mumbai Lusaka Cairo Tbilisi Tunis Lima Bogota Amman Panama city Johannesburg Kiev Skopje San Jose Ulan Batar Yerevan Tirana Santiago Belgrade Beijing Mexico Buenos Aires Sao Paulo Montevideo Beirut Kingston S Domingo Minsk Jakarta Conakry Vientienne Abidjan Log GDP per capita, 2010 US$ Source: Data from World Bank Enterprise Surveys. 98
.")


: 17 31. Gelb, A., C. Meyer, and V. Ramachandran. 2013. Does Poor Mean Cheap?")
13 Part 2 Africa s Low Urban Development Trap Chapter 3: Costly for households, costly for firms African firms could afford to pay high wages only if revenue per worker is high. This turns out to be the case, by about 25 percent (figure 3.9). It is therefore important to ask: Do these higher revenues reflect higher productivity (output per worker) or do they simply reflect higher prices? The implications of high costs is that urban wages in manufacturing are higher in African cities than in other cities at comparable levels of economic development. When a city s urban wage is higher than the international wage (for tradables), it makes it harder for the city to break into global markets. In contrast, in the nontradable sector, higher nominal wages may exist in the absence of productivity gains, because, absent competition, firms can pass labor costs on to local consumers (Venables 2016). As labor costs continue to rise in China and other Asian countries, international firms will be searching for new cities in which to invest and set up industrial plants. References Dasgupta, P Measuring the Wealth of Nations. Annual Review of Resource Economics 6 (1): Gelb, A., C. Meyer, and V. Ramachandran Does Poor Mean Cheap? A Comparative Look at Africa s Industrial Labor Costs. Working Paper 325, Centre for Global Development, Washington, DC. Foster, V., and C. Briceno-Garmendia Africa s Infrastructure: A Time for Transformation. Washington, DC: World Bank. Henderson, Vernon, and Dzhamilya Nigmatulina The Fabric of African Cities: How to Think about Density and Land Use. Draft, April 20, London School of Economics. Iacovone, L., V. Ramachandran, and M. Schmidt Stunted Growth: Why Don t African Firms Create More Jobs? Working Paper 353, Center for Global Development, Washington, DC. Nakamura, S., R. Harati, S. Lall, Y. Dikhanov, N. Hamadeh, W. V. Oliver, M. O. Rissanen, and M. Yamanaka Is Living in African Cities Expensive? Policy Research Working Paper 7641, World Bank, Washington, DC. UNIDO (United Nations Industrial Development Organization) Breaking In and Moving Up: New Industrial Challenges for the Bottom Billion and the Middle-Income Countries. Industrial Development Report Vienna: UNIDO. Venables, A. J Breaking into Tradables: Urban Form and Urban Function in a Developing City. University of Oxford, United Kingdom World Bank Stocktaking of the Housing Sector in Sub-Saharan Africa: Challenges and Opportunities. Washington, DC: World Bank. 99


14 Africa s Cities Opening Doors to the World 100
Regional outlook Sub-Saharan Africa 24/11/2015. Share commodities in good exports. Share commodities in goods imports
 Table 1: Economic structure indicators Number of Inhabitants (m.) Size of the economy (in USD bn.) Size of the economy (% of world GDP) Share commodities in good exports Share commodities in goods imports
Millennium Development Goal 1: eradicate extreme poverty and hunger. International poverty line a Share of population below PPP $1.
 3.1 Millennium Development Goal 1: eradicate extreme poverty and hunger International poverty line a Share of population below PPP $1.25 a day Poverty gap ratio at PPP $1.25 a day Share of population below
Table A.LPG1 : TOTAL LPG CONSUMPTION (Best available Estimates)
") Table A.LPG1 : TOTAL LPG CONSUMPTION (Best available Estimates) 1000 MT 1 Burkina Faso 0.509 0.587 0.615 0.606 0.435 0.429 0.691 1.057 1.385 1.698 2.156 2.432 2.888 2 Cape Verde 4.058 4.268 4.988 5.259
Table A.LPG1 : TOTAL LPG CONSUMPTION (Best available Estimates) 1000 MT 1 Burkina Faso 0.509 0.587 0.615 0.606 0.435 0.429 0.691 1.057 1.385 1.698 2.156 2.432 2.888 2 Cape Verde 4.058 4.268 4.988 5.259
A Snapshot of Sanitation and Open Defecation in Africa 2010 Update
 A Snapshot of Sanitation and Open Defecation in 10 Update A regional perspective based on data from the WHO/UNICEF Joint Monitoring Programme for Water Supply and Sanitation UNICEF/NYHQ10-1999/Asselin
Energy Poverty in Africa
 African Energy Commission (AFREC) Paper on Energy Poverty in Africa By Dr. Gilbert NZOBADILA Consultant Energy Policy- AFREC 1 1- Introduction: African background : The African Energy Commission (AFREC)
Structure. Introduction
 1 Introduction Structure Demographic Dynamics in Africa Determinants of the Demographic Transition Human Development Payoffs Jobs Payoffs Economic Growth in Africa Policies to Speed up the Demographic
THE MOST AND LEAST CHILD-FRIENDLY GOVERNMENTS IN AFRICA
 The Most and Least Child-friendly Governments in Africa 5 THE MOST AND LEAST CHILD-FRIENDLY GOVERNMENTS IN AFRICA We must put the best interests of children at the heart of all political and business decision-making,
Fostering healthcare Investments through PPPs. George Uduku Health Systems November 2017
 Fostering healthcare Investments through PPPs George Uduku November 2017 Healthcare Industry : Infrastructure 1/2 There is a wide gap in healthcare infrastructure and a major shortage of healthcare workers
REPORT ON WHO STAFF IN THE AFRICAN REGION. Information Document CONTENTS
 10 July 2009 REGIONAL COMMITTEE FOR AFRICA ORIGINAL: ENGLISH Fifty-ninth session Kigali, Republic of Rwanda, 31 August 4 September 2009 Provisional agenda item 9.5 REPORT ON WHO STAFF IN THE AFRICAN REGION
Entrepreneurial Universities and Private Higher Education Institutions
 Entrepreneurial Universities and Private Higher Education Institutions Professor Moses Oketch University College London, Institute of Education m.oketch@ucl.ac.uk Presentation at International Seminar
Projected Rural Population % (2030) and Rural Population Growth % pa ( )
 and Rural Population Growth % pa ( )") This presentation This presentation Rural Population Growth, 2013-30 (% pa) 4 3 2 Projected Rural Population % (2030) and Rural Population Growth % pa (2013-30) Majority urban; Rural population increasing
This presentation This presentation Rural Population Growth, 2013-30 (% pa) 4 3 2 Projected Rural Population % (2030) and Rural Population Growth % pa (2013-30) Majority urban; Rural population increasing
Africa. Display Transparency 6 on the overhead. Explain to students that Africa is the
 3S 4S 1S 2S 3N 4N Banjul Bissau SIERRA LEONE 5N MADEIRA IS. CANARY IS. (SPAIN) (disputed) Dakar Freetown (PORTUGAL) GAMBIA Bamako Conakry Monrovia Rabat BURKINA FASO 1W Accra Lomé ~ Niamey BENIN Algiers
The Second Japan-Africa Business Forum TICAD and Business: Feedback from the Yokohama Action Plan to the Nairobi Declaration July 25, 2017
 The Second Japan-Africa Business Forum TICAD and Business: Feedback from the Yokohama Action Plan to the Nairobi Declaration July 25, 207 Takeshi Osuga Ambassador, Assistant Minister, Director-General
 10 to 24 year olds as proportion of total population in this Population aged group of countries, Region 10 to 24 years per cent Least developed countries 274,842,000 32.2 Less developed regions 1,595,761,000
REPORT ON WHO STAFF IN THE AFRICAN REGION. Information Document CONTENTS
 6 September 2013 REGIONAL COMMITTEE FOR AFRICA ORIGINAL: ENGLISH Sixty-third session Brazzaville, Republic of Congo, 2 6 September 2013 Agenda item 20.1 REPORT ON WHO STAFF IN THE AFRICAN REGION Information
REPORT ON HUMAN RESOURCES IN WHO IN THE AFRICAN REGION. Information Document CONTENTS INTRODUCTION... 1
 AFR/RC56/INF.DOC/3 12 July 2006 REGIONAL COMMITTEE FOR AFRICA ORIGINAL: ENGLISH Fifty-sixth session Addis Ababa, Ethiopia, 28 August 1 September 2006 Provisional agenda item 10.4 REPORT ON HUMAN RESOURCES
TABLE OF CONTENTS COUNTRY FOCUS: ALGERIA
 Africa Statistics Flash Selected Socio-Economic Indicators on Africa May 218 TABLE OF CONTENTS COUNTRY FOCUS: ALGERIA ---------------------------------------------------------------------------------------------
THE AFRICAN DEVELOPMENT BANK GROUP. At the centre of Africa s transformation
 THE AFRICAN DEVELOPMENT BANK GROUP At the centre of Africa s transformation African Development Bank Group At the centre of Africa s transformation The African Development Bank Group is a multilateral
Countries of the World QTR 3
 As of December 2017 Countries of the World QTR 3 Website: Countries of the World. com https://www.countries-ofthe-world.com/countries-of-north-america.html Website: CIA.gov https://www.cia.gov/index.html
Data Limitations. Index Choices
 Section 3. Annexes The Index is part of a central database and system for collecting data on regional integration. It will capture additional data for indicators that are not part of the Index but that
Poverty eradication means doubling the lowest household incomes globally in just 15 years after they have stagnated for the last years
 $ per person per day (2005 PPP) 1.4 Estimated Global Consumption Floor, 1981-2011, and 2030 Target 1.2 1 0.8 0.6 0.4 0.2 Pre- MDGs MDGs SDGs $1.25-a-day basis $1.00-a-day basis Poverty eradication means
THE AFRICAN DEVELOPMENT BANK GROUP. At the centre of Africa s transformation
 THE AFRICAN DEVELOPMENT BANK GROUP At the centre of Africa s transformation African Development Bank Group The African Development Bank Group is a multilateral development finance institution. It was established
Southern Africa outpaces North Africa in governance performance
 Monday 5 th October 2009 Southern Africa outpaces North Africa in governance performance 2009 Ibrahim Index of African Governance shows that half of Africa s ten best performing countries are in Southern
Ensuring water and sanitation for all Where are we?
 Ensuring water and sanitation for all Where are we? CABRI Peer Review Workshop (Anglophone) on WASH, June 2018 Cape Town Dr Nana Boateng, CABRI Goal 6: Ensure availability and sustainable management of
TABLE OF CONTENTS COUNTRY FOCUS: BENIN
 Africa Statistics Flash Selected Socio-Economic Indicators on Africa March 218 TABLE OF CONTENTS COUNTRY FOCUS: BENIN ------------------------------------------------------------------------------------------------
Money to the People: A Calculation of Direct Dividend Payments in Africa
 Public Disclosure Authorized Public Disclosure Authorized Public Disclosure Authorized Money to the People: A Calculation of Direct Dividend Payments in Africa Marcelo M. Giugale Director Economic Management
Table of CONTENTS. COUNTRY FOCUS: Equatorial Guinea
 Africa Statistics Flash Selected Socio-Economic Indicators on Africa August 217 Table of CONTENTS COUNTRY FOCUS: Equatorial Guinea ---------------------------------------------------------------------------
Cambridge International Examinations Cambridge International Advanced Subsidiary and Advanced Level
 Cambridge International Examinations Cambridge International Advanced Subsidiary and Advanced Level *5153973671-I* TRAVEL AND TOURISM 9395/11 Paper 1 Core May/June 2016 INSERT 2 hours 30 minutes READ THESE
Africa s s Economic Prospect and Challenges
 Africa s s Economic Prospect and Challenges Louis Kasekende Chief Economist, African Development Bank and Sudhir Shetty Sector Director, Poverty Reduction & Economic Management, Africa Region The World
Table of CONTENTS. COUNTRY FOCUS: United Republic of Tanzania
 Africa Statistics Flash Selected Socio-Economic Indicators on Africa December 216 Table of CONTENTS COUNTRY FOCUS: United Republic of Tanzania ------------------------------------------------------------
Financing Sustainable Transport in LLDCs in Africa High Level Meeting October Santa Cruz, Bolivia
 Gylfi Palsson, Lead Transport Specialist and Acting Manager for the LAC Region, World Bank Financing Sustainable Transport in LLDCs in Africa High Level Meeting 13-14 October 2016 - Santa Cruz, Bolivia
Structuring national health systems to deliver better services
 Structuring national health systems to deliver better services Peter Annear pannear@unimelb.edu.au Asia and the Pacific Policy Society Conference 2014 Confronting the Pacific s health challenges Crawford
Somik V. Lall Lead Economist World Bank Group. April 20th, World Resources Institute
 Somik V. Lall Lead Economist World Bank Group April 20th, 2016 @ World Resources Institute CITIES ARE CENTRAL TO ECONOMIC DEVELOPMENT Source: World Development Indicators Why Cities? THE PRODUCTIVITY OF
ATM Deficiencies. Algeria AFI/7 Rec.5/21 FIR Algiers Non-implementation. Angola. Benin. Botswana. Burkina Faso. Burundi. Cameroon
 ATM Deficiencies Algeria AFI/7 Rec.5/21 FIR Algiers Non- of ATC in the upper airspace in the South area (prevision of in 2006). A 31/12/09 U Angola APIRG/13 Conclusion 13/43 Luanda FIR Non-provision of
Air Transport: An Engine to Prosperity
 Air Transport: An Engine to Prosperity Mark Smyth Senior Economist, IATA To represent, lead and serve the airline industry Africa in a Global Economic Context Relatively low shares of GDP, trade and air
Table of CONTENTS. COUNTRY FOCUS: Tunisia
 Africa Statistics Flash Selected Socio-Economic Indicators on Africa October 217 Table of CONTENTS COUNTRY FOCUS: Tunisia ----------------------------------------------------------------------------------------------
Framework for Progressive Destination Competitiveness
 Sub-Saharan Africa Framework for Progressive Destination Competitiveness SSA Countries by Tourism Development Level and World Bank Income Ranking Tourism development level Pre-emerging Low income Central
List of medicines for which protection against trade diversion is granted under. Regulation 953/2003
 List of medicines for which protection against trade diversion is granted under Regulation 953/2003 List of medicines EPIVIR ORAL SOLUTION 10 mg/ml x 240 ml... 2 TRIZIVIR 750 mg x 60... 3 EPIVIR 150 mg
21st ACI AFRICA REGION ANNUAL ASSEMBLY CONFERENCE AND EXHIBITION
 21st ACI AFRICA REGION ANNUAL ASSEMBLY CONFERENCE AND EXHIBITION LIVINGSTONE, ZAMBIA 28 AUGUST 2012 Angela Gittens Director General ACI World 1 Airports Council International ACI AFRICA ACI World 577 members
REPORT ON WHO STAFF IN THE AFRICAN REGION. Information Document CONTENTS
 11 July 2014 REGIONAL COMMITTEE FOR AFRICA ORIGINAL: ENGLISH Sixty-four session Cotonou, Republic of Benin, 1 5 September 2014 Provisional agenda item 18.1 REPORT ON WHO STAFF IN THE AFRICAN REGION Information
Africa the potential for growth
 Africa the potential for growth Ian Taylor President & CEO, Vitol March 2015 The oil price a long term view 2010 to date - $94 2000s - $49.6 1980s - $25.8 1990s - $18.3 1970s $10.5 1 Q1-14 Q2-14 Q3-14
FAMILY PLANNING TRENDS IN SUB SAHARAN AFRICA:
 FAMILY PLANNING TRENDS IN SUB SAHARAN AFRICA: PROGRESS, PROSPECTS AND LESSONS LEARNED Mona Sharan, Saifuddin Ahmed, John May & Agnes Soucat Background : Sub Saharan Africa Highest TFR (5.1) compared to
The A Z of African Countries Notebooking Pages with Backline Maps. Preface
 Preface This book has been created as the basis for unit studies on any (or all) African countries. Whilst each country has available a separate and comprehensive Unit Study, some educators prefer to start
1 What is the African Economic Outlook Project? 2 African Economic Performance: Multifaceted Growth. 3 Africa and Globalization
 African Economic Outlook 2007 Measuring the Pulse of Africa Nicolas Pinaud, OECD Development Centre 经合组织 发展中心 Standard Chartered & the OECD Development Centre AFRICA AND CHINA: ECONOMIC AND BUSINESS PERSPECTIVES
Emerald Group Publishing. The Horizon and Beyond with the African Library Summit
 Emerald Group Publishing The Horizon and Beyond with the African Library Summit Presented by Rejaene van Dyk Account Management Executive: Sub-Sahara Africa 05 July 2013, Unisa Senate Hall, South Africa
APC TV White Spaces and Africa. Russell Southwood, CEO, Balancing Act
 APC TV White Spaces and Africa Russell Southwood, CEO, Balancing Act www.balancingact-africa.com @BalancingActAfr Overall Impact of the Transition Better use of frequencies currently used for analogue.
2015 CRS ICT4D CONFERENCE INTRODUCING THE BANDWIDTH AGGREGATION BUYING PROGRAM
 2015 CRS ICT4D CONFERENCE INTRODUCING THE BANDWIDTH AGGREGATION BUYING PROGRAM InsideNGO and NetHope s first connectivity demand-aggregation program, implemented by Hutchison Global Communications (HGC)
Economic Partnership Agreements (EPA) Lucia BALOGOVA European Commission Directorate-General Trade
 Lucia BALOGOVA European Commission Directorate-General Trade") Economic Partnership Agreements (EPA) Lucia BALOGOVA European Commission Directorate-General Trade 1 Overview Background Ambitions and objectives Challenges Key development aspects EPA scope Alternatives
Economic Partnership Agreements (EPA) Lucia BALOGOVA European Commission Directorate-General Trade 1 Overview Background Ambitions and objectives Challenges Key development aspects EPA scope Alternatives
The political economy of resource discoveries. Prof. Michael L. Ross UCLA Department of Political Science September 21, 2011
 The political economy of resource discoveries Prof. Michael L. Ross UCLA Department of Political Science September 21, 2011 Overview 1. Oil and mineral production is spreading to more low-income countries;
JICA s activity in the Northern Economic Corridor. 7 Dec 2015, Nairobi
 JICA s activity in the Northern Economic Corridor 7 Dec 2015, Nairobi Contents 1. Japan s commitment on corridor development 2. On-going support on corridor development 3. JICA s activity on Northern Economic
Germany s bilateral development cooperation with Sub-Saharan Africa: An Agenda for Reform
 Germany s bilateral development cooperation with Sub-Saharan Africa: An Agenda for Reform Limited share of development cooperation in the context of donors ODA net payments (incl. debt r elief ) f or SSA
AFSEC Workshop Johannesburg 27 March 2017
 Evah Oduor IEC-AFRC Director AFSEC Workshop Johannesburg 27 March 2017 INTERNATIONAL ELECTROTECHNICAL COMMISSION About the IEC Africa Quality Infrastructure IEC-AFRC Mission Recommendations Conclusion
Are$African$Governments$Ready$3$For$Global$Post$2015$Sustainable$Development$Goals?$And$The$Evolving$AU$Africa$2063$Development$Agenda?
 symbol sign for no TV television allowed - Google Search https://www.google.co.uk/search?q=colour+symbol+for+elect... Information & Analysis on Health, Population, Human & Social Development Are$African$Governments$Ready$$For$Global$Post$0$Sustainable$Development$Goals?$And$The$Evolving$AU$Africa$0$Development$Agenda?$
CLIMATE DIAGNOSTIC BULLETIN FOR AFRICA
 CLIMATE DIAGNOSTIC BULLETIN FOR AFRICA N 02 FEBRUARY, 2019 OCEAN-ATMOSPHERE MONITORING & PREDICTION 1 SUMMARY FEBRUARY 2019 The precipitation for the month of February, 2019 was above to well above average
EARTHQUAKE HAZARD ZONES - AFRICA
 GAP.15.2.3.1 A Publication of Global Asset Protection Services LLC EARTHQUAKE HAZARD ZONES - AFRICA Algeria Hazard Zones... 1,2,3,4,5,6 Algiers... 6 Oran... 5 Constantine... 5 100 Constitution Plaza, Hartford,
Ibrahim Index of African Governance SUB-CATEGORY INSIGHTS RULE OF LAW MO IBRAHIM FOUNDATION
 2015 Ibrahim Index of African Governance SUB-CATEGORY INSIGHTS RULE OF LAW MO IBRAHIM FOUNDATION Contents Rule of Law within the IIAG Rule of Law Key Findings Rule of Law Spotlight > Country and group
Section 1. The Index
 Section 1. The Index Measuring where Africa stands on regional gives an assessment of what is happening across the continent and is an important way of highlighting where the gaps are. It is a dynamic,
AGRICULTURE THE BIG PICTURE
 AGRICULTURE THE BIG PICTURE AEASA 2015 (30 Sept 2015), Parys North West NAMC and Tralac Collaboration By: B Nyhodo, E Williams and R Sandrey Presentation outline Introduction Africa Africa share of world
How much will the SDGs cost and can developing countries afford them? Chris Hoy, Independent Consultant and PhD Econ. Candidate
 How much will the SDGs cost and can developing countries afford them? Chris Hoy, Independent Consultant and PhD Econ. Candidate To implement the SDGs, national governments and aid donors need to know 1.
Population (million) % of Africa
 % of Africa") FAO. Irrigation in in figures: AQUASTAT Survey 2005 TABLE 1 al distribution of cultivable and cultivated areas Cultivable areas Cultivated areas in 2002 In cultivable areas (ha) (ha) (%) Northern 65 320
FAO. Irrigation in in figures: AQUASTAT Survey 2005 TABLE 1 al distribution of cultivable and cultivated areas Cultivable areas Cultivated areas in 2002 In cultivable areas (ha) (ha) (%) Northern 65 320
GDP STRUCTURE AND ECONOMIC PERFORMANCE IN SUB-SAHARAN COUNTRIES
 ACTA UNIVERSITATIS AGRICULTURAE ET SILVICULTURAE MENDELIANAE BRUNENSIS Volume 62 76 Number 4, 2014 http://dx.doi.org/10.11118/actaun201462040729 GDP STRUCTURE AND ECONOMIC PERFORMANCE IN SUB-SAHARAN COUNTRIES
Analytical Chapters Regional Economic Outlook for Sub-Saharan Africa. IMF, African Department May 2013
 Analytical Chapters Regional Economic Outlook for Sub-Saharan Africa IMF, African Department May 213 Outline of Presentation Key theme: How to facilitate building growth momentum in a multi-speed and uncertain
Bridging the Gap: Benchmarking Utilities in Africa
 Bridging the Gap: Benchmarking Utilities in Africa Rosemary Rop World Water Week Stockholm, Focus Africa: August 23 rd 2011 Water and Sanitation Program Global Status: Water and Sanitation Access Gaps
Improving the Investment Climate in Sub-Saharan Africa
 Improving the Investment Climate in Sub-Saharan Africa NEPAD OECD Conference Brazzaville, the 12 th of December, 2006 Nigel Twose Senior Manager, FIAS-PEP Africa World Bank Group HE CHALLENGE AT HAND GDP/Capita
Supporting Road Infrastructure Development to Connect Africa: Actions to be taken under the TICAD Process and Japan s Initiatives
 Supporting Road Infrastructure Development to Connect Africa: Actions to be taken under the TICAD Process and Japan s Initiatives Hajime Ueda Principal Deputy Director, Country Assistance Planning Division,
REPORT ON WHO STAFF IN THE AFRICAN REGION. Information Document CONTENTS
 22 August 2016 REGIONAL COMMITTEE FOR AFRICA ORIGINAL: ENGLISH Sixty-sixth session Addis Ababa, Federal Democratic Republic of Ethiopia, 19 23 August 2016 Agenda item 21.11 REPORT ON WHO STAFF IN THE AFRICAN
2017 ACCPA Compliance List
 Most Compl iance-focused Banks in Af rica info@acc-pa.org www.acc-pa.org About ACCPA The Association of Certified Compliance Professionals in Africa (ACCPA) is the continental body for compliance professionals
Case 2:16-cv RGK-JC Document 45 Filed 03/21/16 Page 2 of 3 Page ID #:2363
 Case 2:16-cv-00862-RGK-JC Document 45 Filed 03/21/16 Page 2 of 3 Page ID #:2363 Case 2:16-cv-00862-RGK-JC Document 45-1 Filed 03/21/16 Page 1 of 7 Page ID #:2365 EXHIBIT 1 Case 2:16-cv-00862-RGK-JC Document
Members of the Sub-committees of the Committee of Ambassadors
 Published on ACP (http://www.acp.int) Home > Printer-friendly PDF > Printer-friendly PDF Members of the Sub-committees of the Committee of Ambassadors Members of the Sub-committees of the Committee of
CASM (Africa) and the African Mining Partnership. Jon Hobbs - CASM (Global) Chairman Linus Adie - CASM (Africa) Chairman
 and the African Mining Partnership. Jon Hobbs - CASM (Global) Chairman Linus Adie - CASM (Africa) Chairman") CASM (Africa) and the African Mining Partnership AMP - Ministerial Meeting 12 August 2005, Africa Hall, ECA, Addis Ababa Jon Hobbs - CASM (Global) Chairman Linus Adie - CASM (Africa) Chairman Artisanal
CASM (Africa) and the African Mining Partnership AMP - Ministerial Meeting 12 August 2005, Africa Hall, ECA, Addis Ababa Jon Hobbs - CASM (Global) Chairman Linus Adie - CASM (Africa) Chairman Artisanal
Trade Blocs, Development Hotspots and Changing Trade Patterns. Breakbulk Africa, 18 th February 2015
 Trade Blocs, Development Hotspots and Changing Trade Patterns Breakbulk Africa, 18 th February 2015 Background Multiplicity of Trade Blocs in ever convergent economic spaces; Need for harmonisation of
January 22 nd, Ede Ijjasz-Vasquez Senior Director Social, Urban, Rural & Resilience The World Bank
 TICAD Seminar Series 4 th Seminar Land Use Planning & Spatial Development for Smart Growth in African Cities January 22 nd, 2016 Ede Ijjasz-Vasquez Senior Director Social, Urban, Rural & Resilience The
SUB-SAHARAN AFRICA (2): POPULATION AND SETTLEMENT GEOGRAPHY
: POPULATION AND SETTLEMENT GEOGRAPHY") SUB-SAHARAN AFRICA (2): POPULATION AND SETTLEMENT GEOGRAPHY 1. Introduction 2. Demographics: population growth and AIDS 3. Rural settlement patterns 4. Urban structures 5. Globalization and Africa: the
SUB-SAHARAN AFRICA (2): POPULATION AND SETTLEMENT GEOGRAPHY 1. Introduction 2. Demographics: population growth and AIDS 3. Rural settlement patterns 4. Urban structures 5. Globalization and Africa: the
Dealing with the Gathering Clouds
 Dealing with the Gathering Clouds Regional Economic Outlook for sub-saharan Africa Christian Beddies Resident Representative, Zimbabwe International Monetary Fund November 11, 2015 1 Percent Growth in
Global IP Infrastructure
 Study Visit: Intellectual Property Focal Persons of the African Regional Economic Communities and Executive Bodies of the African Union Global IP Infrastructure Gregory Sadyalunda Project Manager IP Office
Accelerating Economic Growth in Africa
 Accelerating Economic Growth in Africa Japan International Cooperation Agency Africa Department Director General Kazunori Oshiyama Strategies for Accelerating Economic Growth Major Corridors and Japan
Programme planning levels for regular resources in 2017 (10 January 2017)
") planning for regular resources in (10 January ) In accordance with Executive Board decision 2008/15, following is the country breakdown of regular resources planning for. The planning have been computed
planning for regular resources in (10 January ) In accordance with Executive Board decision 2008/15, following is the country breakdown of regular resources planning for. The planning have been computed
Africa at a glance. Annual real GDP growth ( average): 4.97% Official development assistance (2010): $48 billion
: 4.97% Official development assistance (2010): $48 billion") Africa at a glance Population (212): 1,38 million Annual real GDP growth (25-212 average): 4.97% Official development assistance (21): $48 billion Net foreign direct investment (211): $43 billion Sources:
Africa at a glance Population (212): 1,38 million Annual real GDP growth (25-212 average): 4.97% Official development assistance (21): $48 billion Net foreign direct investment (211): $43 billion Sources:
The Galileo Galilei Institute for Theoretical Physics (GGI) plans to organize and host small-size advanced workshops in theoretical particle physics
 plans to organize and host small-size advanced workshops in theoretical particle physics") The Galileo Galilei Institute for Theoretical Physics (GGI) plans to organize and host small-size advanced workshops in theoretical particle physics in its broadest sense. Each workshop will be devoted
The Galileo Galilei Institute for Theoretical Physics (GGI) plans to organize and host small-size advanced workshops in theoretical particle physics in its broadest sense. Each workshop will be devoted
AFRICA EASTERN AFRICA COMORO ISLANDS 1978-PRESENT. BURUNDI 1962-PRESENT Prior to 1962 see Rwanda
 EASTERN BURUNDI 1962-PRESENT Prior to 1962 see Rwanda COMORO ISLANDS 1978-PRESENT FRENCH TERRITORY 1950-1978 For period 1912-1950 see Madagascar and Comoro Islands Precedent Countries- Continued ANJOUAN
African Economic Outlook 2018
 African Development Bank Group African Economic Outlook 2018 Download the full report at: https://www.afdb.org/en/knowledge/publications/africaneconomicoutlook/ Africa Business Forum Johannesburg, South
The Changing Wealth of Nations 2018
 The Changing Wealth of Nations 2018 Building a Sustainable Future Editors: Glenn-Marie Lange Quentin Wodon Kevin Carey Wealth and Long Term Prosperity and Well-Being well-being National Income / GDP Total
International Civil Aviation Organization African Flight Procedure Programme
 International Civil Aviation Organization African Flight Procedure Programme REPORT OF THE GLOBAL ACTIVITIES CONDUCTED SINCE JUNE 2014 1. INTRODUCTION 1.1 The objective of this paper is to report on the
Per Capita Income Guidelines for Operational Purposes
 FROM: The President May 30,2012 Per Capita Income Guidelines for Operational Purposes The per Gross National Income (GNI) guidelines covering the Civil Works Preference, IDA Eligibility, IBRD Terms and
Strengthening ethics and regulatory mechanisms in sub-saharan Africa through partnerships
 Strengthening ethics and regulatory mechanisms in sub-saharan Africa through partnerships 15 December 2008 Rome Charles S Mgone EDCTP Executive Director EDCTP Mission Alleviate poverty by accelerating
"Tourism and Sustainable Development: Lessons from the Caribbean Experience for Sub-Saharan Africa"
 Florida International University FIU Digital Commons African & African Diaspora Studies Program Faculty Scholarly Presentations African and African Diaspora Studies 8-23-2012 "Tourism and Sustainable Development:
IDA Country Allocations for FY16
 Public Disclosure Authorized Public Disclosure Authorized Public Disclosure Authorized IDA Allocations for FY16 1. The IDA17 replenishment arrangements provide that IDA country allocations be made available
Regional Workshop Middle East & Africa Sub-Saharan Market: Sustaining Palm Oil Market Growth and Opportunities
 Regional Workshop 2014- Middle East & Africa Sub-Saharan Market: Sustaining Palm Oil Market Growth and Opportunities Kamal Azmi Kamarudin MPOC Regional Office - Durban Regional Outlook Growth in Sub-Saharan
IMPERIAL LOGISTICS AFRICA DISTRIBUTORSHIPS
 IMPERIAL LOGISTICS AFRICA DISTRIBUTORSHIPS Africa RTM Capabilities Updated version January 2014 1 Imperial Logistics Current African Footprint Cape Verde Wester n Sahara Mauritania Senegal The Gambia-
Sub-Saharan Africa s Potentials, Achievers and Champions. Thalma Corbett
 Sub-Saharan Africa s Potentials, Achievers and Champions Thalma Corbett 18 February 2015 Agenda Relative Sizes of Economies and Recent Rebasings Key External and Domestic Risks Faced by Africa Potentials,
IDA Country Allocations for FY15
 Public Disclosure Authorized Public Disclosure Authorized Public Disclosure Authorized IDA Allocations for FY15 1. The IDA17 replenishment arrangements provide that IDA country allocations be made available
ECONOMIC PARTNERSHIP AGREEMENTS. Overview of State of Play
 ECONOMIC PARTNERSHIP AGREEMENTS Overview of State of Play Following the expiry of the Cotonou trade regime and the WTO waiver which covered it on 31 December 2007, trade disruption for the ACP was minimised
7/27/2010. Regions of Subsaharan Africa. SUBSAHARAN AFRICA II (Chapter 6, pages ) Southern Africa. South Africa: Peaceful Change from Apartheid
 Southern Africa. South Africa: Peaceful Change from Apartheid") SUBSAHARAN AFRICA II (Chapter 6, pages 209-227) Regions of Subsaharan Africa Southern Africa 10 countries, 6 of them landlocked Congo Basin marks northern limit Plateau country Rich in natural resources
SUBSAHARAN AFRICA II (Chapter 6, pages 209-227) Regions of Subsaharan Africa Southern Africa 10 countries, 6 of them landlocked Congo Basin marks northern limit Plateau country Rich in natural resources
WHY AFRICA? BY BENOIT LA SALLE December 2014
 WHY AFRICA? BY BENOIT LA SALLE December 2014 AFRICA IS THE FUTURE 2 1950 1960 1970 1980 1990 2000 2010 2020 2030 2040 2050 2060 2070 2080 2090 2100 (THOUSANDS) WORKING-AGE POPULATION WORLDWIDE 7 000 000
Trade Facilitation Conference on New Trends in Trade Facilitation. June 16, Dominique Njinkeu
 Trade Facilitation Conference on New Trends in Trade Facilitation June 16, 2011 Dominique Njinkeu Structure Introduction: Connect to compete Performance measurement : Transport Corridors: observatory Border
WORLD PRESS FREEDOM INDEX 2012
 WORLD PRESS FREEDOM INDEX 2012 1 Finland -10,00 = - Norway -10,00 = 3 Estonia -9,00 - Netherlands -9,00 5 Austria -8,00 6 Iceland -7,00 - Luxembourg -7,00 8 Switzerland -6,20 9 Cape Verde -6,00 10 Canada
Opportunities and Risks in Africa
 Opportunities and Risks in Africa Africa is not a country Note: Graphic layout for visualization only (some countries are cut and rotated) Source: Creative Commons. Africa at a glance 212 Total GDP: $2.1
Africa South of the Sahara
 Africa South of the Sahara MAURITANIA MALI NIGER SENEGAL CHAD SUDAN ERITREA GAMBIA BURKINA- GUINEA FASO DJIBOUTI GUINEA- CÔTE NIGERIA BISSAU CENTRAL ETHIOPIA D IVOIRE SIERRA AFRICAN REP. BENIN LEONE
Growing Africa Cities Helping you size the market
 Growing Africa Cities Helping you size the market October, 2013 1 In a world struggling for growth, Africa stands out 2 The rate of growth is significant in all African countries EIU forecast for GDP Growth
OSBP Development and Operationalization in Africa
 4th WCO Global AEO Conference 15 March 2018, Kampala, Uganda OSBP Development and Operationalization in Africa Tomomi TOKUORI, TICAD Advisor assigned to DBSA Japan International Cooperation Agency (JICA)