Coos County Transportation System Plan
|
|
|
- Arleen McLaughlin
- 5 years ago
- Views:
Transcription
1

2 Coos County Transportation System Plan March 2011 Prepared for Coos County 250 N. Baxter Coquille, OR Prepared by David Evans and Associates, Inc SW River Parkway Portland, Oregon
3 ACKNOWLEDGMENTS This Coos County Transportation System Plan (TSP) update was funded by Coos County and the Oregon Department of Transportation (ODOT). The goals, objectives, and overall decision process was guided by the County and ODOT management team, as well as supporting members of the Technical Advisory Committee (TAC), Citizens Advisory Committee (CAC), and Consultant Team identified below. Coos County Management Team Patty Evernden, Planning Director John Rowe, Roadmaster Advisory Committee Members (TAC & CAC) Bruce Bennett, Coos County Area Transit Rocky Buckles, Thomas & Sons/C.B.&Y Rodger Craddock, Coos County Michelle Hampton, City of Bandon Sharon Shinnick, Coos County Road Department George Gant, Coos County Planning Kevin Stufflebean, Coos County Board of Commissioners Charlie Waterman, Coos County Planning Terry Mai, Coquille Chamber of Commerce Joanna Lyons, Coos County Oubonh White, Coos County Counsel Joanna Lyons, Coos County Counsel Timm Slater, Coos Bay/Charleston/North Bend COC Terrence O Conner, City of Coquille ODOT Management Team Mike Baker, Region 3 Planning Manager Allie Krull, Project Manager Consultant Team David Evans and Associates, Inc. Adam Argo, AICP Gigi Cooper, AICP Jennifer Danziger, P.E. Joshan Rohani, P.E. John Stutesman, AICP Anneke Van der Mast, AICP
4 TABLE OF CONTENTS Page 1. INTRODUCTION Study Area Planning Process GOALS AND OBJECTIVES Goal 1: Mobility Goal 2: Multimodal System Goal 3: Livability Goal 4: Safety Goal 5: Funding EXISTING TRANSPORTATION SYSTEM INVENTORY Roadway Network Bicycle and Pedestrian Facilities Public Transit Services Air Facilities Water Facilities Rail Facilities Pipelines EXISTING TRANSPORTATION SYSTEM DEFICIENCIES Traffic Volumes Traffic Operations Crash History Demographics FUTURE TRANSPORTATION SYSTEM DEFICIENCIES Demographics Future Traffic Volumes Traffic Operations TRANSPORTATION SYSTEM PLAN Roadway System Plan Pedestrian and Bicycle Plan Public Transportation Plan Rail Plan Airport Plan Pipeline Plan Water Plan Table of Contents i
5 TABLE OF CONTENTS (continued) Page 7. TRANSPORTATION FINANCING Existing Budgets Overall Project Needs Evaluation of County Funding Needs and Potential Revenue Potential Funding Sources Expiring and Unlikely Funding Sources Funding Strategy APPENDIX Table of Contents ii
6 LIST OF TABLES Page Table 3-1. Summary of Roadway Mileage by Jurisdiction Table 3-2. Major Collectors in Coos County Table 3-3. Minor Collectors in Coos County Table 3-4. Pavement Conditions Inventory County Roads Table 3-5. County Roads with Poor Pavement Conditions Table 3-6. State Highways Table 3-7. Pavement Conditions Inventory State Highways Table 3-8. Functionally Obsolete and Structurally Deficient County Bridges Table 3-9. Functionally Obsolete and Structurally Deficient State Bridges Table Rural Paved Shoulder Inventory on State Highways in Coos County Table Coos County Airports Table 4-1. Traffic Volume Characteristics from ATR Sites within and near Coos County Table 4-2. State Highways Operational Standards Table 4-3. Summary of Two-Lane Highway Operations Existing Condition (2008) Table 4-4. Summary of Intersection Operations Existing Condition (2008) Table 4-5. Crash History for County Roadways ( ) Table 4-6. Crash History for State Highways ( ) Table 4-7. Historic Crash Rates for State Highways Table 4-8. SPIS and SIP Locations ( ) US Table 4-9. SPIS and SIP Locations ( ) OR Table STIP and SIP Locations ( ) OR 42S Table SPIS and SIP Locations ( ) OR Table SPIS and SIP Locations ( ) OR Table Coos County Population Table Coos County Non-Farm Employment Data Table Coos County Journey-to-Work Trips Table Coos County Travel Time to Work Table Coos County Departure to Work Table of Contents iii
7 LIST OF TABLES (continued) Page Table 5-1. Coos County Population and Employment Forecasts Table 5-2. Summary of Two-Lane Highway Operations Future Condition (2030) Table 5-3. Summary of Intersection Operations Future Condition (2030) Table 6-1. County Road Rural Design Standards Table 6-2. County Road Design Standards Within UGBs and Urban Unincorporated Communities Table 6-3. State Highways Classification Table 6-4. Proposed Roadway Surface Improvements Table 6-5. State Highway Segments to be Improved Table 6-6. County Bridges to be Rehabilitated or Replaced Table 6-7. State Bridges to be Rehabilitated or Replaced Table 6-8. Natural Hazards Mitigation Table 6-9. Roadway Safety Projects State Highways Table County Road Safety Table Other System Improvements Table Bicycle and Pedestrian Improvements Table Public Transportation Improvements Table 7-1. Coos County Road Revenue Sources, Fiscal Years Table 7-2. County TSP Project Cost Summary Table 7-3. County TSP Project Cost Summary Table 7-4. County Revenues and Expenses, Fiscal Years : High Priority Projects Table 7-5. Medium- and Long-Term Estimated County Revenues and Expenses Table of Contents iv
8 LIST OF FIGURES Follows Page Figure 1-1. Existing Roadway Network (State and County) Figure 1-2. Coos County General Zoning and Urban Growth Boundaries Figure 3-1. Coos County Functional Classification Figure 3-2. Coos County Bridge Inventory Figure 3-3. Coos County Bicycle and Pedestrian System Figure 3-4. Coos County Air, Rail, and Water Systems Figure Average Daily Traffic Volumes in Coos County Figure Crashes by Collision Type: County Roadways Figure Crashes by Collision Type: State Highways Figure 4-4. Identified Safety Locations Figure Average Daily Traffic Volumes in Coos County Figure 6-1. Coos County Functional Classification Figure 6-2: Coos County Street Standards Figure 6-3: Coos County Street Standards Within UGBs and Urban Unincorporated Communities Figure 6-4: Pavement Improvement Projects Figure 6-5: Bridge Improvement Projects Figure 6-6: Natural Hazard Mitigation Projects Figure 6-7: Roadway Safety Projects Figure 6-8: Other System Improvement Projects Figure 6-9: Bicycle and Pedestrian System Improvement Projects Table of Contents v
9 LIST OF ACRONYMS ADT Average Daily Traffic ARRA American Recovery and Reinvestment Act CAC Citizen Advisory Committee CCAT Coos County Area Transit CIP Capital Improvement Plan CORP Central Oregon and Pacific Railroad DHV Design Hourly Volume FTA Federal Transit Authority HBRR Highway Bridge Replacement and Rehabilitation HCM Highway Capacity Manual HDM Highway Design Manual HEP Hazard Elimination Program IOF Immediate Opportunity Fund JTA Jobs and Transportation Act LID Local Improvement Districts LOS Level of Service MP Milepoint MPO Metropolitan Planning Organization NBI National Bridge Inventory OAR Oregon Administrative Rule OCBR Oregon Coast Bike Route ODOT Oregon Department of Transportation OEA Office of Economic Analysis OED Oregon Employment Department OHP Oregon Highway Plan ORS Oregon Revised Statutes OTIA Oregon Transportation Investment Act PCI Pavement Condition Index SDC System Development Charge SHSP Strategic Highway Safety Plan SIP Safety Investment Program SPIS Safety Priority Index System SPWF Special Public Works Fund STIP Statewide Transportation Improvement Program STP Surface Transportation Program SWORA Southwest Oregon Regional Airport TAC Transportation Advisory Committee TPAU Transportation Planning Analysis Unit TPR Transportation Planning Rule TSP Transportation System Plan UGB Urban Growth Boundary V/C Volume-to-Capacity Table of Contents vi
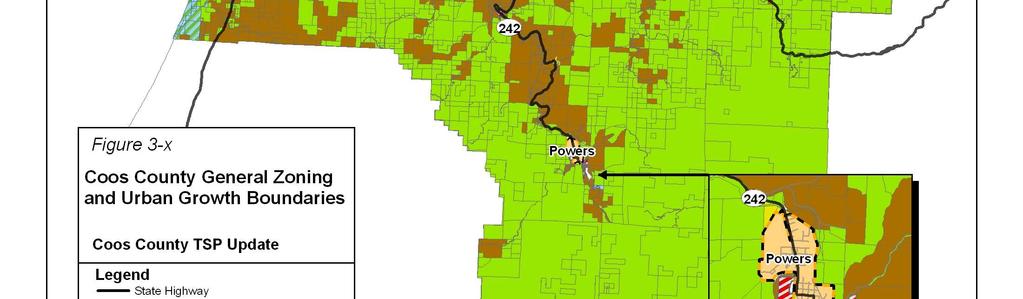
10 1. INTRODUCTION The Coos County Transportation System Plan (TSP) guides the management of existing transportation facilities and the design and implementation of future facilities for the next 20 years. This Transportation System Plan constitutes the transportation element of the County s Comprehensive Plan and satisfies the requirements of the Oregon Transportation Planning Rule established by the Department of Land Conservation and Development. It identifies and prioritizes transportation projects for inclusion in the Oregon Department of Transportation s (ODOT s) Statewide Transportation Improvement Program (STIP). Study Area Figure 1-1 shows a map of Coos County, including boundaries for each incorporated city. The study area for the TSP includes all areas of the county lying outside of city urban growth boundaries (UGBs). The roadway network within Coos County serves many modes of travel, including motor vehicles, bicycles, pedestrians, transit, and freight. It connects communities, serves adjacent land uses, and provides access to other modes of travel as well. Topographically, Coos County is a complex mix of undulating mountains and winding rivers. In this rugged terrain, the road development typically follows the natural course of least resistance. Thus, many roads follow streams and rivers as they wind from their sources to their deltas. The riverbeds provided flatter areas within which to build roads and it was quite natural for the roadway network to follow these areas. Figure 1-2 illustrates the general zoning in Coos County. The majority of the county is zoned as resource lands (Forest, Exclusive Agriculture, Open Space/Natural Use) but there is some land zoned for development (Commercial Industrial, Rural Residential, Resort), particularly close in to the cities. Planning Process The Coos County TSP was developed through a series of technical analyses combined with systematic input and review by the Transportation Advisory Committee (TAC), Citizens Advisory Committee (CAC), ODOT, and the public. The committees consisted of staff, elected and appointed officials, residents, and business people from the county. Key elements of the process include: Existing Plans Policies Review (Appendix) Goals and Objectives (Chapter 2) Existing Transportation System Inventory and Deficiencies (Chapters 3 and 4) Future Transportation System Deficiencies(Chapter 5) Transportation System Plan (Chapter 6) Funding Options and Financing Plan (Chapter 7) Introduction 1-1

11 1-1

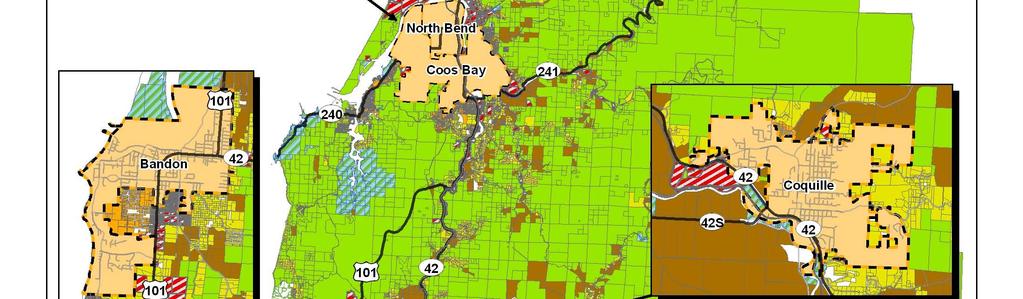
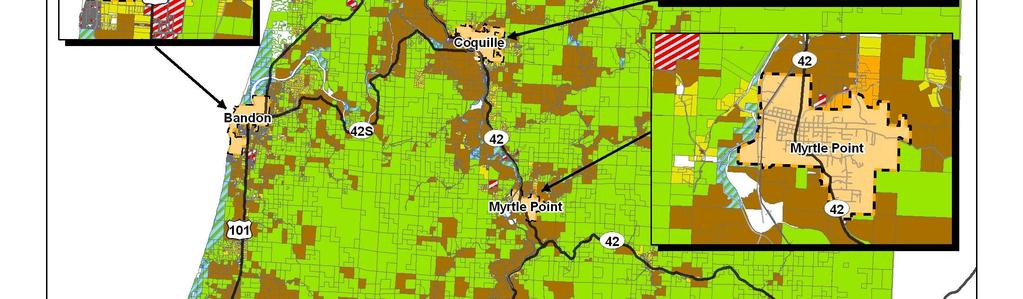

12 1-2
13 Once adopted, the TSP will bring the county into compliance with the Transportation Planning Rule (TPR). In addition to the plan document, the necessary comprehensive plan amendments and supporting ordinances to implement the TSP will be identified. This will help Coos County to more effectively focus on identified goals and objectives by establishing a consistent planning framework in alignment with community and state goals and policies. Community Involvement Community involvement is an integral component in the development of a TSP. Several different techniques were utilized to involve the local jurisdictions, ODOT, and the general public. A Transportation Advisory Committee (TAC) provided guidance on technical issues and direction regarding policy issues to the consultant team. Staff members from the local jurisdictions and ODOT served on this committee. This group met six times during the course of the project. A Citizens Advisory Committee (CAC) comprised of local stakeholders from businesses, the public, and agencies, also provided input and feedback. This group was contacted at the beginning of the project to discuss transportation needs and issues facing Coos County, and also at key milestones throughout the planning process. Another part of the community involvement effort consisted of community meetings within Coos County. During these meetings, the general public was invited to learn about the TSP planning process and provide input on transportation issues and concerns. Goals and Objectives Based on input from the TAC and stakeholders, goals and objectives were defined for the TSP. These goals and objectives were used to make decisions about various potential improvement projects. They are described in Chapter 3. Review of Existing Plans and Policies To begin the planning process, all applicable Coos County transportation and land use plans and policies were reviewed and an inventory of public facilities was conducted. The purpose of these efforts was to understand the history of transportation planning in the county, including the street system improvements planned and implemented in the past, and how the county is currently managing its ongoing development. Existing plans and policies are described in the Appendix of this report. The following state documents were reviewed as they relate to the development of TSPs or Coos County transportation facilities: Transportation Planning Rule - Statewide Planning Goal 12 and OAR 660, Division 12 OAR 734, Division 51 (Highway Approaches, Access Control, Spacing Standards and Medians) (Amended 2007) Introduction 1-2
14 Oregon Transportation Plan (2006) Oregon Highway Plan (1999, Amended July 2006) Highway Design Manual (HDM) (2003, Revised 2008) Oregon Bicycle and Pedestrian Plan (1995) Oregon Transportation Safety Action Plan (2004) Oregon Aviation Plan (2000) Oregon Rail Plan (2001) Oregon Public Transportation Plan (1997) Statewide Transportation Improvement Program ( ) Existing Transportation System Inventory The inventory of existing facilities catalogs all modes of transportation in the current system. The results of the inventory are described in Chapter 3, while Chapter 4 describes how the system operates. Future Transportation System Demands The TPR requires the TSP to address a 20-year forecasting period. The overall forecasting process and identified deficiencies are described in Chapter 5. Transportation System Plan The Transportation System Plan addresses each mode of transportation and provides an overall implementation program. The street system plan was developed from the forecasting and potential improvement evaluation described above. The bicycle and pedestrian plans were developed based on current usage, land use patterns, and the requirements set forth by the Transportation Planning Rule. The public transportation, air, water, rail, and pipeline plans were developed based on discussions with the owners and operators of those facilities. Chapter 6 details the plan elements for each mode. Funding Options Coos County has developed a financially-feasible and prioritized list of transportation projects to implement over the 20-year planning period. Chapter 7 summarizes existing budgets; funding sources available from the local, state and federal levels of government; and the appropriateness of the available sources to fund specific projects. This is followed by a funding strategy intended to assist Coos County s to fund the recommended facility improvements. Introduction 1-3
15 2. GOALS AND OBJECTIVES The Coos County Comprehensive Plan includes the following transportation goal: Coos County shall strive to provide and encourage a transportation system that promotes safety and convenience for citizens and travelers and that strengthens the local and regional economy by facilitating the flow of goods and services. This overarching Comprehensive Plan goal provides a summary of who is served by the county transportation system and how the transportation service should be provided. Citizens of the county, travelers to and through the area, and freight transporters must all be served by the system and, although not specifically called out, all modes of travel should be safe and as convenient as possible. The goals and objectives in this TSP provide the guiding principles for the planning and management of the Coos County transportation system. They were developed from the overall transportation goal and applicable county and state land use and transportation planning regulations. Goal 1: Mobility Plan and develop a roadway system that links communities, neighborhoods, and businesses and addresses the existing and future transportation needs of moving both people and goods in throughout the region. Objectives: Provide an interconnected street network that allows for reasonably direct travel and identifies and establishes parallel routes for highway facilities during periods of high demand or when slides/geological hazards affect through traffic operations. Establish operational standards that can be used to identify and prioritize how and where transportation funds should be invested in maintaining and improving the transportation network. Establish street standards and the procedures for enforcing compliance through county ordinance and code. Maintain existing roadways and identify improvements to address existing operational and safety deficiencies. Facilitate freight travel by identifying key freight routes and maintaining efficient through movement in these corridors. Maintain roadways that serve as school bus routes to minimize service and safety impacts due to poor road surface conditions. Require consideration of project elements, such as culverts and raised road beds that would address flood plain issues during new construction and roadway improvement projects. Goals and Objectives 2-1
16 Provide for future growth through planning and management of the transportation system. Consider the transportation needs of both local and regional travelers (tourists) in the County. Promote intergovernmental coordination among Coos County, the Oregon Department of Transportation, the US Forest Service, the Federal Highway Administration, and all the cities within Coos County. Goal 2: Multimodal System Provide a multimodal transportation system that accommodates the needs of all users Objectives: Support efforts to maintain current transit service and plan for future expanded transit service by sustaining funding and seeking consistent state support. Plan safe and convenient bicycle and pedestrian networks that connect between residential area, schools, and other activity centers. Incorporate bicycle and pedestrian elements, such as sidewalks and bike lanes or shoulders, in roadway upgrades. Protect and enhance airport facilities by developing regulations to reduce hazards and promote compatible land uses in surrounding areas and coordinating with the Oregon Department of Aviation, Southwest Oregon Regional Airport, other regional, local, and remote aviation facilities, and affected cities. Preserve and enhance the existing rail corridor between Eugene and the Bunker Hill industrial area through cooperation with the Oregon Rail Division and the Port of Coos Bay. Support opportunities for developing intermodal connections between rail, highway, and water facilities with particular focus on enhancing development of Port of Coos Bay facilities. Goal 3: Livability Provide a transportation system that enhances community livability and promotes economic development while minimizing environmental impacts. Objectives: Minimize congestion on major travel routes by maximizing efficiency of the existing system, providing a network of travel routes, and encouraging the use of alternative modes of travel. Balance the need for accessibility to adjacent land uses with the need to provide capacity on major travel routes. Goals and Objectives 2-2
17 Protect natural features and historic sites, preserve agricultural and forest lane, and avoid, minimize, or mitigate impacts associated with transportation projects. Work to preserve existing neighborhoods when developing roadway capacity improvements. Coordinate land use and transportation planning decisions to maximize the efficiency of public infrastructure investments. Provide a process to educate and involve the public in the planning and funding for future transportation system improvements. Goal 4: Safety Promote the safety of current and future travel modes for all users. Objectives: Provide a transportation system that allows adequate emergency vehicle access to all land uses. Maintain existing emergency routes, including lifeline routes and tsunami evacuation routes. Establish roadway design standards to reduce frequency and severity of motor vehicle crashes. Review crash patterns and implement improvements at locations identified as priority through the state rating system. Identify and improve intermodal conflict points, including rail crossings and pedestrian/ bicycle crossings of major roadways near transit stops, schools, and other activity centers. Coordinate between transportation service providers to identify and address existing safety concerns and prevent the creation of future conflict points. Goal 5: Funding Identify reasonable and equitable funding mechanisms for improvements identified in the TSP Objectives Develop a financing program that establishes priorities and identifies funding mechanisms for implementation. Seek long-term funding source(s) for basic roadway maintenance. Require development to mitigate direct traffic impacts and establish the mechanisms for enforcing compliance through county ordinance and code. Consider the creation of a traffic impact fee program or system development charge to address the indirect traffic impacts on the transportation system created by new development. Goals and Objectives 2-3
18 Allow formation of road districts to upgrade transportation facilities. Coordinate with state and federal agencies and take advantage of funding programs for roadway improvements. Work with local jurisdictions to establish cooperative road improvement programs and jurisdictional transfers within urban growth areas. Goals and Objectives 2-4
19 3. EXISTING TRANSPORTATION SYSTEM INVENTORY Chapter 3 contains an update of the inventory of existing transportation system so that the TSP will reflect current conditions. This inventory reviews the roadway system as well as the pedestrian, bikeway, public transportation, rail, air, water, and pipeline systems as they apply to Coos County. Roadway Network The roadway network serves many modes of travel, including motor vehicles, bicycles, pedestrians, transit, and freight. It connects communities, serves adjacent land uses, and provides access to other modes of travel as well. The roadway network within Coos County includes almost 1,900 miles of roadway under five jurisdictions: County, State, US Forest Service (USFS), Bureau of Land Management (BLM), and the Bureau of Indian Affairs (BIA). The breakdown of roadways by surface type and jurisdiction is summarized in Table 3-1. Table 3-1. Summary of Roadway Mileage by Jurisdiction Jurisdiction Unpaved Asphalt Concrete Total State Highways Coos County Bureau of Land Management US National Forest Bureau of Indian Affairs Total Notes: Oregon Mileage Report. The report indicates total add and non-add lane miles of State Highways in Coos County 2. Coos County Road Department, January 2, 2002 The Oregon Department of Transportation (ODOT) owns approximately 161 miles of roadway within the County, including the most heavily traveled routes. With the exception of a short section of OR 241, the highways are all paved. The state highways link Coos County with other areas of the state as well as provide regional connections between communities. Coos County owns and maintains approximately 529 miles of roadway and almost 65 percent (341 miles) of the county roads have a paved surface. Fewer than 8 miles of the county roadway network lies within city boundaries. The BLM and USFS own a combined 1,186 miles of roadway within the county, almost 63 percent of the total county mileage. Most of these roadways are gravel and serve the forest lands that dominate the county. These roadways are primarily used to access recreational and logging areas and provide emergency fire access. This TSP does not include any further description of BLM or USFS roads. Existing Transportation System Inventory 3-1
20 The BIA owns 10 miles of roadway within the County. These lands lie within the reservation boundaries of the Coquille Tribe. County Roads While the state highway system forms the backbone of the roadway network in Coos County, county roads are a vital part of the circulation system. Coos County owns and maintains 236 roads totaling approximately 529 miles of roadway. Functional Classification The functional classification system for the Coos County roadway network includes arterials, major collectors, minor collectors, and local streets. Coos County recently upgraded the functional classification of a number of roadways for consistency with current uses or with state classifications. The functional classification of the county network, including these recent upgrades, is shown in Figure 3-1. The state highway system described previously serves as the arterial network within Coos County. They provide a continuous road system that distributes traffic between cities and also serves as the primary arterial corridors within cities. Although the County has no direct control over the state highways within its boundaries, the highways heavily influence traffic patterns and development. The existing TSP describes collectors as streets connecting residential neighborhoods with smaller community centers and facilities, as well as providing access to the arterial system. Property access is generally a higher priority for collectors while through traffic movements are served as a lower priority. The county further breaks the collector category into major and minor collectors. Major collectors generally serve higher traffic demands. They tie federal roads, minor collectors, and local roads to the arterial system. These roads also provide access to agricultural, forest, and recreational areas. As shown in Table 3-2, Coos County has 38 major collectors totaling approximately 217 miles of roadway. All of the major collectors are at least partially paved and 31 are paved their entire length. Most of the paved major collectors are between 17 and 25 feet wide which does not allow for much paved shoulder, thus any bicycles or pedestrians must share the travel lane with motorized vehicles. Existing Transportation System Inventory 3-2

21 3-1
22 Table 3-2. Major Collectors in Coos County Alphabetical Listing (New 911 Names) Length (miles) Constructed Width (feet) Right-of-Way Width (feet) Paved Gravel Paved Gravel Paved Gravel Airport Way Beach Loop Road Beaver Hill Lane Catching Slough Road Coos-Sumner Lane East Bay Road Fairview - Sumner Lane Fairview Road Fishtrap Road Lampa Lane Landrith Road Libby Lane Min Lone Pine Lane Myrtle Creek North 8th St. (Lakeside) North Bank Lane North Bay Road North Lake Lane Min Old Broadbent Road Olive Barber Road Parkersburg Road Prosper Junction Road Riverside Drive Rosa Road Sandy Creek Road Seven Devils Road Shelley Road Shinglehouse Road Shutters Landing Lane Sitkum Lane South 8th St. (Lakeside) South Coos River Lane South Powers Road TransPacific Lane Two-Mile Lane Walker Road West Beaver Hill Road West Central TOTALS Source: Coos County Road Department, January 2, 2002 Existing Transportation System Inventory 3-3
23 Minor collectors generally serve lower traffic demands than major collectors. They generally branch off from highway, arterial, or major collector roadways and provide access to agricultural, forest, recreational areas, and residential homes. As shown in Table 3-3, Coos County has 8 minor collectors totaling approximately 57 miles of roadway. Five of the 8 minor collectors are at least partially paved. Most of the paved minor collectors are between 19 and 24 feet wide which does not allow for much paved shoulder, thus any bicycles or pedestrians must share the travel lane with motorized vehicles. Table 3-3. Minor Collectors in Coos County Alphabetical Listing (New 911 Names) Length (miles) Constructed Width (feet) Right-of-Way Width (feet) Paved Gravel Paved Gravel Paved Gravel Catching Creek Lane Fairview Road Lee Valley Road McKinley Lane North Bank Lane Seven Devils Road Shutters Landing Lane West Fork Millicoma Road TOTALS Source: Coos County Road Department, January 2, 2002 Local streets, or minor streets as described in the 1999 TSP, primarily serve residential properties. Property access is the main priority; through traffic movement is not encouraged. They are designed to carry low traffic volumes. Coos County has 198 local streets totaling approximately 255 miles of roadway. Pavement Conditions Coos County conducted a pavement condition inventory in the spring of 2009 based on the pavement management software StreetSaver 1. The distribution of inventory data in the seven pavement condition categories used in the county inventory is summarized in Table 3-4. Approximately 10 percent of the paved roadways in the Coos County system have Poor pavement conditions and another 1 percent have Very Poor conditions. Major collectors are in the best condition with only 5 percent in Poor condition and 0 percent in Very Poor condition. Minor collectors have the greatest percentage of road surface in Poor condition (20 percent) but none in Very Poor condition. 1 StreetSaver Metropolitan Transportation Commission's Pavement Management Software, v.8. Existing Transportation System Inventory 3-4
24 Table 3-4. Pavement Conditions Inventory County Roads Pavement Condition Major Collector (miles) Minor Collector (miles) Local (miles) Total (miles) Excellent (PCI: ) 5% 6% 2% 4% Very Good (PCI: 70-85) 32% 10% 23% 27% Good (PCI: 55-70) 26% 12% 25% 24% Fair (PCI: 40-55) 32% 53% 34% 34% Poor (PCI: 25-40) 5% 20% 15% 10% Very Poor (PCI: 10-25) 0% 0% 2% 1% Failed (PCI: 0-10) 0% 0% 0% 0% Acronym: PCI = Pavement Condition Index ranking Source: Coos County Road Department, May Major and minor collector roadways with some portion of the paved surface in Poor condition are listed in Table 3-5. The roadway with the longest section of Poor pavement conditions is North Bank Lane. Lampa Lane, Old Broadbent Road, Seven Devils Road, and Sitkum Lane all have more than a mile of Poor pavement. Table 3-5. County Roads with Poor Pavement Conditions Major Collector Roadways Minor Collector Roadways Name Length (miles) Name Length (miles) Beach Loop Road 0.72 North Bank Lane 5.6 Lampa Lane 1.32 West Fork Millicoma Road 0.5 North Bank Lane 1.30 Old Broadbent Road 2.09 Seven Devils Road 1.90 Shelley Road 0.88 Sitkum Lane 1.87 Source: Coos County Road Department, May State Highways State highways form the primary road network within and through Coos County. They provide a continuous road system that distributes traffic between cities and also serves as the primary arterial corridors within cities. Although the County has no direct control over the state highways within its boundaries, the highways heavily influence traffic patterns and development. Coos County is served by the six state highways listed in Table 3-6 and shown in Figure 3-1. Existing Transportation System Inventory 3-5
25 Table 3-6. State Highways Number Name State Classification State Freight Route Federally Designated Truck Route Scenic Byway National Highway System Miles US Oregon Coast Highway Statewide Yes 1 Yes Yes Yes OR 42 5 Coos Bay-Roseburg Highway Statewide Yes Yes 2 No Yes OR 42S Coquille-Bandon Highway District No No No No OR 241 Coos River Highway District 3 No No No Yes OR 540 Cape Arago Highway District No No Yes 4 No OR 542 Powers Highway District No No No No Notes: 1. US 101 is a freight route from the Coos-Douglas County Line at milepost to the junction with OR 42 at milepost OR 42 is a federally designated truck route from US 101 at milepost 0.0 to the junction with OR 42S at milepost The designation of through truck routes help provide for the efficient movement of goods while balancing and maintaining neighborhood livability, public safety, and minimizing maintenance costs of the roadway system. 3. OR 241 is a statewide highway at the junction with US 101 and is part of the National Highway System from US 101 at to the Bunker Hill Industrial Area access on Mullen Road. 4. OR 540 is a scenic byway from Shore Edge Drive at milepost 8.74 to the end of the highway at Cape Arago State Park. 5. The OHP classifies US 101 as an Expressway from 1st Street in Coos Bay (MP ) to the junction with OR 42 (MP ). The OHP classifies OR 42 as an Expressway from the junction with OR 42 (MP 0) to West Central Street in Coquille (MP 9.97) and then again from Filter Plant Road in Coquille (MP 13.19) to Ash Street in Myrtle Point (MP 20.53). Source: 1999 Oregon Highway Plan, July U.S. Highway 101 (Oregon Coast Highway) US 101 runs north-south along the Oregon coast traversing Coos County from Douglas County to Curry County. The Oregon Highway Plan (OHP) designates US 101 within Coos County as a Statewide Highway and Scenic Byway. US 101 is part of a state freight route system that connects part of the Oregon Coast with Interstate 5 (I-5). The US 101 portion of the freight route extends from Florence to south of Coos Bay and connects with three east-west freight routes between I-5 and US 101: OR 126 from Eugene to Florence, OR 38 from about 30 miles south of Eugene to Reedsport, and OR 42 from south of Coos Bay to Roseburg. The OHP classifies US 101 as an Expressway from 1 st Street in Coos Bay (MP ) to the junction with OR 42 (MP ). It is also a federally designated truck route and part of the National Highway System. US 101 is generally a two-lane facility in the rural areas with posted speeds at 55 miles per hour (mph) except for a number of speed zones at junctions and service centers. It has few raised medians on the rural sections of highway. Outside of the North Bend/Coos Bay and Bandon urbanized areas, zoning adjacent to US 101 includes Rural Residential, Rural Industrial, Agricultural, Forest and Rural Service Center, as shown in Figure 1-2. OR Highway 42 (Coos-Roseburg Highway) OR 42 is a Statewide Highway which begins at the junction with US 101 approximately five miles south of Coos Bay, and traverses the Coast Range, passing through Coquille and Myrtle Point then continuing into Douglas County where it connects with I-5 south of Roseburg. OR 42 is Existing Transportation System Inventory 3-6
26 part of the freight route that extends from I-5 to the Oregon Coast and also includes part of US 101 and OR 38. This route, along with OR 38, forms a regional transportation system between I-5 and US 101 that serves both personal and freight travel (ODOT, OR 38/42 Corridor Plans, 2001, p.2-1). The OHP classifies OR 42 as an Expressway from the junction with OR 42 (MP 0) to West Central Street in Coquille (MP 9.97) and then again from Filter Plant Road in Coquille (MP 13.19) to Ash Street in Myrtle Point (MP 20.53). OR 42 is also part of the National Highway System and is a federally designated truck route from US 101 (MP 0) to the junction with OR 42S (MP 14). OR 42 varies from two to four lanes from its junction with US 101 through the cities of Coquille and Myrtle Point. East of Myrtle Point, it is primarily two lanes. Outside the cities of Myrtle Point and Coquille, OR 42 runs through agricultural, rural residential, and forest lands. OR Highway 42S (Coquille-Bandon Highway) OR 42S is a District Highway which begins at the junction with US 101 in Bandon and extends eastward to the junction with OR 42 south of Coquille. OR 42S is a two-lane facility with a posted speed of 55 mph in the rural areas and 45 mph approaching Bandon where it joins with US 101. Between Coquille and Bandon, OR 42S runs through agricultural, rural residential, and forest lands. OR Highway 241 (Coos River Highway) OR 241 is classified as a District Highway in the OHP with the exception of a short section at its junction with US 101 in the Bunker Hill area in Coos Bay, which is classified as a Statewide Highway. A portion of the highway from US 101 to Mullen Road is designated as part of the National Highway System as it provides intermodal access to the Bunker Hill Industrial Area. From Bunker Hill, OR 241 runs through the eastside section of Coos Bay, and continues to the community of Allegany. A 1.51-mile section of OR 241 is under Coos Bay jurisdiction. OR 241 is a two-lane facility with a posted speed of 55 mph beyond the Coos Bay city limits. East of Coos Bay, OR 241 runs through agricultural and forest lands. OR Highway 540 (Cape Arago Highway) OR 540 runs from downtown North Bend through Coos Bay then south through the community of Charleston to Cape Arago State Park. It is classified as a District Highway in the OHP and is designated as a scenic byway from Shore Edge Drive (milepost 8.74) to the state park. A mile section of OR 540 is under Coos Bay jurisdiction. OR 540 is a four-lane facility within North Bend and Coos Bay but outside the city limits, it is a two-lane facility. Posted speed is 40 mph from Coos Bay to the community of Charleston, where the posted speed drops to 35 mph. South of Charleston, the posted speed is 45 mph until the state park, where the posted speed varies from 25 to 35 mph. The adjacent lands are primarily zoned rural service center and park. Existing Transportation System Inventory 3-7
27 State Highway 542 (Powers Highway) OR 542 connects OR 42 south of Myrtle Point to Powers. It is classified as a District Highway in the OHP with no other special designations. OR 542 is a two-lane facility with no medians or turn lanes and a posted speed of 55 mph except within the city of Powers. Outside the city limits, OR 542 travels through primarily lands zoned for agricultural uses. Pavement Conditions The ODOT Pavement Services Unit surveyed pavement conditions on the highway system in The five pavement condition categories used include: Very Good, Good, Fair, Poor, and Very Poor 2. With the exception or structures, the state highway surfaces in Coos County are asphalt concrete pavement. The rating definitions for asphalt concrete are summarized below: Very Good Stable, no creaking, no patching, and no deformation. Excellent riding qualities. Nothing would improve the roadway at this time Good Stable, minor cracking, generally hairline and hard to detect. Minor patching and possibly some minor deformation evident. May have dry or light colored appearance. Very good riding qualities. Rutting may be present but is less than ½ inch. Fair Generally stable, minor areas of structural weakness evident. Cracking is easier to detect, patched but not excessively. Deformation more pronounced and easily noticed. Ride qualities are good to acceptable. Rutting may be present but is less than ¾ inch. Poor Areas of instability marked evidence of structural deficiency, large crack patterns (alligatoring), heavy and numerous patches, deformation very noticeable. Riding qualities range from acceptable to poor. When rutting is present, rut depth is greater than ¾ inch. Very Poor Pavement in extremely deteriorated condition. Numerous areas of instability. Majority of section showing structural deficiency. Ride quality is unacceptable (probably should slow down). Table 3-7 summarizes the pavement conditions by roadway section for the portions of the state highways in Coos County which lie outside city limits. Excluding structures and sections currently under construction, approximately 65 percent of the state highways that lie within Coos County and outside city limits are rated as having pavement that is in Good or Very Good condition. Another 25 percent is rated as Fair. The remaining 10 percent is rated as Poor with no sections rated at Very Poor. 2 Definitions of the pavement condition categories can be found in the ODOT, Pavement Services Unit, 2008 Pavement Condition Report, Appendix E which can be found at the following internet address: Existing Transportation System Inventory 3-8
28 Table 3-7. Pavement Conditions Inventory State Highways Route Section Name Begin Milepost End Milepost Length Rating 2008 US 101 Douglas County Line - Tugman State Park Good US 101 Tugman State Park Spinreel Road Fair US 101 Spinreel Road - McCullough Bridge Very Good US 101 McCullough Bridge (North Bend City Limits) Structure US 101 Coos Bay South City Limits - Lorain Avenue Under Construction US 101 Lorain Avenue - Davis Slough Good-Very Good US 101 Davis Slough - Bullards Bridge Fair US 101 Bullards Bridge Structure US 101 Bullards Bridge - Bandon North City Limits Good US 101 Bandon South City Limits - Two Mile Road Good US 101 Two Mile Road - Laurel Grove Poor US 101 Laurel Grove Bethel Creek Good US 101 Bethel Creek - Butte Creek Poor US 101 Butte Creek Curry County Line Fair OR 42 Junction US Delmar Lane (EB) Very Good OR 42 Delmar Lane - Overland Lane Good OR 42 Overland Lane - Coquille City Limits Very Good OR 42 Coquille City Limits Glen Aiken Creek Good OR 42 Glen Aiken Creek - N. Fork Coquille River Very Good OR 42 N. Fork Coquille River Bridge Structure OR 42 N. Fork Coquille River - Myrtle Point City Limits Very Good OR 42 Myrtle Point City Limits Junction OR Very Good OR 42 Junction OR Douglas County Line Good OR 42S Bandon East City Limits - Bear Creek Rd Good OR 42S Bear Creek Rd Junction OR Fair OR 241 Junction US th Ave Poor OR 241 Begin State Jurisdiction - Catching Slough Structure OR 241 Catching Slough - Chandler Bridge Fair OR 241 Chandler Bridge Structure OR 241 Chandler Bridge - Boat Kruse Rd Good OR 241 Kruse Rd - End of Pavement Poor OR 540 Begin State Jurisdiction - Sunset Bay State Park Poor OR 540 Sunset Bay State Park - Cape Arago Very Good OR 542 Junction OR 42 Milepost 8 Slide Section Good OR 542 Milepost 8 Slide Section Poor OR 542 Milepost 8 Slide Section - Coq Myrtle Gr. S.P Fair OR 542 Coq Myrtle Gr. S.P. - S. Fork Coquille River Good OR 542 Powers Bridge - Powers City Limits Under Construction Source: ODOT, Pavement Services Unit, 2008 Pavement Condition Report Existing Transportation System Inventory 3-9
29 Four of the six highways had sections with Poor pavement conditions. US 101 has two sections totaling approximately 3 miles at the southern end of the county with Poor ratings. OR 241 has two sections with Poor rating: one 0.7-mile section located just east of the Coos Bay city limits in the Bunker Hill area and the other section of almost 4 miles at the end of the highway, before it becomes gravel. OR 540 has Poor pavement conditions for a 6.5 mile section from where state jurisdiction begins just south of the Coos Bay city limits to Sunset Bay State Park. Lastly, a slide section of OR 542 near milepost 8 is rated as Poor. Neither OR 42 nor OR 42S have any sections with Poor ratings. Bridges The 2008 bridge inventory data for Coos County was obtained from ODOT s Bridge Maintenance Section and reviewed. Two mutually exclusive elements are used to rate bridge conditions: structural deficiency and functional obsolescence. Structural deficiency is determined based on the condition rating for the deck, superstructure, substructure, or culvert and retaining walls. It may also be based on the appraisal rating of the structural condition or waterway adequacy. Functional obsolescence is determined based on the appraisal rating for the bridge deck geometry, underclearances, and approach roadway alignment. It may also be based on the appraisal rating of the structural condition or waterway adequacy. The third element used to evaluate bridge conditions is the sufficiency rating, which is a complex formula that takes into account four separate factors to obtain a numeric value rating the ability of a bridge to service demand. The result of this method is a percentage in which 100 percent would represent an entirely sufficient bridge and zero percent would represent an entirely insufficient or deficient bridge. Those bridges with a sufficiency rating of 80 or less are eligible for rehabilitation. Those bridges with a sufficiency of 50 or less are eligible for replacement. Bridges lose their eligibility status for a period of ten years after a (Highway Bridge Program) project is completed. Figure 3-2 illustrates the location of all bridges in the National Bridge Inventory (NBI) and whether they are identified as structurally deficient or functionally obsolete. County Bridges Coos County owns 111 bridges in the NBI system. Of the 111 bridges in Coos County, seven are identified as functionally obsolete and three are identified as structurally deficient, as listed in Table 3-8 (please refer to the first paragraph of this Bridges section for definitions of structurally deficient and functionally obsolete ). None of the county bridges have posted weight restrictions. In addition to those bridges identified with deficiencies, 41 others are identified as not deficient but have sufficiency ratings that indicate they are eligible for replacement (3 bridges) or rehabilitation (38 bridges). Existing Transportation System Inventory 3-10

30 3-2
31 Table 3-8. Functionally Obsolete and Structurally Deficient County Bridges Bridge ID Milepoint Name FUNCTIONALLY OBSOLETE BRIDGES 11C13A 3.90 Two Mile Creek, County Rd 11G (Two Mile Lane) 11C43A 5.75 Myrtle Point, County Rd 32 (Myrtle Point Road) 11C87U 0.05 East Fork Coquille River, County Rd 132 (Crosby Road) 11C42D 0.10 Blackmoor/Larson Creek, County Rd 248G (Blackmore) 11C South Fork Coquille River, County Rd 902M 11C West Fork Millicoma, County Rd 47 (West Fork Millicoma Road) 11C17I 0.01 Glenn Creek, County Rd 49G (East Fork Road) STRUCTURALLY DEFICIENT BRIDGES Beaver Creek, County Rd 5A (North Bank Lane) Fish Trap Creek, FAS A417 (Robison) South Fork Coquille River, County Rd 153G (Gaylord Road) Source: ODOT, Bridge Maintenance Section State Bridges The state owns and maintains 56 bridges located on state highways in both rural and urban Coos County. The bridges are distributed among the six highways within the county as follows: 14 bridges located on US bridges located on OR 42 7 bridges located on OR 42S 6 bridges located on OR bridges on OR bridges on OR 542 Of the 56 state bridges in Coos County, eight are identified as functionally obsolete and nine are identified as structurally deficient, as listed in Table 3-9. Only one structurally deficient bridge has posted weight restrictions: the OR 241 Bridge over Isthmus Slough (#01132F). In addition to those bridges identified with deficiencies, 16 others are identified as not deficient but have sufficiency ratings that indicate they are eligible for replacement (1 bridge) or rehabilitation (15 bridges). According to the 2008 Bridge Condition Report, Appendix E 3, a $35 million rehabilitation project funded through the STIP program is underway on the functionally obsolete McCullough Bridge on US 101 (#01823). Appendix F of the report identifies project programmed through 2011: US 101: McCullough Bridge (#01823) deck rehabilitation STIP funding Bridge Condition Report, Bridge Engineering Section, Oregon Department of Transportation Existing Transportation System Inventory 3-11
32 OR 241: Isthmus Slough Bridge (#01132F) east approach STIP funding OR 42: Sandy Creek Bridge (#00482B) earmark funding OR 42: Middle Fork Coquille River Bridge (#09185) earmark funding OR 42: Middle Fork Coquille River Bridge (#09186) earmark funding OR 42: Beaver Creek to Middle Fork Coquille River Bridge Bundle (#00559B, #03173A, #03212A, #08830, #08842, #08843, #08875, #08876, #08935, #08936) no funding identified Table 3-9. Functionally Obsolete and Structurally Deficient State Bridges Bridge ID Highway Milepoint Name FUNCTIONALLY OBSOLETE BRIDGES US Coos Bay, US 101 (McCullough) US Coquille River, US 101 (Bullards) OR OR 42 over US 101 NB 03173B OR Beaver Creek, OR 42 WB 00598D OR 42S Coquille River, OR 42S OR OR 241 over CORP OR Coos River, OR 241 (Chandler) 01942A OR S Fork Coquille R, OR 242 at MP (Powers) STRUCTURALLY DEFICIENT BRIDGES 03173A OR Beaver Creek, OR 42 EB OR Middle Fork Coquille River, OR 42 at MP A OR Endicot Creek, OR OR Middle Fork Coquille River, OR 42 at MP B OR Sandy Creek, OR OR Middle Fork Coquille River, OR 42 at MP OR Middle Fork Coquille River, OR 42 at MP F OR Isthmus Slough, OR 241 (Eastside) 01492A OR West Fork Millicoma River, OR 241 Source: ODOT, Bridge Maintenance Section Traffic Control The vast majority of intersections in Coos County are STOP-controlled outside of the urban areas. The exceptions on the state highways include the following locations: US 101 and Flannagan Road US 101 and OR 241 junction US 101 and Edwards Road/Ivy Hills Road US 101 and East Bay Drive Existing Transportation System Inventory 3-12
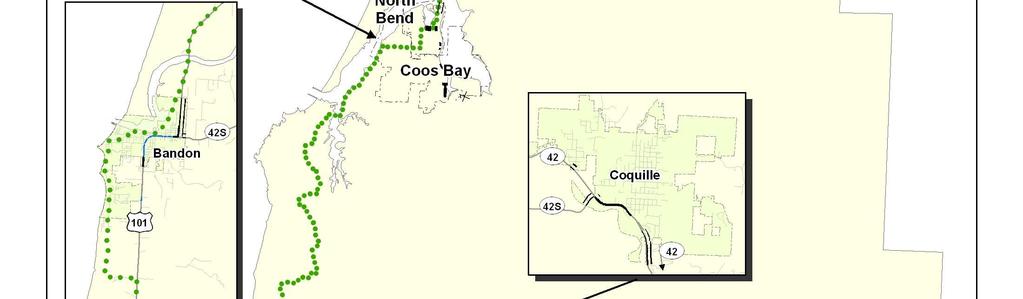
33 Bicycle and Pedestrian Facilities The County-wide bicycle network primarily consists of the Oregon Coast Bike Route (OCBR) and portions of the state highways (see Figure 3-3). ODOT s Bicycle and Pedestrian Program has updated their inventory of facilities on state routes for There is no extensive network of specifically designated bicycle routes serving Coos County other than the OCBR. There is one bike lane within the county maintained network, which is on West Central Boulevard in Coquille. Portions of US 101 and OR 42 in Coos County have existing five-foot wide bike lanes rated in fair condition. Bike shoulders exist along US 101, OR 42, OR 42S, OR 542 and a short segment of OR 241. These shoulder segments vary in width from one to eight feet and are in fair to poor condition. ODOT designates short segments of US 101, OR 540 and OR 542 as shared roadways. A portion of OR 542 maintains a seven-foot wide blacktop shared use path listed in fair condition. In 1991, a Bikeway Master Plan was completed for Coos County to provide guidance for future bikeway improvements and to enable the County and the seven incorporated cities to be eligible for funding of specific projects and programs. While the Bikeway Master Plan is outdated, the existing bicycle system inventory and deficiencies identified in the Plan remain relevant to current County-wide conditions. Bike Shoulders The draft Oregon Bicycle and Pedestrian Plan recommends shoulders for bicycle use that are 6 feet wide, although a minimum 4-foot shoulder may be used when there are physical width limitations. A summary of shoulder widths from the highway inventory database for the six state highways in Coos County is presented in Table On the highways of statewide significance, US 101 and OR 42, approximately 85 percent of the roadways have paved shoulders that are 4 feet or wider, which meets the minimum width recommended in the state plan. Approximately 40 percent of US 101 and 65 percent of OR 42 have shoulders that or 6 feet or wider. The remaining 15 percent of the shoulders that are less than 4 feet must be considered shared roadway. Of the district highways the Cape Arago Highway, OR 540, has more than 60 percent of the paved shoulders at 4 feet or wider. Less than 10 percent of the other highways have shoulders 4 feet or wider. While the district highways have lower volumes than the statewide highways, the average daily traffic volumes indicate that wider shoulders should be provided. Most of the paved county roads are between 16 and 25 feet wide which does not allow for paved shoulder, thus any bicycles or pedestrians must share the travel lane with motorized vehicles. Existing Transportation System Inventory 3-13

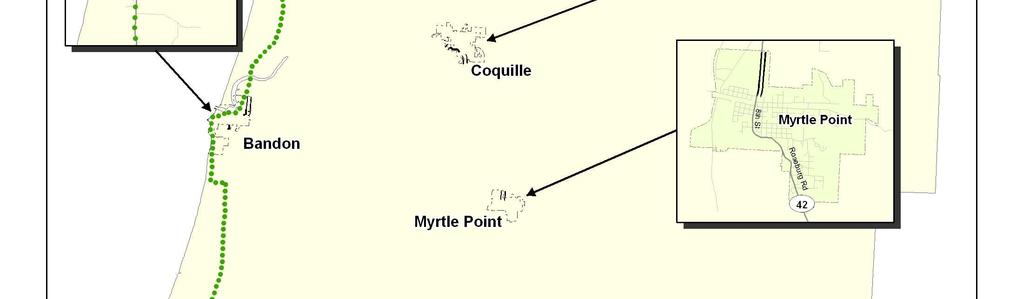
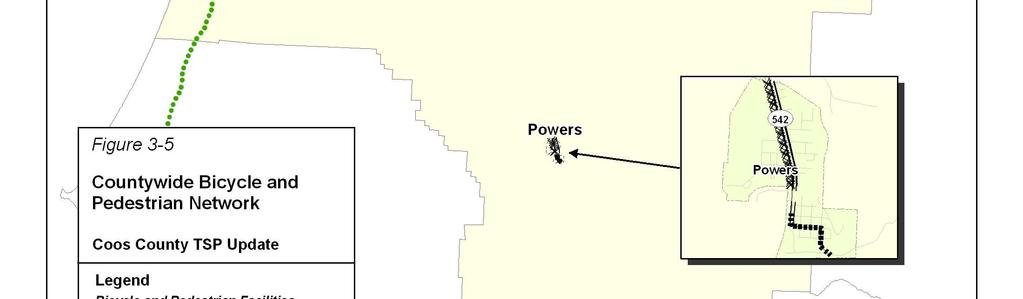
34 3-3
35 Table Rural Paved Shoulder Inventory on State Highways in Coos County Miles of Paved Shoulder Highway Direction 6 feet or wider 4-5 feet Under 4 feet Total US 101 Northbound Southbound OR 42 Eastbound Westbound OR 42S Eastbound Westbound OR 241 Northeastbound Southwestbound OR 540 Northeastbound Southwestbound OR 542 Northbound Southbound Source: ODOT State Highway Inventory Reports Sidewalks Sidewalks exist along sections of the state highways within the cities but there are few sidewalks outside city limits with the exception of a few urbanized areas, such as Bunker Hill. Pedestrians in the rural areas are served by whatever shoulders are available, sharing those facilities with bicyclists. As noted above, shoulder segments vary in width from one to eight feet and are in fair to poor condition. There is one sidewalk within the county maintained network, which in on West Central Boulevard in Coquille. Public Transit Services Overall, there are six public transportation operators in Coos County. These operators and their services include: Coos County Area Transit Service District (CCAT) Fixed route and demand responsive services in Coquille, Myrtle Point, Bandon, and Coos Bay/North Bend, with a Loop Bus service around Coos Bay/North Bend. Taxi and limousine service is available primarily in the Coos Bay/North Bend area in conjunction with clientele traveling between the Southwestern Oregon Regional Airport, located in North Bend, and the Bandon Dunes Golf Resort. Region 7 of the Oregon Department of Human Services maintains a volunteer sedan transportation program for non-emergency medical transportation. The Powers Stage is a van service sponsored by the Powers Housing Authority which connects Powers to the Bay area on Tuesdays and Fridays. Existing Transportation System Inventory 3-14
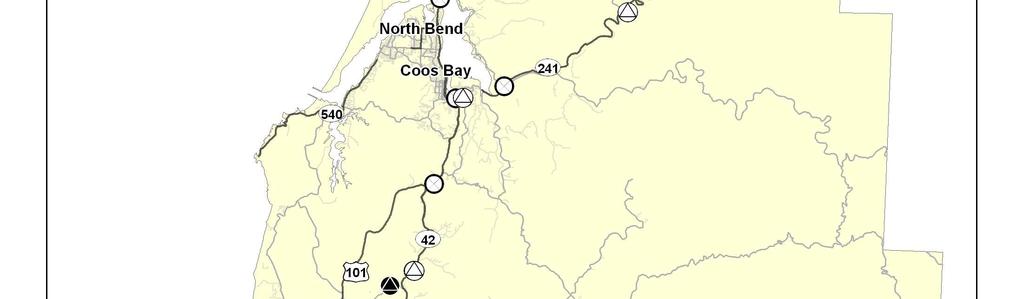
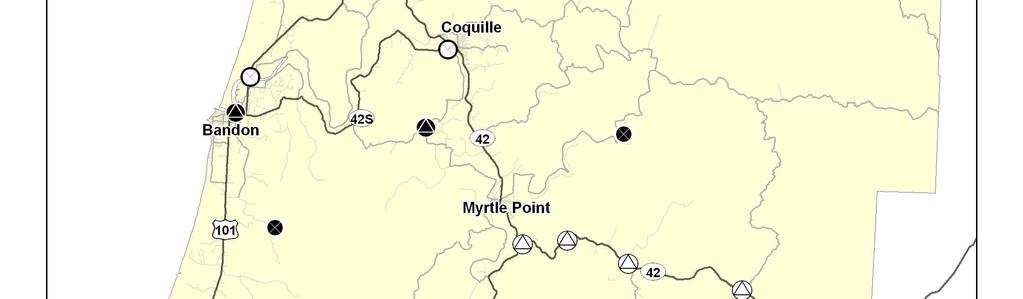
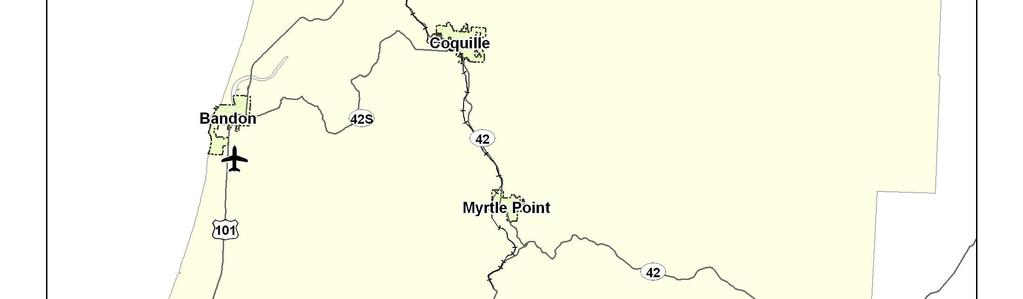
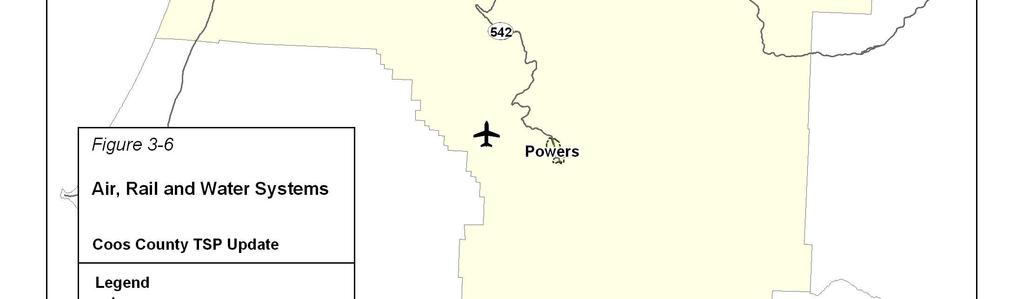
36 Curry Public Transit operates a bus service serving Coos County from Brookings to the Bay area on Monday, Wednesday, and Friday. Greyhound operates commercial bus service seven days/week on Highway 101, stopping in Brookings, Coos Bay and Reedsport. Ticket service is provided in Coos Bay. Air Facilities Table 3-11 lists the public use airports operating in Coos County and general locations are shown in Figure 3-4. In addition to the four public airports, there are six privately-owned airfields/airstrips and two private helipads operating in Coos County. Table Coos County Airports Name Category Category Definition Southwest Oregon Regional Airport 1 Commercial Service Airport 1 Bandon State Airport 4 Community General Aviation Airport 2 Lakeside State Airport 5 Low Activity General Aviation Airports 3 Powers Airport 5 Low Activity General Aviation Airports 3 Notes: 1. Category 1 - Commercial Service Airports - Accommodate scheduled major/national or regional/commuter commercial air carrier service. 2. Category 4 - Community General Aviation Airports - Accommodate general aviation users and local business activities. 3. Category 5 - Low Activity General Aviation Airports - Accommodate limited general aviation use in smaller communities and remote areas of Oregon. Source: ODOT, 2000 Southwest Oregon Regional Airport The Southwest Oregon Regional Airport (SWORA), located in North Bend, is operated by the Coos County Airport District, which is governed by a Board of five Commissioners elected county-wide. The airport terminal is approximately 1 mile from US 101. The airport has three asphalt runways, one of which is no longer in use, and two main parallel taxiways. Commercial air service is currently provided by United Express. Direct connections to Portland, Oregon and San Francisco, California are available. Two outbound flights to each of these cities and two inbound flights from each of these cities are scheduled each day. SWORA has one fixed base operator providing general aviation services. Coos Aviation operates from a hangar and buildings at the north end of the airport. They provide maintenance space, ground handling equipment, fuel service, as well as on-site amenities for visitors. The United State Coast Guard runs helicopter operations out of SWORA. They have their own building and apron south of the terminal building. Air cargo services are also available at SWORA. FedEx operates out of a hanger northwest of the terminal building. Other cargo services are provided by United Express and AmeriFlight, Inc. Existing Transportation System Inventory 3-15


37 3-4
38 According to the 2002 North Bend Municipal Airport Master Plan (note: North Bend Municipal Airport is the former name of the SWORA), annual passenger and cargo flights are projected to increase from 39,016 (year 2000) to 58,100 by Bandon State Airport Bandon State Airport is owned and operated by the Oregon Department of Aviation. It is located about two miles southeast of Bandon. The airport is usable from dawn to dusk and is attended from 7 a.m. to 6 p.m. Fuel is available along with major airframe and power plant repair service. The runway is 3,600 by 60 feet, surfaced by asphalt in good condition. Lakeside State Airport Lakeside State Airport is owned and operated by the City of Lakeside. It is located northwest of Lakeside. The airport is unattended and no airport services are available. The turf runway 2,150 by 100 feet and is in good condition. Powers Airport Powers Airport is owned and operated by the Port of Coquille River, based in Myrtle Point. It is located about 1 mile southwest of Powers. The airport is unattended and no airport services are available. The turf runway 2,500 by 60 feet and is in good condition. Water Facilities The Port of Coos Bay is the primary center of maritime commerce for Oregon s South Coast and is home to Oregon s largest coastal deep-draft harbor. An average of 2.5 million tons of cargo moves through the Port of Coos Bay each year. Inbound and outbound cargo is moved through Coos Bay s 15-mile channel, which features six marine terminals, seven deep-draft berths and several barge facilities. The channel is identified in Figure 3-4. The Port of Bandon, also within Coos County, serves communities (Bandon, Parkersburg, Prosper, and Riverton) along the Lower Coquille River. In recent years, this port has focused on accommodating tourism and recreational sport fishing, although it still supports commercial activities. The Port of Coquille, positioned on the Coquille River, has historically been used for the shipment of raw timber. Currently the Port is primarily utilized for recreational activities, such as fishing and boating. Rail Facilities The rail system plays a critical role in the movement of goods within Coos County. In general, goods arrive at port facilities by rail and are loaded onto ships for export. Imported goods are received by ships and unloaded onto trucks and train cars to be distributed domestically. Currently there are no locations within Coos County served by passenger rail service. Existing Transportation System Inventory 3-16
39 Rail service in southwestern Oregon is dominated by the Central Oregon and Pacific Railroad (CORP), which owns and operates on two lines in the region: the Siskiyou Line and the Coos Bay Branch Line. The Coos Bay Branch Line, which passes through Coos County, is 136 miles long and extends between Eugene and Coquille. A short spur line, completed in 2005 and owned by the Oregon International Port of Coos Bay, diverges from the branch line and parallels Transpacific Parkway on the North Spit. The spur line is approximately four miles long and terminates at the Southport Forest Products mill site. The Port of Coos Bay acquired most of the Coos Bay Branch Line through a Feeder Line Application action before the U.S. Surface Transportation Board. Financing of the acquisition was supported by a loan package administered by the Oregon Economic Development Department. The Port finalized the acquisition of the 111 miles of the CORP Coos Bay line in March 2009 and in the same month acquired a $2.5 million grant through the American Recovery and Reinvestment Act (ARRA) of 2009, which was used for rehabilitation on four deficient tunnels. In the fall of 2009, the Port also submitted an application to the Connect Oregon III program for $7.9 million to continue rehabilitation efforts involving swing-span bridges, other bridges and trestles, rail/ties/ballast, and other rail corridor needs. The Connect Oregon funds were awarded in August 2010 and work began in fall The 2009 Oregon Legislature provided $3.5 million in Oregon Lottery bond funds for the Coos Bay rail line which was provided to the Port in May A portion of those funds are currently being used to continue tunnel rehabilitation, and some funding will help with culvert rehabilitation. The ODOT Rail Division is working with Port staff on an at-grade roadway/ railroad crossing signal upgrade project funded through the Federal Railroad Administration, with some funding coming from the ODOT Rail Division. Port staff also has submitted an application to the federal TIGER II program for funds to upgrade track structure rail, ties, ballast and roadbed rehabilitation to increase the operation velocity of the rail line from primarily Class 1 (10 mph) to a mix of Class 2 (25 mph) and Class 3 (40 mph). Pipelines Coos County currently has its own natural gas pipeline operated by NW Natural Gas. The pipeline extending from the Coos Bay/North Bend area eastward across the County and through Douglas County to connect with the Williams Northwest Pipeline, which runs northsouth through Oregon extending from the Medford area through Portland and into Washington. A spur from the pipeline extends southward toward the Bandon area. In addition to the existing pipeline, the Pacific Connector project would construct a 230-mile pipeline from the proposed Jordan Cove liquefied natural gas import terminal located on the north spit in the Port of Coos Bay to the Pacific Gas and Electric Company s gas transmission system, Tuscarora Gas Transmission s system and Gas Transmission Northwest s system, all located near Malin, Oregon, southwest of Klamath Falls. In addition, the project would interconnect to Williams Northwest Pipeline near Myrtle Creek and Avista Corporation s distribution system near Shady Cove. Existing Transportation System Inventory 3-17
40 4. EXISTING TRANSPORTATION SYSTEM DEFICIENCIES Chapter 4 contains an analysis of current operating conditions for the transportation system. This evaluation focuses primarily on the street system but does identify gaps in the bicycle and pedestrian system as well. Census data were examined to determine travel mode distributions. Traffic Volumes Traffic volume data in Coos County was obtained from a number of ODOT sources and supplemented with turning movement and road tube traffic counts collected in collected in early Average Daily Traffic Average daily traffic (ADT) volumes reflect the annual average of daily traffic volumes on roadways throughout the year. They do not reflect seasonal fluctuations or special events. The ADT represents the typical volume of traffic in all lanes passing a given roadway location in both directions over a 24-hour period. The ADT volumes for Coos County were developed from ODOT s Traffic Volume Tables, data from ODOT s automated traffic recorders 4 (ATRs), and 24-hour counts collected on some county roads. All volumes have been estimated for an existing year condition of At some locations, this involved growing available data from earlier years to 2008 based on general growth rates calculated from five-year trends around Coos County. Figure 4-1 illustrates ADT volumes at key locations on state highways and major county roads. County Roads The 2008 ADT volumes on selected roadways in Coos County were estimated from turning movement data collected at various key intersections around the county. These volumes are presented in Figure 4-1. Some of the most heavily used county roads with ADT volumes between 1,000 and 2,500 vehicles per day include: East Bay Drive Olive Barber Road Wildwood Road Coos-Sumner Lane Seven Devils Road Jordan Cove Road North Bay Road Coos River Road The ADT volumes estimated for other roadways around the county were under 1000 vehicles per day. 4 Automatic traffic recorders are permanent electronic counting sites located on the state highway system. The recorders count vehicles continuously throughout the year, enabling ODOT to provide information about hourly, monthly, and yearly trends as well as a breakdown of vehicles by type (cars, trucks, buses, motorcycles, etc.). Existing Transportation System Deficiencies 4-1

41
42 State Highways The 2007 ADT volumes on the state highways in Coos County were taken from the ODOT 2007 Traffic Volume Tables. Traffic volumes are generally highest near the cities and drop off in rural sections. US 101 (Oregon Coast Highway) Traffic volumes on the sections of US 101 outside cities vary from a low of 4,600 at the Coos- Curry county line to 26,400 just south of the Coos Bay city limits. Volumes at the north end of US 101 at the Coos-Douglas county line (M.P ) are estimated at 7,700 ADT. Moving southward along the highway, volumes continue to grow until they are almost double (15,000 ADT) at the North Bend city limits. Volumes just south of the Coos Bay city limits are 26,400 ADT but they drop off considerably in less than half a mile; just south of the OR 241 junction, ADT is 17,500. Volumes drop again dramatically just south of the OR 42 junction with ADT at 6,100. They increase slightly near Bandon (6,300 ADT) but drop to their lowest level (4,600 ADT) at the Coos-Curry county line (M.P ). OR 42 (Coos Bay-Roseburg) Highway Outside city limits, traffic volumes on the sections of OR 42 vary from a high of 10,600 ADT, just east of the junction with US 101, to a low of 3,000 ADT at the Coos-Douglas county line. OR 42S (Coquille-Bandon Highway) Traffic volumes on OR 42S are highest just east of Bandon with an ADT of 4,100. They drop off to a low of 1,200 ADT between Bandon and Coquille and then increase as they approach the Coquille city limits with an ADT of 2,300. OR 241 (Coos River Highway) Traffic volumes are highest on the section of OR 241 between US 101 and where it enters the Coos Bay city limits with 9,400 ADT. After exiting Coos Bay, the ADT is 4,100 dropping to around 1,000 ADT over the next two miles and continuing to decrease to the end of the roadway. OR 540 (Cape Arago Highway) At the south city limits of Coos Bay, the traffic volumes on OR 540 are approximately 9,000 ADT. Going southward, they drop to approximately 5,000 ADT in the community of Charleston and then drop further to 1,100 ADT at the entrance to the state parks. OR 542 (Powers Highway) Traffic volumes on OR 542 are highest just south of OR 42 at 1,700 ADT dropping to under 1,000 ADT at the Powers city limits. Existing Transportation System Deficiencies 4-2
43 Seasonal Fluctuations The volumes shown in Figure 4-1 are average volumes for the year. Summertime is the season when volumes are highest. Data from the three ATRs in Coos County located on US 101 show that summer volumes vary from 15 to 35 percent higher than ADTs. Monthly fluctuations are smallest near the Coos Bay/North Bend urban area, where the daily travel of the large resident population influences traffic trends, and greatest near the county lines to the north and south, where recreational travel accounts for a much higher percentage of the overall traffic volume. Design Hourly Volumes The design hourly volume (DHV) is the hourly volume that is used for long-range planning and design. For any roadway, it represents the 30 th highest hourly traffic volume along the roadway segment throughout the year. A review of the ATR data on the state highways in Coos, Douglas, and Lane Counties shows that values for the 30 th highest hour range from 10 to 16 percent of the ADT. These data also show that the 30 th highest hour as a percentage of ADT fluctuates minimally each year. Table 4-1. Traffic Volume Characteristics from ATR Sites within and near Coos County ATR # Location 2008 ADT Truck % US 101, 1.09 miles south of the Coos- Douglas County Line (MP ) US 101, 1.02 miles south of SW 18 th St. (MP ) US 101, 0.28 miles north of Coos Bay- Roseburg Highway (MP ) OR 38, 7.08 miles east of Scottsburg West Road (MP 23.65) OR 42, 1.22 miles west of Brockway Road (MP 70.51) OR 126, 3.06 miles west of Territorial Highway OR 200 (MP 43.86) Source: 2008 Transportation Volume Tables, ODOT Transportation Data Section Truck Volume DHV % DHV 8, , , , ,535 3, , , Hourly traffic counts in Coos County were collected at different times during the year, but all of the counts have been adjusted to estimate DHVs. The DHVs were calculated by multiplying the peak hour volumes by a seasonal factor. The seasonal factors used in the calculations were determined using five years of data from the ATRs listed above and from other seasonal trend information available from ODOT. The DHVs are presented under the traffic operations section of the report in the analysis of two-lane highways (see Table 4-3). Existing Transportation System Deficiencies 4-3
44 Traffic Operations Traffic operations were analyzed for selected roadway segments and intersections throughout Coos County. Operations were evaluated according to the methodologies in the 2000 Highway Capacity Manual (HCM) 5. Operational Criteria Transportation engineers have established various standards for measuring traffic operations of roadways and intersections. Each standard is associated with a particular level of service (LOS) and/or the volume-to-capacity (v/c) ratio. Both the LOS and v/c ratio concepts require consideration of factors that include traffic demand, capacity of the intersection or roadway, delay, frequency of interruptions in traffic flow, relative freedom for traffic maneuvers, driving comfort, convenience, and operating cost. Volume-to-Capacity (V/C) Ratio Transportation engineers have established various standards for measuring traffic capacity and quality of service of roadways at intersections. A comparison of traffic volume demand to intersection capacity is one method of evaluating how well an intersection is operating. This comparison is presented as a v/c ratio. A v/c ratio of less than 1.00 indicates that the volume is less than capacity. When it is closer to 0.00, traffic conditions are generally good with little congestion and low delays for most intersection movements. As the v/c ratio approaches 1.00, traffic becomes more congested and unstable with longer delays. The OHP 6 has established several policies that enforce general objectives and approaches for maintaining highway mobility. Of these policies, the Highway Mobility Standards (Policy 1F) establish maximum v/c ratio standards for peak hour operating conditions for all highways in Oregon based the location and classification of the highway segment being examined. The OHP policy also specifies that the v/c standards be maintained for ODOT facilities through a 20-year horizon. The operational standards applicable to the state highways in Coos County are found in the Oregon Highway Plan. Standards for unincorporated communities and rural areas, found in the most recent version of the Oregon Highway Plan, are summarized in Table 4-2. The appropriate standards for roadways intersecting state highways are also presented in the table. For segments of state highways within the UGB, standards are dependent on additional variables, such as speed limits, and should be determined by reviewing the most recent version of the OHP. 5 Highway Capacity Manual, Transportation Research Board, Washington DC, Table 6: Maximum volume to capacity ratios for peak hour operating conditions, 1999 Oregon Highway Plan, Oregon Department of Transportation, Salem, OR, Existing Transportation System Deficiencies 4-4
45 Table 4-2. State Highways Operational Standards Number Name State Classification State Freight Route Highway V/C Ratio Unincorporated Communities Intersecting Roadway V/C Ratio US 101 Oregon Coast Highway Statewide Yes / OR 42 Coos Bay-Roseburg Highway Statewide Yes / OR 42S Coquille-Bandon Highway District No OR 241 Coos River Highway District No / OR 540 Cape Arago Highway District No OR 542 Powers Highway District No Notes: 1. US 101 is a freight route from the Coos-Douglas County Line at milepost to the junction with OR 42 at milepost and US 101 is an expressway north of OR 42 to S. city limits of Coos Bay. The lower v/c ratio applies to the portion of US 101 that is either an expressway or a designated freight route. 2. OR 42 is an expressway from W. of Myrtle Point to Coquille & W. of Coquille to US 101. The lower v/c ratio applies to the portion of US 101 that is an expressway. 3. OR 241 is a statewide highway at the junction with US 101 and is part of the National Highway System from US 101 at to the Bunker Hill Industrial Area access on Mullen Road. The lower v/c ratio applies to the portion of US 101 that has a statewide classification. Source: 1999 Oregon Highway Plan, July 2006, Table 6. Rural The County employs v/c ratio as its primary method for measuring performance, with the LOS criteria serving as a secondary measurement. A maximum v/c ratio of 0.85 should be maintained for all County-maintained intersections during a typical weekday peak hour 7. Level of Service Although the OHP Highway Mobility Standards are the overriding operations standard for Oregon highways, level of service (LOS) is a widely recognized and accepted measure and descriptor of traffic operations and is therefore also presented. At both stop-controlled and signalized intersections, LOS is a function of control delay, which includes initial deceleration delay, queue move-up time, stopped delay, and final acceleration delay. Six standards have been established ranging from LOS A where there is little or no delay, to LOS F, where there is delay of more than 50 seconds at unsignalized intersections, or more than 80 seconds at signalized intersections. It should be noted that, although delays can sometimes be long for some movements at a STOP-controlled intersection, the v/c ratio may indicate that there is adequate capacity to process the demand for that movement. Similarly at signalized intersections, some movements, particularly side street approaches or left turns onto side streets, may experience longer delays because they receive only a small portion of the green time during a signal cycle but their v/c ratio may be relatively low. For these reasons it is important to examine both v/c ratio and LOS when evaluating overall intersection operations. Both are reported below. 7 The County operational standards were developed as part of this TSP update. Existing Transportation System Deficiencies 4-5
46 Roadway Segment Operations Two-lane highway operations were evaluated for selected roadway segments on the state highway system. Methodology Two-lane highway operations were determined using procedures outlined in the HCM. Analysis of rural two-lane highway sections takes into account several variables including the magnitude, type, and directional distribution of traffic as well as roadway features such as the percentage of no-passing zones, general terrain, and lane and shoulder widths. Each of these variables affects the capacity of the rural highway. The capacity of a two-lane highway is generally assumed to be 1,700 passenger cars per hour (pcph) per direction of travel, with a maximum of 3,200 passenger cars per hour per direction of travel for both directions combined. Although roadway capacity is largely fixed by roadway features, it does vary based on the composition of traffic. The presence of large trucks increases the passenger car equivalent values due to their size and performance characteristics, especially along upgrades. Therefore, the passenger car equivalent values presented in Table 4-2 are unique to the geometric and prevailing traffic conditions in Future calculation of v/c ratios should include recalculation of passenger car equivalent values to account for potential changes in roadway features or traffic composition. Two-lane highway operations were analyzed for eleven rural segments in Coos County under estimated two-way design hour volumes. The two-lane highway design speed was assumed to be 60 mph. The remaining variables differed by location for each rural highway segment. Since all rural segments have multiple ADT volumes reported, a worst case analysis was performed using the highest reported volume for each segment. Two-lane highways are categorized into two classes for analysis. Class I highways are two-lane highways on which travelers expect to travel at relatively high speeds, while Class II highways are two-lane highways on which motorists accept lower travel speeds (i.e. recreational routes, access routes to Class I highways, or rugged terrain routes). The LOS for Class I highways is defined in terms of both percent time-spent-following and average speed. On Class II highways the LOS is defined only in terms of percent time-spent-following. The average percentage of travel time that vehicles must travel in platoons behind slower vehicles due to the inability to pass is the definition of percent time-spent-following. Results The resulting v/c ratio and LOS for each two-lane highway segment are shown in Table 4-3. All two-lane highway segments currently operate well within v/c ratio standards outlined in the 1999 OHP and most operate under generally good conditions at LOS C or better. The only exception is the section of US 101 north of the North Bend City limits, where traffic volumes are the greatest of any rural segment of highway. Existing Transportation System Deficiencies 4-6
47 Table 4-3. Summary of Two-Lane Highway Operations Existing Condition (2008) Location Design Hour Volume (vph) Passenger Car Equivalent Volume 1 (vph) Two-way Capacity (pcph) V/C Ratio 2 Percent Time Spent Following LOS 3 US 101 At ATR : South of County Line 990 1,110 3, C North Bend city limits 1,785 1,990 3, D At ATR : South of Bandon , C 0.10 mile south of Seven Devils Road , C At the Coos-Curry County Line , B OR 42 North/West of Powers Highway Junction , B OR 42S East of US , B West of Coquille , A OR 241 East of Coos Bay , A OR 540 East of Charleston , B OR 542 South of OR , A Notes: 1. The passenger-car equivalent volumes are adjusted for peak hour factor, for grade, and heavy vehicles. 2. The volume used to compute v/c ratio is the calculated passenger-car equivalent flow rate in vehicles per hour (vph) as described in Chapter 20 of the 2000 Highway Capacity Manual. 3. LOS is defined in terms of both % time-spent-following and average travel speed for Class I two-lane highways and percent time-spentfollowing for Class II two-lane highways. Source: David Evans and Associates, Inc. Intersection Operations Twenty-one (21) intersections located throughout Coos County were analyzed to determine existing intersection operations. Methodology Traffic operations at selected intersections within Coos County were evaluated using procedures outlined in the 2000 Highway Capacity Manual for signalized and unsignalized intersections. The design hour volumes were developed from multiplying the peak hour volumes by the appropriate seasonal factor. Results The results of the intersection analysis are shown in Table 4-4. As shown in Table 4-4, all of the 21 analyzed intersections operate well within ODOT's mobility standards outlined in the 1999 OHP under design (30 th highest) hour conditions. The critical movement represents the non-free flowing movement with the highest v/c ratio. The majority of the intersections operate under generally free flowing conditions at LOS A or B, with LOS C, D, and E only occurring within city limits. This indicates that all other lower-volume intersections or driveways accessing any rural or urban portion of the highways are operating at LOS A or B as well. Existing Transportation System Deficiencies 4-7
48 Table 4-4. Summary of Intersection Operations Existing Condition (2008) Intersection Critical Movement 1 V/C Ratio 2 LOS 2 US 101 at Wildwood Road Westbound left, right 0.39 C Hauser Depot Road Westbound left, through, right 0.18 D North Bay Road (Hauser) Westbound left, through, right 0.08 C Jordan Cove Road Eastbound left, right 0.25 C North Bay Road (South) Westbound left, right 0.32 D East Bay Drive (signalized) Overall 0.66 A Coos-Sumner Lane Westbound left, right 0.13 C Davis Slough Road Northbound left, right 0.04 B West Beaver Hill Road Northbound left 0.05 B Beaver Hill Road Westbound left, right 0.13 C Beach Loop Road Eastbound left, through, right 0.10 B OR 42 at Davis Slough Road Southbound left, right 0.01 B North Bank Road Eastbound left, right 0.09 B Fishtrap Road Southbound left, right 0.04 A OR 42S Eastbound left, right 0.21 B OR 42S at Lampa Lane Northbound left, right 0.01 A OR 241 at Olive Barber Road Westbound left, right 0.39 E Coos River Road Northbound left 0.06 A East Bay Road Northbound left 0.05 A OR 540 at Seven Devils Road Northbound left, through, right 0.08 A Trans-Pacific Highway and Horsefall Road Southbound left, right 0.02 A Notes: 1. The critical movement for unsignalized intersections is the intersection movement with the worst v/c ratio; generally this movement is on the minor approach. At signalized intersections, the critical movement actually reflects the overall intersection operations rather than any single movement. 2. The v/c ratio and LOS are calculated following the methodologies in Chapters 16 and 17 of the 2000 Highway Capacity Manual. Source: David Evans and Associates, Inc. Crash History Crash data from the most recent five-year period available (January 1, 2003 to December 31, 2007) was evaluated for county portions of state highways and for county major and minor collector roads. The purpose of reviewing crash histories is to identify high crash locations, potential crash patterns, and any potential safety concerns at these locations. During the five-year analysis period, there were a 1,330 crashes reported in Coos County outside of city limits. Of these crashes, 37 were fatal collisions. The majority of reported crashes involved a fixed object (43%), rear-end (19%), or turning (12%) collisions. County Roadways Crash data from the most recent five-year period available (January 1, 2003 to December 31, 2007) was evaluated for county major and minor collector roadways but excludes local roads. Existing Transportation System Deficiencies 4-8
49 The evaluation identifies high crash locations, potential crash patterns, and any potential safety concerns at these locations. During the evaluated period, there were 272 crashes reported in Coos County. Of these crashes along county roadways, 15 resulted were fatal collisions. The majority of reported crashes involved a fixed object (54%) collision. Figure 4-2 illustrates the distribution of crashes along county roadways by collision type. County roadways which experienced a high frequency (ten or more crashes during the study period) of crashes or one or more fatal collisions are shown in Table 4-5. Table 4-5. Crash History for County Roadways ( ) Road # Name Jurisdiction Fatal Crashes Total Crashes Average Crashes Per Year 184 Libby Lane County East Bay Road County Fairview Road County Seven Devils Road County Beaver Hill Road. County A North Bay Road County North Bank Lane County Olive Barber Road County Fairview Sumner Lane County Sitkum Lane County Lampa Lane County South Powers Road County North Lake Lane County McKinley Lane County Beach Loop Road. County Private Roadways Private Total Source: ODOT Crash Analysis Reporting System Most of the roadways listed in Table 4-5 have narrow paved surfaces with little to no paved shoulder. Many also have sharp horizontal curves. The most common collision type was fixedobject involving a single vehicle running off the road. Most of the fatal crashes were also fixedobject collisions but there were a few multi-vehicle fatal crashes from head-on angle collisions. The county roads with the greatest number of collisions are discussed below. Libby Lane There were 40 reported crashes along Libby Lane during the five-year study period. The most frequent collision type was fixed-object, which accounted for 22 of the total crashes (more than half). Eighteen of the reported crashes occurred in a horizontal curve. There were 3 fatal crashes, which all occurred in different segments and involved separate collision types (headon, fixed-object, and angle). Crashes were relatively distributed throughout this roadway. Existing Transportation System Deficiencies 4-9
50 Crashes by Collision Type: Coos County Roadways (272 total crashes) Sideswipe-M Sideswipe-O 3% 4% Head-On Angle 3% 2% Backing 1% Pedestrian 1% Other 6% Fixed Object 44% Non-Collision 6% Turning 11% Rear 19% Libby Lane (40 total crashes) Fairview Road (24 total crashes) Other 3% Sideswipe-M 8% Angle 5% Head-On 5% Backing 3% Other 13% Head-On 4% ` Sideswipe-M 4% Non-Collision 12% Turning 7% Rear 2% Fixed Object 55% Non-Collision 13% Turning 8% Rear 8% Fixed Object 50% East Bay Road (26 total crashes) Seven Devils Road (21 total crashes) Other 8% Sideswipe-O 4% Backing 4% Sideswipe-M 6% Angle 6% Non-Collision 11% Head-On 17% Turning 15% Rear 8% Fixed Object 50% Rear 12% Fixed Object 59% Figure 4-2 Crashes by Collision Type: County Roadways ( Reported Crashes) Coos County TSP Update
51 Fairview Road Twenty-four crashes occurred on Fairview Road during the five-year analysis period. The most frequent collision type was fixed-object, which accounted for 12 of the total crashes (half of the total). There were no fatal crashes that occurred on this roadway. Nine of the reported crashes occurred in a horizontal curve. Clusters of crashes occurred at milepost 1.0 (3), between milepost 5.0 and 6.0 (6), and between milepost 8.6 and 8.9 (3), but crashes were otherwise distributed throughout this corridor which has sharp horizontal curves throughout. East Bay Road Of the 26 reported crashes along East Bay Road during the five-year study period, the most frequent collision types were fixed-object (13) and turning (4) related. There were no fatal crashes that occurred on this roadway. East Bay Road has little to no shoulders and sharp horizontal curves throughout the corridor. Clusters of crashes occurred near milepost 1.0 (one mile southeast of US 101 connection), and between milepost 5.0 and 6.0 (2 miles northwest of OR 241). Seven Devils Road Of the 21 reported crashes along Seven Devils Road during the five-year study period, the most frequent (13) collision type was fixed-object related. There were also 4 head-on collisions, 2 of which occurred at milepost 2.5. There was 1 fatal crash along this roadway, which involved a head-on collision. Crashes were relatively distributed throughout the corridor, which has sharp horizontal curves throughout. State Highways In addition to the five-year review of crash data, ODOT s Crash Summary Database also calculates three useful factors for comparison with statewide statistics: average crash rates by segment, the Safety Priority Index System (SPIS) value, and Safety Investment Program (SIP) rating. After the overview of these statewide statistics, there is a safety evaluation which discusses each state corridor. Crash Data Crash data from the most recent five-year period available (January 1, 2003 to December 31, 2007) was evaluated for State roadways to identify high crash locations, potential crash patterns, and any potential safety concerns at these locations. During the evaluated period, there were a total of 1058 crashes reported on state highways in Coos County. Of these crashes along state highways, 22 resulted in a fatality(s). The majority of reported crashes involved a fixed object (42%), rear-end (22%), or turning (13%) related collision. Figure 4-3 illustrates the distribution of crashes along state highways by collision type. Each state highway experienced at least one fatal crash during the analysis period. Table 4-6 itemizes the observed crashes by highway. In addition, Figure 4-4 illustrates identified safety locations along state and county facilities. Existing Transportation System Deficiencies 4-10
52 Sideswipe-O 7% Other 5% Non-Collision 5% US-101 (Oregon Coast Highway) (485 total crashes) Sideswipe-M 2% Head-On Angle 1% 2% Fixed Object 33% OR-42 (Coos Bay-Roseburg Hwy) (313 total crashes) Sideswipe-O Sideswipe-M 3% Head-On 3% Angle 3% Other 1% 9% Non- Collision 7% Turning 15% Rear 30% Turning 8% Rear 10% Fixed Object 56% OR-42S (Coquille-Bandon Highway) (45 total crashes) OR-241 (Coos River Hwy ) (69 total crashes) Other 13% Head-On 2% Sideswipe-M 7% Angle 2% Other 6% Sideswipe-M 6% Pedestrian Head-On 1% 3% Fixed Object 43% Non-Collision 7% ` Non-Collision 7% Turning 9% Rear 4% Fixed Object 56% Turning 12% Rear 22% OR-540 (Cape Arago Hwy) (98 total crashes) OR-542 (Powers Highway) (48 total crashes) Other 2% Sideswipe-O 5% Head- Backing On 1% Angle 3% 3% Pedestrian 2% Fixed Object 19% Sideswipe-O 2% Other 2% Head- On 2% Sideswipe-M 4% Angle 2% Pedestrian 2% Non- Collision 1% Non-Collision 13% Turning 21% Rear 43% Turning 8% Rear 2% Fixed Object 63% Figure 4-3 Crashes by Collision Type: State Highways ( Reported Crashes) Coos County TSP Update


 90%")

 6-9 Crashes (Cat. 4) 10+ Crashes (Cat. 5) 3 1.")

53 Lakeside 101 North Bend Coos Bay Coquille 42S Bandon Myrtle Point 42 Figure 4-4 Identified Safety Locations Coos County TSP Update 242 Approximate Fatal Crash Location State Highway County Road Powers City Boundary Safety Priority Index System (SPIS) 90% - 95% 95% - 100% Safety Investment Program (SIP) Segment Ratings Port Orford 0 Crashes (Cat. 1) 1-2 Crashes (Cat. 2) 3-5 Crashes (Cat. 3) 6-9 Crashes (Cat. 4) 10+ Crashes (Cat. 5) Miles Source Data: ODOT, Coos County File: P:\O\ODOT \0600INFO\GS\arcmap\TM3\Existing Streets and Crashes
54 Table 4-6. Crash History for State Highways ( ) Route Name Fatal Crashes Total Crashes Average Crashes Per Year US 101 Oregon Coast OR 42 Coos Bay-Roseburg OR 540 Cape Arago OR 241 Coos River OR 542 Powers OR 42S Coquille-Bandon Total Source: ODOT Crash Analysis Reporting System Average Crash Rates The first factor is a computed average crash rate, which compares the number of crashes with the ADT volume and the length of the segment analyzed. The crash rate, as summarized in Table 4-7 for a stretch of roadway is typically calculated as the number of crashes per million vehicle miles (crashes/mvm) traveled along that segment of roadway. Table 4-7. Historic Crash Rates for State Highways Crashes per Million Vehicle Miles Highway/Segment Milepost US 101 (Oregon Coast Highway) Coos/Douglas County Line to Lakeside (Rural) Lakeside to North Bend (Rural) Coos Bay to End of Urban Area (Suburban) Coos Bay to Bandon (Rural) Bandon to Coos/Curry County Line (Rural) OR 42 (Coos Bay-Roseburg Highway) US 101 to Coquille (Rural) Coquille to Myrtle Point (Rural) Myrtle Point to Coos/Douglas County Line (Rural) OR 42S (Coquille-Bandon Highway) Bandon-Coquille (Rural) OR 241 (Coos River Highway) US 101 to Coos Bay (Suburban) Coos Bay to End Highway (Rural) OR 540 (Cape Arago Highway) Coos Bay to End Highway (Rural) OR 542 (Powers Highway) OR 42 to Powers (Rural) Statewide Average Suburban Non-Freeway Statewide Average Rural Non-Freeway Source: State Highway Crash Rate Tables (Oregon), 2007 Existing Transportation System Deficiencies 4-11
55 Crash rates that exceed the statewide average for similar roadways (shown at the bottom of Table 4-7) are highlighted in black. Countywide, there are numerous locations which exceed the statewide average crash rates. Safety Priority Index System (SPIS) The SPIS is a method used in Oregon to identify safety problem areas along state highways. Highways are evaluated in approximately one-tenth mile increments (often grouped into larger segments). Each year these segments are ranked by assigning a SPIS score based on the frequency and severity crashes observed, while taking traffic volume into account. When a segment is ranked in the top 10% of the index, a crash analysis is typically warranted and corrective actions are considered. There are 11 highway segments identified in the top 10% of the SPIS rankings within Coos County. Safety Investment Program (SIP) Oregon uses the SIP to prioritize investments at identified safety locations through the Statewide Transportation Improvement Program (STIP). SIP locations are broken into five different categories based upon the frequency and severity of observed crashes within a threeyear study period. The categories are categorized as follows: Category 1: 0 (no) fatal or injury A (serious) crashes Category 2: 1 to 2 fatal or injury A crashes Category 3: 3 to 5 fatal or injury A crashes Category 4: 6 to 9 fatal or injury A crashes Category 5: 10 or more fatal or injury A crashes. Funding is generally targeted at locations with category rankings 3 through 5. There are 46 SIP locations along state highways in Coos County. Of the SIP locations, 14 are category 3 or higher. Safety Evaluation by Corridor The crash patterns, rates, SPIS, and SIP locations are described for each corridor. US 101 (Oregon Coast Highway) There were 485 ODOT reported crashes along US 101 during the five-year analysis period, which results in an annual average of 97 crashes. Ten of the reported crashes were fatal collisions. The majority of crashes along this corridor were fixed object (33%), rear-end (30%), or turning (15%) collisions (see Figure 4-3). The 10 fatal crashes that occurred along this corridor resulted from 4 fixed object, 2 pedestrian, 2 sideswipe-meeting, 1 turning, and 1 non-collision related collisions. Only 1 segment along this corridor experienced 2 fatalities during the analyzed period (approximate milepost ). This segment contains a passing lane and a small turnout/forest access. Existing Transportation System Deficiencies 4-12
56 Average crash rates between milepost and (Coos Bay to end of urban area) are approximately 50% higher than the statewide average for similar roadways. This section is in an urban/suburban environment with frequent access points. Table 4-8 summarizes the SPIS and SIP locations along US 101. There are 4 top 10% SPIS segments identified in 2008 along US 101 within Coos County. The first three SPIS locations correspond with SIP segments rates 3 or higher. In addition, US 101 has 16 SIP segments identified with four locations that are category 3 or higher. Table 4-8. SPIS and SIP Locations ( ) US 101 Rating System Milepost SIP Information Beginning Ending No. of Crashes Category SPIS Score SPIS SPIS SPIS SPIS SIP SIP SIP SIP Sources: ODOT Safety Priority Index System (2008) and Oregon Safety Improvement Program, 2008 OR 42 (Coos Bay-Roseburg) Highway There were a total of 313 ODOT reported crashes along OR 42 during the five-year period analyzed, which results in an annual average of 63 crashes. Four of the reported were fatal collisions. The majority of crashes along this corridor were fixed object (56%), rear-end (10%), or turning (8%) collisions. Over half (170 of 313) of the crashes along this corridor occurred between mileposts 0.00 (US 101) and 7.0. Other clusters of crashes occurred near mileposts 9.0, 13.0, 24.0, and The 4 fatal crashes that occurred along this corridor resulted from 3 fixed object, and 1 head-on related collision(s). There were no segments along this corridor that experienced greater than 1 fatal crash during the analyzed period; however, all fatal crashes occurred in the 9-mile section between milepost 23.5 and Average crash rates along OR 42 were generally at or below the statewide average for similar roadways. Only the segment between US 101 and Coquille (milepost ) has a threeyear average crash rate higher than the statewide average. Table 4-9 summarizes the SPIS and SIP locations along US 101. There are 2 top 10% SPIS segments identified in 2008 along OR 42 within Coos County. The SPIS locations correspond with SIP segments rates 3 or higher. In addition, there are also 16 SIP locations identified along OR 42. Seven of the SIP locations are category 3 or higher. Existing Transportation System Deficiencies 4-13
57 Table 4-9. SPIS and SIP Locations ( ) OR 42 Rating System Milepost SIP Information Beginning Ending No. of Crashes Category SPIS Score SPIS SPIS SIP SIP SIP SIP SIP SIP SIP Sources: ODOT Safety Priority Index System (2008) and Oregon Safety Improvement Program, 2008 OR 42S (Coquille-Bandon Highway) There were a total of 45 ODOT reported crashes along OR 42S during the five-year period analyzed, which results in an annual average of approximately 9 crashes. Two of the reported crashes were fatal collisions. The majority of crashes along this corridor were fixed object (56%), turning (9%), or non-collision (7%) collisions. The 2 fatal crashes that occurred along this corridor resulted from 1 fixed object and 1 turning related collision. Crashes were relatively distributed throughout the corridor. Average crash rates along OR 542 were almost double the statewide average for similar roadways (1.33 vs. 0.78). Table 4-10 summarizes the SIP locations along OR 42; there are no SPIS locations. There are 3 SIP locations identified along OR 42S. One of the SIP locations is category 3. Table STIP and SIP Locations ( ) OR 42S Rating Milepost SIP Information System Beginning Ending No. of Crashes Category SPIS Score SIP Sources: ODOT Safety Priority Index System (2008) and Oregon Safety Improvement Program, 2008 OR 241 (Coos River Highway) There were 69 ODOT reported crashes along US 101 during the five-year period analyzed, which results in an annual average of approximately 14. One of the reported crashes resulted in a fatality(s). The majority of crashes along this corridor were fixed object (43%), rear-end (22%), or turning (12%) related. Crashes were relatively distributed throughout the corridor. Existing Transportation System Deficiencies 4-14
58 The fatal crash that occurred along this corridor resulted from a fixed object collision on a segment with a sharp horizontal curve and a single lane with no shoulder in each direction. Average crash rates between milepost 2.19 and (Coos Bay to end of highway) are more than double the statewide average for similar roadways. This section is in a rural environment. There are no SPIS locations along OR 241 but there are 4 SIP locations identified. None of the SIP locations are category 3 or higher. OR 540 (Cape Arago Highway) There were 98 ODOT reported crashes along OR 540 during the five-year period analyzed, which results in an annual average of 20 crashes. Three of the reported crashes were fatal collisions. The majority of crashes along this corridor were rear-end (44%), fixed object (19%), rear-end (10%), or turning (20%) collisions. Most of the reported crashes occurred in the urban segments which have frequent access points. Moreover, 84 of the 98 reported crashes (85%) occurred between milepost 4.5 and 8.5. Although the most frequent collision types on OR 540 were rear-end and turning related, 2 of the 3 fatal crashes that occurred along this corridor resulted from fixed-object collisions in the area which experience a low frequency of crashes (between milepost 9.0 and 10.0). The remaining fatal crash resulted from a rear-end collision. Average crash rates along OR 540 were approximately double the statewide average for rural roadways. Although this section of the highway is classified as a rural environment, much of it passes through suburban segments (where most of the crashes occurred). Even if the average crash rate is compared to a statewide suburban crash rate, OR 540 would be 34% higher than the average crash rate. Table 4-11 summarizes the SPIS and SIP locations along OR 540. There are 4 top 10% SPIS segments identified in 2008 along OR 540 within Coos County. All of the SPIS locations correspond with SIP segments rates 3 or higher. In addition, there are also 3 SIP locations identified along OR 42; two locations are category 3 or higher. Table SPIS and SIP Locations ( ) OR 540 Rating System Milepost SIP Information Beginning Ending No. of Crashes Category SPIS Score SPIS SPIS SPIS SPIS SIP SIP Sources: ODOT Safety Priority Index System (2008) and Oregon Safety Improvement Program, 2008 Existing Transportation System Deficiencies 4-15
59 OR 542 (Powers Highway) There were 48 ODOT reported crashes along OR 542 during the five-year period analyzed, which results in an annual average of approximately 10 crashes. Two of the reported crashes were fatal collisions. The majority of crashes along this corridor were fixed object (63%), noncollision (13%), or turning (8%) collisions. The 2 fatal crashes that occurred along this corridor resulted from fixed object related collisions. Crashes were distributed throughout the corridor. Average crash rates along OR 542 were nearly double the statewide average for similar roadways (1.40 vs. 0.78). Table 4-12 summarizes the SPIS and SIP locations along OR 540. There is one top 10% SPIS segments identified in 2008 along OR 542 within Coos County. This segment is located from milepost to (SPIS score =51.78). There are also 4 SIP locations identified along OR 542. None of the SIP locations are category 3 or higher. Table SPIS and SIP Locations ( ) OR 542 Rating Milepost SIP Information System Beginning Ending No. of Crashes Category SPIS Score SPIS Sources: ODOT Safety Priority Index System (2008) and Oregon Safety Improvement Program, 2008 Demographics Demographic data will be used in the development of travel forecasts for the Coos County transportation system. Baseline population and employment data along with other demographic statistics are discussed below. Population Population distribution for the urban and rural areas within Coos County is summarized in Table According to the Oregon Blue Book, the 2007 overall population in Coos County was just over 63,000 residents. Population has grown 6.8 percent since 1990, an average of approximately 0.4 percent per year. Growth has been more rapid since 2000, an average growth rate of 0.7 percent per year. Most of the growth has been in and around the urban areas with slower growth in the rural areas. The slower growth in rural areas in part reflects the incorporation of additional areas within city limits as communities grew. Bandon has grown the most in the last 17 years while Myrtle Point has lost population since Existing Transportation System Deficiencies 4-16
60 Table Coos County Population Population Location Growth Growth Urban 38,305 36,541 35, % 4.8% Bandon 3,235 2,833 2, % 14.2% Coos Bay 16,210 15,374 15, % 5.4% Coquille 4,215 4,184 4, % 0.7% Lakeside 1,545 1,421 1, % 8.7% Myrtle Point 2,540 2,451 2, % 3.6% North Bend 9,830 9,544 9, % 3.0% Powers % -0.5% Rural 24,745 26,238 24, % -5.7% Total 63,050 62,779 60, % 0.4% Source: Oregon Blue Book, 2007 Employment Total non-farm employment within Coos County is summarized in Table Table Coos County Non-Farm Employment Data Employment Location Growth Private 16,420 15, % Government 6,220 5, % Total Non-Farm 22,640 21, % Source: Oregon Employment Department According to the Oregon Employment Department, the 2008 estimated non-farm employment in Coos County was just over 22,640 jobs with almost 73 percent in the private sector. Total employment has grown 6.9 percent since 2001, an average of approximately 1.0 percent per year. Growth in the private sector has been slightly faster than growth in the government sector. Comparing Table 4-14 with Table 4-13 shows that employment in Coos County has been growing at a faster rate than population. However, with recent downward trends in employment throughout the state, growth rates may be more similar. Travel Characteristics Understanding system user travel characteristics can be helpful in identifying potential measures that could be implemented to manage demand on the transportation system. Data from the 2000 US Census is available to illustrate some county-wide travel behaviors. Existing Transportation System Deficiencies 4-17
61 Travel Mode Distribution US Census data includes statistics on how Coos County residents commute to work. These data are summarized in Table Table Coos County Journey-to-Work Trips 2000 Census Trip Type Trips Percent Private Vehicle 22, % Drove Alone 19, % Carpooled 3, % Public Transportation % Motorcycle % Bicycle % Walk % Other % Work at Home % Total 25, % Source: US Bureau of Census, 2000 Census The current transportation system in Coos County is relies almost exclusively on the automobile, except in more populated areas where walking or riding a bicycle is an option. As a result, Coos County residents use automobiles for their primary mode of travel to work. Almost 90 percent of all trips to work were made in private vehicles with single-occupancy vehicles accounting for more than 77 percent and carpooling accounting for more than 12 percent. The next most common mode of travel is actually the non-commute option of working at home at more than 5 percent. Commute Trip Times Table 4-16 summarizes travel time statistics for commute trips from the US Census data. In Coos County, more than 28 percent of the journey-to-work trips take less than 10 minutes and 35 percent were between 10 and 20 minutes. Many of these shorter trips were made within cities or within the urbanized area surrounding the cities. Travel between most cities in Coos County takes at least 30 minutes. Almost 19 percent of the trips were 30 minutes or longer, which may reflect some intercity commuting within the county or possibly to other communities outside the county. Use of the automobile for commuting is the dominant travel choice even for those who commute less than five minutes. While a five-minute automobile trip could cover a number of miles, a five-minute walk will likely cover approximately one-quarter to one-half mile and a fiveminute bike ride will likely cover one to one and one-half miles. Existing Transportation System Deficiencies 4-18
62 Table Coos County Travel Time to Work 2000 Census Trip Type Trips Percent Less than 5 minutes 1, % 5 to 9 minutes % 10 to 14 minutes % 15 to 19 minutes % 20 to 29 minutes 3, % 30 to 39 minutes 2, % 40 to 59 minutes % 60 to 89 minutes % 90 minutes or longer % Work at Home 1, % Total 1, % Source: US Bureau of Census, 2000 Census A commonly used threshold for acceptable walking distances is one-quarter mile. At a reasonable pace, an average person can walk approximately one-quarter mile in five minutes. Therefore, the almost 7 percent of work trips in Coos County taking less than five minutes represents the trips that could potentially be made by walking. For walking to occur safely and efficiently, there must be adequate infrastructure (i.e., sidewalks, pathways, shoulders) in place to support it. Since most pedestrian destinations are located in and around the cities, the most likely places to increase pedestrian activity are the urban fringes around the cities. Departure to Work Distribution The spread of departure to work times over a 24-hour periods is summarized in Table Table Coos County Departure to Work 2000 Census Trip Type Trips Percent 12:00 a.m. to 4:59 a.m. 1, % 5:00 a.m. to 5:59 a.m % 6:00 a.m. to 6:59 a.m. 3, % 7:00 a.m. to 7:59 a.m. 7, % 8:00 a.m. to 8:59 a.m. 6, % 9:00 a.m. to 9:59 a.m. 1, % 10:00 a.m. to 10:59 a.m % 11:00 a.m. to 11:59 a.m % 12:00 p.m. to 3:59 p.m % 4:00 p.m. to 11:59 p.m % Total 26, % Source: US Bureau of Census, 2000 Census Existing Transportation System Deficiencies 4-19
63 Over 29 percent of employees depart for work between 7:00 and 8:00 a.m., and another 38 percent depart in either the hour before or hour after the morning peak hour. Assuming an average nine-hour workday, the corresponding afternoon peak can be determined for work trips. Using this methodology, the peak work travel hour would occur between 4:00 and 5:00 p.m., which corresponds to the peak hour of activity measured for most traffic volumes. Existing Transportation System Deficiencies 4-20
64 5. FUTURE TRANSPORTATION SYSTEM DEFICIENCIES Chapter 5 presents transportation system deficiencies expected by the future year This section examines long-term population and employment growth forecasts for Coos County along with growth trends for state highways. This information is used to develop the traffic volume forecasts for use in the operational analysis. Demographics Demographic data is used in the development of travel forecasts for the Coos County transportation system. Baseline and forecast population and employment forecasts for Coos County are summarized in Table 5-1. Table 5-1. Coos County Population and Employment Forecasts Demographic Year Historic Growth Rates Forecast Total Annual Total Annual Population 1 62,779-63,210 64, % 0.03% 2.7% 0.12% Non-Farm Employment 2-21,170 22,640 27, % 0.99% 21.5% 0.98% Notes: 1. Population data and forecasts based on data from the Forecasts of Oregon s County Populations and Components of Change, released by the Oregon Office of Economic Analysis in April Historic data from Oregon Employment Department. Employment forecast is prorated from the Industry Employment Forecast, , for Coos and Curry Counties which is published by the Oregon Employment Department in June Source: Oregon Office of Economic Analysis and Oregon Employment Department Population According to the Oregon Office of Economic Analysis (OEA), overall population in Coos County is expected to increase by 2.7 percent between 2008 and 2030, which would result in a straightline average growth rate of 0.12 percent per year. This growth rate is higher than the historic rate of 0.03 percent per year that was recorded between 2000 and Employment The Oregon Employment Department prepared a 10-year (2006 through 2016) employment forecast for Coos and Curry Counties combined, which showed an average growth rate of almost one percent per year. This rate is similar to the historic rate for Coos County over the 2001 through 2008 period. To estimate 2030 forecasts, this annual growth rate was applied to the 2008 employment, resulting in an employment forecast of 27,500. The total growth from 2008 to 2030 is estimated at 21.5 percent. Comparing employment growth with population growth shows that employment in Coos County has been growing at a faster rate than population and that trend is expected to continue into the future. Future Transportation System Deficiencies 5-1
65 Future Traffic Volumes The future year (2030) traffic volume estimates for Coos County were developed based on county growth forecasts and ODOT estimates of traffic growth on state highways. Consideration of different roadway characteristics was another factor used in developing the future year volume estimates. Three growth assumptions were applied in developing the forecast traffic volumes: 1. On state highways, the ODOT future volume tables were used to estimate 2030 traffic volumes. In the North Bend/Coos Bay urban area, where a travel demand forecasting model has been developed, traffic forecasts on the highways are derived from the model growth trends. Forecasts for the remaining highway segments are based on trendline growth patterns derived from historical traffic data. 2. On coastal county roads which serve tourism-related activities, the growth rate from the intersecting state highway was applied. The state highway growth trends are assumed to more closely reflect growth on these roadways than the county road growth rate. The state highway growth trends are also similar to the employment growth forecasts which include stronger growth in the retail, leisure, and hospitality sectors. 3. On inland county roads which primarily serve the local communities in the county, a separate county road growth rate was applied. These roads are generally more tied to the housing development patterns of the community rather than the traffic volumes on the state highway. The specific daily and hourly traffic forecasts developed using these assumptions are discussed below. Average Daily Traffic Figure 5-1 illustrates estimated ADT volumes at key locations on state highways and major county roads. County Roads The 2030 ADT volumes on selected roadways in Coos County were estimated from the 2008 traffic volumes and the growth assumptions outlined above. Growth along most county roadways are estimated under assumption #3 above (3 percent growth assumed); however, four coastal county roads are anticipated to experience higher tourism-related growth (growth assumption #2): Hauser Depot Road - 27 percent growth Jordan Cover Road - 27 percent growth Transpacific Parkway - 27 percent growth Beach Loop Drive - 27 percent growth Future Transportation System Deficiencies 5-2
66 Figure 5-1 Future Average Daily Traffic in Coos County (2030)
67 Some of the most heavily used county roads with ADT volumes between 1,000 and 3,000 vehicles per day include: East Bay Drive Olive Barber Road Wildwood Road Coos-Sumner Lane Beaver Hill Road Seven Devils Road Jordan Cove Road North Bay Road Transpacific Parkway Coos River Road The ADT volumes estimated for other roadways around the county were under 1000 vehicles per day. State Highways The 2030 ADT volumes on the state highways in Coos County were taken from the ODOT 2007 Traffic Volume Tables, the 2027 Future Volume Tables, and the growth assumptions outline above. US 101 (Oregon Coast Highway) Traffic volumes on the sections of US 101 outside cities are expected to vary from a low of 6,500 at the Coos-Curry county line to over 31,100 just south of the Coos Bay city limits. Growth in ADT is expected to range between 17 percent (North Bend city limits) and 40 percent (Coos-Curry County Line), with fluctuations throughout the county. Volumes at the north end of US 101 at the Coos-Douglas county line (M.P ) are estimated at just over 8,600 ADT. Moving southward along the highway, volumes would continue to grow until they are almost double (17,600 ADT) at the North Bend city limits, with approximately 18 percent growth. Volumes just south of the Coos Bay city limits are expected to be over 31,100 ADT, but they would drop off considerably in less than half a mile; just south of the OR 241 junction, ADT is estimated at 20,500 (39 percent growth). Volumes are expected to drop again dramatically just south of the OR 42 junction with ADT near 7,900 (22 percent growth). They are estimated to remain similar near Bandon with 7,900 ADT (22 percent growth), but drop to their lowest level (6,500 ADT and 40 percent growth) at the Coos-Curry county line (M.P ). OR 42 (Coos Bay-Roseburg) Highway Outside city limits, traffic volumes on OR 42 are expected to vary from a high of 14,800 ADT, just east of the junction with US 101, to a low of 4,000 ADT at the Coos-Douglas county line. Growth in ADT is estimated at 40 percent just east of US 101, drop to 8 percent west of Myrtle Point, and fluctuate towards 29 percent at the County line. OR 42S (Coquille-Bandon Highway) Traffic volumes on OR 42S are expected to be highest just east of Bandon with an ADT of approximately 5,000 (22 percent growth). They would drop off to an estimated low of 1,700 ADT between Bandon and Coquille and then increase as they approach the Coquille city limits with an ADT of 2,500 (9 percent growth). Future Transportation System Deficiencies 5-3
68 OR 241 (Coos River Highway) Traffic volumes are highest on the section of OR 241 between US 101 and where it enters the Coos Bay city limits with approximately 10,900 ADT. After exiting Coos Bay, the ADT is expected to be 4,400, dropping to around 1,500 ADT over the next two miles and continuing to decrease until the end of the roadway. East of the city limits, growth is estimated at approximately 17 percent. OR 540 (Cape Arago Highway) At the south city limits of Coos Bay, the traffic volumes on OR 540 are approximately 10,600 ADT. Going southward, they drop to approximately 7,000 ADT (41 percent growth) in the community of Charleston and then drop further to 1,600 ADT at the entrance to the state parks. OR 542 (Powers Highway) Traffic volumes on OR 542 are expected to be highest just south of OR 42 at 2,600 ADT (56 percent growth) dropping to near 1,300 ADT (38 percent growth) at the Powers city limits. Design Hourly Volumes The design hourly volumes (DHVs) for 2030 were derived using the existing relationship between DHVs and ADT volumes. As detailed in the Chapter 4: Existing Transportation System Deficiencies, the DHVs (30 th highest hour) range from 10 to 16 percent of the ADT based on permanent counters located on highways in Coos, Douglas, and Lane Counties. These data also show that the 30 th highest hour as a percentage of ADT fluctuates minimally each year. The DHVs are presented under the traffic operations section of the report in the analysis of twolane highways (see Table 4-3). Traffic Operations Traffic operations were analyzed for selected roadway segments and intersections throughout Coos County. Operations were evaluated according to the methodologies in the 2000 Highway Capacity Manual (HCM) 8. Operational Criteria Chapter 4: Existing Transportation System Deficiencies provides a detailed description of the operational outputs and criteria used in the traffic operations analysis. The operational standards applicable to the state highways in Coos County are found in the Oregon Highway Plan. Standards found in the most recent version of the Oregon Highway Plan are summarized in Table 4-2. Oregon Highway Plan (OHP) mobility standards are applied for existing and future no build conditions (no/limited geometric changes). Highway Design Manual (HDM) mobility standards 8 Highway Capacity Manual, Transportation Research Board, Washington DC, Future Transportation System Deficiencies 5-4
69 are applied in conjunction with any design changes. HDM standards can be found in Table 10-1 of the most recent version of the manual. A maximum v/c ratio of 0.85 should be maintained for all County-maintained intersections during a typical weekday peak hour, for existing facilities and design modifications. Although v/c standards are applied for county and state facilities, level of service (LOS) is a widely recognized and accepted measure and descriptor of traffic operations and is therefore also presented. Roadway Segment Operations Two-lane highway operations were evaluated for selected roadway segments on the state highway system. Chapter 4: Existing Transportation System Deficiencies provides a detailed description of the methodology used in the traffic operations analysis for two-lane highways. The resulting v/c ratio and LOS for each two-lane highway segment are shown in Table 5-2. Table 5-2. Summary of Two-Lane Highway Operations Future Condition (2030) Location Design Hour Volume (vph) Passenger Car Equivalent Volume 1 (vph) Two-way Capacity (pcph) V/C Ratio 2 Percent Time Spent Following LOS 3 US 101 At ATR : South of Coos-Douglas Line , D At ATR : South of Bandon , C At ATR : North of OR , E 0.10 mile south of Seven Devils Road , C AT Coos-Curry County Line , C OR 42 Northwest of Powers Highway Junction , B OR 42S East of US , B West of Coquille , A OR 241 East of Coos Bay , D OR 540 East of Charleston , A OR 542 South of OR , C Notes: 1. The passenger-car equivalent volumes are adjusted for peak hour factor, for grade, and heavy vehicles. 2. The volume used to compute v/c ratio is the calculated passenger-car equivalent flow rate in vehicles per hour (vph) as described in Chapter 20 of the 2000 Highway Capacity Manual. 3. LOS is defined in terms of both % time-spent-following and average travel speed for Class I two-lane highways and percent time-spentfollowing for Class II two-lane highways. Source: David Evans and Associates, Inc. One of the 11 two-lane highway segments that were analyzed are expected to operate with v/c ratios above the standards outlined in the 1999 OHP (see Table 4-2). This segment is located on US 101 just north of North Bend. At each of these highway segments, slower speeds and long platoons of vehicles (i.e., vehicles grouped together behind a slower-moving vehicle) are expected, as well as an increase in passing difficulty. Some of the other highway segments Future Transportation System Deficiencies 5-5
70 shown in the table would have acceptable v/c ratios but would experience LOS D conditions indicating longer vehicle platoons and difficulty passing. Intersection Operations Twenty-one (21) intersections located throughout Coos County were analyzed to determine existing intersection operations. Chapter 4: Existing Transportation System Deficiencies provides a detailed description of the methodology used in the intersection operations analysis. The results of the intersection analysis are shown in Table 5-3. Table 5-3. Summary of Intersection Operations Future Condition (2030) Intersection Critical Movement 1 V/C Ratio 2 LOS 2 US 101 at Wildwood Road Westbound left, right 0.58 E Hauser Depot Road Westbound left, through, right 0.45 F North Bay Road (Hauser) Westbound left, through, right 0.12 C Jordan Cove Road Eastbound left, right 0.41 D North Bay Road (South) Westbound left, right 0.50 E East Bay Drive (signalized) Overall 0.77 A Coos-Sumner Lane Westbound left, right 0.23 C Davis Slough Road Northbound left, right 0.04 B West Beaver Hill Road Eastbound left, right 0.06 B Beaver Hill Road Westbound left, right 0.17 C Beach Loop Road Eastbound left, through, right 0.13 C OR 42 at Davis Slough Road Southbound left, right 0.01 B North Bank Road Eastbound left, right 0.09 B Fishtrap Road Southbound left, right 0.04 B OR 42S Eastbound left, right 0.34 C OR 42S at Lampa Lane Northbound left, right 0.01 A OR 241 at Olive Barber Road Westbound left, right 0.64 F Coos River Road Eastbound right 0.05 A East Bay Road Northbound left 0.07 A OR 540 at Seven Devils Road Northbound left, through, right 0.08 A Trans-Pacific Highway at Horsefall Road Southbound left, right 0.03 A Notes: 1. The critical movement for unsignalized intersections is the intersection movement with the worst v/c ratio; generally this movement is on the minor approach. At signalized intersections, the critical movement actually reflects the overall intersection operations rather than any single movement. 2. The v/c ratio and LOS are calculated following the methodologies in Chapters 16 and 17 of the 2000 Highway Capacity Manual. Source: David Evans and Associates, Inc. As shown in Table 5-3, all but one of the 21 analyzed intersections are expected to operate within ODOT's mobility standards outlined in the 1999 OHP under design (30 th highest) hour conditions. The signalized intersection of East Bay Drive at US 101 would have a v/c ratio of 0.77 but would operate at LOS A, indicating that movements on US 101 would not experience significant delay. Future Transportation System Deficiencies 5-6
71 The remaining intersections all meet the OHP mobility standards, but some of the intersections along US 101 between Wildwood Road and East Bay Drive would experience longer delays (LOS D and E) during peak periods. One other intersection, Olive Barber Road at OR 241 is expected to experience long delays during peak periods. Because this intersection serves primarily residential traffic, delays may be longer in the morning than in the afternoon. Future Transportation System Deficiencies 5-7
72 6. TRANSPORTATION SYSTEM PLAN The purpose of this chapter is to provide a detailed transportation system plan that will achieve the goals and objectives set forth by the Coos County community. Components of the TSP include roadway standards, access management guidelines, and improvement plans for all modes. Under the modal plans, this chapter addresses improvements or strategies to meet the needs of all transportation modes appropriate for Coos County. It is expected that Coos County will ultimately adopt this TSP as the transportation component of their Comprehensive Plan. This Chapter proposes changes/improvements in the following categories: Roadway System Plan o Street Design Standards o Access Management Standards o Traffic Operations Standards o Roadway Improvement Projects o Natural Hazard Mitigation Projects Pedestrian and Bicycle Plan Public Transportation Plan Rail Plan Airport Plan Pipeline Plan Water Plan The potential projects identified in this Chapter include projects that have been identified for implementation in Coos County either through ODOT s Statewide Transportation Improvement Program (STIP), City Plans within the County, the County s road maintenance program, or any other planning mechanism. Each potential project includes a location description, brief overview, and planning level cost estimate. Costs were estimated for design and construction using current unit costs, such as per linear foot, with a 40 percent contingency included to account for price escalation, utility relocations and other items that cannot be quantified at the planning level; however, cost estimates do not incorporate the purchase of right-of-way. Roadway System Plan The Coos County roadway system plan aims to provide the desired levels of mobility, access, maintenance, and safety over the next 20 years. The plan focuses on the County s collector and arterial system, although road standards are also provided for local roadways. Transportation System Plan 6-1
73 Functional Classification The functional classification system for the Coos County roadway network includes arterials, rural major collectors, minor collectors, and local streets. Coos County recently upgraded the functional classification of a number of roadways for consistency with current uses or with state classifications. No additional changes are recommended as part of the TSP. The functional classification of the county network, including these recent upgrades, is shown in Figure 6-1. A general description for the county functional classifications is presented below: Arterials are the highest demand roadways that carry and distribute regional traffic between cities and counties. The emphasis is on serving through traffic will controlled and less frequent property access. The state highway system will continue to serve as the arterial network within Coos County. Major collectors connect residential neighborhoods with smaller community centers and facilities, as well as providing access to the arterial system. They generally serve higher traffic demands and serve both through traffic as well as providing property access. They tie federal roads, minor collectors, and local roads to the arterial system and also serve as relief routes should an event result in the closure of one of the arterial routes. These roads also provide access to agricultural, forest, and recreational areas. Minor collectors generally serve lower traffic demands than major collectors. They generally branch off from highway, arterial, or major collector roadways and provide access to agricultural, forest, recreational areas, and residential homes. Property access is generally a higher priority for minor collectors while through traffic movements are served as a lower priority. Local streets primarily serve residential properties but can also serve commercial and industrial areas. Property access is the main priority; through traffic movement is not encouraged. They are designed to carry low traffic volumes. County Road Design Standards Roadway standards relate the cross sectional design of a roadway to its function. The function is determined by operational characteristics such as traffic volume, operating speed, safety, and capacity. Roadway standards are necessary to provide a community with roadways that are relatively safe, aesthetic, and easy to administer when new roadways are planned or constructed. Rural road standards for County facilities outside of City UGBs are summarized in Table 6-1 and are shown graphically in Figure 6-2. More detailed specifications (i.e., subgrade width and depth, maximum grade, degree of roadway curvature, vertical clearance, etc.) are included in the Coos County Zoning and Land Development Ordinance. At their discretion, Coos County may choose to deviate from the adopted design standards for those roadways under County control. Transportation System Plan 6-2
74 Reedsport Lakeside 101 North Bend Coos Bay UV 241 UV UV 42 Coquille Bandon UV 42 UV Myrtle Point UV42 UV542 Figure 6-1 Roadway Functional Classfication Powers Coos County TSP Update Legend Functional Classification Port Orford State Highway/Arterials Major Collector Minor Collector Local City Boundary Coos County Boundary Miles E Source Data: ODOT, Coos County Printing Date: 9/16/2010 1:40 PM Filename: P:\O\ODOT \0600INFO\GS\arcmap\TM6\Functional Classification 11x17.mxd
75 Private 12 All Weather Travel Surface 40 Right-of-Way Local 20 All Weather Travel Surface 40 Right-of-Way Minor Collector/Local Commercial/ Local Industrial/Major Collector/Arterial 4 Shoulder 32 All Weather Travel Surface 60 Right-of-Way 4 Shoulder Not to Scale Figure 6-2 County Roads Typical Cross-Sections
76 Table 6-1. County Road Rural Design Standards Roadway Classification Average Daily Traffic Roadway Width (feet) 1 Lanes Shoulders Total Right-of- Way Width (feet) Private Local Residential Local Commercial/Industrial Minor Collector 500-2, Major Collector and Arterial >2, Notes: 1. Additional construction requirements are detailed in the Coos County Zoning and Land Development Ordinance. 2. Applicable to private roads constructed in conjunction with a residential partition. The Coos County roadway system is predominantly rural; however, the county does have some roads within city UGBs. Construction or reconstruction of County facilities inside of City UGBs should follow the local jurisdiction s applicable road standards in order to facilitate a potential jurisdictional transfer in the future. For areas that fall within a City UGB or urban unincorporated community without specified standards, the standards identified in Table 6-2 and illustrated in Figure 6-3 shall apply. Coos County recognizes that many of the existing roads do not meet these standards. Therefore, these standards shall be applied to newly constructed or, when feasible, reconstructed County roads. Table 6-2. County Road Design Standards Within UGBs and Urban Unincorporated Communities Roadway Classification Average Daily Traffic Travel Lanes Roadway Width (feet) 1 Bike Lanes 2 On-Street Parking Sidewalk Width (feet) Right-of- Way Width (feet) Local Residential None Unstriped Local Commercial/Industrial None Unstriped Minor Collector 500-2, None Major Collector and Arterial 2 Lanes 2,500-7, None Lanes >7, None Notes: 1. Additional construction requirements are detailed in the Coos County Zoning and Land Development Ordinance. 2. Bike lanes are required on Major Collector and Arterial roads per the Transportation Planning Rule (OAR ) 3. On-street parking may be permitted on local streets but would not be striped. Travel lane widths reflect variation in travelway with and without on-street parking (6-foot parking width assumed for residential and 7-foot width assumed for commercial/industrial). Total Transportation System Plan 6-3
77 Local Residential 5 Sidewalk 28 Travel Surface 40' 50 Right-of-Way 5 Sidewalk Minor Collector/Local Commercial/Local Industrial 5 Sidewalk 36 Travel Surface 60 Right-of-Way 5 Sidewalk Major Collector/Arterial (2-Lanes) 5 Sidewalk 6 Curb 6 Bike Lane 36 36' Travel Surface 60' 60 Right-of-Way 6 Bike Lane 5 Sidewalk 6 Curb Major Collector/Arterial (4-Lanes) 5 Sidewalk 6 Curb 6 Bike Lane 62 Travel Surface 80 Right-of-Way 6 Bike Lane 5 Sidewalk 6 Curb Not to Scale Figure 6-3 County Roads Typical Cross-Sections: Within City Urban Growth Boundary
78 Access Management Access management along a roadway corridor incorporates planning, design, and implementation of land use and transportation policies and strategies that control the flow of traffic between the roadway and the surrounding land. Access management policies and strategies apply to driveways and other roadways and are designed to achieve a balance between the need to provide safe and efficient travel with the ability to access individual destinations. Access management is an important tool for promoting safe and efficient travel for both local and long distance users along a roadway. Research has clearly shown a direct correlation between the number of access points and collision rates. Typically, as the number of access points increases, so do collision rates. Experience throughout the United States has also shown that a well-managed access plan for a street system can minimize local cost for transportation improvements needed to provide additional capacity and/or access improvements along unmanaged roadways. Therefore, it is essential that all levels of government maintain the efficiency of existing roadways through better access management. One objective of the Coos County TSP is to develop an access management policy that maintains and enhances the integrity (safety and capacity) of state highways and county roads in Coos County. Access Management Techniques Access management can be accomplished through a number of strategies and specific techniques that differ in large urban areas versus rural areas. Based on existing and forecast levels of traffic and development in Coos County, the most suitable access management strategy would appear to be management of the number of access points and their spacing. The following techniques describe how the number of access points to a road can be restricted or reduced: Restrictions on spacing between access points (driveways) and public/private roads based on the type of development and the speed along the road; Sharing of access points between adjacent properties; Providing driveway access via collector or local roadways where possible; Constructing frontage roads to separate local traffic from through-traffic; Offsetting driveways at proper distances to produce T-intersections that minimize the number of conflict points between traffic using the driveways and through traffic; Installing median barriers to control conflicts associated with left-turn movements (in or out of driveway or roadway); and Installing barriers to the property along the arterial to restrict access width to a minimum. Access Management Requirements for State Highways In Oregon, state laws and policies guide planning and management of the State Highway System, including access management of highway segments within both urban and rural areas. Transportation System Plan 6-4
79 Access management along all state highways in Oregon is regulated by an administrative rule specifically drafted to implement the access management policies adopted in the 1999 Oregon Highway Plan (OHP). The OHP specifies an access management classification system for state facilities and establishes standards and guidelines to be applied when making access management assignments for highways based upon their classification. Division 51 (OAR ) is the leading document on access management on state highways. As identified in Chapter 3 and summarized again in Table 6-3, Coos County has two Statewide highways, and four District highways. The state access spacing standards for each level of highway shall be applied. Table 6-3. State Highways Classification Number Name State Classification State Freight Route Federally Designated Truck Route Scenic Byway National Highway System US Oregon Coast Highway Statewide Yes 1 Yes Yes Yes OR 42 5 Coos Bay-Roseburg Highway Statewide Yes Yes 2 No Yes OR 42S Coquille-Bandon Highway District No No No No OR 241 Coos River Highway District 3 No No No Yes 3 OR 540 Cape Arago Highway District No No Yes 4 No OR 542 Powers Highway District No No No No Notes: 1. US 101 is a freight route from the Coos-Douglas County Line at milepost to the junction with OR 42 at milepost OR 42 is a federally designated truck route from US 101 at milepost 0.0 to the junction with OR 42S at milepost The designation of through truck routes help provide for the efficient movement of goods while balancing and maintaining neighborhood livability, public safety, and minimizing maintenance costs of the roadway system. 3. OR 241 is a statewide highway at the junction with US 101 and is part of the National Highway System from US 101 at to the Bunker Hill Industrial Area access on Mullen Road. 4. OR 540 is a scenic byway from Shore Edge Drive at milepost 8.74 to the end of the highway at Cape Arago State Park. 5. The OHP classifies US 101 as an Expressway from 1st Street in Coos Bay (MP ) to the junction with OR 42 (MP ). The OHP classifies OR 42 as an Expressway from the junction with OR 42 (MP 0) to West Central Street in Coquille (MP 9.97) and then again from Filter Plant Road in Coquille (MP 13.19) to Ash Street in Myrtle Point (MP 20.53). Source: 1999 Oregon Highway Plan, July Access Management Requirements for County Roads By law, Coos County has authority to prescribe access management standards. According to Oregon Revised Statute (ORS) , In connection with the acquisition of real property for right-of-way for a throughway described in ORS , the county court or board of county commissioners may prescribe the location, width, nature and extent of any right of access that pertains to such real property. [Amended by 1965 c.364 s.2]. This plan includes access management standards that shall be implemented as new development occurs or as redevelopment occurs. Access standards shall be reviewed and applied during the County s development review process before building permits are issued. When developing access management standards to be applied to new development or redevelopment, the County shall address access spacing relative to existing driveways and Transportation System Plan 6-5
80 public roads based on the level of County road, access design, intersection and roadway sight distance, signing, illumination, and coordination of design with other utilities. Other factors may also be applied. The access spacing standards for public street intersections on County roads is 500 feet, for both collectors and local roads. The access spacing standard for private access intersections on major and minor collector roads is 200 feet and on local roads is50 feet. Where feasible, private accesses to major and minor collector roadways should be minimized or combined to increase access spacing and minimize conflict points. Traffic Operations Standards As identified in the Goals and Objectives section of this TSP, an overarching goal is to strive to provide and encourage a transportation system that promotes safety and convenience for citizens and travelers and that strengthens the local and regional economy by facilitating the flow of goods and services. Traffic operations standards are one key way of maintaining desirable performance levels, which can vary for different facility types. Two generally accepted performance measures can be used when evaluating traffic operations of roadways and intersections. One option is to calculate the volume-to-capacity (v/c) ratio while the other assigns a letter grade from A to F associated with a particular level of service (LOS). Both the LOS and v/c ratio concepts require consideration of factors that include traffic demand, capacity of the intersection or roadway, delay, frequency of interruptions in traffic flow, relative freedom for traffic maneuvers, driving comfort, convenience, and operating cost. Although v/c standards are applied for county and state facilities, level of service (LOS) is a widely recognized and accepted measure and descriptor of traffic operations and is therefore also used for evaluation. Policy 1F of the OHP establishes mobility standards for state facilities and intersecting roadways. These standards are based on v/c ratio because the LOS represents a range of values and implementation of the standard can be problematic in some circumstances. Table 6 of the OHP outlines maximum v/c ratios for peak hour operating conditions by highway category and location (inside or outside UGBs), along with other designations specific to the state highway system. These standards were discussed in Chapter 4. Oregon Highway Plan (OHP) mobility standards are applied for existing and future no build conditions (no/limited geometric changes) while Highway Design Manual (HDM) mobility standards are applied in conjunction with any design changes in future build projects along state facilities. HDM standards can be found in Table 10-1 of the most recent version of the manual. They are generally more restrictive than the OHP mobility standards. As with the OHP, HDM standards are specific to highway category and location (inside or outside UGBs), along with other designations specific to the state highway system. Transportation System Plan 6-6
81 The County employs v/c ratio as its primary method for measuring performance, with the LOS criteria serving as a secondary measurement. A maximum v/c ratio of 0.85 should be maintained for all County-maintained intersections during a typical weekday peak hour 9. The Coos County Zoning and Land Use Development Ordinance (Section ) provides traffic impact analysis requirements. Traffic impact analyses, when required for proposed plan amendments, zone changes, or land developments, must demonstrate that the maximum v/c ratios will not be exceeded. For intersections where one or more approaches are maintained by another agency (city or ODOT), the more restrictive of the County s or other agency s standards should be applied. At signalized intersections, the standard should be applied to the overall intersection operation. At unsignalized intersections, the standard should be applied to the intersection s critical or worst movement. All analyses should follow the methodology outlined in the latest edition of the Highway Capacity Manual 10. Roadway Improvement Projects The roadway improvement projects in this TSP were developed to address specific deficiencies, safety issues, or access concerns. These project lists are based upon available standards, warrants, perceived need, safety data, traffic operations, and community livability. Projects were not limited to roadway issues, although most projects are roadway-related. Roadway improvement projects have been grouped into the following categories: Pavement Improvements Bridge Improvements Natural Hazard Mitigation Improvements Safety Improvements Other System Improvements Tables summarizing the improvements on County and State facilities have been prepared for each category of improvement and the approximate location of the improvement is illustrated in related figures. Because projects are identified based on current and expected needs within the next 20 years, implementation is recommended based on the following priorities: High Priority (next 0 to 5 years) Medium Priority (5 to 10 years) Low Priority (10 to 20 years) Estimated year 2010 project costs include design, construction, and contingency costs. They are preliminary estimates and do not include right-of-way acquisition, water or sewer facilities, or detailed intersection design. 9 The County operational standards were developed as part of this TSP update. 10 Highway Capacity Manual, Transportation Research Board, Washington DC Transportation System Plan 6-7
82 Pavement Improvements County and state roadway segments have been identified for paving improvements based upon currently assessed conditions, functional classification, and route use. Table 6-4 summarizes the proposed improvements and recommended priorities for implementation and Figure 6-4 illustrates approximate locations. Table 6-4. Proposed Roadway Surface Improvements Project ID County Road Name (Road ID) Length/ Total Roadway (miles) Proposed Paved Roadway Segments to be Improved Existing 1 Width (feet) High Priority / Short Term (0-5 Years) Proposed Width (feet) Functional Classification Cost 2 (2010 $) R-1 Sitkum Lane (1C) 2.00 of Major Collector $1,030,000 R-2 Beach Loop Road (29B) 0.75 of Major Collector $440,000 R-3 Old Broadbent Road (20B) 1.75 of Major Collector $910,000 R-4 Old Broadbent Road (20E) 0.50 of Major Collector $300,000 R-5 North Bank Lane (5B) 1.50 of Major Collector $910,000 Medium Priority / Mid Term (5-10 Years) R-6 Lampa Lane (4B) 1.50 of Major Collector $850,000 R-7 Seven Devils Road (33A) 0.75 of Major Collector $410,000 R-8 Seven Devils Road (33B) 1.25 of Major Collector $720,000 R-9 Shelley Road (147B) 1.00 of Major Collector $580,000 Proposed Gravel Roadway Segments to be Paved Medium Priority / Mid Term (5-10 Years) R-10 Sitkum Lane (1G) of (All) Major Collector $7,970,000 R-11 Fairview-Sumner Lane (59G) 4.38 of 4.38 (All) Major Collector $3,260,000 R-12 Gravelford Lane (24G) 3.76 of 3.76 (All) Local $3,130,000 R-13 Lee Valley Road (2G) 3.46 of 3.46 (All) Minor Collector $2,930,000 R-14 Seven Devils Road (33G) 3.48 of 3.48 (All) Minor Collector $1,780,000 Low Priority / Long Term (10-15 Years) R-15 Old Broadbent Road (20G) 2.52 of 2.52 (All) wa 24 Major Collector $1,800,000 R-16 Fairview Road (9G) 3.31 of 3.31 (All) Minor Collector $2,550,000 R-17 North Lake Lane (186G) 2.72 of 2.72 (All) Major Collector $1,300,000 R-18 Shutters Landing Lane (25G) 4.75 of 4.75 (All) Minor Collector $2,270,000 R-19 Parkersburg Road (91G) 2.51 of 2.51 (All) Major Collector $1,310,000 R-20 Catching Creek Lane (19G) 1.54 of 1.54 (All) Minor Collector $1,120,000 R-21 McKinley Lane (13G) 6.47 of 6.47 (All) Minor Collector $4,700,000 R-22 West Fork Millicoma Road (47G) 3.50 of Minor Collector $2,060,000 R-23 East Fork Millicoma Road (49G) 2.75 of 2.75 (All) Local $1,430,000 Notes: 1. Values may not match the average roadway width represented in Table 3-2. Value is based on the Pavement Condition Index (PCI) that represents the observed width for the specified segment(s). 2. Costs vary for segments with similar length and width due to varying pavement depth Source: Coos County Pavement Condition Index, 2009 and Coos County Road Inventory Transportation System Plan 6-8
83 Reedsport Lakeside R-17 R R-22 R-26 North Bend R-23 R-25 Coos Bay R R-14 R R-7 R-5 R-19 R-16 R-11 Coquille R-9 R-21 Bandon R R-13 R-12 R R-24 R-1 Myrtle Point R-4 R-15 R-6 R-3 42 R Figure 6-4 Pavement Improvement Projects Powers Coos County TSP Update Legend R-0 Pavement Improvement Projects Port Orford (See Tables 6-5 & 6-6 in TSP document for project description) Functional Classification R-0 State Highway/Arterials Major Collector Minor Collector Local City Boundary Coos County Boundary Miles Source Data: ODOT, Coos County Printing Date: 9/29/2010 1:52 PM Filename: P:\O\ODOT \0600INFO\GS\arcmap\TM6\Pavement Improvement Projects 11x17.mxd
84 The County s Pavement Condition Index (PCI) indicates that approximately 10 percent of the paved roadways in the Coos County system have Poor pavement conditions and another one percent has Very Poor conditions. Because it is not financially feasible to pave all substandard roadway segments, improvements will be focused on strategic and heavily used locations, specifically all major collector segments with Poor or Very Poor pavement conditions, as presented in Table 6-4. Detour routes, as identified by county and ODOT, will be a priority for paving improvements. Coos County also has major and minor collector roadways that are still gravel surfaces. Table 6-4 also identifies proposed collector road segments that would be upgraded from gravel to pavement along with several key local road segments. Reconstruction to County design standards is not feasible for most of the existing roadways because of design and other constraints. A minimum paved width of 24 feet is recommended, but a minimum of 20 feet is acceptable for two-way traffic, depending on anticipated traffic volumes and functional classification. Cost opinions for paving roadways at their existing (or minimum) widths, plus 2- foot shoulders on either side, are included in Table 6-4. The proposed 4-foot widening serves as a realistic alternative to building each roadway to meet a uniform cross sectional standard; however, it is still likely that constraints along some segments will not allow for this increase in width. The proposed roadway segments have been rounded up to the nearest quarter mile to account for the County s standard paving practice. Several segments of state highways have poor pavement ratings within Coos County. Although the County has no direct control over the state highways within its boundaries, the County plans to coordinate with ODOT to set priorities for improving these highway sections. Table 6-5 provides a list of proposed state highway segments to be improved, including cost opinions and Figure 6-4 illustrates approximate locations. Table 6-5. State Highway Segments to be Improved Project ID State Highway Milepoint High Priority / Short Term (0-5 Years) Length Pavement Begin End (miles) Rating 2008 Cost (2010 $) R-24 US 101 Two Mile Road - Laurel Grove Poor $1,680,000 R-25 OR 540 Begin State Juris. - Sunset Bay S.P Poor $4,320,000 R-26 OR 241 Kruse Road - End Of Pavement Poor $2,690,000 Medium Priority / Mid Term (5-10 Years) R-27 OR 542 Milepoint 8 Slide Section Poor $1,680,000 R-28 OR 241 US th Avenue Poor $4,320,000 Source: ODOT, Pavement Services Unit, 2008 Pavement Condition Report Issues regarding pavement conditions on OR 542 are assumed to be addressed with the Draft STIP Project Number which addresses the Burma Slide area. Transportation System Plan 6-9
85 Bridge Improvements Bridge improvements have been identified based upon four different factors: structural deficiency, functional obsolescence, sufficiency rating (definitions in Chapter 3), and safety. Structural deficiency, functional obsolescence, and sufficiency ratings were established through the 2008 bridge inventory from ODOT s Bridge Maintenance Section. Generally, bridges with a sufficiency rating of 80 or less are eligible for rehabilitation, while bridges with a sufficiency of 50 or less are eligible for replacement. In order to identify noteworthy safety concerns at bridge locations, crash data from the most recent five-year period available (January 1, 2003 to December 31, 2007) was evaluated. County Bridges Of the 111 bridges in Coos County, three are identified as structurally deficient and seven are identified as functionally obsolete. In addition to those bridges identified with deficiencies, 41 others are identified as not deficient but have sufficiency ratings that indicate they are eligible for replacement (3 bridges) or rehabilitation (38 bridges). Two of the three structurally deficient bridges are currently in the draft STIP for replacement. The County has applied for funding in the 2015 STIP for bridge #16349 on Gaylord Road. These bridges are summarized in Table 6-6 and Figure 6-5 illustrates approximate locations. Table 6-6. County Bridges to be Rehabilitated or Replaced Project ID Bridge ID Milepoint Name Deficiency STIP Programming & Cost High Priority / Short Term (0-5 Years) B South Fork Coquille River, County Road 153G (Gaylord Road) Structurally Deficient B Beaver Creek, County Road 5A (North Bank Lane) Structurally Deficient B Fish Trap Creek, FAS A417 (Robison) Structurally Deficient B-4 11C Haynes Slough Bridge Replace Tidegate and Bridge Medium Priority / Mid Term (5-10 Years) B-5 11C13A 3.9 Two Mile Creek, County Road 11G (Two Mile Lane) Functionally Obsolete B-6 11C43A 5.75 Myrtle Point, County Road 32 (Myrtle Creek Road) Functionally Obsolete Apply for STIP STIP Project #16047 Replacement Begin in Cost $6,088,000 STIP Project #16046 Replacement Begin in Cost $817,000 Apply for funding Approximate Cost $1,500,000 Apply for funding in future Apply for funding in future Sources: ODOT Bridge Maintenance Section, Draft Statewide Transportation Improvement Program (STIP) The functionally obsolete bridges are all too narrow and some have issues at the bridge approaches, but are rated structurally sufficient. The crash data analyzed to identify safety concerns does not show any crashes associated with these facilities. However, several of these Transportation System Plan 6-10
86 Reedsport Lakeside 101 North Bend B-4! B-15! UV540 Coos Bay B-14! UV241 B-7! B-2! 101 UV42 Coquille Bandon UV 42 B-3! UV B-5! Myrtle Point UV 542 B-8 B-9!!! B-10 UV42 B-11!!! B-1!! B-6 B-12 B-13 Figure 6-5 Bridge Improvement Projects Powers Coos County TSP Update Legend! B-0 Bridge Improvement Projects Port Orford (See Tables 6-7 & 6-8 in TSP document for project description) Functional Classification R-0 State Highway/Arterials Major Collector Minor Collector Local City Boundary Coos County Boundary Miles E Source Data: ODOT, Coos County Printing Date: 9/16/ :33 PM Filename: P:\O\ODOT \0600INFO\GS\arcmap\TM6\Bridge Improvement Projects 11x17.mxd
87 bridges are on roadways with a functional classification of Rural Major Collector. These bridges have been identified as projects to potentially pursue for STIP funding in the future. State Bridges Of the 56 state bridges in Coos County, 9 are identified as structurally deficient and 8 are identified as functionally obsolete. In addition to those bridges identified with deficiencies, 16 others are identified as not deficient but have sufficiency ratings that indicate they are eligible for replacement (1 bridge) or rehabilitation (15 bridges). All but one of the structurally deficient bridges are currently in the draft STIP for some kind of improvement. These bridges are summarized in Table 6-7 and Figure 6-5 illustrates approximate locations. Table 6-7. State Bridges to be Rehabilitated or Replaced Project ID Bridge ID Highway Milepoint Name STIP Programming & Cost High Priority / Short Term (0-5 Years) B A OR Beaver Creek, OR 42 EB STIP Project #14225 Repair Begin in Cost $13,032,000 B OR Middle Fork Coquille River, OR 42 at MP STIP Project #14225 Repair Begin in Cost $13,032,000 B A OR Endicot Creek, OR 42 STIP Project #14225 Repair Begin in Cost $13,032,000 B OR Middle Fork Coquille River, OR 42 at MP STIP Project #14225 Repair Begin in Cost $13,032,000 B B OR Sandy Creek, OR 42 STIP Project #14225 Repair Begin in Cost $13,032,000 B OR Middle Fork Coquille River, OR 42 at MP B OR Middle Fork Coquille River, OR 42 at MP STIP Project #14225 Repair Begin in Cost $13,032,000 STIP Project #14225 Repair Begin in Cost $13,032,000 B F OR Isthmus Slough, OR 241 (Eastside) STIP Project #15846 East Approach Begin in Cost $7,163,000 Medium Priority / Mid Term (5-10 Years) B A OR West Fork Millicoma River, OR 241 Apply for funding in future Sources: ODOT Bridge Maintenance Section, Draft Statewide Transportation Improvement Program (STIP) The Isthmus Slough Bridge (#01132F) has a project planned to address the most severe issues at the east end of the bridge but the bridge will remain structurally deficient. The existing bridge will remain until funding can be identified for a future repair or replacement project. The West Fork Millicoma River Bridge (#01492A) is identified as structurally deficient but there are currently no projects to address the deficiency. This bridge is located approximately 14 miles from US 101, carries approximately 600 vehicles per day, and currently has no weight restrictions. Structural deficiency should be addressed eventually when funding is available. Transportation System Plan 6-11
88 Natural Hazard Mitigation Improvements Natural hazards, such as landslides, are responsible for damage to roads and bridges around Coos County each year. While it is not possible to mitigate all slide or other natural hazard areas because of both limited funding and ongoing vulnerability, some locations have been identified for improvements. The Coos County Natural Hazards Mitigation Plan includes a list of mitigation on county roads along with estimated costs for the mitigation. This information, along with additional projects identified by Coos County is summarized in Table 6-8 and Figure 6-6 illustrates approximate locations. These mitigation measures typically involve grading slides and improving drainage systems to divert water. Table 6-8. Natural Hazards Mitigation Project ID Hazard County Road Name (Road ID) Milepoint Functional Classification Estimated Cost (2010 $) High Priority / Short Term (0-5 Years) NH-1 Slide East Bay Road (45) NA Major Collector $7,500,000 1 NH-2 Flooding Beach Loop Road Major Collector 4 $2,600,000 2 NH-3 Slide Reedsford Road (81) 0.5 Local $350,000 2 Medium Priority / Mid Term (5-10 Years) NH-4 Slide Fairview Road (9A) NA Major Collector $60,000 - $70,000 1 NH-5 Slide Lee Valley Road (2A) NA Major Collector $50,000 1 NH-6 Slide Lone Pine Lane (60B) NA Major Collector $50,000 1 NH-7 Slide Lampa Lane (4C) NA Major Collector $25,000 1 NH-8 Slide Sitkum Lane (1B) NA Major Collector $50,000 - $75,000 1 NH-9 Slide South Coos River Lane (6A) NA Major Collector $10,000 1 NH-10 Slide Old Broadbent Road (20A) 0.5, 1.4, 1.5, 1.7 Major Collector $500,000 2 NH-11 Slide Old Broadbent Road (20G) 3.2 Major Collector $8,000 2 NH-12 Slide Lampa Lane (4A) 1.4 Major Collector $180,000 2 NH-13 Slide Fairview Road (9G) NA Minor Collector $100,000 1 Low Priority / Long Term (10-20 Years) NH-14 Slide Sumerlin Road (195G) NA Local $25,000 1 NH-15 Slide North Fork Road (12) NA Local $100,000 1 NH-16 Slide Two Mile Lane (11) NA Local $25,000 1 NH-17 Slide Ross Inlet Road (18) NA Local $50,000 1 NH-18 Slide West Catching Road (205) NA Local $5,000 1 NH-19 Slide Whiskey Run Lane (217) NA Local $25,000 1 NH-20 Slide Two Mile Lane (11B) 1.5 Local $60,000 2 NH-21 Erosion McKinley Lane (13G) 3.4 Local $40,000 2 NH-22 Slide Upper Four Mile Lane (98G) 4.1 Local $75,000 2 Notes: 1. Project identified in Natural Hazards Mitigation Plan. East Bay Road project cost has been modified based on engineering studies performed since the plan was prepared. 2. Project identified by Coos County Roads Department. Source: Coos County Road Department and 2005 Coos County Natural Hazards Mitigation Plan Transportation System Plan 6-12
89 Reedsport Lakeside 101 NH-1! North Bend UV 540 Coos Bay NH-18! NH-17! UV 241 NH-9! Bandon NH-2 NH-20!! NH NH-19! NH-22! 101 UV42 UV 42 Coquille NH-4 NH-13!! UV42 NH-14! NH-5! NH-15! NH-8!!! NH-3! NH-12 NH-10 NH-11 NH-7 Myrtle Point NH-6! NH-21! UV42 UV 542 Figure 6-6 Natural Hazard Mitigation Projects Powers Coos County TSP Update Legend NH-0! Natural Hazard Mitigation Projects Port Orford (See Table 6-9 in TSP document for project description) Functional Classification R-0 State Highway/Arterials Major Collector Minor Collector Local City Boundary Coos County Boundary Miles E Source Data: ODOT, Coos County Printing Date: 9/16/ :33 AM Filename: P:\O\ODOT \0600INFO\GS\arcmap\TM6\Natural Hazard Mitigation Projects 11x17.mxd
90 Coos County has had engineering studies completed on East Bay Drive, which is the highest priority roadway since it serves as a detour route for the McCullough Bridge. The study identified three locations with improvement costs totaling $7.5 million. White s curve is the number one issue. The Coos County Natural Hazards Mitigation Plan identifies two short term action items that should be considered as recommendations in this TSP: Landslide Short Term Action Item #1: Identify and map high risk slide areas to create an accurate logistical assessment. Landslide Short Term Action Item #2: Evaluate current and high hazard slides for prioritization and explore mitigation possibilities. The Plan lists eight specific slide corridors for conducting engineering studies: Beach Loop Road, Coos River Highway, Ocean Boulevard, Bald Hill, North Fork Road, US 101, Lampa Mountain Road, OR 42 to Powers Safety Improvements Improving safety throughout the Coos County roadway network has been identified as a priority, and is consistent with the goals identified in Chapter 2 of this TSP. A roadway characteristics audit 11 was performed in conjunction with a detailed crash history analysis 12 to identify potential improvement locations. While some projects are targeted at fatal and serious injury crash locations, some projects were identified due to roadway attributes and environmental factors that may to contribute to future crashes. Table 6-9 lists potential safety improvement projects that have been identified for state highways along with cost opinions for each project. Figure 6-7 illustrates approximate locations for the improvements. Priorities were established based on the frequency of crashes and state priority indexing. Prior to implementation, each improvement should be evaluated with respect to their corresponding State warrant. Table 6-9. Roadway Safety Projects State Highways Project ID Highway Name Location (Milepoint) Potential Mitigation Measures Estimated Cost (2010 $) High Priority / Short Term (0-5 Years) S-1 US 101 Tugman State Park and City of Speed Zone, left-turn lane, right-turn deceleration $250,000 Lakeside lanes, access management S-2 US 101 Wildwood/Crannog Road (MP ) Advance signage and turn lanes $75,000 S-3 US 101 N. of Bullards Beach State Park & Advance signage for intersection, signage warning of $5,000 North Bank Lane (MP 259.0) curve, and chevrons S-4 OR 42 Near Davis Slough Bridge (MP 1.0) Delineation, shoulder improvements, guardrail $50,000 S-5 OR 42 Alder Hill Lane to Old City-County Evaluate effectiveness of spot improvements for this $15,000 Road (MP ) segment 11 The roadway characteristics audit was performed using aerial imagery and ODOT Video Log. 12 The crash data used in this safety investigation was from the most recent five-year period available (January 1, 2003 to December 31, 2007). Transportation System Plan 6-13
91 Reedsport S-14! S S-15 S-16! S-47! North Bend S-1! Lakeside Bandon S-24! 101 S-7! S-48 S-33 S-8S-32!!! UV 540 Coos Bay S-17 S-28! S-4 S-49! UV42 S-29! 101 S-30! S-5!!!!!!! S-13S-45 S-46! S-3 S-44 S-43 S-23 S-12S-11 S-10 UV S-41 S-42! 42 Coquille S-34S-35!! UV42 S-52! UV 241 Myrtle Point S-51! S-18 S-19! S-6!! S-25 S-20! S-26 S-31 S-22!!! S-27 S-38! UV 542 UV42 Figure 6-7 Roadway Safety Projects S-39! S-40 S-9! Powers Coos County TSP Update Legend S-0! Roadway Safety Projects Port Orford (See Tables 6-10 & 6-11 in the TSP document for project description) Functional Classification R-0 State Highway/Arterials Major Collector Minor Collector Local City Boundary Coos County Boundary Miles E Source Data: ODOT, Coos County Printing Date: 9/29/2010 1:53 PM Filename: P:\O\ODOT \0600INFO\GS\arcmap\TM6\Roadway Safety Projects 11x17.mxd
92 Table 6-9. Roadway Safety Projects State Highways Project Highway Estimated Cost ID Name Location (Milepoint) Potential Mitigation Measures (2010 $) S-6 OR 42 Segments east and west of OR 542 Evaluate effectiveness of spot improvements for this $5,000 Junction (MP ) segment S-7 OR 540 Barview and North (MP ) Access management plan TBD S-8 OR 540 Coos Head Road to Oceanview Clear roadside to improve sight distance $10,000 Road (MP ) S-9 OR 542 Woodward Creek Road to City Delineation, chevrons $5,000 Limits (MP ) S-10 OR 42S Curve (turn) east of Prosper Junction Road (MP 2.17) Delineation, improve retro-reflectivity of arrow sign or replace with chevrons $5,000 S-11 OR 42S Isolated curve east of Bear Creek/ Advance signage, chevrons $5,000 Parkersburg Road (MP 3.43) S-12 OR 42S Reverse curves west of Bear Clear roadside to improve signage visibility $5,000 Creek/Parkersburg Road (MP 2.38) S-13 OR 42S Harlocker Hill Road (MP 13.18) Advance intersection signage $7,500 Medium Priority / Mid Term (5-10 Years) S-14 US 101 Beaver Loop Road (MP ) Advance signage and right-turn lane extension $50,000 S-15 US 101 South of Kadora Lane & North Bay Roadway delineation $5,000 Road (MP ) S-16 US 101 US 101 Wayside (MP ) Advance signage and right-turn deceleration lanes $50,000 S-17 US 101 OR 42 Junction (MP ) Roadway delineation, illumination, reduced speeds $10,000 S-18 OR 42 Guerin Lane (MP 23.28) Clear roadside to improve sight distance $5,000 S-20 OR 42 Myrtle Creek Road west of Bridge Add eastbound deceleration lane $225,000 (MP 30.50) S-21 OR mile east of Robbins Creek Bridge (MP ) Safety edge, guardrail, shoulder improvement $50,000 S-22 OR 42 Small Creek curve east of Bridge Realign curves; complete apart from passing lanes if $2,000,000 latter is not build within planning horizon Low Priority / Long Term (10-20 Years) S-23 US 101 Prosper Jct. Road (MP ) Northbound right-turn deceleration lane $50,000 S-24 US 101 Beach Loop Road (MP ) Southbound right-turn deceleration lane $100,000 - $250,000 S-25 OR 42 McMullen Creek Road (MP 28.59) Westbound left-turn bay and eastbound shoulder striped as right-turn deceleration lane $5,000 S-26 OR 42 Myrtle Creek Road (MP 30.5) Extend eastbound right-turn deceleration lane and advance signage $100,000 S-27 OR 42 Sharp Reverse Curves (MP 32.0) Advisory speed signage and chevrons for both curves in both directions $5,000 S-28 OR 42 Wall Gulch to Coos County Speedway (MP 0.99 to 2.31) Realign horizontal curve and decrease grade separation at Wall Gulch; remove overhead utilities from clear zone and reduce grade separation $3,800,000 S-29 OR 42 Beaver Creek/Overland Road accesses (MP ) Close Overland Road access at MP 4.81 and leg to Overland Road at MP 4.99; realign south Beaver Creek Road access at MP 5.15 Improve sight distances for westbound lanes and widen shoulders $265,000 S-30 OR 42 North Bank Road Intersection (MP ) $450,000 S-31 OR 42 Bridge Intersection (MP 30.69) Construct left-turn pockets $300,000 S-32 OR 540 Charleston - South Slough to Access management plan TBD Roosevelt Blvd. (MP ) S-33 OR 540 Sunset Bay State Park State Delineation, chevrons $10,000 Wayside (MP 11.2) Transportation System Plan 6-14
93 Table 6-9. Roadway Safety Projects State Highways Project Highway ID Name Location (Milepoint) Potential Mitigation Measures Estimated Cost (2010 $) S-34 OR 241 Catching Slough Road (MP 2.33) Advance signage $5,000 S-35 OR 241 S. Coos River Lane (MP 3.52) Advance signage $5,000 S-36 OR 241 E. Bay Drive (MP 3.89) Advance signage $5,000 S-37 OR 542 Curve at Parsonage Lane (MP 2.4) Advance signage for intersection, curve warning $5,000 S-38 OR 542 Curves at MP Delineation, advance signage, guardrail $30,000 S-39 OR 542 Baker Creek Lane (MP 15.5) Advance signage ("T intersection ahead") $5,000 S-40 OR 542 Curves east of Baker Creek Lane at Guardrail $25,000 (MP ) S-41 OR 42S Prosper Jct. Road/Morrison Road Advance signage and right-turn deceleration lane $65,000 (MP 1.59) S-42 OR 42S Lampa Lane (MP 7.25) Eastbound right-turn deceleration lane and $60,000 westbound left-turn bay S-43 OR 42S Curve (MP 10.45) Relocate or improve advisory curve signage, $5,000 consider signing as reverse curve S-44 OR 42S Riverton Road (MP 10.8) Advance intersection signage $7,500 S-45 OR 42S Fat Elk Road (MP 14.65) Advance intersection signage, eastbound right-turn deceleration lane $60,000 S-46 OR 42S Fishtrap Road (MP 16.60) Advance intersection signage, westbound right-turn deceleration lane $75,000 - $100,000 Corridor-level assessments (safety audits) are proposed along the high crash county roadways listed in Table At a minimum, assessments for county roads should address safety concerns regarding: 1. Lane departures occurring at sharp horizontal curves, which may be mitigated by improving delineation (striping, rumble, markers, etc.) and advisory signage (including replacing existing signage to increase retroreflectivity or improve placement) 2. Roadway segments/intersections with deficient sight distance, which may be mitigated by clearing brush, trees, and other obstacles. The costs shown below include a corridor safety assessment and essential improvements. Conducting safety assessments should be a high priority although recommended improvements may be implemented over a greater period of time. Table County Road Safety Project ID County Road (ID) Potential Mitigation Measures Cost (2010 $)* S-47 East Bay Drive (45) High Priority / Short Term (0-5 Years) $250,000 S-48 S-49 S-50 S-51 Libby Lane (184) Seven Devils Road (33) Beaver Hill Lane (208) Sitkum Lane (1) Improvements likely to be identified include: delineation, advance signage, reduced speeds, safety edges, guardrail, and improved shoulders, but other safety measure may also be identified. $100,000 $150,000 $75,000 $250,000 S-52 Fairview Road (9) $150,000 *Approximate cost for safety assessment and delineation-level improvements. Significant improvements such as shoulder widening or curve straightening would require additional funding. Transportation System Plan 6-15
94 Other System Improvements Additional projects that involve either capacity or connectivity are listed in Table 6-11 and approximate locations are illustrated in Figure 6-8. These projects have been identified in other plans (Corridor Plans and City TSPs) or through the public involvement process. Table Other System Improvements Project ID Location Description High Priority / Short Term (0-5 Years) OS-1 TransPacific/US 101 (MP 232.8) 1 A traffic signal at the intersection of Transpacific and US 101 is planned to be used on a temporary basis during construction of a nearby Liquefied Natural Gas facility. The County is considering the need for this traffic signal to become permanent. Consideration for a traffic signal installation must comply with OAR OS-2 OR 42 Passing Lanes (~MP 29 33) 2 OS-3 East of Bridge Passing Lanes (MP ) 2 Construct eastbound and westbound passing lanes on OR 42 somewhere between MP 29 and MP 33 (identified as high priority in OR 42 Corridor Plan) Add westbound and eastbound passing lanes; straighten curves at MP (addressed in TM6 under Other System Improvements) Estimated Cost (2010 $) $250,000 $4,200,000 $4,400,000 Medium Priority / Mid Term (5-10 Years) OS-4 Coos River Highway (OR 241) at Olive Barber Road 3 Install traffic signal with advance signal head and eliminate southbound to westbound slip lane 1 $750,000 OS-5 US 101 at Bunker Hill/Coos River Highway (OR 241) 3 OS-6 Cedar Point Passing Lane (MP ) 2 Incorporate ODOT recommendations when available 1 Extend existing westbound passing lane to the west; implement if Chrome Plant section not widened to 4 lanes with years TBD $750,000 OS-7 US 101 at East Bay Drive 5 Install southbound left-turn lane $500,000 OS-8 Chrome Plant to Cedar Point (MP ) 2 Low Priority / Long Term (10-20 Years) Widen highway to 4 lanes with left-turn refuges; provide adequate shoulders $18,000,000 OS-9 OR 42/S. Adams (MP 12.25) 4 Construct left-turn bay $600,000 OS-10 Scenic Byway from Cape Arago Highway to Beaver Hill Road 5 OS-11 OR 42 Curves east of Upper Rock Creek Road (MP ) 6 Notes: 1. Project identified by Coos County. 2. Project identified in the OR 42 Corridor Plan. 3. Project identified in the Coos Bay Transportation System Plan 4. Project identified In the Coquille Transportation System Plan 5. Project identified through public or advisory meeting input. 6. Project identified in OR 42 Corridor Plan Beyond 20 Year Planning Horizon Construct a new roadway connection between Cape Arago Highway and Beaver Hill Road with a scenic overlook on the north side of Big Devil Gulch Realign curve and widen roadway to address accidents and geologic hazards TBD TBD Transportation System Plan 6-16
95 Reedsport Lakeside 101 OS-1 OS-7 North Bend Coos Bay OS-4 OS-5 OS OS-8 OS-6 Coquille OS-9 Bandon Myrtle Point OS-2 OS OS-11 Figure 6-8 Other System Improvement Projects Powers Coos County TSP Update Legend OS-0 Other Improvement Projects Port Orford (See Table 6-12 in the TSP document for project description) Functional Classification R-0 State Highway/Arterials Major Collector Minor Collector Local City Boundary Coos County Boundary Miles Source Data: ODOT, Coos County Printing Date: 9/29/2010 1:50 PM Filename: P:\O\ODOT \0600INFO\GS\arcmap\TM6\Other System Improvement Projects 11x17.mxd
96 Pedestrian and Bicycle Plan The pedestrian and bicycle system plan addresses facility needs within Coos County along state highways and county roads. Currently, there is no extensive network of specifically designated bicycle routes serving Coos County other than the Oregon Coast Bike Route (OCBR). In rural areas, the shared roadway is the primary facility for bicycle (and pedestrian) travel. Roads should include shoulders where bicycle use is high and motor vehicle speeds and volumes are also high. The Oregon Bicycle and Pedestrian Plan 13 recommends shoulders that are 6 feet wide for bicycle use, although a minimum 4-foot shoulder is considered adequate when there are physical width limitations. Wider shoulders allow a cyclist to ride far enough from the edge of pavement to avoid debris and far enough from passing vehicles to avoid conflicts. When feasible, paved shoulders should be widened to a minimum width of 4 feet (as recommended in the design standards, Table 6-1) during rehabilitation projects. Table 6-12 summarizes recommended bicycle improvements on County roads that improve or augment the OCBR and approximate locations are illustrated in Figure 6-9. This project list also includes one sidewalk improvement within the Coquille city limits. Table Bicycle and Pedestrian Improvements Project ID Location Description BP-1 Seven Devils Road south of Cape Arago Highway and north of US 101 BP-2 North 8th Street and Airport Way through Lakeside BP-3 Coos Head area BP-4 West Central Drive in Coquille, from Ivy to OR 42 BP-5 Seven Devils Road/West Beaver Hill Road/Whiskey Run Road/ Seven Devils Road BP-6 Riverside Drive from US 101 to Fillmore Avenue (1.3 miles) BP-7 Beach Loop Road from Polaris Lane to US 101 (2.3 miles) BP-8 Seven Devils Road from West Beaver Hill Road to US 101 High Priority / Short Term (0-5 Years) Create gateway and/or innovative signage to inform motorists of shared roadway Add a southbound bike lane through Lakeside, with a rest stop at the County Park. The lane would be a 6-foot paved shoulder. Conduct a study and develop a cooperative multimodal management plan Medium Priority / Mid Term (5-10 Years) Add a sidewalk on the south side of the street to extend current improvements from the high school. Widen roadway to provide 4- to 6-foot shoulders on both sides of approximately 15 miles of roadway (where feasible) Widen roadway to provide 4- to 5-foot shoulders on both sides of the road (where feasible) Widen roadway to provide bike lanes, OR Provide multi-use trail along one side of the roadway Following planned paving (R-14), add signage for a shared-lane bike route along Seven Devils (as an alternative to the adjacent OCBR section) Note: Beach Loop Road project will need to be consistent with efforts in City of Bandon Estimated Cost (2010 $) $50,000 $600,000 $250,000 $300,000 $7,700,000 $825,000 - $935,000 $1,400,000 - $1,700,000 $15, Draft Oregon Bicycle and Pedestrian Plan, Transportation System Plan 6-17


97 Reedsport BP-2! Lakeside 101 North Bend BP-7! BP-6! Bandon 101 UV540 BP-3! BP-1! BP-5!! BP-8 BP-4! Coos Bay 101 UV 42 UV 241 Coquille UV42 UV42 Myrtle Point UV42 UV 542 Figure 6-9 Bicycle and Pedestrian Improvements Powers Coos County TSP Update Legend BP-0! Port Orford E Source Bicycle Improvement Projects (See Table 6-13 in the TSP document for project description) Functional Classification State Highway/Arterials Major Collector Minor Collector Local City Boundary Coos County Boundary Miles Data: ODOT, Coos County R-0 Printing Date: 9/16/ :28 PM Filename: P:\O\ODOT \0600INFO\GS\arcmap\TM6\Bike_Ped Improvement Projects 11x17.mxd
Other Principle Arterials Minor Arterial Major Collector Minor Collector Local
 CHAPTER 10 TRANSPORTATION Introduction The system of public roads in East Pikeland Township is decidedly rural in character. Since the 1984, the road network has remained much the same, with the addition
Blueways: Rivers, lakes, or streams with public access for recreation that includes fishing, nature observation, and opportunities for boating.
 Parks, Open Space and Trails PRINCE WILLIAM COUNTY 2008 COMPREHENSIVE PLAN TRAILS PLAN CONTENTS The components of the trails plan are: Intent Definitions Goals, Policies, and Action Strategies Trails Map
Georgetown-Lewes Rail/Trail Study. Rail/Trail Study: Cool Spring to Cape Henlopen State Park New Road Extension (House Resolution No.
 Georgetown-Lewes Rail/Trail Study Rail/Trail Study: Cool Spring to Cape Henlopen State Park New Road Extension (House Resolution No. 47) August 22, 2011 Presentation Outline Background Benefits Statewide
Non-Motorized Transportation
 Non-Motorized Transportation Non-motorized facilities are important components to the transportation system. They provide an environmentally-friendly, low-cost mode of travel. Some of the facilities can
Lake Erie Commerce Center Traffic Analysis
 LOCATION: East of NYS Route 5 at Bayview Road Town of Hamburg Erie County, New York PREPARED BY: Wendel Companies 140 John James Audubon Parkway Suite 200 Amherst, New York 14228 January 2012 i ii Table
Coos County Comprehensive Plan Volume XX Parks and Recreation Master Plan
 Coos County Comprehensive Plan Volume XX Parks and Recreation Master Plan 1 P a g e Table of Contents 1. INTRODUCTION... 5 Introduction... 5 Plan Organization... 5 Planning Process... 6 Relationship to
University Region Non-Motorized Plan 2015
 Non-Motorized Transportation Non-motorized facilities are important components to the transportation system. They provide an environmentally-friendly, low-cost mode of travel. Some of the facilities can
Agenda: SASP SAC Meeting 3
 Agenda: SASP SAC Meeting 3 Date: 04/12/18 Public Involvement Plan Update Defining the System Recommended Classifications Discussion Break Review current system Outreach what we heard Proposed changes Classification
JOSLIN FIELD, MAGIC VALLEY REGIONAL AIRPORT DECEMBER 2012
 1. Introduction The Federal Aviation Administration (FAA) recommends that airport master plans be updated every 5 years or as necessary to keep them current. The Master Plan for Joslin Field, Magic Valley
PURPOSE AND NEED (CONCURRENCE POINT 1) NEW CANADA ROAD PROJECT FROM STATE ROUTE 1 (U.S. HIGHWAY 70) TO U.S. INTERSTATE 40
 NEW CANADA ROAD PROJECT FROM STATE ROUTE 1 (U.S. HIGHWAY 70) TO U.S. INTERSTATE 40") PURPOSE AND NEED (CONCURRENCE POINT 1) NEW CANADA ROAD PROJECT FROM STATE ROUTE 1 (U.S. HIGHWAY 70) TO U.S. INTERSTATE 40 Project Description The primary purpose of this project is to improve the major
PURPOSE AND NEED (CONCURRENCE POINT 1) NEW CANADA ROAD PROJECT FROM STATE ROUTE 1 (U.S. HIGHWAY 70) TO U.S. INTERSTATE 40 Project Description The primary purpose of this project is to improve the major
City of Durango 5.8 FUNDING TRAILS DEVELOPMENT
 5.8 FUNDING TRAILS DEVELOPMENT The City has been successful in establishing dedicated local funding sources as well as applying for grants to develop the City s trail system, having received nearly $2.4
FHWA P/N Guidelines. Corridor Relationship. Highway 22 Segment 1 - US 169 to CSAH 2 Relevance / Documentation of Need
 Highway 22 Segment 1 - US 169 to CSAH 2 Vehicle Mobility Congestion Intersection Congestion Existing Conditions - Based on Highway Capacity Manual methodology, corridor level of service is currently LOS
Construction underway. STATUS: 229 5,190 5,419 5,305 STIP REFERENCE #FR /01/2013
 FREDERICK COUNTY STATE HIGHWAY ADMINISTRATION -- Frederick County -- Line 1 PROJECT: I-7, Baltimore National Pike INTERSTATE CONSTRUCTION PROGRAM DESCRIPTION: Widen I-7 east of MD 355 to east of MD 144
MONTEREY REGIONAL AIRPORT MASTER PLAN TOPICAL QUESTIONS FROM THE PLANNING ADVISORY COMMITTEE AND TOPICAL RESPONSES
 MONTEREY REGIONAL AIRPORT MASTER PLAN TOPICAL QUESTIONS FROM THE PLANNING ADVISORY COMMITTEE AND TOPICAL RESPONSES Recurring topics emerged in some of the comments and questions raised by members of the
Hearings will be held in the Shirley Huffman Auditorium in the Charles D. Cameron Public Services Building, 155 North First Avenue, Hillsboro, Oregon.
 Hearings will be held in the Shirley Huffman Auditorium in the Charles D. Cameron Public Services Building, 155 North First Avenue, Hillsboro, Oregon. On September 24, 2013, the Board of County Commissioners
AGENDA ITEM 5 D WAKULLA ENVIRONMENTAL INSTITUTE (WEI) TRAIL FEASIBILITY STUDY
 TRAIL FEASIBILITY STUDY") March 19, 2018 AGENDA ITEM 5 D WAKULLA ENVIRONMENTAL INSTITUTE (WEI) TRAIL FEASIBILITY STUDY TYPE OF ITEM: Action STATEMENT OF ISSUE The Wakulla Environmental Institute (WEI) Trail is one of several trails
March 19, 2018 AGENDA ITEM 5 D WAKULLA ENVIRONMENTAL INSTITUTE (WEI) TRAIL FEASIBILITY STUDY TYPE OF ITEM: Action STATEMENT OF ISSUE The Wakulla Environmental Institute (WEI) Trail is one of several trails
2008 DEKALB COUNTY TRANSPORTATION PLAN (UPDATE)
") 2008 DEKALB COUNTY TRANSPORTATION PLAN (UPDATE) TABLE OF CONTENTS Introduction 1 Transportation Planning Activities 2 Identification of Problem Areas and Recommended Solutions 7 DeKalb County Projects
2008 DEKALB COUNTY TRANSPORTATION PLAN (UPDATE) TABLE OF CONTENTS Introduction 1 Transportation Planning Activities 2 Identification of Problem Areas and Recommended Solutions 7 DeKalb County Projects
AIRPORTS POLICY 28, AIRPORTS:
 AIRPORTS POLICY 28, AIRPORTS: It is the policy of Washington County to protect the function and economic viability of existing public use airports, while ensuring public safety and compatibility between
TRANSPORTATION ELEMENT
 Transportation TRANSPORTATION ELEMENT Data, Inventory, and Analysis Prepared by Contents 1.0 INTRODUCTION... 1 2.0 EXISTING CONDITIONS... 1 2.1 Roadways... 1 2.1.1 Jurisdiction... 1 2.1.2 Functional Classification...
Project Deliverable 4.1.3d Individual City Report - City of La Verne
 Pomona Valley ITS Project Project Deliverable 4.1.3d Individual City Report - City of La Verne Prepared by: April 19, 2002 099017000.1 Copyright 2002, Kimley-Horn and Associates, Inc TABLE OF CONTENTS
Airport Planning Area
 PLANNING AREA POLICIES l AIRPORT Airport Planning Area LOCATION AND CONTEXT The Airport Planning Area ( Airport area ) is a key part of Boise s economy and transportation network; it features a multi-purpose
CHAPTER 4 -- THE LAND USE PLAN: DESCRIPTIONS AND POLICIES FOR THIRTEEN PLANNING AREAS
 CHAPTER 4 -- THE LAND USE PLAN: DESCRIPTIONS AND POLICIES FOR THIRTEEN PLANNING AREAS NORTH CENTRAL CAC AREA LITTLE VALLEY ROAD TO JUG HANDLE CREEK PLANNING AREA This planning area includes Cleone, Noyo,
US 380 FEASIBILITY STUDY
 US 380 FEASIBILITY STUDY Denton County CSJ(s): 0135-10-061, 0135-10-062 Public Meeting(s): January 15 & 22, 2019 WELCOME US 380 Denton County Feasibility Study DALLAS DISTRICT PUBLIC MEETING January 15
Connecting Nevada Partners The Connecting Nevada Stakeholders that participated in this effort are listed below in alphabetical order.
 Acknowledgements The Connecting Nevada project would not have been possible without the guidance and input of a number of stakeholders who demonstrate a commitment to making Nevada s transportation system
Clackamas County Development Agency
 Clackamas County Development Agency Development Services Building, 150 Beavercreek Rd., Oregon City, OR 97045 www.clackamas.us/transportation/renewal 503-742-4323 The Clackamas County Board of Commissioners
Executive Summary. MASTER PLAN UPDATE Fort Collins-Loveland Municipal Airport
 Executive Summary MASTER PLAN UPDATE Fort Collins-Loveland Municipal Airport As a general aviation and commercial service airport, Fort Collins- Loveland Municipal Airport serves as an important niche
STUDY OVERVIEW MASTER PLAN GOALS AND OBJECTIVES
 INTRODUCTION An Airport Master Plan provides an evalua on of the airport s avia on demand and an overview of the systema c airport development that will best meet those demands. The Master Plan establishes
Chapter 6: POLICY AND PROCEDURE RECOMMENDATIONS
 Chapter 6 POLICY AND PROCEDURE RECOMMENDATIONS FOR SRRA Below are seven policy elements that should be considered for adoption by the Southwest Regional Recreation Authority of Virginia: 1. Develop strategies
Parkland County Municipal Development Plan Amendment Acheson Industrial Area Structure Plan
 Parkland County Municipal Development Plan Amendment Acheson Industrial Area Structure Plan New Plan Acheson Industrial Area Structure Plan Amendment Parkland County Municipal Development Plan Board Reference
Longmont to Boulder Regional Trail Jay Road Connection DRAFT FINAL REPORT
 Longmont to Boulder Regional Trail Jay Road Connection DRAFT FINAL REPORT December 2018 Project Summary Boulder County, Colorado, in partnership with the City of Boulder, is evaluating options for multi-use
FORECASTING FUTURE ACTIVITY
 EXECUTIVE SUMMARY The Eagle County Regional Airport (EGE) is known as a gateway into the heart of the Colorado Rocky Mountains, providing access to some of the nation s top ski resort towns (Vail, Beaver
CHAPTER 1: INTRODUCTION
 CHAPTER 1: INTRODUCTION Purpose and Scope The information presented in this report represents the study findings for the 2016 Ronan Airport Master Plan prepared for the City of Ronan and Lake County, the
Proposed Action. Payette National Forest Over-Snow Grooming in Valley, Adams and Idaho Counties. United States Department of Agriculture
 United States Department of Agriculture Forest Service January 2012 Proposed Action Payette National Forest Over-Snow Grooming in Valley, Adams and Idaho Counties Payette National Forest Valley, Adams
1.2 Corridor History and Current Characteristics
 SECTION 1 Description and Background of Study Area 1.1 Introduction This preliminary engineering report was prepared for the Alaska Department of Transportation and Public Facilities (ADOT&PF). It is part
Aviation, Rail, & Trucking 6-1
 6-1 This chapter describes the services, facilities, and condition of air, rail, and trucking as components of the transportation system. These three intermodal areas have an impact on the factors to be
SR 934 Project Development And Environment (PD&E) Study
 Study") SR 934 Project Development And Environment (PD&E) Study Project Advisory Group Meeting March 1, 2018 State Road 934/NE/NW 79th Street from west of I-95 (NW 13th CT) to N. Bayshore Drive PD&E STUDY SR 934/NE/NW
SR 934 Project Development And Environment (PD&E) Study Project Advisory Group Meeting March 1, 2018 State Road 934/NE/NW 79th Street from west of I-95 (NW 13th CT) to N. Bayshore Drive PD&E STUDY SR 934/NE/NW
Prepared for Travel Oregon by Kathi Jaworski, Write to Know consulting
 1 2 3 4 5 o 6 7 8 9 Coos County Employment by Industry, 2006-2015 Top Categories of Employment (500+ Jobs) 5,000 4,500 4,000 3,500 3,000 2,500 2,000 1,500 1,000 500 2006 2010 2015 Source: Oregon Employment
Chapter 1 Introduction and Project Overview
 EPHRATA MUNICIPAL AIRPORT Chapter 1 Introduction and Project Overview The Port of Ephrata in cooperation with the Federal Aviation Administration (FAA) is updating the Airport Master Plan for Ephrata Municipal
Committee. Presentation Outline
 CW-33-15 11/9/2015 Community and Corporate Services Committee November 10, 2015 1 Presentation Outline Background Vision and Objectives Study Process and Timeline Public and Stakeholder Engagement Organization
Introduction DRAFT March 9, 2017
 Chapter Overview The City of Redmond (City) initiated an update to the Airport Master Plan ( Plan ) to assess the facility and service needs of the Redmond Municipal Airport ( the Airport ) throughout
Memorandum. Roger Millar, Secretary of Transportation. Date: April 5, Interstate 90 Operations and Mercer Island Mobility
 Memorandum To: From: The Honorable Dow Constantine, King County Executive; The Honorable Ed Murray, City of Seattle Mayor; The Honorable Bruce Bassett, City of Mercer Island Mayor; The Honorable John Stokes,
2016 Regional Transportation Alternatives Program (TAP) Grant Application
 Grant Application") 2016 Regional Transportation Alternatives Program (TAP) Grant Application PROJECT TITLE: Yelm-Tenino Trail Extension Feasibility Study TRPC use only GENERAL PROJECT INFORMATION Agency or Organization City
2016 Regional Transportation Alternatives Program (TAP) Grant Application PROJECT TITLE: Yelm-Tenino Trail Extension Feasibility Study TRPC use only GENERAL PROJECT INFORMATION Agency or Organization City
HIGHWAY RAIL GRADE CROSSING CONSOLIDATION PROGRAM
 HIGHWAY RAIL GRADE CROSSING CONSOLIDATION PROGRAM To decrease unnecessary train traffic exposure to life and property, promote public safety, and improve traffic conditions, the Texas Department of Transportation
Chapter 2: Entire US287 Corridor
 Chapter 2: Entire US287 Corridor The US287 Study Area spans four incorporated jurisdictions and two counties. Due to the length and density of infrastructure along the US287 Study Area, corridor-wide maps
Airport Master Plan Update June 15, 2017
 Airport Master Plan Update June 15, 2017 www.harveyfield.com The Master Plan is a 20-year plan to understand the needs of current and future users of the Airport. This is important to ensure that safe
Grade Crossings in High Speed Rail Corridors
 Grade Crossings in High Speed Rail Corridors 59 th ANNUAL ILLINOIS TRAFFIC ENGINEERING & SAFETY CONFERENCE October 21, 2010 Champaign, IL Michael E. Stead Rail Safety Section Illinois Commerce Commission
Airport Master Plan Update June 15, 2017
 Airport Master Plan Update June 15, 2017 www.harveyfield.com The Master Plan is a 20-year plan to understand the needs of current and future users of the Airport. This is important to ensure that safe
5.1 Traffic and Transportation
 5.1 When it opens in 2009, the Bellevue Nickel Improvement Project will increase the number of vehicles able to travel through the study area, improve travel speeds, and improve safety by reducing the
Regional Wayfinding Sign Strategy Thurston County Trails 2017
 Regional Wayfinding Sign Strategy Thurston County Trails 2017 Partners: Members and partnering organizations of the Thurston Thrives Community Design Action Team City of Lacey, City of Olympia, City of
Provincial Railway Technical Standards
 GENERAL: INDEX: The standards and requirements listed in this document are intended for use on provincially regulated railway public grade crossings. These standards are considered the minimum requirements
MEMORANDUM. Lynn Hayes LSA Associates, Inc.
 MEMORANDUM To: Lynn Hayes LSA Associates, Inc. Date: May 5, 217 From: Zawwar Saiyed, P.E., Senior Transportation Engineer Justin Tucker, Transportation Engineer I Linscott, Law & Greenspan, Engineers LLG
DRAFT GENERAL IMPLEMENTATION PLAN AND SPECIFIC IMPLEMENTATION PLAN MIDDLETON MUNICIPAL AIRPORT MOREY FIELD. Revised 12/12/03
 DRAFT GENERAL IMPLEMENTATION PLAN AND SPECIFIC IMPLEMENTATION PLAN MIDDLETON MUNICIPAL AIRPORT MOREY FIELD Revised 12/12/03 As recommended for approval by the Plan Commission General Project Description
CHAPTER FOUR: TRANSPORTATION
 CHAPTER FOUR: TRANSPORTATION Barron County Comprehensive Plan: Transportation Page 61 Background Transportation facilities have a significant influence on land use, development and quality of life for
Draft Concept Alternatives Analysis for the Inaugural Airport Program September 2005
 Section 10 Preferred Inaugural Airport Concept 10.0 Introduction The Preferred Inaugural Airport Concept for SSA was developed by adding the preferred support/ancillary facilities selected in Section 9
Section 106 Update Memo #1 Attachment D. Traffic Diversion & APE Expansion Methodology & Maps
 Section 106 Update Memo #1 Attachment D Traffic Diversion & APE Expansion Methodology & Maps I-65/I-70 North Split Interchange Reconstruction Project (Des. Nos. 1592385 & 1600808) Traffic Diversion and
Committee Report. Community Development Committee For the Metropolitan Council meeting of August 12, Business Item No.
 Committee Report Business Item No. 2015-168 Community Development Committee For the Metropolitan Council meeting of August 12, 2015 Subject: Coon Creek Regional Trail Master Plan, Anoka County Proposed
Draft for approval by TCC on 2/3, TAQC on 2/9 and ARC Board on 2/22. Regional Trail Plan. Mike Alexander, Director, Center for Livable Communities
 DATE: February 3, 2017 ISSUE SUMMARY: Regional Trail Plan FROM: Mike Alexander, Director, Center for Livable Communities IMPORTANCE: In May 2016, ARC adopted the active transportation component of the
ACTION TRANSMITTAL
 Transportation Advisory Board of the Metropolitan Council of the Twin Cities ACTION TRANSMITTAL 2018-16 DATE: February 9, 2018 TO: Transportation Advisory Board FROM: Technical Advisory Committee PREPARED
Business Item No XXX. Proposed Action That the Metropolitan Council approve the Coon Creek Regional Trail Master Plan.
 Business Item No. 2015-XXX Metropolitan Parks and Open Space Commission Meeting date: July 7, 2015 For the Community Development Committee meeting of July 20, 2015 For the Metropolitan Council meeting
Project Overview. Hunter Mill Road Over Colvin Run Bridge Replacement Fairfax County. Get Involved. Public Information Meeting. Contact Information
 Get Involved VDOT representatives will review and evaluate any information received as a result of the public information meeting. The comment sheet in this brochure is provided to assist in making your
Susitna-Watana Hydroelectric Project (FERC No ) Recreation Resources Study Study Plan Section Study Implementation Report
 Recreation Resources Study Study Plan Section Study Implementation Report") (FERC No. 14241) Recreation Resources Study Study Plan Section 12.5 2014 Study Implementation Report Prepared for Prepared by AECOM November 2015 TABLE OF CONTENTS 1. Introduction... 4 2. Study Objectives...
(FERC No. 14241) Recreation Resources Study Study Plan Section 12.5 2014 Study Implementation Report Prepared for Prepared by AECOM November 2015 TABLE OF CONTENTS 1. Introduction... 4 2. Study Objectives...
Chapter 1 Introduction and Project Overview
 Chapter 1 Introduction and Project Overview Kittitas County in cooperation with the Federal Aviation Administration (FAA) is updating the Airport Master Plan for Bowers Field Airport (FAA airport identifier
A number of goals were identified during the initial work on this Big Lake Transportation Plan.
 C. Transportation General Background Information Big Lake s transportation system includes all the roads, paths and facilities that allow the movement of private vehicles, trains and planes, as well as
CHAPTER 1 INTRODUCTION MORENO VALLEY GENERAL PLAN 1. INTRODUCTION. 1.1 What is a General Plan?
 1. INTRODUCTION 1.1 What is a General Plan? A General Plan is a comprehensive long-term strategy for the physical development of a city. It determines how land may be used and the infrastructure and public
2017 TBARTA Future Regional Priority Projects Adopted by TBARTA Board, December 9, 2016
 2017 TBARTA Future Regional Priority Projects Adopted by TBARTA Board, December 9, 2016 Project numbers do not signify ranking they are for mapping identification purposes only. 1. 15th Street East The
Welcome to the Illinois High-Speed Rail Chicago to St. Louis Construction Update Meeting. Today s meeting will provide an overview of the Program,
 Welcome to the Illinois High-Speed Rail Chicago to St. Louis Construction Update Meeting. Today s meeting will provide an overview of the Program, updates on construction to be held in this area, and how
PUBLIC NOTICE. Table 1 Projects Proposed by Amendment
 PUBLIC NOTICE The Dallas Department of Aviation (the Department) intends to file an amendment application to increase the PFC amount of one previously approved project at Dallas Love Field Airport (the
St. Paul Downtown Airport (STP)
") Reliever Airports: NOISE ABATEMENT PLAN St. Paul Downtown Airport (STP) 1 INTRODUCTION The noise abatement plan for the St. Paul Downtown Airport (STP) was prepared in recognition of the need to make the
Reliever Airports: NOISE ABATEMENT PLAN St. Paul Downtown Airport (STP) 1 INTRODUCTION The noise abatement plan for the St. Paul Downtown Airport (STP) was prepared in recognition of the need to make the
Welcome to the Cross County Trail Public Input Session!
 Welcome to the Cross County Trail Public Input Session! Please sign in on the table below! What are we doing here? Camden County has proposed a bicycle and pedestrian trail spanning across the entire county.
BACKCOUNTRY TRAIL FLOOD REHABILITATION PROGRAM
 BACKCOUNTRY TRAIL FLOOD REHABILITATION PROGRAM Backcountry Trail Flood Rehabilitation A June 2013 Flood Recovery Program Summary In June 2013, parts of Southern Alberta were devastated from significant
CLACKAMAS COUNTY BOARD OF COUNTY COMMISSIONERS. Policy Session Worksheet
 CLACKAMAS COUNTY BOARD OF COUNTY COMMISSIONERS Policy Session Worksheet Presentation Date: 10/10/17 Approx. Start Time: 1:30 PM Approx. Length: 60 minutes Presentation Title: An Update on the Sunrise Highway
Performance Clackamas Clackamas County Strategic Plan
 June 2017 update Performance Clackamas Clackamas County Strategic Plan Strategic Goals and Milestones This is the June 2017 update to Performance Clackamas, the Clackamas County Strategic Plan. The plan
WESTERN EL DORADO COUNTY SHORT AND LONG-RANGE TRANSIT PLAN Executive Summary
 WESTERN EL DORADO COUNTY SHORT AND LONG-RANGE TRANSIT PLAN Executive Summary Prepared for the El Dorado County Transportation Commission Prepared by The El Dorado County Transportation Commission (EDCTC)
McLean Citizens Association Transportation Committee Project Briefing
 McLean Citizens Association Transportation Committee Project Briefing November 10, 2015 Project Map 2 Project Context Only Interstate in the Country limited to HOV only traffic during rush hours Stoplight
N4 Carrick-on-Shannon to Dromod Road Project. 2.1 Introduction
 Chapter 2 Need for the Scheme 2.1 Introduction The National Primary Route N4, Dublin to Sligo is a strategic corridor from Dublin to the northwest and border counties (See RCSR 101 in Volume 2). The National
BONITA BEACH ROAD. May 18, Ian Lockwood, PE Cindy Zerger, AICP, ASLA Ken Ray, RLA. Greg Diserio, RLA. Tara Salmieri, AICP
 BONITA BEACH ROAD May 18, 2016 Ian Lockwood, PE Cindy Zerger, AICP, ASLA Ken Ray, RLA Greg Diserio, RLA Tara Salmieri, AICP Toole Design Group Engineers Planners Landscape Architects Authors BONITA BEACH
At the time, the portion of the line through Eagle County remains wholly under the ownership of Union Pacific Railroad (UP).
.") Chapter 5 The Railroad Corridor as a Trail Corridor The intent of this chapter is to identify how the rail corridor, if available for lease or purchase in all or part, could be incorporated into the core
Chapter 5 The Railroad Corridor as a Trail Corridor The intent of this chapter is to identify how the rail corridor, if available for lease or purchase in all or part, could be incorporated into the core
Arlington County Board Meeting Project Briefing. October 20, 2015
 Arlington County Board Meeting Project Briefing October 20, 2015 Project Map 2 Project Context Only Interstate in the Country limited to HOV only traffic during rush hours Stoplight at the end of I-66
Interstate 90 and Mercer Island Mobility Study APRIL Commissioned by. Prepared by
 Interstate 90 and Mercer Island Mobility Study APRIL 2017 Commissioned by Prepared by Interstate 90 and Mercer Island Mobility Study Commissioned by: Sound Transit Prepared by: April 2017 Contents Section
METROBUS SERVICE GUIDELINES
 METROBUS SERVICE GUIDELINES In the late 1990's when stabilization of bus service was accomplished between WMATA and the local jurisdictional bus systems, the need for service planning processes and procedures
Community Development Committee
 C Community Development Committee For the Metropolitan Council meeting of October 31, 2012 Committee Report Item:2012-316 ADVISORY INFORMATION October 16, 2012 Date Prepared: Subject: Intercity Regional
This section evaluates the projected traffic operations and circulation impacts associated with the proposed upgrade and expansion of the LWRP.
 4.5 TRAFFIC AND CIRCULATION This section evaluates the projected traffic operations and circulation impacts associated with the proposed upgrade and expansion of the LWRP. 4.5.1 Environmental Setting Existing
According to FAA Advisory Circular 150/5060-5, Airport Capacity and Delay, the elements that affect airfield capacity include:
 4.1 INTRODUCTION The previous chapters have described the existing facilities and provided planning guidelines as well as a forecast of demand for aviation activity at North Perry Airport. The demand/capacity
MASTER PLAN EXECUTIVE SUMMARY
 Biscuit Run State Park Scottsville Road (State Route 20) Charlottesville, VA 22902 Biscuit Run State Park MASTER PLAN EXECUTIVE SUMMARY Department of Conservation and Recreation Division of Planning and
S Central Coast Heritage Protection Act APRIL 21, 2016
 STATEMENT OF GLENN CASAMASSA ASSOCIATE DEPUTY CHIEF, NATIONAL FOREST SYSTEM U.S. FOREST SERVICE U.S. DEPARTMENT OF AGRICULTURE BEFORE THE UNITED STATES SENATE COMMITTEE ON ENERGY AND NATURAL RESOURCES
4. Safety Concerns Potential Short and Medium-Term Improvements
 NH Route 104 Access Management Study Page 19 4. Safety Concerns Potential Short and Medium-Term Improvements Potential safety improvement strategies are listed by priority based on field observations by
COASTAL CONSERVANCY. Staff Recommendation September 22, 2011 BAY AREA RIDGE TRAIL: HOOD MOUNTAIN TO HIGHWAY 12
 COASTAL CONSERVANCY Staff Recommendation September 22, 2011 BAY AREA RIDGE TRAIL: HOOD MOUNTAIN TO HIGHWAY 12 File No. 11-039-001 Project Manager: Betsy Wilson RECOMMENDED ACTION: Authorization to disburse
DEMOGRAPHICS AND EXISTING SERVICE
 EXECUTIVE SUMMARY The Central Corridor light-rail transit (LRT) project will open in 2014 and operate between downtown Minneapolis and downtown St. Paul, serving the University of Minnesota and University
NORTHEAST CARLTON COUNTY BICYCLE ROUTE PLAN
 NORTHEAST CARLTON COUNTY BICYCLE ROUTE PLAN 5/31/2014 and St. Louis River Trail Plan Update Produced by the Arrowhead Regional Development Commission (ARDC) in Partnership with the State Health Improvement
Madison Metro Transit System
 Madison Metro Transit System 1101 East Washington Avenue Madison, Wisconsin, 53703 Administrative Office: 608 266 4904 Fax: 608 267 8778 TO: FROM: SUBJECT: Plan Commission Timothy Sobota, Transit Planner,
HAMPTON ROADS CROSSINGS PATRIOTS CROSSING AND HRBT
 HRTPO Board Meeting March 21, 2013 Agenda ITEM #9: HAMPTON ROADS CROSSINGS PATRIOTS CROSSING AND HRBT Congestion at the Hampton Roads Bridge-Tunnel (HRBT) on I-64 has long been identified as a problem
FEASIBILITY CRITERIA
 This chapter describes the methodology and criteria used to evaluate the feasibility of developing trails throughout the study areas. Land availability, habitat sensitivity, roadway crossings and on-street
Basic Project Information
 FY 2015-16 PROJECT DESCRIPTION FORM (2C) Submitting Agency: Loudoun County Basic Project Information Project Title: Loudoun County Parkway (VA Route 607) U.S. 50 to Creighton Rd. (2C) Project Type (check
Spadina Avenue Built Form Study Preliminary Report
 STAFF REPORT ACTION REQUIRED Spadina Avenue Built Form Study Preliminary Report Date: July 9, 2014 To: From: Wards: Reference Number: Toronto and East York Community Council Director, Community Planning,
Trail # NW Tuesday, June DESIGN. Provide an Review the Provide an. Project Goals: System system. wayfinding
 I. Welcome / Introductions Bethany Creek Trail #2 Segment 3 Neighborhood Meeting #1 Bethany Presbyterian Church 15505 NW Springville Road, Portland, OR 97229 Tuesday, June 26, 2018 @ 6:00PM Meeting Minutes
Section II. Planning & Public Process Planning for the Baker/Carver Regional Trail began in 2010 as a City of Minnetrista initiative.
 Section II Planning & Public Process Planning for the began in 2010 as a City of initiative. city staff began discussions with the Park District on the possibility of a north/south regional trail connection
ONONDAGA CREEKWALK PHASE II. Public Information Meeting Series 1
 ONONDAGA CREEKWALK PHASE II Public Information Meeting Series 1 Andrew Maxwell Director, Syracuse-Onondaga County Planning Agency Owen Kerney Assistant Director for City Planning Russell Houck, PE City
This section of the Plan provides a general overview of the Smoky Mountain Region. It consists of the following four subsections:
 SECTION 3 COMMUNITY PROFILE This section of the Plan provides a general overview of the Smoky Mountain Region. It consists of the following four subsections: 3.1 Geography and the Environment 3.2 Population
MESA COUNTY DEPARTMENT OF PUBLIC WORKS Administration - Building - Engineering Road and Bridge Traffic - Planning - Solid Waste Management
 MESA COUNTY DEPARTMENT OF PUBLIC WORKS Administration - Building - Engineering Road and Bridge Traffic - Planning - Solid Waste Management 200 S. Spruce St. P.O. Box 20,000 Grand Junction, Colorado 81502-5022
MUNICIPALITY OF ANCHORAGE
 MUNICIPALITY OF ANCHORAGE ANCHORAGE PARKS & RECREATION Memorandum PRC 08-56 DATE: 5 August 2008 TO: FROM: SUBJECT: Parks & Recreation Commission Holly Spoth-Torres, Park Planner PRC 08-56 Far North Bicentennial