Prepared for Travel Oregon by Kathi Jaworski, Write to Know consulting
|
|
|
- Jeremy Owens
- 6 years ago
- Views:
Transcription


1
2 1
3 2


4 3
5 4
6 5
7 o 6


8 7
9 8
10 9
11 Coos County Employment by Industry, Top Categories of Employment (500+ Jobs) 5,000 4,500 4,000 3,500 3,000 2,500 2,000 1,500 1, Source: Oregon Employment Department. 10
12 Monthly Unemployment Rate, Coos County, Jan Nov Jan Feb Mar Apr May Jun Jul Aug Sep Oct Nov Dec Source: Oregon Employment Department Year * Coos County Tourism Jobs 3,140 3,300 2,940 3,020 3,010 3,030 3,120 * = preliminary 2015 estimate, Dean Runyan Associates, Oregon Travel Impacts, p Totals differ from Leisure and Hospitality job counts through OR Employment Dept. due to different definitions and methodologies 35,000 30,000 25,000 20,000 15,000 10,000 5, Total Employed Tourism Employment Source: Oregon Department of Labor for Total employment, and Dean Runyan Associates for Travel Oregon for tourism employment 2015 tourism employment numbers are preliminary 11
13 Visitor Spending by Category, Coos County, $300,000,000 $250,000,000 $200,000,000 $150,000,000 $100,000,000 $50,000,000 $ p Accommodations Food Service Food Stores Local Transportation and gas Arts, Entertainment and Recreation Retail Sales Source: Dean Runyan Associates for Travel Oregon 50.00% 40.00% 30.00% 20.00% 10.00% 0.00% % % % Accommodations Food Service Food Stores Local Transportation and gas Arts, Entertainment and Recreation Retail Sales Total Destination Spending* Coos County Oregon Coast region State Source: Dean Runyan Associates for Travel Oregon 12
14 Local Room Tax Collections, , by Community $2,000,000 $1,800,000 $1,600,000 $1,400,000 $1,200,000 $1,000,000 $800,000 $600,000 $400,000 $200,000 $ Bandon Coos Bay Coquille Indian Tribe Lakeside North Bend Reedsport 13
15 5,000,000 4,500,000 4,000,000 3,500,000 3,000,000 2,500,000 2,000,000 1,500,000 1,000, , Day Use Overnight 14


16 Retail 12% Accomm 22% Arts, Ent, Rec 16% Local Tran & Gas 10% Food Stores 10% Food Serv 30% $300 $250 $200 $150 $100 $50 $0 OR OR Coast South Coast* Coos County Accomm Food Serv Food Stores Local Tran & Gas Arts, Ent, Rec Retail Air Source: Dean Runyan Associates for Travel Oregon *= Coos and Curry County region 15
17 16
18 17
19 Household Income, Overnight Visitors Bandon, Adventure Coast, Oregon Coast, State, % 40% 30% 20% 10% 0% Under $49K $50K-$74.9K $75K-$99.9K $100K-$149.9K $150k+ Bandon Adventure Coast Oregon Coast region State Source: Oregon Coast and Oregon, Longwoods International. For marketable trips only DCG Research, Bandon and Adventure Coast website visitor profile "When Visiting, Where do you Stay?" (check all that apply) 80% 70% 60% 50% 40% 30% 20% 10% 0% Bandon Adventure Coast Oregon Coast Source: Oregon Coast, Longwoods International, 2015: DCG Research, Bandon and Adventure Coast visitor center survey,
20 % of Visitors Participating in Activities and Experiences, OR Coast 2011 and 2015, State 2015 Beach/Waterfront Shopping National/State Park Landmark/Historic Site Hiking/Backpacking Casino Fine Dining Camping Swimming Museum Fishing Brewery Bar/Disco Winery Coast 2011 Coast 2015 State
21 Historic places Cultural activities/attractions Exceptional culinary experience Brewery tours/beer tasting* Winery tours/wine tasting Family reunion* Eco-tourism Traveling with grandchildren Religious travel* Wedding* Medical tourism* % of Visitors with Special Interests, OR Coast 2011 and 2015, State Coast 2011 Coast 2015 State
22 Seasonal Distribution of Overnight Visitors by Quarter, Oregon Coast Region vs. State, 2015 Jan-Mar Apr-Jun Jul-Sep Oct-Dec 0% 5% 10% 15% 20% 25% 30% 35% State Oregon Coast Transient Room Tax Collected by 4 largest municipalities, by season, $3,000, $2,500, $2,000, $1,500, $1,000, $500, $- Jan-Mar Apr-Jun Jul-Sep Oct-Dec
23 Jan-12 Mar-12 May-12 Jul-12 Sep-12 Nov-12 Jan-13 Mar-13 May-13 Jul-13 Sep-13 Nov-13 Jan-14 Mar-14 May-14 Jul-14 Sep-14 Nov-14 Jan-15 Mar-15 May-15 Jul-15 Sep-15 Nov-15 Day Use, OR State Parks in Coos County and Coastal Douglas County, , , , , , , ,000 - Golden and Silver Falls State Natural Area Umpqua State Scenic Corridor Face Rock State Scenic Viewpoint Cape Arago State Park William M. Tugman State Park Sunset Bay State Park Seven Devils State Recreation Site Shore Acres State Park Bandon State Natural Area Umpqua Lighthouse State Park Bullards Beach State Park 22
24 Overnight camping, OR State Parks in Coos and Coastal Douglas Counties, ,000 50,000 40,000 30,000 20,000 10,000 - UMPQUA LIGHTHOUSE STATE PARK SUNSET BAY STATE PARK WILLIAM M. TUGMAN STATE PARK BULLARDS BEACH STATE PARK "Discovery" (Low) Season Visitation as a % of Annual Visitation, Oregon State Parks in Coos and Coastal Douglas Counties, % 40.0% 30.0% 20.0% 10.0% 0.0% Day Use Overnight 23
25 24
26 o o o o o 25
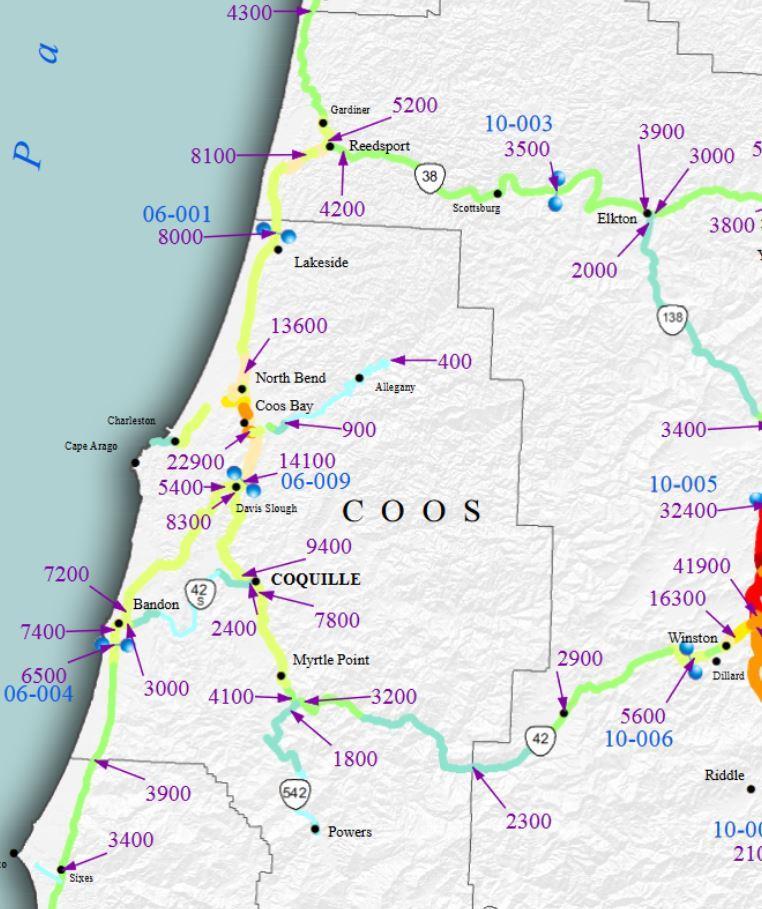
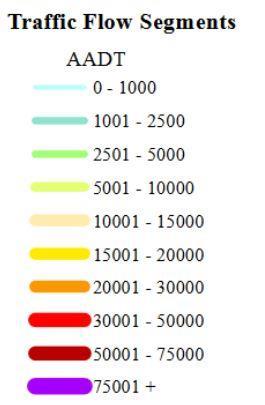
27 Mile marker Highway 101 Average Daily Traffic Change Lane-Douglas County line Reedsport, north city limit just south of OR38 intersection Reedsport, west city limit just north of 8th St, Winchester Bay just south of Umpqua Lake Rd Douglas-Coos County line just south of Airport Way Hayes Inlet bridge North Bend, north city limit North Bend-Coos Bay line Bayshore Ave, just north of Hemlock Coos Bay, south city limit just north of OR42 intersection just south of OR42 intersection Bandon, north city limit just north of OR42S intersection just west of Michigan Ave Bandon, south city limit Coos-Curry County line 4,300 4,000 4,000 5,200 5,800 5,400 8,400 9,500 9,000 8,100 9,300 8,700 10,900 12,800 8,900 7,200 7,700 7,100 7,100 8,000 6,900 7,900 8,700 7,700 12,100 12,600 10,900 13,600 15,300 14,100 19,800 21,100 17,300 20,100 21,800 19,000 22,800 25,600 22,700 14,100 13,000 13,500 5,400 5,100 4,800 7,200 6,000 6,200 6,600 5,400 5,800 10,300 9,400 8,500 7,400 8,500 7,400 3,900 3,400 3, % -3.7% -6.7% -6.9% 22.5% 1.4% 2.9% 2.6% 11.0% -3.5% 14.5% 5.8% 0.4% 4.4% 12.5% 16.1% 13.8% 21.2% 0.0% 18.2% 26
28 Mile marker Highway 38 Average Daily Traffic Change Just west of I-5 at Curtin 51.2 Drain, north city limit 50.2 Drain, west city limit Elkton, east city limit Elkton, west city limit just east of Main St Scottsburg 0.1 Just east of 101 at Reedsport 4,900 4,800 4,100 5,200 4,900 4,100 3,800 4,100 3,800 4,500 4,900 4,300 3,900 3,700 3,900 3,300 2,900 3,500 5,400 5,100 5, % 26.8% 0.0% 4.7% 0.0% -5.7% 5.9% Mile marker OR Highway 42 Average Daily Traffic Change just west of I-5 south of Roseburg just west of intersection with Highway just west of Powers Highway turnoff Myrtle Point, north city limit 12.8 Coquille, south city limit 21,000 18,200 22,000 9,800 8,800 9,900 4,100 3,700 3,800 5,500 5,600 6,300 7,800 7,300 7, just south of Highway 42S turnoff 9,000 8,700 8,800 just east of 101 btwn Bandon and Coos 0.7 Bay 8,300 8,000 8, % -1.0% 7.9% -12.7% 4.0% 2.3% 1.2% Mile Marker OR Highway 42S Average Daily Traffic just west of OR42 3,300 3,000 2, Coquille, south city limits 2,400 2,600 2, Just east of Myrtle Point-Lampa Rd 860 1,100 1, Just east of Prosper Junction Rd 1,400 1,500 1, Bandon, east city limit 3,000 3,400 3, Change % 4.3% -21.8% 4.1% 0.4 Just east of Highway 101 at Bandon 5,100 5,000 4,900 Source for all traffic count tables: Oregon Department of Transportation 0.0% -6.3%
29 28
30 o o o o o o 29
31 Year p Accommodations $4,700,000 $40,700,000 $45,300,000 $47,600,000 $50,100,000 $55,500,000 Food Service $55,500,000 $53,900,000 $58,700,000 $64,100,000 $68,500,000 $73,100,000 Food Stores $21,300,000 $19,900,000 $21,700,000 $23,000,000 $24,200,000 $25,200,000 Transportation and gas (Local) $29,600,000 $23,500,000 $28,600,000 $29,100,000 $28,900,000 $24,400,000 Art, Entertainment and Recreation $35,900,000 $33,100,000 $34,800,000 $37,000,000 $38,500,000 $40,000,000 Retail Sales $26,000,000 $24,800,000 $26,100,000 $27,600,000 $28,400,000 $29,200,000 Total Destination Spending $213,000,000 $195,900,000 $215,200,000 $228,400,000 $238,600,000 $247,400,000 Commodity OR South Coos OR Purchased Coast Coast* County Accommodations $57 $50 $39 $35 Food Service $65 $60 $51 $46 Food Stores $20 $21 $20 $16 Local Tran & Gas $40 $20 $19 $15 Arts, Ent, Rec $29 $29 $26 $25 Retail $31 $28 $22 $18 Air $23 $0 $2 $0 Total $265 $209 $180 $ Bandon $ 426,000 $ 391,000 $ 376,000 $ 438,000 $ 462,000 $ 550,000 Coos Bay $ 561,000 $ 464,000 $ 485,000 $ 507,000 $ 520,000 $ 583,000 Coquille Indian Tribe $ - $ 108,000 $ 281,000 $ 296,000 $ 295,000 $ 343,000 Lakeside $ 40,000 $ 23,000 $ 35,000 $ 37,000 $ 40,000 $ 46,000 North Bend $ 246,000 $ 84,000 $ 96,000 $ 96,000 $ 102,000 $ 102,000 Reedsport $ 175,000 $ 168,000 $ 170,000 $ 182,000 $ 181,000 $ 221,000 Total $ 1,448,000 $ 1,238,000 $ 1,443,000 $ 1,556,000 $ 1,600,000 $ 1,845,000 Source all data on this page: Dean Runyan Associates 30
32 Deb Rudd Kyle Wirebaugh Joe Benetti Julie Miller Kat Hoppe Melissa Cribbins Kathi Simmoneti Roger Craddock Emily Groves Connie Stopher Fiona Bai Dave Lacey Trish Mace DeeDee Murphy Jim Seeley Marie Simonds Jeff Stump Alison Arnold Larry Becker Kay Claybourn Jennifer Groth Kat Hoppe Miles Phillips South Slough NERR Coquille City Councilor Benetti s Italian Restaurant (and Coos Bay Mayor) Bandon Chamber of Commerce The Mill Casino Coos County Commissioner Coquille Chamber of Commerce City Manager, Coos Bay 42 & Spruce Downtown South Coast Development Council Port of Coos Bay Oregon Coast Visitors Association Charleston Marine Life Center Reedsport MainStreet Wild Rivers Coast Alliance Wild Rivers Coast Alliance Confederated Tribes of the Coos, Lower Umpqua and Siuslaw Indians USFS - Rogue River National Forest Oregon Parks and Recreation Dept Powers School District Southwest Oregon Regional Airport The Mill Casino Oregon State University 31
RURAL TOURISM STUDIO SOUTHERN OREGON COAST COMMUNITY TOURISM VISIONING WORKSHOP NOTES January 25,2017 Mill Casino, North Bend
 FACILITATORS: Kristin Dahl, Vice President, Destination Development, Travel Oregon David Beurle, Future iq Lehna Malmkvist, Future iq TRAVEL OREGON STAFF: Todd Davidson, CEO Scott Bricker, Manager, Destination
January 2018 Air Traffic Activity Summary
 January 2018 Air Traffic Activity Summary Jan-2018 Jan-2017 CY-2018 CY-2017 Passengers 528,947 505,421 4.7% 528,947 505,421 4.7% Passengers 537,332 515,787 4.2% 537,332 515,787 4.2% Passengers 1,066,279
SOUTHERN OREGON COAST
 SOUTHERN OREGON COAST OUTDOOR RECREATION & ADVENTURE TRAVEL WORKSHOP 02.22.2017 WELCOME! Visibly display your bandana Move around the room OPENING ACTIVITY Introduce yourself / get a business card from
Oregon 2011 Regional Visitor Report The Eastern Region
 Oregon 2011 Regional Visitor Report The Eastern Region Introduction Longwoods International began tracking American travelers in 1985, and has conducted large-scale syndicated visitor research quarterly
Oregon 2009 Visitor Report June, 2010
 Oregon 2009 Visitor Report June, 200 Table of Contents Introduction...... 3 Methodology.. 4 U.S. Travel Market Size & Structure.. 5 Oregon s Travel Market Size & Structure...... Overnight Trip Detail............
Oregon 2011 Regional Visitor Report The Central Region
 Oregon 2011 Regional Visitor Report The Central Region Introduction Longwoods International began tracking American travelers in 1985, and has conducted large-scale syndicated visitor research quarterly
Oregon 2011 Visitor Final Report
 Oregon 0 Visitor Final Report Table of Contents Introduction...... 3 Methodology.. U.S. Travel Market Size & Structure..... 5 Oregon Travel Market Size & Structure... Overnight Trip Detail............
11/29/2017. AOT Research Staff. Agenda. Northern Region 2016 Year-End Data Review. Grand Canyon Chamber of Commerce November 30, 2017
 Northern Region 01 Year-End Data Review Grand Canyon Chamber of Commerce November 30, 01 AOT Research Staff Colleen Floyd Director of Research cfloyd@tourism.az.gov 0-34-31 Kari Roberg Research Manager
Oregon 2015 Regional Visitor Report The Central Region
 Oregon 015 Regional Visitor Report The Central Region Introduction Longwoods International began tracking American travelers in 1985, and has conducted large-scale syndicated visitor research quarterly
Oregon 2015 Regional Visitor Report The Mt. Hood-Columbia River Gorge Region
 Oregon 015 Regional Visitor Report The Mt. Hood-Columbia River Gorge Region Introduction Longwoods International began tracking American travelers in 1985, and has conducted large-scale syndicated visitor
SOUTHERN OREGON COAST RURAL TOURISM STUDIO TEAMING FOR IMPACT AND ACTION WORKSHOP NOTES April 19, 2017 North Bend
 SOUTHERN OREGON COAST RURAL TOURISM STUDIO TEAMING FOR IMPACT AND ACTION WORKSHOP NOTES April 19, 2017 North Bend FACILITATOR Alexa Carey, Destination Development Specialist, Travel Oregon TRAVEL OREGON
Oregon 2015 Regional Visitor Report The Coast Region
 Oregon 05 Regional Visitor Report The Coast Region Introduction Longwoods International began tracking American travelers in 985, and has conducted large-scale syndicated visitor research quarterly since
West Virginia 2011 Overnight Visitor Final Report
 West Virginia 011 Overnight Visitor Final Report June, 01 Table of Contents Introduction...... Methodology.. Travel Market Size & Structure... 5 Overnight Expenditures.. 11 Overnight Trip Characteristics...
West Virginia 2009 Visitor Report December, 2010
 West Virginia 009 Visitor Report December, 010 Table of Contents Introduction...... Methodology.. 4 Travel Market Size & Structure... 6 Overnight Expenditures.. 1 Overnight Trip Characteristics... 16 Demographic
Duluth, MN 2015 Visitor Report
 Duluth, MN 015 Visitor Report Table of Contents Introduction...... Methodology.. Key Findings. 5 Size & Structure of the U.S. Travel Market.. 9 Size & Structure of Duluth s Travel Market 1 Overnight Trip
Oregon 2015 Visitor Report
 Oregon 05 Visitor Report Table of Contents Introduction...... Methodology.. 4 Key Findings. 5 Size & Structure of the U.S. Travel Market.. 9 Size & Structure of Oregon s Travel Market Overnight Trip Detail............
Oregon 2013 Regional Visitor Report The Southern Region
 Oregon 01 Regional Visitor Report The Southern Region Introduction Longwoods International began tracking American travelers in 1985, and has conducted large-scale syndicated visitor research quarterly
SOUTHERN OREGON COAST
 SOUTHERN OREGON COAST OUTDOOR RECREATION & ADVENTURE TRAVEL NETWORKING EVENT 02.21.2017 OPENING ACTIVITY Move around the room Introduce yourself / get a business card from at least 3 people you don t know:
Oregon 2013 Visitor Report
 Oregon 0 Visitor Report Table of Contents Introduction...... Methodology.. 4 U.S. Travel Market Size & Structure..... 5 Oregon Travel Market Size & Structure... 9 Overnight Trip Detail............ 7 Overnight
Wild Rivers Coast Rural Tourism Studio Baseline Assessment August 2013
 Wild Rivers Coast Rural Tourism Studio Baseline Assessment August 2013 Prepared for Travel Oregon by: Write to Know Consulting Eugene Oregon Wild Rivers Coast Rural Tourism Studio Baseline Assessment Contents
Tampa/Hillsborough County Visitor Report
 Tampa/Hillsborough County 015 Visitor Report Table of Contents Introduction.. Research Objectives.... Methodology... 5 Key Findings 6 Size & Structure of the U.S. Travel Market.... 10 Size & Structure
Tampa Bay 2014 Visitor Report
 Tampa Bay 2014 Visitor Report Table of Contents Introduction...... Research Objectives 4 Methodology. 5 Size & Structure of the U.S. Travel Market.. 6 Size & Structure of Tampa Bay s Domestic Travel Market..
DTTAS Quarterly Aviation Statistics Snapshot Quarter Report
 Contents DTTAS Quarterly Aviation Statistics Snapshot Quarter 4 2015 Report 1.1 Dublin Airport Key Statistics... 1 1.2 Cork Airport Key Statistics... 3 1.3 Shannon Airport Key Statistics... 5 1.4 Total
Naples, Marco Island, Everglades Convention and Visitors Bureau April 2013 Visitor Profile
 RESEARCH DATA SERVICES, INC. 777 SOUTH HARBOUR ISLAND BOULEVARD SUITE 260 TAMPA, FLORIDA 33602 TEL (813) 254-2975 FAX (813) 223-2986 Naples, Marco Island, Everglades Convention and Visitors Bureau April
DTTAS Quarterly Aviation Statistics Snapshot Quarter Report
 Contents DTTAS Quarterly Aviation Statistics Snapshot Quarter 3 2018 Report 1.1 Dublin Airport Key Statistics... 1 1.2 Cork Airport Key Statistics... 3 1.3 Shannon Airport Key Statistics... 5 1.4 Total
DTTAS Quarterly Aviation Statistics Snapshot Quarter Report
 Contents DTTAS Quarterly Aviation Statistics Snapshot Quarter 1 2018 Report 1.1 Dublin Airport Key Statistics... 1 1.2 Cork Airport Key Statistics... 3 1.3 Shannon Airport Key Statistics... 5 1.4 Total
West Virginia 2013 Visitor Report
 West Virginia 013 Visitor Report Table of Contents Introduction...... 3 Research Objectives 4 Research Method. 5 Travel Market Size & Structure.... Overnight Expenditures.. 11 Overnight Trip Characteristics...
Maury County, TN. Hotel, Restaurant, and Travel Industries: Economic Profile and Business Trends, Maury County (Columbia and Spring Hill area)
") Maury County, TN Maury County (Columbia and Spring Hill area) Hotel, Restaurant, and Travel Industries: Economic Profile and Business Trends, 06 Steve Morse, Ph.D. Director & Economist Tourism Institute
Maury County, TN Maury County (Columbia and Spring Hill area) Hotel, Restaurant, and Travel Industries: Economic Profile and Business Trends, 06 Steve Morse, Ph.D. Director & Economist Tourism Institute
Temecula Valley Travel Impacts
 Temecula Valley Travel Impacts 2000-2013p photo courtesy of Temecula Valley Convention and Visitors Bureau June 2014 Prepared for the Temecula Valley Convention and Visitors Bureau Temecula, California
Cheatham County, TN. Hotel, Restaurant, and Travel Industries: Economic Profile and Business Trends, 2006
 Cheatham County, TN Cheatham County (Kingston Springs & Ashland City areas) Hotel, Restaurant, and Travel Industries: Economic Profile and Business Trends, Steve Morse, Ph.D. Director & Economist Tourism
2014 NOVEMBER ECONOMIC IMPACTS AND VISITOR PROFILE. Prepared By:
 2014 NOVEMBER ECONOMIC IMPACTS AND VISITOR PROFILE Prepared By: Sisters Folk Festival Economic Impacts and Visitor Profile September 5-7, 2014 November 2014 Prepared for Sisters Folk Festival, Inc. Sisters,
Loudon County, TN. Hotel, Restaurant, and Travel Industries: Economic Profile and Business Trends, Loudon County (Loudon and Lenoir City areas)
") Loudon County, TN Loudon County (Loudon and Lenoir City areas) Hotel, Restaurant, and Travel Industries: Economic Profile and Business Trends, Steve Morse, Ph.D. Director & Economist Tourism Institute
Loudon County, TN Loudon County (Loudon and Lenoir City areas) Hotel, Restaurant, and Travel Industries: Economic Profile and Business Trends, Steve Morse, Ph.D. Director & Economist Tourism Institute
SOUTHERN OREGON COAST RURAL TOURISM STUDIO CULINARY & AGRITOURISM WORKSHOP Wednesday, March 22, 2017 Bandon, OR
 SOUTHERN OREGON COAST RURAL TOURISM STUDIO CULINARY & AGRITOURISM WORKSHOP Wednesday, March 22, 2017 Bandon, OR TRAVEL OREGON STAFF Alexa Carey, Destination Development Specialist Elena Vizzini, Destination
dynamic future Hugh A. Stump III //
 OPPORTUNITY dynamic future Gadsden and Etowah County, ideally-situated in northeast Alabama along the Coosa River and at the foot of Lookout Mountain, is full of outdoor fun. View majestic Noccalula Falls,
Number of tourism trips of residents increased namely for leisure
 Tourism Demand of Residents 1 st Quarter 2018 25 July 2018 Number of tourism trips of residents increased namely for leisure In the 1 st quarter 2018, residents in Portugal took a total of 4.5 million
Chattanooga & Hamilton Co. Tourism Trends & Economic Outlook
 Chattanooga & Hamilton Co. Tourism Trends & Economic Outlook How Tourism Works for Chattanooga, TN January 21, 2010 Presentation by: Steve Morse, Ph.D. Director & Economist, Tourism Institute University
MONTEREY COUNTY TRAVEL IMPACTS P
 MONTEREY COUNTY TRAVEL IMPACTS 1992-2015P April 2016 Prepared for the Monterey County Convention and Visitors Bureau MONTEREY COUNTY TRAVEL IMPACTS, 1992-2015P Prepared for the Monterey County Convention
Securing Tourism s Place at the Local Economic Development Table. Steve Morse, Ph.D. Director & Economist Tourism Institute Sept.
 Securing Tourism s Place at the Local Economic Development Table Steve Morse, Ph.D. Director & Economist Tourism Institute Sept. 20, 2007 1 First, Welcome to Tourism professionals from Tennessee Faculty
Oregon 2017 Regional Visitor Report Portland Region
 Oregon 07 Regional Visitor Report Portland Region Longwoods International began tracking American travelers in 985, and has conducted large-scale syndicated visitor research quarterly since 990. In 007,
Naples, Marco Island, Everglades Convention and Visitors Bureau April 2014 Visitor Profile
 RESEARCH DATA SERVICES, INC. 777 SOUTH HARBOUR ISLAND BOULEVARD SUITE 260 TAMPA, FLORIDA 33602 TEL (813) 254-2975 FAX (813) 223-2986 Naples, Marco Island, Everglades Convention and Visitors Bureau April
Minnesota 2014 Visitor Report June 2015
 Minnesota 04 Visitor Report June 0 Table of Contents Introduction Methodology 4 U.S. Travel Market Trends Size and Structure of Minnesota s Travel Market 9 Overnight Trip Detail 6 Overnight Trip Characteristics
Naples, Marco Island, Everglades Convention and Visitors Bureau November 2012 Visitor Profile
 RESEARCH DATA SERVICES, INC. 777 SOUTH HARBOUR ISLAND BOULEVARD SUITE 260 TAMPA, FLORIDA 33602 TEL (813) 254-2975 FAX (813) 223-2986 Naples, Marco Island, Everglades Convention and Visitors Bureau November
OVERVIEW. Currently South Australia contributes $6.3 billion to the Australian tourism economy.
 OVERVIEW Currently contributes $6.3 billion to the Australian tourism economy. has achieved 79 per cent of its $8.0 billion maximum potential by 2020. $6.3b $6.5b $8b 2016 2017 2020 Annual Visitor Summary
Are We There Yet? Road Trips Reinvented! Fresh research & insights on marketing to US Road Trips Travelers
 Are We There Yet? Road Trips Reinvented! Fresh research & insights on marketing to US Road Trips Travelers Are We There Yet? Road Trips Reinvented! Amir Eylon, President & Partner, Longwoods International
Item 4. Scottsdale 2016 Visitor Research
 Scottsdale 206 Visitor Research Introduction.. Research Objectives.... Methodology... 5 Key Findings 7 Size & Structure of the U.S. Travel Market.... Size & Structure of Scottsdale s Domestic Travel Market..
SYSTEM BRIEF DAILY SUMMARY
 SYSTEM BRIEF SUMMARY * ANNUAL (PEAK HOURS 7:00 AM TO 10:00 PM MON-SAT) MaxTemp NEL (MWH) Hr Ending Hr Ending LOAD ENERGY (MWH) INCREMENTAL COST DAY DATE Civic TOTAL MAXIMUM @Max MINIMUM @Min FACTOR ON
2015 Business Survey Report Erie to Pittsburgh Trail March 2015
 2015 Business Survey Report Erie to Pittsburgh Trail March 2015 Table of Contents Executive Summary 2 2013 EPT Trail User Survey and Impact Analysis 3 Overview 3 Results 3 2014 2015 Erie to Pittsburgh
Norway MARKET REVIEW Norwegian Visitors in Finland Statistical Trends and Profile
 Norway MARKET REVIEW 2015 Norwegian Visitors in Finland Statistical Trends and Profile 24.11.2016 STATISTICS ON NORWEGIAN TOURISM IN FINLAND STATISTICAL TRENDS 3 Registered overnights 4 Number of visitors
The Economic Impact of Travel in Kansas. Tourism Satellite Account Calendar Year 2013
 The Economic Impact of Travel in Kansas Tourism Satellite Account Calendar Year 2013 Who we are Tourism Economics Union of industry expertise and economic disciplines Real world insights based on quantitative
Naples, Marco Island, Everglades Convention and Visitors Bureau September 2013 Visitor Profile
 RESEARCH DATA SERVICES, INC. 777 SOUTH HARBOUR ISLAND BOULEVARD SUITE 260 TAMPA, FLORIDA 33602 TEL (813) 254-2975 FAX (813) 223-2986 Naples, Marco Island, Everglades Convention and Visitors Bureau September
Naples, Marco Island, Everglades Convention and Visitors Bureau February 2013 Visitor Profile
 RESEARCH DATA SERVICES, INC. 777 SOUTH HARBOUR ISLAND BOULEVARD SUITE 260 TAMPA, FLORIDA 33602 TEL (813) 254-2975 FAX (813) 223-2986 Naples, Marco Island, Everglades Convention and Visitors Bureau February
OREGON DEPARTMENT OF FISH AND WILDLIFE 2017 Sport Fishing Catch - Spring Chinook Expanded numbers by month 'Preliminary' Version #1
 OREGON DEPARTMENT OF FISH AND WILDLIFE 2017 Sport Fishing Catch - Spring Chinook Expanded numbers by month 'Preliminary' Version #1 Based upon Run Year Code Location Name Jan Feb Mar Apr May Jun Jul Aug
SECTION 3. Cape Lookout State Park to Lincoln City MAP LEGEND SECTION 3 GAPS: CONNECTION STRATEGY (2011) Nestucca River (3-1)
 Nestucca River (3-1)") SECTION 1 Columbia River to Oswald West SECTION 1 GAPS: CONNECTION STRATEGY (211) Washington SECTION 1 Necanicum River (1-1) Hikers must leave beach trail at the Gearhart Ocean Recreation Area beach access
SECTION 1 Columbia River to Oswald West SECTION 1 GAPS: CONNECTION STRATEGY (211) Washington SECTION 1 Necanicum River (1-1) Hikers must leave beach trail at the Gearhart Ocean Recreation Area beach access
Naples, Marco Island, Everglades Convention and Visitors Bureau March 2013 Visitor Profile
 RESEARCH DATA SERVICES, INC. 777 SOUTH HARBOUR ISLAND BOULEVARD SUITE 260 TAMPA, FLORIDA 33602 TEL (813) 254-2975 FAX (813) 223-2986 Naples, Marco Island, Everglades Convention and Visitors Bureau March
 A Non-Profit Organization ESTABLISHED 1970 MEMBER CRESCENT SKI COUNCIL April 9 th Officer Installation and Awards Dinner (Page 3) April 23 rd -26 th CSC Spring Convention at Myrtle Beach http://www.spartanburgskiclub.org
Florida s Paradise Coast. Leading the Way to Prosperity
 Florida s Paradise Coast Leading the Way to Prosperity Ten Years in Review Measure 2003 2013 Average Daily Rate $130.32 $166.10 Overnight Visitors 1,312,987 1,573,000 Direct Expenditures $581.5 M $962.5
BRAZIL INTERNATIONAL INBOUND TRAVEL MARKET PROFILE (2011) Copyright 2012 by the U.S. Travel Association. All Rights Reserved.
 Copyright 2012 by the U.S. Travel Association. All Rights Reserved.") BRAZIL INTERNATIONAL INBOUND TRAVEL MARKET PROFILE (211) Copyright 212 by the U.S. Travel Association. All Rights Reserved. EXECUTIVE SUMMARY With a population of nearly 2 million and a GDP exceeding $2
BRAZIL INTERNATIONAL INBOUND TRAVEL MARKET PROFILE (211) Copyright 212 by the U.S. Travel Association. All Rights Reserved. EXECUTIVE SUMMARY With a population of nearly 2 million and a GDP exceeding $2
U.S. DOMESTIC INDUSTRY OVERVIEW FOR MARCH
 Inter-Office Memo Reno-Tahoe Airport Authority Date: April 30, 2009 To: Statistics Recipients From: Krys T. Bart, A.A.E., President/CEO Subject: RENO-TAHOE INTERNATIONAL AIRPORT PASSENGER STATISTICS U.S.
OREGON DEPARTMENT OF FISH AND WILDLIFE 2016 Sport Fishing Catch - Spring Chinook Expanded numbers by month 'Final' Version
 OREGON DEPARTMENT OF FISH AND WILDLIFE 2016 Sport Fishing Catch - Spring Chinook Expanded numbers by month 'Final' Version Based upon Run Year Code Location Name Jan Feb Mar Apr May Jun Jul Aug Sep Oct
November 2011 Visitor Profile
 RESEARCH DATA SERVICES, INC. 777 SOUTH HARBOUR ISLAND BOULEVARD SUITE 260 TAMPA, FLORIDA 33602 TEL (813) 254-2975 FAX (813) 223-2986 Naples, Marco Island, Everglades Convention and Visitors Bureau November
Temecula Valley Travel Impacts p
 Temecula Valley Travel Impacts 2000-2017p photo courtesy of Temecula Valley Convention and Visitors Bureau May 2018 Prepared for the Temecula Valley Convention and Visitors Bureau Temecula, California
Tourism Statistics RTO 1
 Tourism Statistics RTO 1 Tourism Research Unit Spring 2012 1 1 Ontario Tourism 2 2 Ontario Tourism Indicators 2011* Visits increased by 1.3% to 104.4 million. Visits from Ontario and overseas countries
Oregon Enterprise Zones
 Oregon Enterprise Zones July 2011 Lincoln Florence* Lower Umpqua* Tillamook* String of Pearls S. Columbia Forest Grove/ Cornelius* Hillsboro North Urban Clackamas Co. Woodburn* Dallas/ Independence/ Monmouth*
CITY OF PITT MEADOWS MAYOR AND COUNCIL EXPENSES 2017
 COUNCIL MEMBER EDUCATION & TRAINING OTHER MEETINGS & FUNCTIONS MUNICIPAL BUSINESS COMMUNITY RELATIONS CELLPHONES & TABLETS TOTAL EXPENSES MAYOR JOHN BECKER $ $ 3,966.31 $ 125.00 $ 886.20 $ 297.82 $ 720.37
U.S. DOMESTIC INDUSTRY OVERVIEW FOR OCTOBER 2010 All RNO Carriers Systemwide year over year comparison
 Inter-Office Memo Reno-Tahoe Airport Authority Date: November 22, 2010 To: Chairman and Board of Trustees From: Krys T. Bart, A.A.E., President/CEO Subject: RENO-TAHOE INTERNATIONAL AIRPORT OCTOBER 2010
Evaluating Lodging Opportunities
 Evaluating Lodging Opportunities This section explores market opportunities for new lodging accommodations in the downtown area. It will help you understand travel and visitation trends, existing competition,
Colorado Travel Impacts p
 Colorado Travel Impacts 1996-2016p Image Credit: Matt Inden/Miles June 2017 Prepared for the Colorado Tourism Office Denver, Colorado THE ECONOMIC IMPACT OF TRAVEL ON COLORADO 1996-2016P June 2017 prepared
Maine Office of Tourism Visitor Tracking Research Winter 2017 Seasonal Topline. Prepared by
 Maine Office of Tourism Visitor Tracking Research Winter 2017 Seasonal Topline Prepared by June 2017 Research Objectives and Methodology 2 Research Objectives Three distinct online surveys are used to
CHARACTERISTICS OF TRAVELERS FROM MEXICO (Air) TO CALIFORNIA
 TO CALIFORNIA") CHARACTERISTICS OF TRAVELERS FROM MEXICO (Air) TO CALIFORNIA - 2013 Air travelers from Mexico represent one of the largest international markets for California with approximately 515,000 visitors to the
CHARACTERISTICS OF TRAVELERS FROM MEXICO (Air) TO CALIFORNIA - 2013 Air travelers from Mexico represent one of the largest international markets for California with approximately 515,000 visitors to the
Naples, Marco Island, Everglades Convention and Visitors Bureau February 2017 Visitor Profile
 RESEARCH DATA SERVICES, INC. 777 SOUTH HARBOUR ISLAND BOULEVARD SUITE 260 TAMPA, FLORIDA 33602 TEL (813) 254-2975 FAX (813) 223-2986 Naples, Marco Island, Everglades Convention and Visitors Bureau February
Tourism in South Africa A statistical overview
 Tourism in South Africa A statistical overview Purpose of presentation Purpose of the presentation is to present different tourism statistics produced by Stats SA People like to travel we are a country
Naples, Marco Island, Everglades Convention and Visitors Bureau December 2017 Visitor Profile
 RESEARCH DATA SERVICES, INC. 777 SOUTH HARBOUR ISLAND BOULEVARD SUITE 260 TAMPA, FLORIDA 33602 TEL (813) 254-2975 FAX (813) 223-2986 Naples, Marco Island, Everglades Convention and Visitors Bureau December
Naples, Marco Island, Everglades Convention and Visitors Bureau March 2018 Visitor Profile
 RESEARCH DATA SERVICES, INC. 777 SOUTH HARBOUR ISLAND BOULEVARD SUITE 2 TAMPA, FLORIDA 332 TEL (813) 254-2975 FAX (813) 223-2986 Naples, Marco Island, Everglades Convention and Visitors Bureau March 2018
Naples, Marco Island, Everglades Convention and Visitors Bureau June 2018 Visitor Profile
 RESEARCH DATA SERVICES, INC. 777 SOUTH HARBOUR ISLAND BOULEVARD SUITE 260 TAMPA, FLORIDA 33602 TEL (813) 254-2975 FAX (813) 223-2986 Naples, Marco Island, Everglades Convention and Visitors Bureau June
April 2012 Visitor Profile
 RESEARCH DATA SERVICES, INC. 777 SOUTH HARBOUR ISLAND BOULEVARD SUITE 260 TAMPA, FLORIDA 33602 TEL (813) 254-2975 FAX (813) 223-2986 Naples, Marco Island, Everglades Convention and Visitors Bureau April
CHARACTERISTICS OF TRAVELERS FROM SOUTH AMERICA TO CALIFORNIA 2014
 CHARACTERISTICS OF TRAVELERS FROM SOUTH AMERICA TO CALIFORNIA 2014 South was one of California s large overseas markets with approximately 467,000 visitors to California in 2014. Collectively visitors
Naples, Marco Island, Everglades Convention and Visitors Bureau January 2018 Visitor Profile
 RESEARCH DATA SERVICES, INC. 777 SOUTH HARBOUR ISLAND BOULEVARD SUITE 260 TAMPA, FLORIDA 33602 TEL (813) 254-2975 FAX (813) 223-2986 Naples, Marco Island, Everglades Convention and Visitors Bureau January
Third Quarter Marketing Report B R A N SON/LAKES A R EA C VB N OVEMBER, 2013
 Third Quarter Marketing Report B R A N SON/LAKES A R EA C VB N OVEMBER, 2013 Economic Outlook +5.1% from July 2011 Consumer Confidence is Up 7% This Year Increasing from 66.7 in Dec to 71.2 Today +6.7%
October 2011 Visitor Profile
 RESEARCH DATA SERVICES, INC. 777 SOUTH HARBOUR ISLAND BOULEVARD SUITE 260 TAMPA, FLORIDA 33602 TEL (813) 254-2975 FAX (813) 223-2986 Naples, Marco Island, Everglades Convention and Visitors Bureau October
CHARACTERISTICS OF TRAVELERS FROM SOUTH AMERICA TO CALIFORNIA 2015
 CHARACTERISTICS OF TRAVELERS FROM SOUTH AMERICA TO CALIFORNIA 2015 The South n region is a large and growing overseas market with approximately 492,000 combined visitors to California in 2015. Collectively
Naples, Marco Island, Everglades Convention and Visitors Bureau January 2013 Visitor Profile
 RESEARCH DATA SERVICES, INC. 777 SOUTH HARBOUR ISLAND BOULEVARD SUITE 260 TAMPA, FLORIDA 33602 TEL (813) 254-2975 FAX (813) 223-2986 Naples, Marco Island, Everglades Convention and Visitors Bureau January
West Somerset 2015 Local data version
 West Somerset 2015 Local data version Introduction This report examines the volume and value of tourism and the impact of visitor expenditure on the local economy in West Somerset and Somerset county in
Note: These Louisiana indicators show the percentage difference from Second Quarter 2004 to Second Quarter 2005.
 Second Quarter 2005 The Louisiana Travel Pulse is a quarterly industry travel barometer designed to present recent trends in travel industry performance. This issue s emphasis is on the Second Quarter
The Confederated Tribes of the Coos, Lower Umpqua and Siuslaw Indians. Long Range Transportation Plan May 2010
 The Confederated Tribes of the Coos, Lower Umpqua and Siuslaw Indians Long Range Transportation Plan May 2010 The Confederated Tribes of the Coos, Lower Umpqua and Siuslaw Indians 1245 Fulton Ave. Coos
Naples, Marco Island, Everglades Convention and Visitors Bureau August 2018 Visitor Profile
 RESEARCH DATA SERVICES, INC. 777 SOUTH HARBOUR ISLAND BOULEVARD SUITE 260 TAMPA, FLORIDA 33602 TEL (813) 254-2975 FAX (813) 223-2986 Naples, Marco Island, Everglades Convention and Visitors Bureau August
Tourism Statistics RTO 11
 Tourism Statistics RTO 11 Tourism Research Unit Spring 2012 1 1 Tourism 2 2 Tourism Indicators 2011* Visits increased by 1.3% to 104.4 million. Visits from and overseas countries increased, while visits
CHARACTERISTICS OF TRAVELERS FROM NEW ZEALAND TO CALIFORNIA
 CHARACTERISTICS OF TRAVELERS FROM NEW ZEALAND TO CALIFORNIA - 2010 New was one of California s large overseas markets with approximately 108,000 visitors to California in 2010. Collectively visitors spent
Sweden. Swedish Visitors in Finland Statistical Trends and Profile
 Sweden M A R K E T R E V I E W 2 0 1 5 Swedish Visitors in Finland Statistical Trends and Profile 26.10.2016 STATISTICS ON SWEDISH TOURISM IN FINLAND STATISTICAL TRENDS 3 Registered overnights 4 Number
South Korea. South-Korean Visitors in Finland Statistical Trends and Profile
 South Korea M A R K E T R E V I E W 2 0 1 5 South-Korean Visitors in Finland Statistical Trends and Profile 14.10.2016 STATISTICS ON KOREAN TOURISM IN FINLAND STATISTICAL TRENDS 3 Registered overnights
Belgium. Belgian Visitors in Finland Statistical Trends and Profile
 Belgium M A R K E T R E V I E W 2 0 1 5 Belgian Visitors in Finland Statistical Trends and Profile 24.10.2016 STATISTICS ON BELGIAN TOURISM IN FINLAND STATISTICAL TRENDS 3 Registered overnights 4 Number
Naples, Marco Island, Everglades Convention and Visitors Bureau October 2018 Visitor Profile
 RESEARCH DATA SERVICES, INC. 777 SOUTH HARBOUR ISLAND BOULEVARD SUITE 2 TAMPA, FLORIDA 332 TEL (813) 254-2975 FAX (813) 223-2986 Naples, Marco Island, Everglades Convention and Visitors Bureau October
Naples, Marco Island, Everglades Convention and Visitors Bureau January 2016 Visitor Profile
 RESEARCH DATA SERVICES, INC. 777 SOUTH HARBOUR ISLAND BOULEVARD SUITE 260 TAMPA, FLORIDA 33602 TEL (813) 254-2975 FAX (813) 223-2986 Naples, Marco Island, Everglades Convention and Visitors Bureau January
VALLEY STREAM, NY MARKET PROFILE. FOR INFORMATION: Macerich.com
 VALLEY STREAM, NY MARKET PROFILE 2016 PROPERTY TYPE: Regional TOTAL SQUARE FEET: 1,799,000 MAJOR RETAILERS: American Eagle, Best Buy, BJ s Wholesale Club, Century 21, Express, Forever 21, H&M, JCPenney,
Tourism Statistics Region 1
 Tourism Statistics Region 1 Tourism Research Unit Winter 2011 1 Summary In 2008, there were 101.0 million visits in and visitors spent $17.6 billion residents account for the majority of visits and spending
France. French Visitors in Finland Statistical Trends and Profile
 France M A R K E T R E V I E W 2 0 1 5 French Visitors in Finland Statistical Trends and Profile 14.10.2016 STATISTICS ON FRENCH TOURISM IN FINLAND STATISTICAL TRENDS 3 Registered overnights 4 Number of
Spain. Spanish Visitors in Finland Statistical Trends and Profile
 Spain M A R K E T R E V I E W 2 0 1 5 Spanish Visitors in Finland Statistical Trends and Profile 25.10.2016 STATISTICS ON SPANISH TOURISM IN FINLAND STATISTICAL TRENDS 3 Registered overnights 4 Number
Visit Phoenix Market Update January Eric Kerr Director of Research & Business Analysis
 Visit Phoenix Market Update January 2019 Eric Kerr Director of Research & Business Analysis Visitation totals 2012-2017 & Spending trends Hotel Market Overview YTD - November Chain scales, Submarkets,
AUCKLAND DESTINATION OVERVIEW
 AUCKLAND DESTINATION OVERVIEW JULY 218 An in-depth overview of Auckland s visitor economy from the latest arrival, accommodation, spend and cruise data through to past five-year commentary. Prepared August
Maine Office of Tourism Visitor Tracking Research Fall 2016 Seasonal Topline (September November 2016) Prepared by
 Prepared by") Maine Office of Tourism Visitor Tracking Research Fall 2016 Seasonal Topline (September November 2016) Prepared by January 2017 Objectives and Methodology 2 Objectives Three distinct online surveys are
Maine Office of Tourism Visitor Tracking Research Fall 2016 Seasonal Topline (September November 2016) Prepared by January 2017 Objectives and Methodology 2 Objectives Three distinct online surveys are
Colorado Springs, CO Visitor Report
 Colorado Springs, CO 05 Visitor Report Table of Contents Introduction.. 3 Research Objectives.... 4 Methodology... 5 Key Findings 6 Size & Structure of the U.S. Travel Market.... Size & Structure of Colorado