dynamic future Hugh A. Stump III //
|
|
|
- Meghan Alexis Lang
- 5 years ago
- Views:
Transcription
1

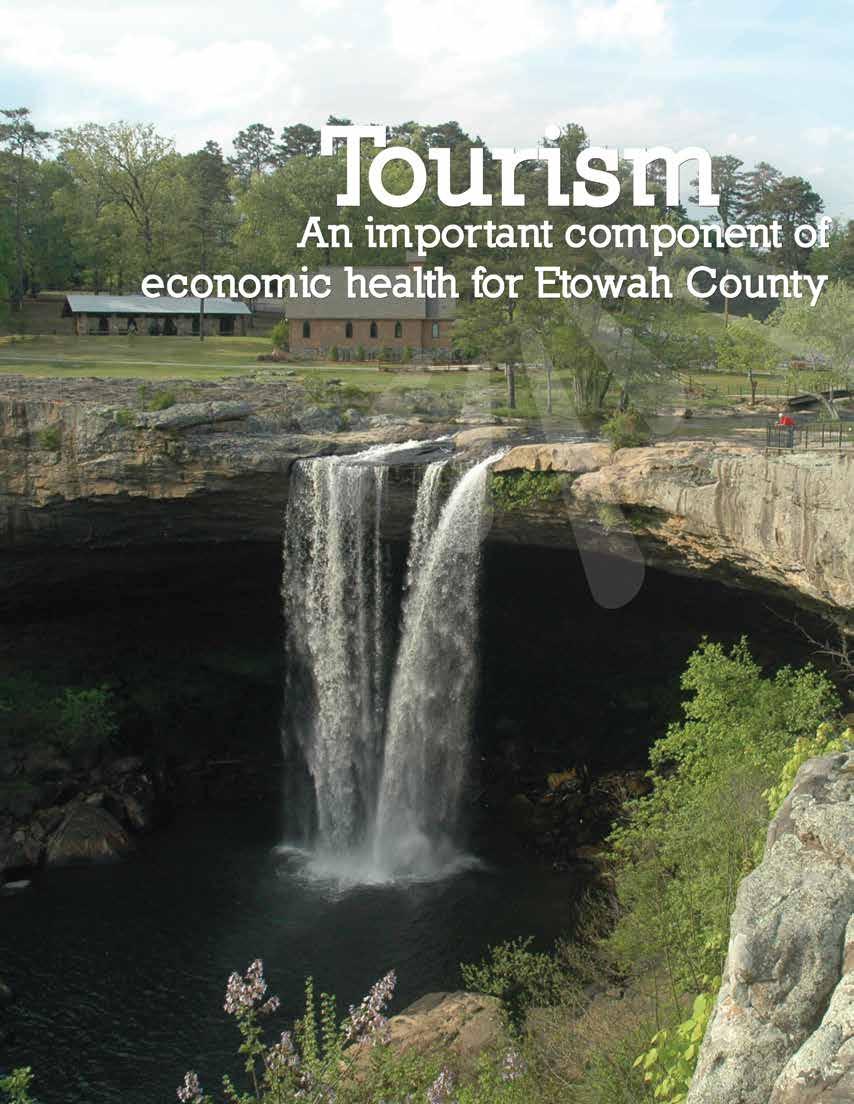
2 OPPORTUNITY dynamic future Gadsden and Etowah County, ideally-situated in northeast Alabama along the Coosa River and at the foot of Lookout Mountain, is full of outdoor fun. View majestic Noccalula Falls, ride the train, or play mini-golf at Noccalula Falls Park. Mountain bike the Black Creek Trails, fight spotted-bass on Neely Henry Lake, or go for a birdie at Twin Bridges Golf Course. Festivals like the Alabama Chocolate Festival in Rainbow City, Southside City Fest in Southside, Attalla Heritage Day in Attalla, and the First Friday celebrations in downtown Gadsden will keep you busy all year. Make sure to put the first Thursday through Sunday every August on your calendar so you won t miss the World s Longest Yard Sale! This historic sale begins at Noccalula Falls Park and travels up Scenic Lookout Mountain Parkway to Chattanooga and beyond for over 600 miles. Bargain-hunters and yard-sale junkies travel from across the U.S. to Gadsden for this funderful Sale each year! Hugh A. Stump III Hugh A. Stump III // Executive Director, Greater Gadsden Area Tourism


.")
3 ETOWAH COUNTY TOURISM Greater Gadsden Area Tourism The Etowah County Tourism Board (ECTB) was formed in 2009 to promote Etowah County and its communities for the purposes of tourism. The ECTB markets under the Greater Gadsden Area Tourism banner to benefit from the awareness appeal of the name of the county s largest city and economic center--gadsden. Our mission statement is To develop the economic prosperity of Etowah County through the promotion of tourism and by attracting and assisting visitors to our communities. Tourism Numbers Federal: 2015 > billion domestic and international traveler expenditures in the U.S. > Creating 8.0 million jobs > $141.5 billion in tax revenue from travel spending for federal, state and local governments State: 2015 > 12.6 billion dollars in tourists expenditures, up 7.7% from 2014 > Has grown 86% in 13 years > Estimated 175,652 jobs in tourism related fields in Alabama > Every $107,310 of travel-related expenditures creates one direct job in Alabama. Etowah County: 2015 > 146,853,956 million dollars in tourist expenditures in Etowah County (up 19.5%). > 1,792 direct and indirect tourism jobs in Etowah County (up 13.4%). > 44,283,662 million dollars in earnings in Etowah County (up 13.3%). statewide TRAVEL EXPENDITURES BY CATEGORY LODGING FACILITIES 13% EATING AND DRINKING ESTABLISHMENTS 27% GENERAL RETAIL 10% ENTERTAINMENT 9% PUBLIC TRANSPORTATION 15% AUTO TRANSPORTATION 26% ETOWAH COUNTY FACTS AND FIGURES: Hotels/B&B: 19 Hotels with 1,178 rooms Campgrounds, cabins and rentals: 2 Campgrounds In 2015, more than $797 million of state and local tax revenues were generated by travel and tourism activities. Without those taxes, each household in Alabama would have had to pay $424 in additional taxes to maintain current service levels. *Tourism Expenditures in north alabama topped $2.4 Billion in 2015, up 6.1% from How Tourism Dollars Support Etowah County s Economy Travelers Coming to Gadsden and Family Vacationers Business Travelers Reunions & Conventions & Athletic Teams Educational Etowah Family Gatherings Meetings Attendees Groups County Huntsville, Birmingham, Atlanta & Regional Airports Welcome Class of Charter Motorcoach, School & Church Buses How Tourists Arrive Recreational Vehicle Personal & Business Vehicles How Tourists Spend Their Dollars Attractions Museums Theater Festivals Fuel Retail Accommodations Restaurants Shopping LOCAL TAXES EMPLOYMENT INFRASTRUCTURE Greater Gadsden Area Tourism Trails and Scenic Parkways: North Alabama Birding Trail North Alabama Hallelujah Trail Lookout Mountain Parkway Alabama Antique Trail North Alabama Wine Trail North Alabama Barbecue Trail QUALITY OF LIFE LEISURE ACTIVITIES FACILITIES & HERITAGE Attractions with Estimated Annual Attendance Noccalula Falls Park 325,000 Coosa River/Coosa Landing fishing tournaments 25,000 First Fridays, average each FF 7,500 Mary G. Hardin Center for the Cultural Arts 85,000 Mountain Top Flea Market 150,000 ABOUT TOURISM


4 SPECIAL EVENTS in 2015, ETOWAH COUNTY LODGING TAXES COLLECTED INCREASED BY 19.5% ANNUAL STATE LODGING TAXES ETOWAH COUNTY 2013 $613,550 state lodging taxes 2014 $615,232 state lodging taxes 2015 $735,025 state lodging taxes Dollar Increase Over 2014: $119,793 Rate of Increase Over 2014: 19.5% LODGING TAXES ETOWAH COUNTY ANNUAL EVENTS Month Event Attendance Est. Overnight Est. ETOWAH COUNTY hosts more than A halfdozen annual events, which attract more than 100,000 total visitors. Apr. Alabama Chocolate Festival 10,000 10% Apr. Smoke on the Falls BBQ Festival 3,000 35% Jul. Southside City Fest 10,000 10% Jun. Wheels on the Hill Car Show 15,000 35% Jun. The Barbarian Challenge 1,300 25% Aug. World s Longest Yard Sale 45,000 40% Oct. Attalla Heritage Day 10,000 10% Dec. Christmas at the Falls 80,000 20%


5 BY THE NUMBERS ETOWAH COUNTY Tourist spending year growth 2013 $122,583, EVERY $104,692 OF EXPENDITURES IN Figures provided by 2014 $122,919, THE TRAVEL INDUSTRY CREATES the Alabama Tourism 2015 $146,853, ONE DIRECT JOB IN ALABAMA. FOR Department study Economic Impact, Alabama Travel Industry 2015 EVERY TWO DIRECT JOBS CREATED, THE ALABAMA ECONOMY INDIRECTLY CREATES ONE ADDITIONAL JOB. Etowah County Tourism Board Lodging Tax Revenues BY THE NUMBERS ETOWAH COUNTY STATE LODGING TAXES COLLECTED Jan Feb Mar Apr May Jun Jul Aug Sep Oct Nov Dec TOTAL , , , , , , , , , , , , $ , , , , , , , , , , , , $612, , , , , , , , , , , , , $613, , , , , , , , , , , , , $615, , , , , , , , , , , , , $735, % increase in Etowah County Tourism Board Lodging Tax Revenues since initial year in 2009

6 LODGING TAX-SEASONAL AND DESIGNATED DEMOGRAPHIC AREA ANALYSES SEASONAL ANALYSIS Quarterly lodging tax collections were used to gain insight into the seasonal travel-related activities in each county and at the state level. The results are reported in the graph shown below and in Table 16, on page 21. The graph Lodging Tax by Quarter-State, illustrates the ratio of the state s quarterly lodging tax collection to its annual lodging tax. According to the graph, the combined second and third quarter period (April through September) appears to be the strongest travel-related season, with 60.5 percent of all state lodging taxes collected during this period. This graph also indicates that the first quarter (January through March) and the fourth quarter (October through December) were the least active travel and tourism periods, with 20.0 percent and 19.6 percent, respectively, of state lodging taxes being collected for each of these periods. FIGURE 3 LODGING TAX BY QUARTER-STATE 2015 Etowah County Commission Joey Statum Lewis Fuller Larry Payne Jeff Overstreet Carolyn Parker Tim Choate Gadsden City Council Mayor, Sherman Guyton Cynthia Toles Deverick Williams Thomas Worthy Robert Echols Billy Billingsley, Sr. Johnny Cannon Ben Reed Etowah County Public Officials 2016 Etowah County Mayors City of Gadsden, Sherman Guyton City of Altoona, Richard Nash City of Attalla, Larry Means City of Glencoe, Charles Gilchrest City of Hokes Bluff, Jeff Cheatwood City of Rainbow City, Terry John Calhoun City of Reece City, Randall Scott City of Ridgeville, Jerome Anderson City of Sardis City, Terry Stephens City of Southside, Wally Burns City of Walnut Grove, Autry Works 35% 30% 30.0% 30.5% 25% 20% 20.0% 19.6% 15% 10% 5% 0% 1st Q 2nd Q 3rd Q 4th Q Table 16 represents the quarterly fluctuations for the seven counties in the state that have the highest levels of travel and tourism.

7 Address 90 Walnut St Gadsden, AL Let s work together Telephone hugh@greatergadsden.com website
January 2018 Air Traffic Activity Summary
 January 2018 Air Traffic Activity Summary Jan-2018 Jan-2017 CY-2018 CY-2017 Passengers 528,947 505,421 4.7% 528,947 505,421 4.7% Passengers 537,332 515,787 4.2% 537,332 515,787 4.2% Passengers 1,066,279
Chattanooga & Hamilton Co. Tourism Trends & Economic Outlook
 Chattanooga & Hamilton Co. Tourism Trends & Economic Outlook How Tourism Works for Chattanooga, TN January 21, 2010 Presentation by: Steve Morse, Ph.D. Director & Economist, Tourism Institute University
The Economic Impact of Travel in Kansas. Tourism Satellite Account Calendar Year 2013
 The Economic Impact of Travel in Kansas Tourism Satellite Account Calendar Year 2013 Who we are Tourism Economics Union of industry expertise and economic disciplines Real world insights based on quantitative
Number of tourism trips of residents increased namely for leisure
 Tourism Demand of Residents 1 st Quarter 2018 25 July 2018 Number of tourism trips of residents increased namely for leisure In the 1 st quarter 2018, residents in Portugal took a total of 4.5 million
Loudon County, TN. Hotel, Restaurant, and Travel Industries: Economic Profile and Business Trends, Loudon County (Loudon and Lenoir City areas)
") Loudon County, TN Loudon County (Loudon and Lenoir City areas) Hotel, Restaurant, and Travel Industries: Economic Profile and Business Trends, Steve Morse, Ph.D. Director & Economist Tourism Institute
Loudon County, TN Loudon County (Loudon and Lenoir City areas) Hotel, Restaurant, and Travel Industries: Economic Profile and Business Trends, Steve Morse, Ph.D. Director & Economist Tourism Institute
Maury County, TN. Hotel, Restaurant, and Travel Industries: Economic Profile and Business Trends, Maury County (Columbia and Spring Hill area)
") Maury County, TN Maury County (Columbia and Spring Hill area) Hotel, Restaurant, and Travel Industries: Economic Profile and Business Trends, 06 Steve Morse, Ph.D. Director & Economist Tourism Institute
Maury County, TN Maury County (Columbia and Spring Hill area) Hotel, Restaurant, and Travel Industries: Economic Profile and Business Trends, 06 Steve Morse, Ph.D. Director & Economist Tourism Institute
Cheatham County, TN. Hotel, Restaurant, and Travel Industries: Economic Profile and Business Trends, 2006
 Cheatham County, TN Cheatham County (Kingston Springs & Ashland City areas) Hotel, Restaurant, and Travel Industries: Economic Profile and Business Trends, Steve Morse, Ph.D. Director & Economist Tourism
Tourism Statistics
 Tourism Statistics 2006-2010 TABLE OF CONTENTS FOREWORD 4 DEFINITIONS 5 STATISTICAL SUMMARY FOR 2010 6 INTERNATIONAL TOURIST ARRIVALS 7 International Tourist Arrivals: 1994-2010 7 International Tourist
2014 NOVEMBER ECONOMIC IMPACTS AND VISITOR PROFILE. Prepared By:
 2014 NOVEMBER ECONOMIC IMPACTS AND VISITOR PROFILE Prepared By: Sisters Folk Festival Economic Impacts and Visitor Profile September 5-7, 2014 November 2014 Prepared for Sisters Folk Festival, Inc. Sisters,
Tourism activity supports 60,007 full-time equivalent jobs locally
 Marketing Lancashire STEAM Tourism Economic Impacts 2017 Year in Review The Visitor Economy of Lancashire This is a summary of the annual tourism economic impact research undertaken for Marketing Lancashire
Tourism in South Africa A statistical overview
 Tourism in South Africa A statistical overview Purpose of presentation Purpose of the presentation is to present different tourism statistics produced by Stats SA People like to travel we are a country
DTTAS Quarterly Aviation Statistics Snapshot Quarter Report
 Contents DTTAS Quarterly Aviation Statistics Snapshot Quarter 4 2015 Report 1.1 Dublin Airport Key Statistics... 1 1.2 Cork Airport Key Statistics... 3 1.3 Shannon Airport Key Statistics... 5 1.4 Total
OVERVIEW. Currently South Australia contributes $6.3 billion to the Australian tourism economy.
 OVERVIEW Currently contributes $6.3 billion to the Australian tourism economy. has achieved 79 per cent of its $8.0 billion maximum potential by 2020. $6.3b $6.5b $8b 2016 2017 2020 Annual Visitor Summary
TOURISM PERFORMANCE 2017
 4 th QUARTER TOURISM PERFORMANCE 2017 TOTAL STAYOVER ARRIVALS 105,658 TOTAL CRUISE ARRIVALS 224,212 TOTAL VISITOR NIGHTS AVERAGE HOTEL OCCUPANCY 935,402 71.7% ECONOMIC IMPACT $142.6 million HOW WAS OUR
DTTAS Quarterly Aviation Statistics Snapshot Quarter Report
 Contents DTTAS Quarterly Aviation Statistics Snapshot Quarter 3 2018 Report 1.1 Dublin Airport Key Statistics... 1 1.2 Cork Airport Key Statistics... 3 1.3 Shannon Airport Key Statistics... 5 1.4 Total
DTTAS Quarterly Aviation Statistics Snapshot Quarter Report
 Contents DTTAS Quarterly Aviation Statistics Snapshot Quarter 1 2018 Report 1.1 Dublin Airport Key Statistics... 1 1.2 Cork Airport Key Statistics... 3 1.3 Shannon Airport Key Statistics... 5 1.4 Total
The Travel and Tourism Industry in Vermont. A Benchmark Study of the Economic Impact of Visitor Expenditures on the Vermont Economy 2005
 The Travel and Tourism Industry in Vermont A Benchmark Study of the Economic Impact of Visitor Expenditures on the Vermont Economy 2005 INTRODUCTION GENERAL November, 2006 This 2005 update of the original
Temecula Valley Travel Impacts
 Temecula Valley Travel Impacts 2000-2013p photo courtesy of Temecula Valley Convention and Visitors Bureau June 2014 Prepared for the Temecula Valley Convention and Visitors Bureau Temecula, California
Panama City Beach CVB Travel Market Visitor Profile & Economic Impact Report
 Panama City Beach CVB 2017 Travel Market Visitor Profile & Economic Impact Report Presented by: Berkeley Young, President Young Strategies, Inc. Prepared by: Larry D. Gustke, PhD Steve Morse, PhD Prepared
MARKET INSIGHTS UPDATE North America
 SPOTLIGHT ON: THE SHOULDER TRAVEL SEASON PG2 A monthly update including relevant information on travel industry trends, consumer and meetings market research, competitive intelligence, and Hawai i s performance
The Economic Impact of Tourism in: Dane County & Madison, Wisconsin. April 2017
 The Economic Impact of Tourism in: Dane County & Madison, Wisconsin April 2017 Key themes for 2016 Visitor spending continued growing in Dane County, Wisconsin in 2016, growing 5.2% to surpass $1.2 billion.
AUCKLAND DESTINATION OVERVIEW
 AUCKLAND DESTINATION OVERVIEW October 218 An in-depth overview of Auckland s visitor economy from the latest arrival, accommodation, spend, cruise and event data through to past five- commentary. Prepared
1. Hotel Trends Occupancy Rate
 Summer 2004 The Louisiana Travel Pulse is a seasonal industry travel barometer designed to present recent trends in travel industry performance. This issue s emphasis is on the Summer 2004 season (June
2018 MEETING and EVENTS CALENDAR 2018 Version 6 DATE DAY TIME MEETING VENUE. 1st Monday NEW YEAR'S DAY HOLIDAY STATEWIDE
 MASTER BUILDERS ASSOCIATION OF TASMANIA INC. 2018 MEETING and EVENTS CALENDAR 2018 Version 6 DATE DAY TIME MEETING VENUE Jan-18 1st Monday NEW YEAR'S DAY HOLIDAY STATEWIDE 26th AUSTRALIA DAY - Holiday
1. Hotel Trends Occupancy Rate
 Introduction The Louisiana Travel Pulse is a seasonal industry travel barometer designed to present recent trends in travel industry performance. This issue s emphasis is on the Spring 2002 season (March-May).
Naples, Marco Island, Everglades Convention and Visitors Bureau April 2013 Visitor Profile
 RESEARCH DATA SERVICES, INC. 777 SOUTH HARBOUR ISLAND BOULEVARD SUITE 260 TAMPA, FLORIDA 33602 TEL (813) 254-2975 FAX (813) 223-2986 Naples, Marco Island, Everglades Convention and Visitors Bureau April
Tourism Statistics RTO 1
 Tourism Statistics RTO 1 Tourism Research Unit Spring 2012 1 1 Ontario Tourism 2 2 Ontario Tourism Indicators 2011* Visits increased by 1.3% to 104.4 million. Visits from Ontario and overseas countries
Measures & Projections October 31, GoToBermuda.com
 Measures & Projections October 31, 2015 GoToBermuda.com October Total Vacation Visitor Arrivals Vacation Arrivals Oct-14 Oct-15 2015 Air Vacation 9,203 10,344 1,141 12.40 126,842 127,044 202 0.16 Cruise
Asheville Metro Economic Report 2014 Second Quarter
 Asheville Metro Economic Report Johnson Price Sprinkle PA HIGHLIGHTS: ASHEVILLE METRO The Asheville metro area gained 2,400 more jobs than one year earlier, averaging a growth rate of 1.4 percent, continuing
AUCKLAND DESTINATION OVERVIEW
 AUCKLAND DESTINATION OVERVIEW AUGUST 218 An in-depth overview of Auckland s visitor economy from the latest arrival, accommodation, spend and cruise data through to past five- commentary. Prepared September
Note: These Louisiana indicators show the percentage difference from Second Quarter 2004 to Second Quarter 2005.
 Second Quarter 2005 The Louisiana Travel Pulse is a quarterly industry travel barometer designed to present recent trends in travel industry performance. This issue s emphasis is on the Second Quarter
Colorado Travel Impacts p
 Colorado Travel Impacts 1996-2016p Image Credit: Matt Inden/Miles June 2017 Prepared for the Colorado Tourism Office Denver, Colorado THE ECONOMIC IMPACT OF TRAVEL ON COLORADO 1996-2016P June 2017 prepared
Yukon Tourism Indicators Year-End Report Yukon Tourism Indicators Year-End Report 2015
 Yukon Tourism Indicators Overview The Yukon Tourism Indicators is published by the Department of Tourism and Culture as a companion to the monthly Yukon Tourism Visitation Report. This document is intended
Prepared for Travel Oregon by Kathi Jaworski, Write to Know consulting
 1 2 3 4 5 o 6 7 8 9 Coos County Employment by Industry, 2006-2015 Top Categories of Employment (500+ Jobs) 5,000 4,500 4,000 3,500 3,000 2,500 2,000 1,500 1,000 500 2006 2010 2015 Source: Oregon Employment
Produced by: Destination Research Sergi Jarques, Director
 Produced by: Destination Research Sergi Jarques, Director Economic Impact of Tourism Oxfordshire - 2016 Economic Impact of Tourism Headline Figures Oxfordshire - 2016 number of trips (day & staying) 27,592,106
AUCKLAND DESTINATION OVERVIEW
 AUCKLAND DESTINATION OVERVIEW JUNE 218 An in-depth overview of Auckland s visitor economy from the latest arrival, accommodation, spend and cruise data through to past five-year commentary. Prepared July
Produced by: Destination Research Sergi Jarques, Director
 Produced by: Destination Research Sergi Jarques, Director Economic Impact of Tourism North Norfolk District - 2016 Contents Page Summary Results 2 Contextual analysis 4 Volume of Tourism 7 Staying Visitors
Produced by: Destination Research Sergi Jarques, Director
 Produced by: Destination Research Sergi Jarques, Director Economic Impact of Tourism Norfolk - 2016 Contents Page Summary Results 2 Contextual analysis 4 Volume of Tourism 7 Staying Visitors - Accommodation
Panama City Beach Travel Market Economic Impact Report. Prepared for: Panama City Beach Convention & Visitors Bureau
 Panama City Beach 2016 Travel Market Economic Impact Report Presented by: Berkeley Young, President Young Strategies, Inc. Data Analysis: Larry D. Gustke, PhD Steve Morse, PhD Prepared for: Panama City
ECONOMIC PROFILE. Tourism
 ECONOMIC PROFILE Tourism Park City & Summit County Utah Prepared by Park City Chamber of Commerce Convention & Visitors Bureau P.O. Box 1630 ~ Park City, UT 84060-1630 800.453.1360 ~ 435.649.6100 ~ fax
Coast to coast. STR Coastal Town Review Coastal Towns Market Review Report_JE.indd 3
 Coast to coast. STR Coastal Town Review 16 Coastal Towns Market Review Report_JE.indd 3 4//17 8:31:38 AM Table of Contents Introduction...3 United Kingdom...4 Blackpool...6 Bournemouth...8 Brighton...
Tourism in Alberta. A Summary Of Visitor Numbers, Revenue & Characteristics 2004
 Tourism in Alberta A Summary Of Visitor Numbers, Revenue & Characteristics 2004 Alberta North Based on the 2004 Canadian & International Travel Surveys (Statistics Canada) Canadian Rockies Edmonton & Area
Tourism Statistics Region 1
 Tourism Statistics Region 1 Tourism Research Unit Winter 2011 1 Summary In 2008, there were 101.0 million visits in and visitors spent $17.6 billion residents account for the majority of visits and spending
AUCKLAND DESTINATION OVERVIEW
 AUCKLAND DESTINATION OVERVIEW September 218 An in-depth overview of Auckland s visitor economy from the latest arrival, accommodation, spend, cruise and event data through to past five- commentary. Prepared
Temecula Valley Travel Impacts p
 Temecula Valley Travel Impacts 2000-2017p photo courtesy of Temecula Valley Convention and Visitors Bureau May 2018 Prepared for the Temecula Valley Convention and Visitors Bureau Temecula, California
AUCKLAND DESTINATION OVERVIEW
 AUCKLAND DESTINATION OVERVIEW JULY 218 An in-depth overview of Auckland s visitor economy from the latest arrival, accommodation, spend and cruise data through to past five-year commentary. Prepared August
Visit Phoenix Market Update January Eric Kerr Director of Research & Business Analysis
 Visit Phoenix Market Update January 2019 Eric Kerr Director of Research & Business Analysis Visitation totals 2012-2017 & Spending trends Hotel Market Overview YTD - November Chain scales, Submarkets,
West Somerset 2015 Local data version
 West Somerset 2015 Local data version Introduction This report examines the volume and value of tourism and the impact of visitor expenditure on the local economy in West Somerset and Somerset county in
Evaluating Lodging Opportunities
 Evaluating Lodging Opportunities This section explores market opportunities for new lodging accommodations in the downtown area. It will help you understand travel and visitation trends, existing competition,
Produced by: Destination Research Sergi Jarques, Director
 Produced by: Destination Research Sergi Jarques, Director Economic Impact of Tourism Norfolk - 2017 Contents Page Summary Results 2 Contextual analysis 4 Volume of Tourism 7 Staying Visitors - Accommodation
Securing Tourism s Place at the Local Economic Development Table. Steve Morse, Ph.D. Director & Economist Tourism Institute Sept.
 Securing Tourism s Place at the Local Economic Development Table Steve Morse, Ph.D. Director & Economist Tourism Institute Sept. 20, 2007 1 First, Welcome to Tourism professionals from Tennessee Faculty
The Economic Impact of Poole s Visitor Economy 2015
 The Economic Impact of Poole s Visitor Economy 2015 Produced By The South West Research Company Ltd October 2016 Contents Page Introduction 3 Poole data 4 Dorset data 17 Introduction This report examines
2015 Business Survey Report Erie to Pittsburgh Trail March 2015
 2015 Business Survey Report Erie to Pittsburgh Trail March 2015 Table of Contents Executive Summary 2 2013 EPT Trail User Survey and Impact Analysis 3 Overview 3 Results 3 2014 2015 Erie to Pittsburgh
Produced by: Destination Research Sergi Jarques, Director
 Produced by: Destination Research Sergi Jarques, Director Economic Impact of Tourism Oxfordshire - 2015 Economic Impact of Tourism Headline Figures Oxfordshire - 2015 Total number of trips (day & staying)
Region 2: Tourism Partnership of Niagara. Visitor Statistics Visitor Spending Statistics Hotel Statistics Tourism Related Establishments
 Region 2: Tourism Partnership of Niagara Visitor Statistics Visitor Spending Statistics Hotel Statistics Tourism Related Establishments http://www.mtc.gov.on.ca/en/research/rtp/rtp.shtml tourism.research@ontario.ca
2014 STATEWIDE COMPREHENSIVE OUTDOOR RECREATION PLAN
 2014 STATEWIDE COMPREHENSIVE OUTDOOR RECREATION PLAN SUSTAINING COLORADO S OUTDOOR RECREATION FUTURE SECTION 1: INTRODUCTORY INFORMATION WHAT IS THE SCORP? The SCORP update is required every five years
Air transport creates large returns for national economies but returns for airlines are unsustainably weak
 Air transport creates large returns for national economies but returns for airlines are unsustainably weak Thomas S. Windmuller SVP and Corporate Secretary Theme air transport brings large economic benefits
Tourism in Alberta. A Summary Of Visitor Numbers, Revenue & Characteristics Research Resolutions & Consulting Ltd.
 Tourism in Alberta A Summary Of Visitor Numbers, Revenue & Characteristics 2001 Alberta North Canadian Rockies Edmonton & Area Alberta Central Calgary & Area Policy & Economic Analysis Alberta South March
Tourism Statistics RTO 11
 Tourism Statistics RTO 11 Tourism Research Unit Spring 2012 1 1 Tourism 2 2 Tourism Indicators 2011* Visits increased by 1.3% to 104.4 million. Visits from and overseas countries increased, while visits
Florida s Paradise Coast. Leading the Way to Prosperity
 Florida s Paradise Coast Leading the Way to Prosperity Ten Years in Review Measure 2003 2013 Average Daily Rate $130.32 $166.10 Overnight Visitors 1,312,987 1,573,000 Direct Expenditures $581.5 M $962.5
Visit Wales Research Update
 Visit Wales Research Update 19 January 21 This update summarises tourism performance by drawing upon Visit Wales own research and information from other relevant sources. It is based upon information available
The Economic Impact of Gloucestershire s Visitor Economy Forest of Dean district
 The Economic Impact of Gloucestershire s Visitor Economy 201 Forest of Dean district Produced on behalf of the Wye Valley and Forest of Dean Tourism Association By The South West Research Company Ltd January
The Economic Impact of Gloucestershire s Visitor Economy Forest of Dean district
 The Economic Impact of Gloucestershire s Visitor Economy 2014 Forest of Dean district Produced on behalf of the Wye Valley and Forest of Dean Tourism Association By The South West Research Company Ltd
The contribution of Tourism to the Greek economy in 2017
 The contribution of Tourism to the Greek economy in 2017 1 st edition (provisional data) May 2018 Dr. Aris Ikkos, ISHC Research Director Serafim Koutsos Analyst INSETE Republishing is permitted provided
2017/ Q1 Performance Measures Report
 2017/2018 - Q1 Performance Measures Report Contents Ridership & Revenue... 1 Historical Revenue & Ridership... 1 Revenue Actual vs. Planned... 3 Mean Distance Between Failures... 5 Maintenance Cost Quarter
AirportInfo. Economic Indicators & Traffic
 AirportInfo Economic Indicators & Traffic March 2012 U.S. & Canadian GDP Economic Focus 6% 4% US Canada 2% 0% -2% -4% -6% -8% -10% GDP growth improved slightly for both the U.S. and Canada in the third
1. Hotel Trends Occupancy Rate
 Fall 2003 The Louisiana Travel Pulse is a seasonal industry travel barometer designed to present recent trends in travel industry performance. This issue s emphasis is on the Fall 2003 season (SeptemberNovember
First Quarter 2014 Visitor Profile (January March) Amelia Island Tourist Development Council
 Amelia Island Tourist Development Council") RESEARCH DATA SERVICES, INC. 777 SOUTH HARBOUR ISLAND BOULEVARD SUITE 260 TAMPA, FLORIDA 33602 TEL (813) 254-2975 FAX (813) 223-2986 First Quarter 2014 Visitor Profile (January March) Amelia Island Tourist
RESEARCH DATA SERVICES, INC. 777 SOUTH HARBOUR ISLAND BOULEVARD SUITE 260 TAMPA, FLORIDA 33602 TEL (813) 254-2975 FAX (813) 223-2986 First Quarter 2014 Visitor Profile (January March) Amelia Island Tourist
Yukon Tourism Indicators Year-End Report 2013
 Yukon Tourism Indicators Yukon Tourism Indicators Overview This document is intended to provide a snapshot of tourism indicators for Yukon for 2013 (January to December). Contents 2013 Tourism Review 3
Tim Hunter Chief Executive. CCT Business Partner Update 3 March 2015
 Tim Hunter Chief Executive CCT Business Partner Update 3 March 2015 A Great Summer Strong international arrival growth More flights and more beds Great weather = more visitors doing more Jan-10 Feb-10
MONTEREY COUNTY TRAVEL IMPACTS P
 MONTEREY COUNTY TRAVEL IMPACTS 1992-2015P April 2016 Prepared for the Monterey County Convention and Visitors Bureau MONTEREY COUNTY TRAVEL IMPACTS, 1992-2015P Prepared for the Monterey County Convention
December 2012 Passenger and Cargo Traffic Statistics Reno-Tahoe International Airport
 December 2012 Passenger and Cargo Traffic Statistics Reno-Tahoe International Airport January 29, 2013 U.S. DOMESTIC INDUSTRY OVERVIEW FOR DECEMBER 2012 All RNO Carriers Systemwide year over year comparison
2018 MEETING and EVENTS CALENDAR 2018 Version 4 DATE DAY TIME MEETING VENUE. 1st Monday NEW YEAR'S DAY HOLIDAY STATEWIDE
 MASTER BUILDERS ASSOCIATION OF TASMANIA INC. 2018 MEETING and EVENTS CALENDAR 2018 Version 4 DATE DAY TIME MEETING VENUE Jan-18 1st Monday NEW YEAR'S DAY HOLIDAY STATEWIDE 26th AUSTRALIA DAY - Holiday
Atlantic City Tourism Performance Indicators (AC-TPI) nd Quarter
 nd Quarter") Atlantic City Tourism Performance Indicators (AC-TPI) 20 2nd Quarter Prepared by Brian J. Tyrrell, Ph.D. Supported by Rummy Pandit, M.B.A., L.P.D., C.H.A. Executive Director Atlantic City Tourism Performance
Atlantic City Tourism Performance Indicators (AC-TPI) 20 2nd Quarter Prepared by Brian J. Tyrrell, Ph.D. Supported by Rummy Pandit, M.B.A., L.P.D., C.H.A. Executive Director Atlantic City Tourism Performance
PEI Tourism Performance
 PEI Tourism Performance Brian Dunn Manager - Evaluation, Measurements & Business Intelligence Department of Economic Development and Tourism November 25, 2016 Presentation Outline 1. Global Performance
Produced by: Destination Research Sergi Jarques, Director
 Produced by: Destination Research Sergi Jarques, Director Economic Impact of Tourism Epping Forest - 2014 Economic Impact of Tourism Headline Figures Epping Forest - 2014 Total number of trips (day & staying)
Tourism Statistics Parry Sound District
 Tourism Statistics Parry Sound District Tourism Research Unit Spring 2014 Note: due to changes in Statistics Canada s survey methodology, 2011 domestic data is not comparable to prior years 2 Ontario Tourism
Atlantic City Tourism Performance Indicators (AC-TPI) 2014 Year End
 2014 Year End") Atlantic City Tourism Performance Indicators (AC-TPI) 2014 Year End Prepared by Brian J. Tyrrell, Ph.D. Supported by Israel Posner, Ph.D. Executive Director Atlantic City Tourism Performance Indicators
Atlantic City Tourism Performance Indicators (AC-TPI) 2014 Year End Prepared by Brian J. Tyrrell, Ph.D. Supported by Israel Posner, Ph.D. Executive Director Atlantic City Tourism Performance Indicators
Driving Ridership Strategic Partnerships
 Driving Ridership Strategic Partnerships Feb 29, 2012 Presented by Priya Bhasin-Singh, Strategic Marketing Associate priya.bhasin-singh@edmonton.ca 2012 APTA Marketing & Communications Conference About
Quarterly Bulletin of Statistics
 Q2 QUARTERLY BULLETIN OF STATISTICS 2nd Quarter GOVERNMENT OF BERMUDA Cabinet Office Department of Statistics Quarterly Bulletin of Statistics Q2 Highlights Air Arrivals: Bermuda hosted 75,013 tourists.
NAPA VALLEY VISITOR INDUSTRY 2016 Economic Impact Report
 NAPA VALLEY VISITOR INDUSTRY 2016 Economic Impact Report Research prepared for Visit Napa Valley by Destination Analysts, Inc. Table of Contents S E C T I O N 1 Introduction 2 S E C T I O N 2 Executive
Hard Labor Creek State Park Business Plan. Table of Contents
 Hard Labor Creek State Park Business Plan Table of Contents Georgia State Parks and Historic Sites Executive Summary Site Name Site Manager Region Manager Hard Labor Creek State Park Daniel Schay Eric
Airline industry outlook remains fragile
 Airline industry outlook remains fragile June 2009 www.iata.org/economics To represent, lead and serve the airline industry Airline industry outlook remains fragile Green shoots starting to appear Recovery
Assessment Findings & Suggestions. Southwest Alberta Regional Suggestions. June 2007
 Assessment Findings & Suggestions Southwest Alberta Regional Suggestions June 2007 The anchor The Southern Alberta Rockies Waterton Lakes National Park Marketing: The Southern Alberta Rockies The body
DOWNTOWN, CHARLOTTE AMALIE
 TOTAL VISITOR ARRIVALS TO THE USVI : DECEMBER YEAR TO DATE DECEMBER TOTAL VISITOR ARRIVALS 2,85, 2,8, 2,814,257 2,75, 2,7, 2,65, 2,6, 2,642,118 2,71,542 2,648,5 2,55, 212 213 214 215 Visitor arrivals ended
The Economic Impact of Tourism in Maryland. Tourism Satellite Account Calendar Year 2015
 The Economic Impact of Tourism in Maryland Tourism Satellite Account Calendar Year 2015 MD tourism economy reaches new peaks The Maryland visitor economy continued to grow in 2015; tourism industry sales
Fourth Quarter 2013 Visitor Profile (October December) Amelia Island Tourist Development Council
 Amelia Island Tourist Development Council") RESEARCH DATA SERVICES, INC. 777 SOUTH HARBOUR ISLAND BOULEVARD SUITE 260 TAMPA, FLORIDA 33602 TEL (813) 254-2975 FAX (813) 223-2986 Fourth Quarter 2013 Visitor Profile (October December) Amelia Island
RESEARCH DATA SERVICES, INC. 777 SOUTH HARBOUR ISLAND BOULEVARD SUITE 260 TAMPA, FLORIDA 33602 TEL (813) 254-2975 FAX (813) 223-2986 Fourth Quarter 2013 Visitor Profile (October December) Amelia Island
Belgium. Belgian Visitors in Finland Statistical Trends and Profile
 Belgium M A R K E T R E V I E W 2 0 1 5 Belgian Visitors in Finland Statistical Trends and Profile 24.10.2016 STATISTICS ON BELGIAN TOURISM IN FINLAND STATISTICAL TRENDS 3 Registered overnights 4 Number
Naples, Marco Island, Everglades Convention and Visitors Bureau April 2014 Visitor Profile
 RESEARCH DATA SERVICES, INC. 777 SOUTH HARBOUR ISLAND BOULEVARD SUITE 260 TAMPA, FLORIDA 33602 TEL (813) 254-2975 FAX (813) 223-2986 Naples, Marco Island, Everglades Convention and Visitors Bureau April
Oregon Travel Impacts p
 Oregon Travel Impacts 1992-2016p May 2017 Prepared for Oregon Tourism Commission Salem, Oregon OREGON TRAVEL IMPACTS, 1992-2016P STATEWIDE PRELIMINARY ESTIMATES DETAILED COUNTY ESTIMATES OVERNIGHT VISITOR
Third Quarter 2015 Visitor Profile (July-September) Amelia Island Tourist Development Council
 Amelia Island Tourist Development Council") RESEARCH DATA SERVICES, INC. 777 SOUTH HARBOUR ISLAND BOULEVARD SUITE 26 TAMPA, FLORIDA 3362 TEL (813) 254-2975 FAX (813) 223-2986 Third Quarter 215 Visitor Profile (July-September) Amelia Island Tourist
RESEARCH DATA SERVICES, INC. 777 SOUTH HARBOUR ISLAND BOULEVARD SUITE 26 TAMPA, FLORIDA 3362 TEL (813) 254-2975 FAX (813) 223-2986 Third Quarter 215 Visitor Profile (July-September) Amelia Island Tourist
September 2016 Visitor Profile
 RESEARCH DATA SERVICES, INC. 777 SOUTH HARBOUR ISLAND BOULEVARD SUITE 26 TAMPA, FLORIDA 3362 TEL (813) 254-2975 FAX (813) 223-2986 Visit St. Petersburg/Clearwater September 216 Visitor Profile Prepared
Second Quarter 2015 Visitor Profile (April-June) Amelia Island Tourist Development Council
 Amelia Island Tourist Development Council") RESEARCH DATA SERVICES, INC. 777 SOUTH HARBOUR ISLAND BOULEVARD SUITE 26 TAMPA, FLORIDA 3362 TEL (813) 254-2975 FAX (813) 223-2986 Second Quarter 215 Visitor Profile (April-June) Amelia Island Tourist
RESEARCH DATA SERVICES, INC. 777 SOUTH HARBOUR ISLAND BOULEVARD SUITE 26 TAMPA, FLORIDA 3362 TEL (813) 254-2975 FAX (813) 223-2986 Second Quarter 215 Visitor Profile (April-June) Amelia Island Tourist
Destination Performance 2012
 Destination Performance 2012 Sample Council City 2 Prepared by: TSE Research www.tourismsoutheast.com Contextual Information Welcome to the Destination Intelligence report for British Destinations members.
The Economic Impact of Tourism in Hillsborough County. July 2017
 The Economic Impact of Tourism in Hillsborough County July 2017 Table of contents 1) Key Findings for 2016 3 2) Local Tourism Trends 7 3) Trends in Visits and Spending 12 4) The Domestic Market 19 5) The
Domestic Visitation to the Northern Territory
 \ YEAR ENDING SEPTEMBER Domestic Visitation to the Northern Territory 20 Year ending September 20 YEAR ENDING SEPTEMBER 20 DOMESTIC OVERNIGHT VISITORS IN THE NORTHERN TERRITORY VISITORS 1.55 MILLION NIGHTS
Commissioned by: Economic Impact of Tourism. Stevenage Results. Produced by: Destination Research
 Commissioned by: Produced by: Destination Research www.destinationresearch.co.uk December 2016 Contents Page Introduction and Contextual Analysis 3 Headline Figures 5 Volume of Tourism 7 Staying Visitors
Economic Impact of Tourism. Hertfordshire Results. Commissioned by: Visit Herts. Produced by:
 Commissioned by: Visit Herts Produced by: Destination Research www.destinationresearch.co.uk December 2016 Contents Page Introduction and Contextual Analysis 3 Headline Figures 5 Volume of Tourism 7 Staying
France. French Visitors in Finland Statistical Trends and Profile
 France M A R K E T R E V I E W 2 0 1 5 French Visitors in Finland Statistical Trends and Profile 14.10.2016 STATISTICS ON FRENCH TOURISM IN FINLAND STATISTICAL TRENDS 3 Registered overnights 4 Number of
Norway MARKET REVIEW Norwegian Visitors in Finland Statistical Trends and Profile
 Norway MARKET REVIEW 2015 Norwegian Visitors in Finland Statistical Trends and Profile 24.11.2016 STATISTICS ON NORWEGIAN TOURISM IN FINLAND STATISTICAL TRENDS 3 Registered overnights 4 Number of visitors