Transport Services Public Transport Patronage Performance 12 months to March 2018
|
|
|
- Merry Eaton
- 5 years ago
- Views:
Transcription

1 Addendum to Item 10 Business Report April 2018 Transport Services Public Transport Patronage Performance 12 months to March 2018
2 Ref:- AT Monthly Indicators Report 1.3 AT Metro patronage breakdown. For the 12 months to March 2018 Auckland public transport patronage totalled 91.8 million passenger boardings, an increase of +5.5% on the previous year. March monthly patronage was 9.5 million, an increase of +1.6% on March 2017 and +4.2% above SOI target (YTD +0.4%). March normalised adjustment ~ +6.9% accounting for special event patronage, with two less business days and two more weekend day/public holiday. Bus services totalled 65.4 million passenger boardings for the 12-months to March 2018, an increase +5.8% on the previous year. Patronage for March 2018 was 6.8 million, an increase of 2.4% on March 2017 and +7.8% above target (YTD +2.3%). March normalised adjustment ~ +7.8% accounting for special event patronage, with two less business days and two more weekend day/public holiday. Train services totalled 20.2 million passenger boardings for the 12-months to March 2018, an increase of +6.3% on the previous year. Patronage for March 2018 was 2.0 million, a decrease of -4.9% on March 2017 and -4.5% below SOI target (YTD -3.1%). March normalised adjustment ~+0.5% accounting for special event patronage, with two less business days and two more weekend day/public holiday. Ferry services totalled 6.2 million passenger boardings for the 12-months to March 2018, an increase of +0.7% on the previous year. Patronage for March 2018 was 0.68 million, an increase of +15.8% on March 2017 and -1.5% below target (YTD -6.3%). March normalised adjustment ~+18.7% accounting for special event patronage, with two less business days and two more weekend day/public holiday. Rapid and Frequent services totalled 39.0 million passenger boardings for the 12-months to March 2018, an increase of +12.5% on the previous year. Patronage for March 2018 was 4.3 million, an increase of +12.3% on March 2017 and +4.9% above SOI target (YTD +6.9%).
. For the 12-month to March 2018, total of 75.2 million journeys, 85.3 million trips on HOP a difference of 11.8% and 13.5 million transfers (17.")
3 Growth in New Network rollout for South Auckland Bus and Train In the South New Network Area for March 2018, there were 809,662 journeys, 985,724 passenger trips a difference of 22% and 208,229 transfers (26% of journeys). For the 12-month to March 2018, total of 75.2 million journeys, 85.3 million trips on HOP a difference of 11.8% and 13.5 million transfers (17.9% of journeys).
 the increase was +564,661 (+7%). Transfers have increased by +46,862 (+30%), Network wide +282,829 (+25%).")
4 Normalised year on year growth in the South New Network Area for March 2018: Passenger trips have increased by +83,627 (+9%). Network wide (excluding SkyBus) the increase was +564,661 (+7%). Transfers have increased by +46,862 (+30%), Network wide +282,829 (+25%). Passenger trips less transfers have increased by +26,765 (+5%).

5 Normalised year on year growth in the South Network Area for March 2018 by suburb: All reported suburbs saw positive growth in passenger trips with the exception of Manurewa and Papatoetoe.
6 Growth in New Network rollout for West Auckland Bus and Train In the West New Network Area for March 2018, there were 818,305 journeys, 918,000 passenger trips a difference of 12% and 154,737 transfers (19% of journeys). For the 12-month to March 2018, total of 75.2 million journeys, 85.3 million trips on HOP a difference of 11.8% and 13.5 million transfers (17.9% of journeys).
 the increase was + 564,661 (+7%). Transfers have increased by + 58,318 (+62%), Network wide + 282,829 (+25%).")
7 Normalised year on year growth in the West New Network Area for March 2018: Passenger trips have increased by + 129,385 (+17%). Network wide (excluding SkyBus) the increase was + 564,661 (+7%). Transfers have increased by + 58,318 (+62%), Network wide + 282,829 (+25%). Passenger trips less transfers have increased by + 71,067 (+10%).

8 Normalised year on year growth in the West Network Area for March 2018 by suburb: All reported suburbs saw positive growth in passenger trips.
. For the 12-months to March 2018, total of 75.1 million journeys, 85.3 million trips on HOP a difference of 11.9% and 13.4 million transfers (17.")
9 Growth in New Network rollout for East Auckland Bus and Train In the East New Network Area for March 2018, there were 312,411 journeys, 349,747 passenger trips a difference of 12% and 56,263 transfers (18% of journeys). For the 12-months to March 2018, total of 75.1 million journeys, 85.3 million trips on HOP a difference of 11.9% and 13.4 million transfers (17.8% of journeys).
 the increase was + 564,661 (+7%). Transfers have increased by +29,949 (+95%). Network wide + 282,829 (+25%).")
10 Normalised year on year growth in the East New Network area for March 2018: Passenger trips have increased by +51,971 (+18%). Network wide (excluding SkyBus) the increase was + 564,661 (+7%). Transfers have increased by +29,949 (+95%). Network wide + 282,829 (+25%). Passenger trips less transfers have increased by +25,022 (+9%).
11 Normalised year on year growth in the East Network area for March 2018 by suburb: Total for all suburbs saw positive growth with the exception of Cockle Bay & Howick.
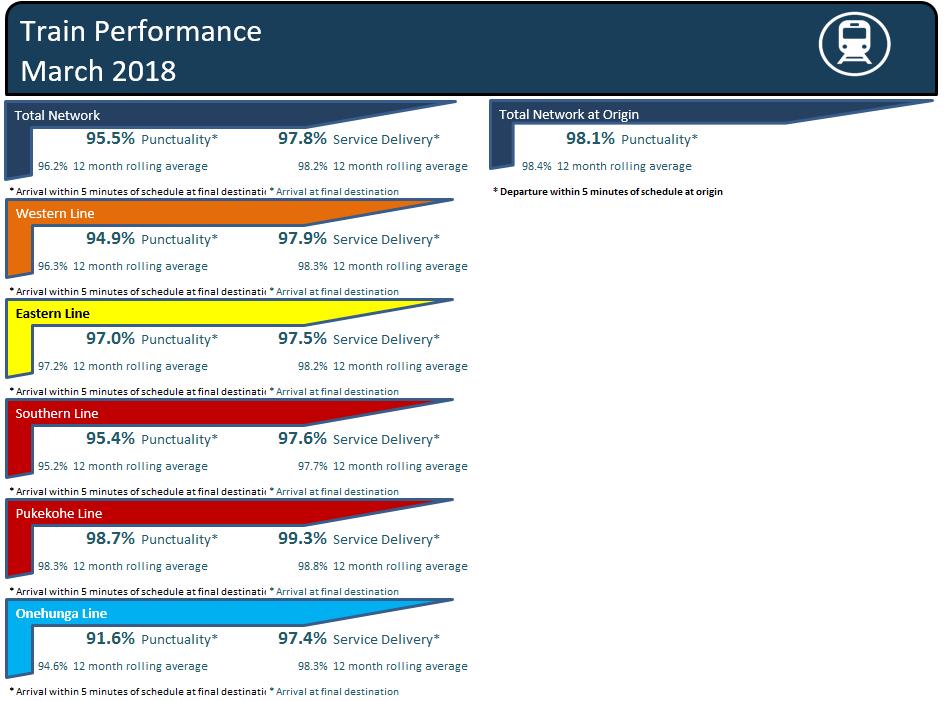
12 On-Time Performance

13 Train: There were 14,020 train services scheduled in March (blue bars) - the number of actual services operated on-time (yellow line) was 13,451. Major incidents that affected March 2018 train service performance: The southern and eastern train lines were closed for 35 minutes during the evening peak on 15 March, due to a trespasser, leading to the cancellation of 27 train services, and delaying 76 others A trespass incident in Manurewa, on 6 March, resulted in the cancellation of 20 train services A point failure at Britomart at the end of the afternoon peak on 9 March resulted in the cancellation of 23 train services.

14 Bus: Bus Services performance Key Performance Indicators (KPIs) were on target in March with Punctuality at first stop achieved at 95%, and Reliability at Start achieved at 98.1%. This was a good result, especially as traffic conditions were busy during the month due to March Madness, and roadworks in Beach Haven affecting services operated by Birkenhead Transport. Overall, the performance improved on the prior month with +0.2% (punctuality at first stop) and +0.2% (reliability), and had a positive change year-on-year.

15 Ferry: Service delivery (or reliability) is the proportion of ferries not cancelled in full or part and arrive at their final destination. Punctuality is the proportion of ferries that were not cancelled in full or part and that departed their origin within -59 seconds and +4:59 of the scheduled time. A large number of services were running late over March due to the ongoing ferry basin congestion with some cruise ship activity, on-going seawall works at Pier 1 and 2, March Madness and vessel unreliability. Inner harbour services suffered a number of cancellations due to vessel breakdown or running excessively late that trips were missed. On the network overall there were increased passenger numbers due to March Madness that created longer dwell times affected departure times. With the seawall works nearing completion and the reinstatement of Pier 1a due to happen mid to late April, reliability should lift in the coming months.
Statistics Report. April Page 1
 Statistics Report April 214 Page 1 TABLE OF CONTENTS PUBLIC TRANSPORT... 3 1. HIGHLIGHTS... 3 2. PUBLIC TRANSPORT PATRONAGE... 4 3. PUBLIC TRANSPORT SERVICE PERFORMANCE... 14 4. SPECIAL EVENT PUBLIC TRANSPORT
Statistics Report. May Page 1
 Statistics Report May 214 Page 1 TABLE OF CONTENTS PUBLIC TRANSPORT... 3 1. HIGHLIGHTS... 3 2. PUBLIC TRANSPORT PATRONAGE... 4 3. PUBLIC TRANSPORT SERVICE PERFORMANCE... 14 4. SPECIAL EVENT PUBLIC TRANSPORT
Statistics Report. June Page 1
 Statistics Report June 214 Page 1 TABLE OF CONTENTS PUBLIC TRANSPORT... 3 1. HIGHLIGHTS... 3 2. PUBLIC TRANSPORT PATRONAGE... 4 3. PUBLIC TRANSPORT SERVICE PERFORMANCE... 14 4. SPECIAL EVENT PUBLIC TRANSPORT
Bus Reliability and Punctuality Performance
 Bus Reliability and Punctuality Performance Recommendation(s) That the Board: Board Meeting 26 August 2014 i. Notes the changes to the reporting of bus reliability and punctuality. As at July 2014 the
Transport Indicators Report June 2018
 Transport Indicators Report June 2018 Board Meeting 21 August 2018 Recommendation That the Board: i. Receives this report. Executive summary 1. The attached Monthly and Quarterly Indicator Reports provide
Auckland Transport - Transport Indicators Report June 2013
 Thousands Auckland Transport Transport Indicators Report June 213 Economic Indicators 5 4 3 2 1 % 1 2 3 4 9 8 3 2 1 Auckland Economic Activity Composite index of Economic Activity Auckland Source : ANZ
$960 $1,175 $91 OVERVIEW National Land Transport Programme Auckland AUCKLAND REGIONAL SUMMARY
 2015 18 National Land Transport Programme Auckland AUCKLAND REGIONAL SUMMARY OVERVIEW Achieving an effective and efficient transport system is central to supporting Auckland s future. Auckland is home
NSW PRE-BUDGET STATEMENT FUTURE ECONOMY FUTURE JOBS
 2017-18 NSW PRE-BUDGET STATEMENT FUTURE ECONOMY FUTURE JOBS Executive Summary The 2017-18 NSW State Budget presents an opportunity for the NSW Government to future-proof the tourism and transport sectors.
The Traffic Management Act (TMA) 2004 and roadworks; and lane rental under the New Roads and Streetworks Act (1991) in England
 2004 and roadworks; and lane rental under the New Roads and Streetworks Act (1991) in England") The Traffic Management Act (TMA) 2004 and roadworks; and lane rental under the New Roads and Streetworks Act (1991) in England Introduction and purpose of note In view of the review of SRWC functions,
The Traffic Management Act (TMA) 2004 and roadworks; and lane rental under the New Roads and Streetworks Act (1991) in England Introduction and purpose of note In view of the review of SRWC functions,
PART 1: BACKGROUND Introduction Context The role of public transport in Auckland Our current public transport system
 PART 1: BACKGROUND... 1 1. Introduction... 1 2. Context... 4 3. The role of public transport in Auckland... 8 4. Our current public transport system and recent developments... 9 5. Key challenges... 22
Auckland Transport Quarterly Indicators Report 2018/19
 Attachment 1 Auckland Transport ly Indicators Report 218/19 September 218 Table of Contents Page 2. 1. Executive summary 2. External indicators 3. Performance by Key Priority 3.1 Deliver an efficient and
Report of the Executive
 Mersey Ferries Timetable Review 2014/15 (PTE/40/13) Report of the Executive 1. Introduction The purpose of the report is to review the Mersey Ferries timetable arrangements and available ticket types with
Performance monitoring report for first half of 2016
 Performance monitoring report for first half of 2016 Gatwick Airport Limited 1. Introduction Date of issue: 5 December 2016 This report provides an update on performance at Gatwick in the first half of
National Rail Performance Report - Quarter /14
 A London TravelWatch report The voice of transport users National Rail Performance Report - July 2014 London TravelWatch is the official body set up by Parliament to provide a voice for London s travelling
2017/ Q1 Performance Measures Report
 2017/2018 - Q1 Performance Measures Report Contents Ridership & Revenue... 1 Historical Revenue & Ridership... 1 Revenue Actual vs. Planned... 3 Mean Distance Between Failures... 5 Maintenance Cost Quarter
2017/2018 Q3 Performance Measures Report. Revised March 22, 2018 Average Daily Boardings Comparison Chart, Page 11 Q3 Boardings figures revised
 2017/2018 Q3 Performance Measures Report Revised March 22, 2018 Average Daily Boardings Comparison Chart, Page 11 Q3 Boardings figures revised Contents Ridership & Revenue... 1 Historical Revenue & Ridership...
Wellington $312 $49 $456 OVERVIEW WELLINGTON REGIONAL SUMMARY
 National Land Transport Programme 2015 18 Wellington WELLINGTON REGIONAL SUMMARY OVERVIEW The Wellington region is made up of a number of cities, urban areas and supporting rural hinterland. The city is
December 2018 Monthly Performance Report
 Date: January 16, 2019 To: From: Subject: General Manager Board of Directors Timothy Kea Budget & Grants Department December 2018 Monthly Performance Report The monthly systemwide ridership decreased 1.4%
January 2019 Monthly Performance Report
 Date: February 19, 2019 To: From: Subject: General Manager Board of Directors Timothy Kea Budget & Grants Department January 2019 Monthly Performance Report The monthly systemwide ridership decreased 0.5%
AUCKLAND $1.2 BILLION $1.9 BILLION $149 MILLION 15% SPEND $5.7 BILLION
 AUCKLAND AUCKLAND $5.7 BILLION FORECAST TOTAL AUCKLAND INVESTMENT The next 10 years are expected to underline Auckland s performance as the fastest growing major city in Australasia. The city is expected
Appendix 1: Operations Summary Report for the Quarter Ended December 31, 2017
 Appendix 1: Operations Summary Report for the A B C D E F G H I J Routes Actual Round Trips Capacity Provided (AEQ's) AEQ's Carried QTR 3 F2018 Capacity Utilization QTR 3 F2018 (C / B) Capacity Utilization
Northern Beaches Transport Action Plan
 Northern Beaches Transport Action Plan The NSW Government is taking action now to deliver transport improvements for the Northern Beaches, as well as planning for the future growth of the area. $633 million
Attachment C: 2017/2018 Halifax Transit Year End Performance Report. 2017/2018 Year End Performance Measures Report
 Attachment C: 2017/2018 Halifax Transit Year End Performance Report 2017/2018 Year End Performance Measures Report Contents Annual Key Performance Indicators (KPIs)... 1 Weekday Cost per Passenger... 1
National Rail Performance Report - Quarter /16 (January-March 2016)
") National Rail Performance Report - Quarter 4 2015/16 (January-March 2016) May 2016 London TravelWatch is the official body set up by Parliament to provide a voice for London s travelling public. Our role
National Rail Performance Report - Quarter 4 2015/16 (January-March 2016) May 2016 London TravelWatch is the official body set up by Parliament to provide a voice for London s travelling public. Our role
Policy committee Item: 11 Ref: PC086. National Rail Performance Report - Quarter (Oct-Dec 2015)
") Policy committee 23.02.16 Item: 11 Ref: PC086 National Rail Performance Report - Quarter 3 2015-16 (Oct-Dec 2015) February 2016 London TravelWatch is the official body set up by Parliament to provide a
Policy committee 23.02.16 Item: 11 Ref: PC086 National Rail Performance Report - Quarter 3 2015-16 (Oct-Dec 2015) February 2016 London TravelWatch is the official body set up by Parliament to provide a
CONGESTION MONITORING THE NEW ZEALAND EXPERIENCE. By Mike Curran, Manager Strategic Policy, Transit New Zealand
 CONGESTION MONITORING THE NEW ZEALAND EXPERIENCE 26 th Australasian Transport Research Forum Wellington New Zealand 1-3 October 2003 By, Manager Strategic Policy, Transit New Zealand Abstract New Zealand
PERFORMANCE REPORT DECEMBER Performance Management Office
 PERFORMANCE REPORT DECEMBER 2018 Performance Management Office INTRODUCTION/BACKGROUND Performance Management Office FIXED ROUTE DASHBOARD FY 2019 Safety Max Target Goal Preventable Collisions per 100k
ATM Network Performance Report
 ATM Network Performance Report 2018. Page 1 of 16 Table of contents Summary... 3 Network Wide Performance... 4 Airborne delay... 4 Sydney... 6 Airborne delay... 6 Notable events... 6 Melbourne... 9 Airborne
Operational Performance
 Customer Services, Operations, and Safety Committee Board Action/Information Item III-A January 10, 2008 Operational Washington Metropolitan Area Transportation Authority Board Action/Information Summary
1 YORK REGION TRANSIT/ VIVA SYSTEM PERFORMANCE
 Report No. 6 of the Transportation Services Committee Regional Council Meeting of June 23, 2011 1 YORK REGION TRANSIT/ VIVA SYSTEM PERFORMANCE The Transportation Services Committee recommends: 1. Receipt
transformational an overview PoPulation Growth auckland s PoPulation will increase by up to million PeoPle over the next 30 years.
 auckland s PoPulation will increase by up to million PeoPle over the next 30 years. an overview Auckland s time has come. We now have a shared vision to be the world s most liveable city and, for the first
WELLINGTON $422 MILLION $614 MILLION $83 MILLION 22% SPEND $1.9 BILLION
 WELLINGTON WELLINGTON $1.9 BILLION FORECAST TOTAL WELLINGTON INVESTMENT The Wellington region s transport challenges are dominated by the region s concentration of population in the metropolitan cities,
4 Transport projects underway in Western Sydney
 4 Transport projects underway in Western Sydney About this chapter This chapter provides an overview of the Australian and NSW government s significant investments in road, bus and rail infrastructure
Gold Coast. Rapid Transit. Chapter twelve Social impact. Chapter content
 Gold Coast Rapid Transit Chapter twelve Social impact Chapter content Social impact assessment process...235 Existing community profile...237 Consultation...238 Social impacts and mitigation strategies...239
Business Report. Project Updates. Te Atatu Road. Glenvar Ridge Road. Karangahape Road Cycleway
 Business Report Recommendation: That the Chief Executive s report be received. Prepared by: David Warburton, Chief Executive Project Updates Te Atatu Road A well-attended Public Open Day (approximately
Rail Sta s cs Compendium Great Britain Annual
 Rail Stascs Compendium Great Britain 2017-18 Annual Publicaon Date: 4th December 2018 Next release: November 2019 Background This annual compendium publication contains a summary of the statistical releases
Strong Demand Pushing Hotels to Choking Point
 New Zealand, H1 2017 Strong Demand Pushing Hotels to Choking Point OCCUPANCY 0.4 p.p. ADR 11.8% y-o-y RevPAR 12.4% y-o-y International Arrivals 10.2% y-o-y Chart 1: International Visitor Arrivals 3,800,000
CBD Rail Link Business Case
 CBD Rail Link Business Case Executive Summary: CBD Link Business Case (Nov 2010) Background The CBD Rail Link will be the most significant improvement to Auckland s transport network since the opening
To ensure the sustainable provision of safe, reliable, friendly and efficient passenger and cargo shipping services for the residents of Sark and
 To ensure the sustainable provision of safe, reliable, friendly and efficient passenger and cargo shipping 1 1) Introduction 2) IOSS financial performance 2015-16 and 2016-17 Year to Date 3) IOSS operational
This report is PUBLIC [NOT PROTECTIVELY MARKED] Board Meeting. Councillor Roger Lawrence Transport
![This report is PUBLIC [NOT PROTECTIVELY MARKED] Board Meeting. Councillor Roger Lawrence Transport](/thumbs/85/92100595.jpg "This report is PUBLIC [NOT PROTECTIVELY MARKED] Board Meeting. Councillor Roger Lawrence Transport") Agenda Item No. 5.4 Board Meeting Date 17 February 2017 Report title Cabinet Member Portfolio Lead Accountable Managing Director Accountable Employee Report has been considered by West Midlands Bus Alliance
Agenda Item No. 5.4 Board Meeting Date 17 February 2017 Report title Cabinet Member Portfolio Lead Accountable Managing Director Accountable Employee Report has been considered by West Midlands Bus Alliance
NZTA confirmed the funding allocation of $11.9m for SuperGold for 2013/14. Table 1 Current Funding expectations from NZTA for Capital Projects
 Chief Executive s Report Recommendation: That the Chief Executive s report be received. Prepared by: Dr David Warburton, Chief Executive Finance A draft Opex and Capex budget for the 2014/15 year has been
Why does Sydney need a new fast Metro to the West? A fast Metro to the west is a vital component of this Plan
 Why does Sydney need a new fast Metro to the West? (as shown in 10,000 Friends of Greater Sydney Stage 1 Rail Plan) The Stage 1 Rail Plan was developed to support an integrated transport plan that would
SIAMOS Put your airport ahead through innovation. Siemens AG All rights reserved.
 SIAMOS Put your airport ahead through innovation Siemens AG 2012. All rights reserved. SIAMOS The airports operations challenges and, additionally, EuroControl's Collaborative decision making CDM targets
Sound Transit Operations March 2018 Service Performance Report. Ridership
 March 218 Service Performance Report Ridership Total Boardings by Mode Mar-17 Mar-18 % YTD-17 YTD-18 % ST Express 1,622,116 1,47,79-4.6% 4,499,798 4,428,14-1.6% Sounder 393,33 39,6.% 1,74,96 1,163,76 8.3%
Railway performance and subsidy statistics
 Railway performance and subsidy statistics Standard Note: SN/SG/2199 Last updated: 2 October 2013 Author: Matthew Keep Social and General Statistics Section This Note provides data and commentary relating
New bus services for Warkworth and the Kowhai Coast
 18pt New bus services for Warkworth and the Kowhai Coast Includes Route Description AT Metro AT.govt.nz/newnetworkwarkworth A new service between Warkworth and Hibiscus Coast Station, and new local services
MELBOURNE METRO RAIL PROJECT EXPANDING MELBOURNE S UNDERGROUND RAIL NETWORK UPDATE FOR RESIDENTS OF THE DOMAIN PRECINCT APRIL 2016
 MELBOURNE METRO RAIL PROJECT EXPANDING MELBOURNE S UNDERGROUND RAIL NETWORK UPDATE FOR RESIDENTS OF THE DOMAIN PRECINCT APRIL 2016 MEETING THE CHALLENGE OF POPULATION GROWTH 24 14.4 12.6 MELBOURNE METRO
EASYJET TRADING STATEMENT FOR THE QUARTER ENDED 30 JUNE 2016
 EASYJET TRADING STATEMENT FOR THE QUARTER ENDED 30 JUNE 2016 Third Quarter Performance in line; looking forward into a difficult and uncertain economic and operating environment; management actions in
LA Metro Rapid - Considerations in Identifying BRT Corridors. Martha Butler LACMTA, Transportation Planning Manager Los Angeles, California
 LA Metro Rapid - Considerations in Identifying BRT Corridors Martha Butler LACMTA, Transportation Planning Manager Los Angeles, California LA Metro Transportation planner/coordinator, designer, builder
Bus Operations Report
 Third Quarter FY 216 (January 1 - March 31, 216) Wednesday April 27, 216 Operations Ridership: 783,194 passengers used in the third quarter. This represents a 2% increase over the same period in FY 215.
5 Rail demand in Western Sydney
 5 Rail demand in Western Sydney About this chapter To better understand where new or enhanced rail services are needed, this chapter presents an overview of the existing and future demand on the rail network
Date: 11/6/15. Total Passengers
 Total San Diego Metropolitan Transit System POLICY 42 PERFORMANCE MONITORING REPORT Page 1 of 6 OBJECTIVE Develop a Customer-Focused and Competitive System The following measures of productivity and service
Annual Performance. South West May 2016 to April
 Annual Performance South West May 2016 to April 2017 www.stagecoachbus.com @stagecoachsw Operational performance statistics About us Stagecoach South West provides local bus services across Devon and into
Intercity Transit Short / Long Range Plan Short-Term Recommendations Transit Authority Meeting
 Intercity Transit Short / Long Range Plan Short-Term Recommendations Transit Authority Meeting March 2018 How did we get here? Road Trip Process Outreach Budget projections Assessment of existing operations
AUCKLAND DESTINATION OVERVIEW
 AUCKLAND DESTINATION OVERVIEW October 218 An in-depth overview of Auckland s visitor economy from the latest arrival, accommodation, spend, cruise and event data through to past five- commentary. Prepared
Accommodation Survey: November 2009
 Embargoed until 10:45am 19 January 2010 Accommodation Survey: November 2009 Highlights Compared with November 2008: International guest nights were up 2 percent, while domestic guest nights were down 1
Aviation Trends. Quarter Contents
 Aviation Trends Quarter 1 2013 Contents Introduction 2 1 Historical overview of traffic 3 a Terminal passengers b Commercial flights c Cargo tonnage 2 Terminal passengers at UK airports 7 3 Passenger flights
SOUTHWEST AIRLINES. Submitted By: P.Ranjithkumar 10MBA0031. Batch-D
 SOUTHWEST AIRLINES Submitted By: P.Ranjithkumar 10MBA0031 Batch-D PROBLEM STATEMENT: The chief competitor of South West Airlines, Braniff International airways has introduced a 60 day half price ticket
Sound Transit Operations June 2016 Service Performance Report. Ridership
 Ridership Total Boardings by Mode Mode Jun-15 Jun-16 % YTD-15 YTD-16 % ST Express 1,622,222 1,617,420-0.3% 9,159,934 9,228,211 0.7% Sounder 323,747 361,919 11.8% 1,843,914 2,099,824 13.9% Tacoma Link 75,396
Downtown Ferry Basin Redevelopment - Stage 1. Integrated Transport Assessment
 Downtown Ferry Basin Redevelopment - Stage 1 Integrated Transport Assessment 12/11/2018 Project: Downtown Ferry Basin Redevelopment - Stage 1 Title: Integrated Transport Assessment Document Reference:
HARBOUR MASTER POLICY
 Harbour Tours Ltd. 25 Queens Park West, Port of Spain, Trinidad Tel- 622-2766/ Email- events@harbourmastertt.com HARBOUR MASTER POLICY The MV HARBOURMASTER is committed to offering its clients the most
Performance monitoring report 2017/18
 Performance monitoring report /18 Gatwick Airport Limited 1. Introduction Date of issue: 20 July 2018 This report provides an update on performance at Gatwick in the financial year /18, ending 31 March
Congestion. Addressing urban congestion in SEQ. How do you define congestion? South East Queensland is growing. Sustained growth in motorised travel
 How do you define congestion? Addressing urban congestion in SEQ Engineer: traffic volume exceeds road capacity Russell Murray Director Urban Congestion Task Force Department of Transport and Main Roads
Transit Fare Review Phase 2 Discussion Guide
 Transit Fare Review Phase 2 Discussion Guide January 2017 translink.ca Table of Contents How should we determine transit fares in Metro Vancouver? 1 Varying fares by distance travelled 2 Varying fares
Aviation Trends Quarter
 Aviation Trends Quarter 4 214 Contents Introduction... 2 1. Historical overview of traffic see note 5 on p.15... 3 a. Terminal passengers... 4 b. Commercial flights... 5 c. Cargo tonnage... 6 2. Terminal
Greenslade Pleasure Boats Stuart Rawlinson - Parkstone Bay Marina
 MINUTES OF A MEETING OP THE passenger boat operators HELD ON Tuesday 19 th November 2013 AT 10.00 a.m. IN THE BOARD ROOM OF THE HARBOUR OFFICE OF POOLE HARBOUR COMMISSIONERS PRESENT: Brian Murphy HM, Poole
LCR Railway Improvement Plan BID Travel and Transport Forum. Tuesday 28 th February 2017
 LCR Railway Improvement Plan BID Travel and Transport Forum Tuesday 28 th February 2017 Liverpool City Region Railway Improvement Plan 2016-2019 Wirral Loop Line Track Renewal 3 January 18 June 2017 The
ATM Network Performance Report
 ATM Network Performance Report 2019 Page 1 of 20 Table of contents Summary... 3 Network Wide Performance... 4 Airborne delay... 4 Sydney... 7 Airborne delay... 7 Notable events... 7 CTOT (Calculated take
2013 Travel Survey. for the States of Guernsey Commerce & Employment Department RESEARCH REPORT ON Q1 2013
 213 Travel Survey for the States of Guernsey Commerce & Employment Department RESEARCH REPORT ON Q1 213 May 21st 213 Table of Contents Page No. Summary of Results 1 Survey Results 2 Breakdown of departing
METRO OPERATIONS COMMITTEE
 Los Angeles County Metropolitan Transportation Authority Item 1 CHIEF OPERATIONS OFFICER S S REPORT METRO OPERATIONS COMMITTEE Lonnie Mitchell Chief Operations Officer May 19, 20 1 Employee Recognition
Att. A, AI 46, 11/9/17
 Total s San Diego Metropolitan Transit System POLICY 42 PERFORMANCE MONITORING REPORT Page 1 of 6 Date: 11/8/17 OBJECTIVE Develop a Customer-Focused and Competitive System The following measures of productivity
Report of. Transport Key Performance Indicators
 Report of Transport Key Performance Indicators August 2008 CONTENTS 1) INTRODUCTION 2 2) RELIABILITY OF SHETLANDS TRANSPORT NETWORK 3 3) STANDARD OF ROAD MAINTENANCE 5 4) FUEL CONSUMPTION LEVELS 6 5) MARKET
Accommodation Survey: February 2013
 Accommodation Survey: February 2013 Embargoed until 10:45am 11 April 2013 Key facts In February 2013, after removing seasonal variation: New Zealand guest nights rose 2.3 percent, following a fall of 4.1
Presentation to BRT UK Technical Visit to Leigh to Ellenbrook Guided Busway
 Presentation to BRT UK Technical Visit to Leigh to Ellenbrook Guided Busway Welcome Introductions: Anthony Murden Project Sponsor Adam Price Project Manager Martin Shier - Bus Partnerships Delivery Manager
Aviation Trends. Quarter Contents
 Aviation Trends Quarter 3 215 Contents Introduction... 2 1. Historical overview of traffic... 3 a. Terminal passengers... 4 b. Commercial flights... 5 c. Cargo tonnage... 6 2. Terminal passengers at UK
Aviation Trends. Quarter Contents
 Aviation Trends Quarter 3 2014 Contents Introduction... 2 1. Historical overview of traffic... 3 a. Terminal passengers... 4 b. Commercial flights... 5 c. Cargo tonnage... 6 2. Terminal passengers at UK
AUCKLAND DESTINATION OVERVIEW
 AUCKLAND DESTINATION OVERVIEW September 218 An in-depth overview of Auckland s visitor economy from the latest arrival, accommodation, spend, cruise and event data through to past five- commentary. Prepared
Smart Safety Tidal Flow Barrier
 ITS New Zealand Summit 2012 Auckland Harbour Bridge Martin Leak Managing Director, Resolve Group Ltd Auckland, N.Z. Auckland Harbour Bridge - demand for service: Opened in May 1959 with 4 lanes and an
1) Complete the Queuing Diagram by filling in the sequence of departing flights. The grey cells represent the departure slot (10 pts)
 Complete the Queuing Diagram by filling in the sequence of departing flights. The grey cells represent the departure slot (10 pts)") FLIGHT DELAYS/DETERMINISTIC QUEUEING MODELS Three airlines (A, B, C) have scheduled flights (1 n) for the morning peak hour departure bank as described in the chart below. There is a single runway that
FLIGHT DELAYS/DETERMINISTIC QUEUEING MODELS Three airlines (A, B, C) have scheduled flights (1 n) for the morning peak hour departure bank as described in the chart below. There is a single runway that
FOCUS ON FINTRY: SERVICES 32/33 ROUTE REVIEW PUBLIC CONSULTATION DOCUMENT. Focus on Fintry: Route Review. Public Consultation Document Autumn 2017
 FOCUS ON FINTRY: SERVICES 32/33 ROUTE REVIEW PUBLIC CONSULTATION DOCUMENT Focus on Fintry: Route Review Services 32/33 Public Consultation Document Autumn 2017 XPLORE DUNDEE (Tayside Public Transport Co
Auckland City Centre: Transport Capacity and Access Trends
 Auckland City Centre: Transport Capacity and Access Trends Final Report Prepared for: Auckland Council Date: 8 August 2018 Version: Final QUALITY ASSURANCE REGISTER Issue Description Prepared by Reviewed
18pt. Bus services for Auckland's Central Suburbs are changing from Sunday 8 July 2018
 18pt Bus services for Auckland's Central Suburbs are changing from Sunday 8 July 2018 Adapted in accordance with Section 69 of the Copyright Act 1994 by the Royal New Zealand Foundation of the Blind,
Sarawia Street Laxon Terrace Rail Level Crossing Removal
 Sarawia Street Laxon Terrace Rail Level Crossing Removal Recommendations It is recommended that the Board: Receives the report. Executive summary The removal of the Sarawia Street to Laxon Terrace rail
Draft City Centre Transport Proposals
 Draft City Centre Transport Proposals Introduction This draft position paper provides an overview of the current City Centre transport issues, including concepts of the possible future City Centre transport
QANTAS DELIVERS STRONG FIRST HALF RESULT DESPITE HIGHER FUEL BILL
 ASX and Media Release Sydney, 21 February 2019 QANTAS DELIVERS STRONG FIRST HALF RESULT DESPITE HIGHER FUEL BILL Underlying Profit Before Tax: $780 million (down $179 million) Statutory Profit Before Tax:
Written evidence submitted by National Express West Midlands (BSB 15)
") Written evidence submitted by National Express West Midlands (BSB 15) National Express West Midlands 1. National Express West Midlands (West Midlands Travel Ltd) is the major bus operator in the West Midlands.
Written evidence submitted by National Express West Midlands (BSB 15) National Express West Midlands 1. National Express West Midlands (West Midlands Travel Ltd) is the major bus operator in the West Midlands.
VCTC Transit Ridership and Performance Measures Quarterly Report
 VCTC Transit Ridership and Performance Measures Quarterly Report Overview Quarter 2 Fiscal Year 2018-2019 This report provides performance measures for VCTC Intercity Bus Service covering the FY 2018-19
Transport Performance and the Data Clubs Approach. Richard Anderson ESRC International Public Service Rankings 13 th December 2005
 Transport Performance and the Data Clubs Approach Richard Anderson ESRC International Public Service Rankings 13 th December 2005 Presentation structure Introduction and history of pubic transport benchmarking
New free City connector bus service
 The Adelaide City Council invites engagement from the community about New free City connector bus service 99C City Loop and Adelaide Connector free bus services to merge: Project Summary Adelaide City
Airport Planning and Terminal Design
 Airport Planning and Terminal Design Major Terminal Design Considerations Passenger Terminal Configuration Passenger Terminal Concepts Major Design Considerations 1 Terminal Configuration Centralised processing
2015 Metro User Christchurch
 2015 Metro User Christchurch Research Report June 2015 www.researchfirst.co.nz Contents 2015 Metro User Christchurch 1 Research Context and Design 03 1.1 Introduction 03 1.2 Research Objectives 03 1.3
Treasure Island Supplemental Information Report Addendum
 1 1 1 1 0 1 0 1 0 1 Treasure Island Supplemental Information Report Addendum Introduction Purpose The purpose of this Supplemental Information Report (SIR) Addendum is to determine if the current land
Sound Transit Operations February 2018 Service Performance Report. Ridership
 February 218 Service Performance Report Ridership Total Boardings by Mode Feb-17 Feb-18 % YTD-17 YTD-18 % ST Express 1,373,96 1,372,88 -.1% 2,877,294 2,88,719.1% Sounder 314,96 32,187 11.9% 681,923 768,69
2017 POLICY DOCUMENT. M1 Action Plan. Putting Queenslanders First
 2017 POLICY DOCUMENT Putting 2 Contents Message from the Premier 3 Our Commitment 4 The Newman-Nicholls Legacy 5 The Palaszczuk 6 Government s Record Our Plans: Putting 8 Call: 07 3844 8101 Mail: PO Box
My schedule is more flexible with the. Enhanced Train Services. Shared Journeys. MTR Corporation
 My schedule is more flexible with the Enhanced Train Services. Shared Journeys 26 MTR Corporation You will find a new Public Toilet over there! It s convenient to take the new to the station! Lift Annual
Aviation Trends. Quarter Contents
 Aviation Trends Quarter 2 217 Contents Introduction... 2 1. Historical overview of traffic... 3 a. Terminal passengers... 4 b. Commercial flights... 5 c. Cargo tonnage... 6 2. Terminal passengers at UK
Sound Transit Operations August 2015 Service Performance Report. Ridership
 Ridership Total Boardings by Mode Mode Aug-14 Aug-15 % YTD-14 YTD-15 % ST Express 1,534,241 1,553,492 1.3% 11,742,839 12,354,957 5.2% Sounder 275,403 326,015 18.4% 2,139,086 2,463,422 15.2% Tacoma Link
MOL Announces On-Time Arrival Performance Results for July - September 2015
 Tel : 852-2823-6800 Fax : 852-2865-0906 MOL Announces On-Time Arrival Performance Results for July - September 2015 October 29, 2015 Hong Kong Mitsui O.S.K. Lines, Ltd. (MOL; President: Junichiro Ikeda)
SOUTH WEST. annual report. May 2011 to April
 annual report May 2011 to April 2012 SOUTH WEST www.stagecoachbus.com Operational performance statistics About us Stagecoach South West provides local bus services across Exeter, East Devon, Torbay, South
Housing in Hobart: an overview of the data. Richard Eccleston, Lisa Denny, Julia Verdouw & Kathleen Flanagan University of Tasmania May 2018
 Housing in Hobart: an overview of the data Richard Eccleston, Lisa Denny, Julia Verdouw & Kathleen Flanagan University of Tasmania May 2018 Informing the Housing Debate Tasmania is facing significant housing