1 YORK REGION TRANSIT/ VIVA SYSTEM PERFORMANCE
|
|
|
- Sophia Parks
- 5 years ago
- Views:
Transcription
1 Report No. 6 of the Transportation Services Committee Regional Council Meeting of June 23, YORK REGION TRANSIT/ VIVA SYSTEM PERFORMANCE The Transportation Services Committee recommends: 1. Receipt of the presentation by Rick Leary, General Manager, Transit; and 2. Adoption of the recommendations contained in the following report dated June 8, 2011 from the Commissioner of Transportation Services. 1. RECOMMENDATIONS It is recommended that: 1. York Region Transit (YRT/Viva) develop a Five-Year Service and Operational Plan that focuses on the: a) Ridership management (retain, increase ridership) b) VivaNext construction mitigation (rapidways and Spadina Subway extension) c) Transit Service Guidelines review d) Rapid transit readiness (i.e. Assess Toronto Transit Commission (TTC) services into York Region) 2. YRT/Viva develop the 2012 Service Plan to guide YRT/Viva service adjustments including: a) Route restructuring b) Strengthening the grid network c) Rationalizing service 3. YRT/Viva Monthly System Performance Updates be revised to include the following Key Performance Indicators: a) Trips not accounted for (monthly) b) On-time performance/adherence to schedule (monthly) c) Ridership with rolling five year averages (monthly) d) Quarterly Ridership Report 2. PURPOSE The purpose of this report is to advise Regional Council of the current YRT/Viva system performance and recommend direction on priorities for the next five years.
2 Report No. 6 of the Transportation Services Committee Regional Council Meeting of June 23, BACKGROUND In 2011, YRT/Viva celebrated its 10th anniversary; YRT was amalgamated in 2001 combining the local municipal transit systems of Vaughan, Markham, Richmond Hill and Newmarket As YRT/Viva has moved from a start-up to a mature transit agency, operating practices have changed and evolved. In those early years from 2001 to 2004, the business priorities were to standardize levels of service, brand the service and develop best practices for managing the outsourced transit operations and maintenance. Regional Council committed to bus rapid transit (BRT), focusing York Region Transit s priorities from 2005 to 2010 to adjusting service to support the Viva BRT service and to incorporate state-of-the art technology to track on-time performance, ridership and introduce customer satisfaction surveys. In 2011, YRT/Viva is at the stage where the data/statistics now available from technology investments can be analyzed by staff to provide the optimal service for retaining and growing ridership. YRT/Viva staff has been reviewing the data outputs to see how operating practices can be redesigned to provide the highest levels of service at the lowest possible cost. All of this will be done while preparing YRT/Viva for the opening of new rapid transit facilities in the coming years. Table 1 and Figure 1 below illustrate the evolution of YRT/Viva to the present day and beyond. Figure 1 YRT/Viva Transit System Lifecycle
3 Report No. 6 of the Transportation Services Committee Regional Council Meeting of June 23, 2011 Table 1 Evolution of YRT/Viva 2001 to 2004 Start-Up YRT was amalgamated from four local transit systems to a Regional system serving nine municipalities over a service area of 1776 square kilometres and 760,000 residents to 2010 Rapid System Growth YRT adjusted service and routing in preparation of the introduction of Viva bus rapid transit (BRT) throughout the Region. The introduction of BRT in the Region also included new technologies, such as the Innovation in Transportation (INIT) system. The INIT system is used by YRT/Viva to track ridership via Automatic Passenger Counters (APC) on Viva buses and to use MobileStatistics to track vehicle locations and unaccounted for trips. The initial stages of technology implementation included a training period allowing drivers to become acquainted with the new technology to Realignment YRT/Viva is currently leveraging the data made available by technology to prepare for the next phase of growth. This growth is anticipated because of the construction of rapidways along Yonge Street, Davis Drive, Highway 7 and the Spadina Subway extension to 2020 Rapid Growth YRT/Viva will prepare a new Five-Year Service and Operational Plan to address service requirements on how to best serve the new rapidways and subway service within the Region. Between January 2001 and January 2011 annual revenue service hours increased from 325,000 to 1,120,000 hours or 3.5 times. During the same period the revenue boardings grew from 7.9 to 19.4 million or 2.5 times. Therefore, ridership growth has not kept pace with the investment in service hours This report describes some of the measures YRT/Viva has been using to understand how well the transit system is operating today, and proposes steps to improve the transit system performance and be ready for the opening of new rapid transit facilities over the next five years. YRT/Viva s goals are to retain ridership by improving service for existing customers and to grow ridership by preparing for rapid transit expansion projects.
4 Report No. 6 of the Transportation Services Committee Regional Council Meeting of June 23, ANALYSIS AND OPTIONS Two thirds of the 7,600 complaints from YRT/Viva customers in 2010 were about schedule adherence/reliability and driver behaviour relating to speeding and sudden stops and starts The technology now on fleet buses allow staff to better understand how the system is performing and take steps to correct the problems in the field. A close examination of the data has shown that there were a high proportion of trips not accounted for and poor on-time performance on individual routes. This leads to the top customer complaints buses showing up late or not showing up at all and stressed out bus drivers who are driving hard to meet schedules. In 2009, the monthly average for trips not accounted for was 15.7%. By holding contractors accountable and correcting data collection issues, YRT/Viva has reduced the number to 2.3% in Q1 of 2011 The INIT system, which was installed as part of the start-up for Viva, has since been added to the conventional fleet. MobileStatistics, an element of the system, tracks trips not accounted for. The data showed that 15.7% of monthly trips were not accounted for in This, in turn, means there were almost 19,000 trips the contracted operators are not being held responsible for each month. This makes accountability for costs uncertain. It does not necessarily mean the trips were not made; often a trip is not accounted for due to: excessive delays (+20 minutes) trip data loss driver error technology issues By implementing INIT to track trips and implementing corrective measures (proper maintenance and inserting cover buses were appropriate) YRT/Viva has reduced the number of unaccounted for trips in 2011 to 2.3% as shown on Figure 2.
5 Report No. 6 of the Transportation Services Committee Regional Council Meeting of June 23, ,000 14,000 12,000 10,000 Figure 2 YRT/Viva Monthly Average of Trips Not Accounted For 8,000 6, % 4, % 2, % By making trips not accounted for a new Key Performance Indicator, YRT/Viva can better manage contractors and address and resolve issues with service and reliability. In 2011, system performance has increased and contractors are more accountable. Most importantly, the tracking of trips not accounted for reduces the number of passengers potentially left at bus stops. A target of 1% to 1.5% unaccounted for trips has been set for the end of On-time performance affects how customers rate the reliability of our service. To overcome poor on-time performance, schedules need to be updated to reflect actual travel times To improve on-time performance for trip start times, YRT/Viva has and will continue to update schedules to reflect actual travel times. In 2011, YRT/Viva improved its start time on-time performance for some routes by 12% compared to Figure 3 shows the improvements from December 2009 to April 2011.
 Services The")
6 Report No. 6 of the Transportation Services Committee Regional Council Meeting of June 23, 2011 Figure 3 YRT/Viva On-Time Performance, Trip Start (Weekday/ Weekend - Holiday Base and Viva (BRT) Services The 2011 goal is to achieve an 85% to 90% on-time performance for arrivals at the last stop. For the July and September board periods, YRT/Viva will be updating schedules to reflect actual travel times with a focus on achieving the targeted on-time performance. By focussing the 2011 operating budget allocation on on-time performance and service reliability, YRT/Viva has achieved two successive quarters where ridership has exceeded 5 million, and a ridership of 21 million is predicted for year-end More detail on the measures being tracked by YRT/Viva is included in Appendix A to this report.
7 Report No. 6 of the Transportation Services Committee Regional Council Meeting of June 23, 2011 YRT/VIVA FIVE YEAR SERVICE AND OPERATIONAL PLAN (THE PLAN) The data presented in this report is a sample of the Key Performance Indicators now being tracked at YRT/Viva and will form the basis for the Service and Operational Plan being prepared for Council s consideration in Fall 2011 As staff prepares the Five Year Service and Operational Plan for consideration by Council, they will include specific ridership management measures to improve on-time performance with the aim of retaining and growing ridership. The Plan will focus on vivanext Construction Mitigation, including Spadina Subway construction impacts and the construction of rapidways along Yonge Street and Highway 7. It will focus on being Rapid Transit Ready by adjusting services to operate via transitways and to connect with the new subway stations. The plan will assess Toronto Transit Commission services into York Region. The plan will undertake an assessment of the 2006 Transit Service Guidelines, which are currently not being met. YRT/VIVA 2012 SERVICE PLAN The YRT/Viva 2012 Service Plan will also be presented to Council in Fall 2011 to guide next year s YRT/Viva service adjustments The 2012 Plan provides a framework for next year s service improvements of the transit network in order to attract new customers and increase overall transit market share. Some of the areas to focus on are route restructuring, strengthening the grid network, and rationalizing service. In Fall 2011, YRT/Viva will present the 2012 Service Plan to guide YRT/Viva service adjustments for next year. The new technology on the buses allows staff to collect more accurate and reliable information on system performance and on contractors performance Since 2005, YRT/Viva has used a Contractor Report Card program to report and score contractor performance. The report card was introduced to Council in September 2006 and has been reported on an annual basis. The report card scored contractors on 23 performance standards including: on-time departures, missed trips and CAD/AVL (INIT) system requirement. The results were tabulated quarterly with a benchmark score for acceptable performance. To determine the contractors score, random checks were performed by YRT/Viva operations inspectors but the sample sizes were small and the data was collected manually. Contractors were also
8 Report No. 6 of the Transportation Services Committee Regional Council Meeting of June 23, 2011 required to provide data on maintenance, vehicle accidents and responses to customer concerns along with other KPIs. The 2010 report indicated that for the performance standards of trips unaccounted for (goal: 95-98%) and on-time departures (goal: 90-95%) contractors were exceeding expectations. However, as described previously in this report, the data now available from the INIT system indicates that as of December 2009, 22% of trips were not accounted for and the average system on-time departures actually ranged between 74-79%. Now that the INIT technology provides more accurate data, an effective way to keep Council advised of YRT/Viva performance and contractors compliance with performance expectations is to use a new set of Key Performance Indicators on a monthly and quarterly basis YRT/Viva will be reporting on monthly system performance with the following new KPI s : a) Trips not accounted for (monthly) b) On-time performance/adherence to schedule (monthly) c) Ridership with rolling 5 year averages (monthly) d) Quarterly Ridership Report 5. FINANCIAL IMPLICATIONS YRT/Viva s proposed service adjustments and route rationalization will be accommodated within the 2011 budget YRT/Viva s annual budget for 2011 is $179.4 million which is 65% of the Transportation Services budget of $279.1 million and 12% of the Regional budget of $1.5 billion. The approved 2011 YRT/Viva operating budget reflects the on-time and reliability adjustments to service described in this report. This level of service has resulted in a revenue to cost ratio in 2010 of 39% with a projection in 2011 of 38%. This trend is not fiscally sustainable. In order to stop this downward trend, the 2012 Annual Service Plan will focus on route restructuring, strengthening the grid network and rationalizing service. The focus of the plan will be on retaining and growing ridership which will also retain and grow revenues while keeping costs as low as possible. This will be more possible than in past years due to the technology investments made to date which allows YRT/Viva to improve our business intelligence and contractor performance while controlling contractor costs.
9 Report No. 6 of the Transportation Services Committee Regional Council Meeting of June 23, 2011 Adopting a new approach to service will result in a more lean and efficient service model that will optimize Council s return on investment. 6. LOCAL MUNICIPAL IMPACT York Region Transit is committed to its on-going efforts to improve service reliability to all local municipalities. 7. CONCLUSION The Five-Year Service and Operational Plan and the 2012 Annual Service Plan will be presented in Fall YRT/Viva will also begin to report on a new set of key performance measures for system and contractor performance The two Service Plans will be presented to Transportation Services Committee in the Fall for approval. The new Key Performance Indicators monthly/quarterly reports will be submitted for information. For more information on this report, please contact Richard J. Leary, General Manager, York Region Transit/Viva at Ext The Senior Management Group has reviewed this report. (The attachment referred to in this clause is attached to this report.)
10 Council Report Attachment 1 Appendix A YRT/Viva System Performance Key Performance Indicators YRT/Viva s Customer Service team identified the top customer concerns to be schedule adherence/reliability of service and driver behaviour which includes bus speed. YRT/Viva will address these concerns by improving on-time performance/reliability and making the contractors more accountable for the service they provide. YRT/Viva Service Review In 2009, the monthly average for trips not accounted for was 15.7%. In 2011 it is 2.3% The Innovation In Techology (INIT) system was installed as part of the start up cost for Viva and has since been added to the conventional fleet. MobileStatistics, an element of the system, tracks trips not accounted for. For an average month, YRT/Viva operates 120,000 trips. If 16% of those trips are not accounted for, the contracted operators are not being held responsible for 20,000 trips along with its associated costs. Reasons why trips are not accounted for include: Excessive Delays (+20 min) Trip Data Loss Driver Error Technology Issues Currently, YRT/Viva has reduced the number of unaccounted for trips to 2.3% and is targeting 1% to 1.5% by the year end. Figure 1 shows YRT/Viva s monthly average of trips not accounted for.
11 YRT/Viva System Performance Key Performance Indicators 16,000 14,000 12,000 10,000 Figure 1 YRT/Viva Monthly Average of Trips Not Accounted For 8,000 6, % 4,000 2, % 2.3% A target of 1% to 1.5% for trips not accounted for has been set for YRT/Viva implemented a new process to track not accounted for trips The new process tracks trips not accounted for by category including: Mechanical Breakdowns Operators Sick/Late +20 minute Delay Due to Traffic Accidents Police, Fire, EMS Emergencies Contractors have also been tasked with providing additional training to their drivers to ensure compliance. There is also a program in place to ensure that the on bus technology is being properly maintained. By making this a new key performance indicator, YRT/Viva can hold the contractors directly responsible for the number of unaccounted for trips and provide an incentive/ disincentive to ensure accountability. By tracking trips not accounted for, YRT/Viva can better manage service and reliability by working with the contractors to address and resolve issues. System performance has Page 2

12 YRT/Viva System Performance Key Performance Indicators increased and contractors are more accountable since contractors can receive performance incentives. Most importantly, the tracking of trips not accounted for reduces the number of passengers potentially left at bus stops. YRT/Viva has set a start of trip, on-time performance goal of 95% for Viva (BRT) and 90% for conventional base routes. Also, an arrival at last stop goal of 85% to 90% for conventional base and Viva (BRT) routes is targeted To improve on-time performance for the trip start times, YRT/Viva has and will continue to update schedules to reflect actual travel times. In 2011, YRT/Viva improved its start time on-time performance by 9% to 12% over Figure 2 shows the improvements from December 2009 to April Figure 2 YRT/Viva On-Time Performance, Trip Start (Weekday/Weekend - Holiday Base and Viva (BRT) Services The 2011 goal is to achieve an 85% to 90% on-time performance for arrivals at last stop. For the July and September board periods, YRT/Viva will be updating schedules to reflect actual travel times with a focus on achieving the targeted on-time performance. Page 3
13 YRT/Viva System Performance Key Performance Indicators At no time did YRT/Viva comply 100% with the transit guidelines as outlined in The Transit Service Guidelines 2006 manual Transit service guidelines are the basis to provide the best appropriate service. Service guidelines define the conditions that require action when guidelines are not met. However, it allows flexibility to respond to varied customer needs and community expectations in an accountable, equitable and efficient manner. Service guidelines are intended to bring clarity and consistency to the process of adjusting and improving transit services to meet the varied and changing customer needs. Two key service guidelines are: Service Frequencies: Time (minutes) between trips Boarding per Hour: Number of passengers carried per hour The service frequency compliance for conventional, Viva (BRT) and the system are shown in Figure 3 - Service Frequency % Meeting Guideline Figure 3 Service Frequency % Meeting Guideline (February 2010 vs. 2011) Operating Period AM Peak PM Peak Year Conventional Viva System (BRT) % 100% 75.90% % 100% 79.50% % 100% 73.50% % 100% 69.90% For boardings per revenue hour, Viva (BRT) is 100% compliant with the peak period. A sample of YRT/Viva compliance with the boardings per revenue hour guideline is shown in Figure 4 - Boardings per Revenue Hour % Meeting Guideline. Figure 4 Boardings per Revenue Hour % Meeting Guideline (February 2011) Peak Off Peak All Routes 72.30% 59.00% Viva (BRT) Routes 100% 80% GO Shuttles 40% N/A Page 4
14 YRT/Viva System Performance Key Performance Indicators In 2010, the actual revenue hours exceeded the budgeted hours by 2.3% or 25,000 hours In 2010 additional hours were required to update existing schedules to reflect the actual travel times along some routes. The additional travel time also allowed YRT/Viva to achieve its on-time performance targets of 90% for conventional (base routes) and 95% for Viva (BRT). YRT/Viva has the technical tools (INIT System) to observe schedule adherence and implement appropriate schedule changes. For 2010, YRT/Viva operated 1.12M revenue vehicle hours. The operating costs were $133M and revenue was $51M. To provide the advertised 2010 service YRT/Viva would have had to operate 1.2M revenue hours From 2007 to 2009, the actual service hours provided was below budgeted service hours. YRT/Viva did not provide service that matched the advertized schedules. This created an artificially high Revenue-to-Cost (R/C) ratio. Figure 5 shows the trend of the revenue hours actual vs. budgeted. Figure 5 Revenue Hours Actual vs. Budgeted ( ) YRT/Viva continually looks for ways to improve service while controlling costs. The number of bus deadhead hours (travel between starting points) have been significantly reduced. Select buses are now put into service as soon as they exit the garage; or at an appropriate location. By putting buses into service in this manner, passengers can be picked up sooner and not left standing at stops watching empty buses pass by. Page 5
15 YRT/Viva System Performance Key Performance Indicators System Performance System financial performance is expressed as a Revenue-to-Cost ratio The revenue-to-cost ratio (R/C) is a direct reflection of the annual expenditures relative to the system revenues. Key factors which impact R/C: Administrative/Operating Costs Fuel Costs Contract Negotiations Increase Maintenance (i.e. additional technology including PRESTO) Service Improvements (i.e. frequency) Congestion (adding travel time with no gain in ridership, maintain current ridership level) Construction (ridership loss, additional buses, re-routing, additional travel time) YRT/Viva 2010 R/C was 39% and is projected to be 38% in 2011 The Figure 6 shows the Revenue/Cost Ratio trends since Figure 6 YRT/Viva System Revenue/ Cost Ratio Page 6
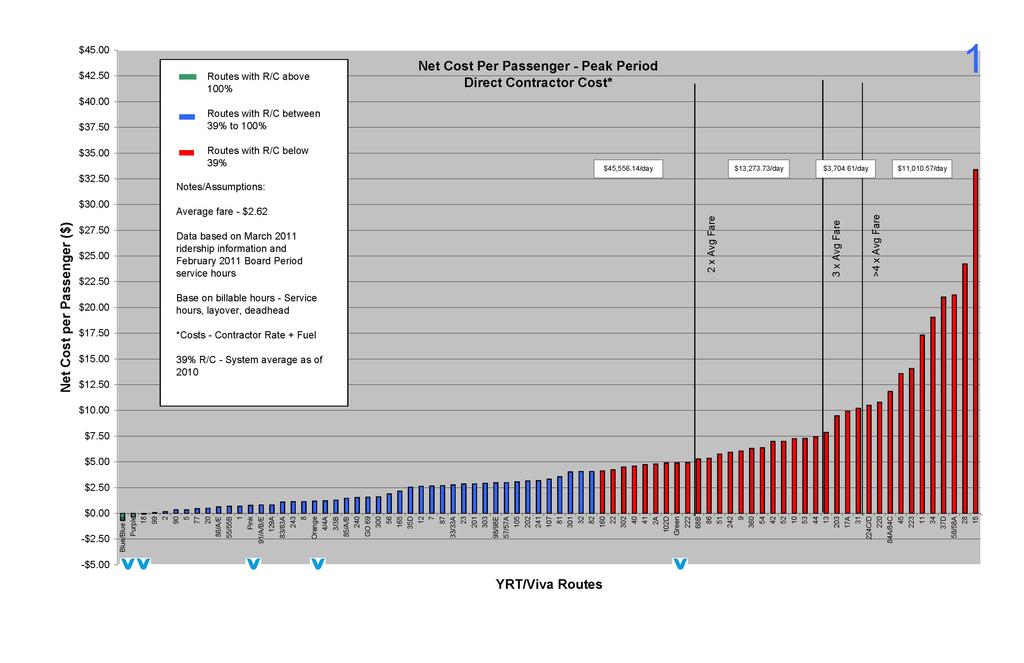
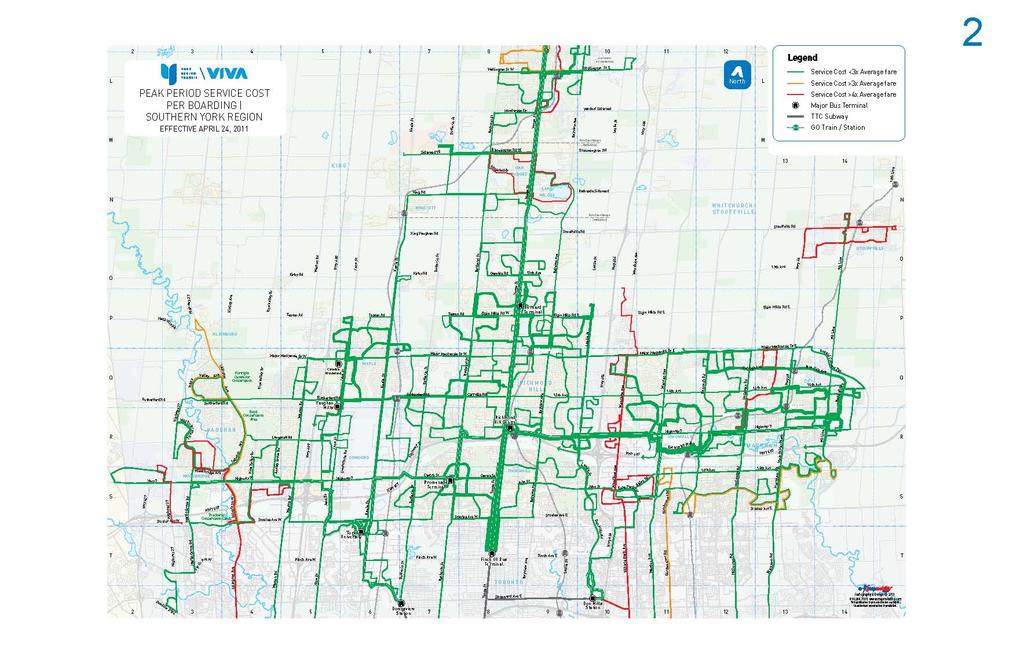
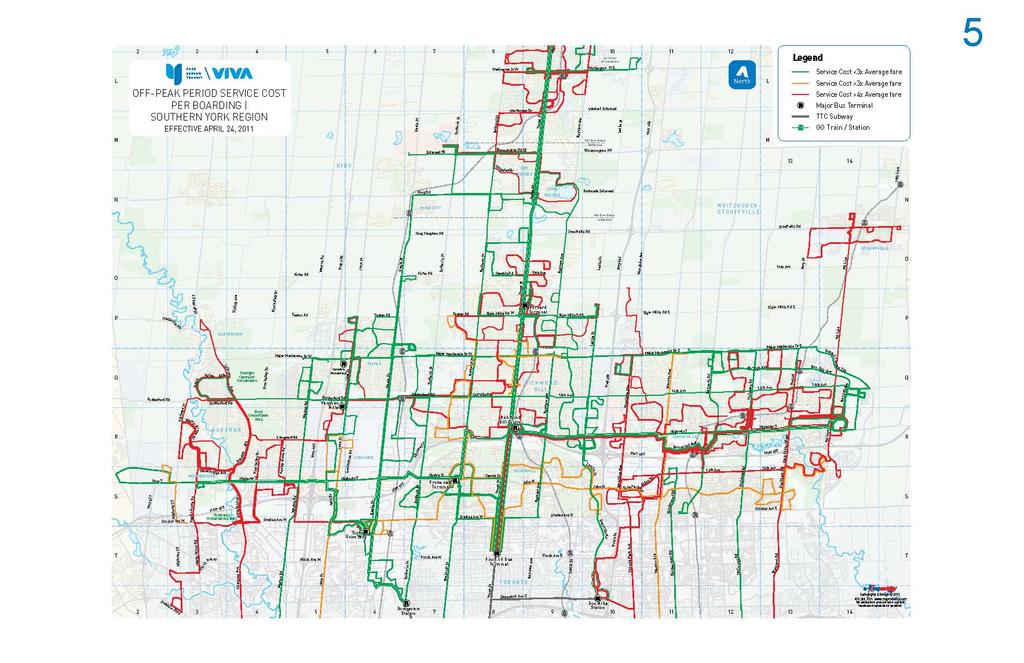
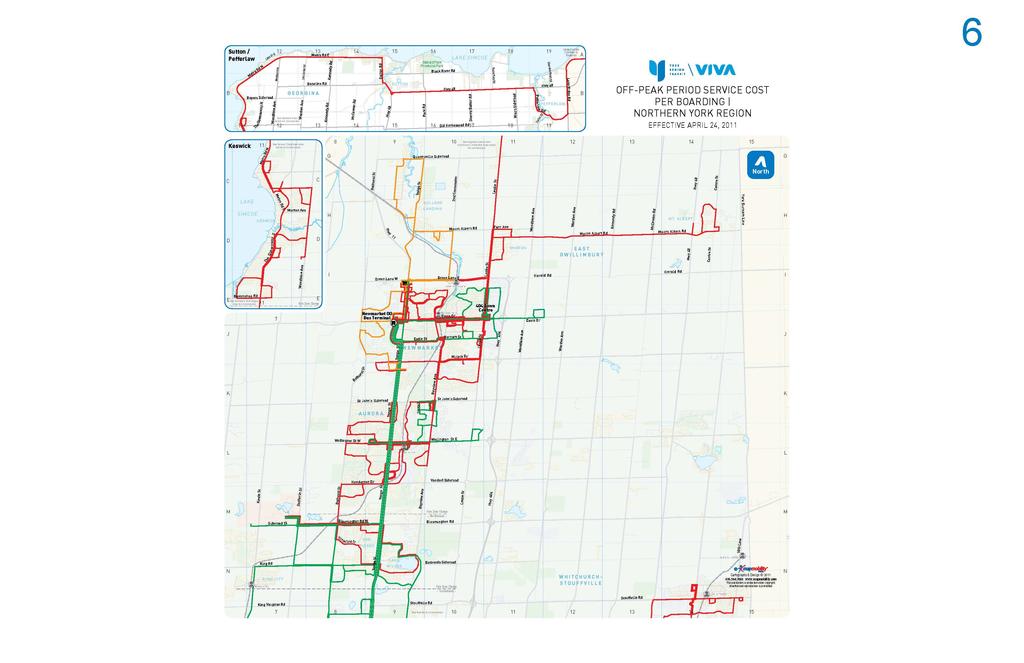
16 YRT/Viva System Performance Key Performance Indicators Figure 7 shows the R/C ratio for YRT/Viva s family of services in the Peak period (6 a.m. to 9 a.m.; 3 p.m. to 7 p.m.) and includes gross costs. Gross costs include all costs except leasing costs and debt repayment charges. Figure 7 Revenue/ Cost Ratio Peak Period Figure 8 shows the R/C ratio for YRT/Viva family of services in the Off-Peak period (Weekdays 4:35 a.m. - 6 a.m.; 9 a.m. 3 p.m.; 7 p.m. 2:40 a.m.; weekends and holidays) and includes gross costs Page 7
17 YRT/Viva System Performance Key Performance Indicators Figure 8 Revenue/ Cost Ratio Off Peak Since 2007, YRT/Viva s projected revenue ridership was 20 million; to date this target has not been achieved Factors contributing to not achieving the ridership target include: Keeping an Artificially High R/C Not Providing Service Hours to Attract Riders Low Reliability Economic Downturn Strikes (Viva September 2008 to October 2008; York U November 2008 to January 2009) Page 8
18 YRT/Viva System Performance Key Performance Indicators YRT/Viva 2010 revenue ridership of 19.4 million was the highest since amalgamation. Revenue ridership for the first quarter of 2011 was 5.3 million. This is the second consecutive quarter where YRT/Viva exceeded 5 million revenue riders Figure 9 shows revenue boarding by quarter from 2006 to 2011 Figure 9 Revenue Boardings (By Quarter ) Factors affecting Ridership include population growth, state of the economy, fuel costs and fares Between 2005 and 2010, York Region s population grew an average of 3.1% per year. In 2010, there has been a general decrease in the unemployment rate resulting in a ridership increase. The unemployment rate in February 2010 was 8.2%. In February 2011, the rate decreased to 7.8%. As more people find jobs, they tend to use public transportation to get to and from their places of employment. Page 9
19 YRT/Viva System Performance Key Performance Indicators Higher fuel prices also increase transit ridership as people try to reduce commuting costs. In April 2011, fuel prices have rose to between $1.23 and $1.39 per litre. Prices have since peaked in May 2011 to over $1.40 per litre. As fuel prices increase, there should be a corresponding increase in transit ridership. Historically, a fare increase has been followed by a reduction in ridership. In the past two years, YRT/Viva did not implement a fare increase and as a result, ridership grew. The additional riders have resulted in YRT/Viva recording its highest level of ridership to date. The 2011 year-to-date total revenue ridership growth is 9.3%. If the current ridership growth continues, the 2011 ridership is projected to reach 21 million. Figure 10 shows the ridership trends from 2007 to Figure 10 YRT/Viva Ridership Budget vs Actual 2011 Projected Ridership Page 10
20 YRT/Viva System Performance Key Performance Indicators Service adjustments are contributing to ridership growth Services are continually monitored and evaluated to better serve YRT/Viva customers. YRT/Viva uses extra buses on the busiest routes to accommodate demand. To accommodate the demand on Yonge Street; Viva Blue A, serving Newmarket to Finch Station bypassing Richmond Hill Centre Terminal (RHCT), was introduced in June It has grown from 10 trips to 24 trips a day and is scheduled to further increase in September Viva Purple between RHCT and York University now uses 60-foot articulated buses for select trips due to increasing passenger demand. Route 22A King City, serving Newmarket to York University was introduced in September 2010 and has seen its ridership increase an average of 17% monthly over the past 8 months. Page 11
21 PRESENTATION York Region Transit (YRT/Viva) System Performance Presentation to Transportation Services Committee Richard J. Leary June 15, 2011 Purpose of Presentation 1. Advise Transportation Services Committee on work to-date to better understand current transit operations based on detailed information now available from INIT technology 2. Advise Transportation Services Committee of key findings and proposed next steps 3. Receive direction on future service plans to be submitted this Fall Transportation Services Committee / June 15, 2011 Slide 2 1
22 PRESENTATION YRT/Viva Transit System Lifecycle Transportation Services Committee / June 15, 2011 Slide 3 Agenda YRT/Viva Today New Key Performance Indicators (KPI) YRT/Viva Business Performance Next Steps: Upcoming Key Decision Points for Committee and Council Transportation Services Committee / June 15, 2011 Slide 4 2

23 YRT/Viva Today 2010 Service: 121 YRT/Viva Routes - 5 Viva (BRT) - 19 YRT Base - 31 YRT Local - 11 TTC Routes - 10 GO Shuttles - 5 Express Routes - 3 Community Routes - 1 GO Route - 36 School Specials 19.4M Revenue Riders 465 Buses 58 Mobility Plus Vehicles Transportation Services Committee / June 15, 2011 Slide 5 YRT/Viva Today Factors Affecting Ridership: Population Growth to 2010, avg. 3.1%/year 6 5 Revenue Boardings (by quarter, ) Economy - Unemployment rate, April 2010: 8.1%; April 2011: 7.6%, Fuel Cost - April 2010: $ $1.02/L - April 2011: $1.23 $1.39/L Fare Increase - A fare increase is typically followed by a reduction in ridership Revenue Boardings (in Millions) Q1 Q2 Q3 Q4 Q1 Q2 Q3 Q4 Q1 Q2 Q3 Q4 Q1 Q2 Q3 Q4 Q1 Q2 Q3 Q4 Q Transportation Services Committee / June 15, 2011 Slide 6 3
 Trip data loss Driver error Technology issues attributed to number of trips not accounted")
24 New Key Performance Indicators (KPI) Trips not accounted for: INIT installed - Viva Sept 2005, YRT Conventional MobileStatistics - Tracking of trips not accounted for - Initiated April, ,060 trips were scheduled in February 2011 Reasons for unaccounted trips: Excessive delays (20 min+) Trip data loss Driver error Technology issues attributed to number of trips not accounted for Monthly Average 16,000 14,000 12,000 10,000 8,000 6,000 4,000 2,000 0 YRT/Viva Monthly Average Trips Not Accounted For 15.7% 6.4% 2.3% Transportation Services Committee / June 15, 2011 Slide 7 New Key Performance Indicators (KPI) Contractor Accountability: Implementing a new process to track trips not accounted for by category: - Mechanical breakdown - Operators sick/late min delay due to traffic - Accidents - Police, Fire, EMS emergencies YRT/Viva better manage service and reliability Improve performance and accountability by contractor Reduce passengers left at stops 60% 50% 40% 30% 20% 10% 20% 10% Percentage of Trips Not Accounted For (December 2009) A B 84A A 88E 91A 91B 91E 98/ A YRT/Viva Route Number Percentage of Trips Not Accounted For (April 2011) Transportation Services Committee / June 15, ,984 Scheduled Trips 113,984 Scheduled Trips 119,265 Scheduled Trips A E B 90B 84A A 88E 91A 91B 91E 98/99 22A A YRT/Viva Route Number Slide 8 4

 and Conventional Transportation Services Committee / June 15,")
25 New Key Performance Indicators (KPI) On-Time Performance for Viva and Conventional Routes: Departures: 2011 Goal: - 95% for Viva - 90% for Conventional Graphs to be inserted Transportation Services Committee / June 15, 2011 Slide 9 New Key Performance Indicators (KPI) On-Time Performance Target for Viva & Conventional Routes: Arrival: 2011 Goal: - 85 to 90% for Viva (BRT) and Conventional Transportation Services Committee / June 15, 2011 Slide 10 5
26 New Key Performance Indicators (KPI) Transit Service Guidelines 2006: Service Frequencies: Time (minutes) between trips Boarding per Hour: Number of passengers carried per hour Operating Period AM Peak PM Peak Service Frequency % Meeting Guideline (February 2010 vs. 2011) Year Conventional 74.4% 78.2% 71.7% 67.9% Viva (BRT) 100% 100% 100% 100% System 75.9% 79.5% 73.5% 69.9% Boardings per Revenue Hour % Meeting Guideline (February 2011) All Routes Viva (BRT) Routes GO Shuttles Peak 72.3% 100% 40% Off Peak 59.0% 80% N/A Transportation Services Committee / June 15, 2011 Slide 11 YRT/Viva Business Performance 2010 YRT/Viva System: Revenue Hours Actual vs. Budgeted ( ) $133M Operating Costs $51M Revenue 19.4M Revenue Riders 1.12M Total Revenue Vehicle Hours Transportation Services Committee / June 15, 2011 Slide 12 6
27 YRT/Viva Business Performance Revenue to Cost Ratio (R/C): - Total operating revenues divided by total direct operating expenses - Direct operating cost include: -Salaries/benefits -Advertising -Maintenance/Fuel -General Administration etc. - Not included: -Debt Service payments -Rental/lease charges 2010 YRT/Viva R/C: - 39% System 2011 anticipated R/C is 38% YRT/Viva System Revenue/ Cost Ratio Transportation Services Committee / June 15, 2011 Slide 13 YRT/Viva Business Performance YRT/Viva Ridership: From 2007 to 2010, the estimated 20 million revenue riders were not achieved 2011 year-to-date total revenue ridership growth is 10% 2011 Ridership projection (21 million if current ridership growth continues) Transportation Services Committee / June 15, 2011 Slide 14 7
 - Review of 2006 Service Guidelines - Report to Transportation Services Committee (Fall 2011) 2012 Service Plan - Route Restructuring - Begin to Develop a Grid Network -")
28 Next Steps: Upcoming Key Decision Points for Committee and Council 5-Year Service Plan - Ridership Management (retain, increase ridership) - vivanext Construction Mitigation (rapidways and Spadina Subway extension) - Review of 2006 Service Guidelines - Report to Transportation Services Committee (Fall 2011) 2012 Service Plan - Route Restructuring - Begin to Develop a Grid Network - Rationalizing Service - Report to Transportation Services Committee (Fall 2011) New KPI monthly reports - Trips Not Accounted For, Arrival And Departure On-time Performance, Monthly/Quarterly Ridership - New Transportation Status Reports (Fall 2011) Transportation Services Committee / June 15, 2011 Slide 15 8
29
30
31
32
33
34
Transit System Performance Update
 Clause 5 in Report No. 4 of Committee of the Whole was adopted, without amendment, by the Council of The Regional Municipality of York at its meeting held on March 29, 2018. 5 2017 Transit System Performance
8 CROSS-BOUNDARY AGREEMENT WITH BRAMPTON TRANSIT
 8 CROSS-BOUNDARY AGREEMENT WITH BRAMPTON TRANSIT The Transportation Services Committee recommends the adoption of the recommendations contained in the following report dated May 27, 2010, from the Commissioner
YRT/VIVA PROPOSED FARE INCREASE
 Report No. 7 of the Transportation Services Committee Regional Council Meeting of September 22, 1 2012 YRT/VIVA PROPOSED FARE INCREASE The Transportation Services Committee recommends: 1. Receipt of the
2016 Annual Service Plan
 YRT/Viva Five-Year Strategic Plan 2016 Annual Service Plan Presentation to the City of Markham Development Services Committee November 16, 2015 Adrian Kawun Overview 1. System Overview YRT/Viva Services
4 YORK REGION TRANSIT DON MILLS SUBWAY STATION ACCESS AGREEMENT
 4 YORK REGION TRANSIT DON MILLS SUBWAY STATION ACCESS AGREEMENT The Transit Committee recommends the adoption of the recommendations contained in the following report, September 20, 2007, from the General
2017/2018 Q3 Performance Measures Report. Revised March 22, 2018 Average Daily Boardings Comparison Chart, Page 11 Q3 Boardings figures revised
 2017/2018 Q3 Performance Measures Report Revised March 22, 2018 Average Daily Boardings Comparison Chart, Page 11 Q3 Boardings figures revised Contents Ridership & Revenue... 1 Historical Revenue & Ridership...
2 YORK REGION TRANSIT MOBILITY PLUS 2004 SYSTEM PERFORMANCE REVIEW
 2 YORK REGION TRANSIT MOBILITY PLUS 2004 SYSTEM PERFORMANCE REVIEW The Joint Transit Committee and Rapid Transit Public/Private Partnership Steering Committee recommends the adoption of the recommendation
14 YORK REGION TRANSIT (YRT/VIVA) SOUTHWEST DIVISION OPERATIONS AND MAINTENANCE CONTRACT EXTENSION
 SOUTHWEST DIVISION OPERATIONS AND MAINTENANCE CONTRACT EXTENSION") Clause No. 14 in Report No. 13 of the was adopted, without amendment, by the Council of The Regional Municipality of York at its meeting held on September 11, 2014. 14 YORK REGION TRANSIT (YRT/VIVA) SOUTHWEST
Clause No. 14 in Report No. 13 of the was adopted, without amendment, by the Council of The Regional Municipality of York at its meeting held on September 11, 2014. 14 YORK REGION TRANSIT (YRT/VIVA) SOUTHWEST
The Importance of Service Frequency to Attracting Ridership: The Cases of Brampton and York
 The Importance of Service Frequency to Attracting Ridership: The Cases of Brampton and York Jonathan English Columbia University CUTA Conference May 2016 Introduction Is density the most important determinant
CITY OF VAUGHAN EXTRACT FROM COUNCIL MEETING MINUTES OF JANUARY 25, 2011
 Item 1, Report No. 1, of the Priorities and Key Initiatives Committee, which was adopted without amendment by the Council of the City of Vaughan on January 25,. 1 RAPID TRANSIT UPDATE TORONTO-YORK SPADINA
2017/ Q1 Performance Measures Report
 2017/2018 - Q1 Performance Measures Report Contents Ridership & Revenue... 1 Historical Revenue & Ridership... 1 Revenue Actual vs. Planned... 3 Mean Distance Between Failures... 5 Maintenance Cost Quarter
9 VIVA DIRECT UNDERGROUND CONNECTION TO THE TORONTO-YORK SPADINA SUBWAY EXTENSION AT THE VAUGHAN METROPOLITAN CENTRE
 9 VIVA DIRECT UNDERGROUND CONNECTION TO THE TORONTO-YORK SPADINA SUBWAY EXTENSION AT THE VAUGHAN METROPOLITAN CENTRE The Finance and Administration Committee recommends the adoption of the recommendations
1 SUBWAY EXTENSION TO VAUGHAN CORPORATE CENTRE - OPERATING AGREEMENT UPDATE
 1 Report No. 1 of the Chief Administrative Officer Regional Council Meeting of June 21, 2007 THE REGIONAL MUNICIPALITY OF YORK REPORT NO. 1 OF THE REGIONAL CHIEF ADMINISTRATIVE OFFICER For Consideration
Attachment C: 2017/2018 Halifax Transit Year End Performance Report. 2017/2018 Year End Performance Measures Report
 Attachment C: 2017/2018 Halifax Transit Year End Performance Report 2017/2018 Year End Performance Measures Report Contents Annual Key Performance Indicators (KPIs)... 1 Weekday Cost per Passenger... 1
Date: 11/6/15. Total Passengers
 Total San Diego Metropolitan Transit System POLICY 42 PERFORMANCE MONITORING REPORT Page 1 of 6 OBJECTIVE Develop a Customer-Focused and Competitive System The following measures of productivity and service
2017 Annual Service Plan
 2017 Annual Service Plan 2017 Annual Service Plan 2017 Annual Service Plan Objectives Transition to a Frequent Transit Network (FTN) with a strong grid network Preparing the Viva Network Expansion Plan
2 YORK REGION TRANSIT VEOLIA AGREEMENT AMENDMENT 91 CALDARI ROAD
 2 YORK REGION TRANSIT VEOLIA AGREEMENT AMENDMENT 91 CALDARI ROAD The Transit Committee recommends the following: 1. Receipt of the presentation by Rick Takagi, Manager, Operations, York Region Transit;
PERFORMANCE REPORT NOVEMBER 2017
 PERFORMANCE REPORT NOVEMBER 2017 Note: New FY2018 Goal/Target/Min or Max incorporated in the Fixed Route and Connection Dashboards. Keith A. Clinkscale Performance Manager INTRODUCTION/BACKGROUND In June
MONTHLY OPERATIONS REPORT SEPTEMBER 2015
 MONTHLY OPERATIONS REPORT SEPTEMBER 215 Table of Contents SEPTEMBER 215 Section Page September Highlights... 3 Strategic Goals Progress Update... 4 Ridership... 6 Revenue... 9 Expenses... 1 System Summary...
KING STREET TRANSIT PILOT
 KING STREET TRANSIT PILOT Update toronto.ca/kingstreetpilot #kingstreetpilot HIGHLIGHTS TRANSIT RIDERSHIP TRANSIT CAPACITY To respond to this growth in ridership, the TTC has increased the capacity of
PERFORMANCE REPORT DECEMBER 2017
 PERFORMANCE REPORT DECEMBER 2017 Note: New FY2018 Goal/Target/Min or Max incorporated in the Fixed Route and Connection Dashboards. Keith A. Clinkscale Performance Manager INTRODUCTION/BACKGROUND Keith
Att. A, AI 46, 11/9/17
 Total s San Diego Metropolitan Transit System POLICY 42 PERFORMANCE MONITORING REPORT Page 1 of 6 Date: 11/8/17 OBJECTIVE Develop a Customer-Focused and Competitive System The following measures of productivity
SAMTRANS TITLE VI STANDARDS AND POLICIES
 SAMTRANS TITLE VI STANDARDS AND POLICIES Adopted March 13, 2013 Federal Title VI requirements of the Civil Rights Act of 1964 were recently updated by the Federal Transit Administration (FTA) and now require
Transit in Toronto. Chair Adam Giambrone Sunday, October
 Chair Adam Giambrone Sunday, October 19 2008 1 TTC is a City of Toronto Commission Transit in Toronto 2 2 Serving Toronto since 1921 Transit in Toronto 3 3 Canada s largest transit agency Annual customer-trips,
MEETING DATE: February 17, 2010 SUBJECT: ACTION ITEM TORONTO TRANSIT COMMISSION REPORT NO. ACCESSIBLE TRANSIT SERVICES PLAN: 2009 STATUS REPORT
 TORONTO TRANSIT COMMISSION REPORT NO. MEETING DATE: February 17, 2010 SUBJECT: ACCESSIBLE TRANSIT SERVICES PLAN: 2009 STATUS REPORT ACTION ITEM RECOMMENDATION It is recommended that the Commission forward
MONTHLY OPERATIONS REPORT DECEMBER 2015
 MONTHLY OPERATIONS REPORT DECEMBER 215 Table of Contents DECEMBER 215 Section Page December Highlights... 3 Strategic Goals Progress Update... 4 Ridership... 6 Revenue... 9 Expenses... 1 System Summary...
York Region Rapid Transit Corporation Board of Directors. Mary-Frances Turner, President
 Meeting of the Board of Directors On June 9, 2011 To: From: Subject: Ref: York Region Rapid Transit Corporation Board of Directors Mary-Frances Turner, President Spadina Subway Project Update YORK-#3369547
CURRENT SHORT-RANGE TRANSIT PLANNING PRACTICE. 1. SRTP -- Definition & Introduction 2. Measures and Standards
 CURRENT SHORT-RANGE TRANSIT PLANNING PRACTICE Outline 1. SRTP -- Definition & Introduction 2. Measures and Standards 3. Current Practice in SRTP & Critique 1 Public Transport Planning A. Long Range (>
General Issues Committee Item Transit Operating Budget Ten Year Local Transit Strategy
 General Issues Committee Item 4.1 2017 Transit Operating Budget Ten Year Local Transit Strategy January 27, 2017 Presentation Outline 2017 Operating Budget Overview Ten Year Local Transit Strategy 2 2017
EX28.6 REPORT FOR ACTION. Advancing Fare Integration SUMMARY. Date: October 16, 2017 To: Executive Committee From: City Manager Wards: All
 EX28.6 REPORT FOR ACTION Advancing Fare Integration Date: October 16, 2017 To: Executive Committee From: City Manager Wards: All SUMMARY In July 2016, City Council considered a current state assessment
YOSEMITE AREA REGIONAL TRANSPORTATION SYSTEM
 YOSEMITE AREA REGIONAL TRANSPORTATION SYSTEM Short Range Transit Plan Prepared for the Merced County Association of Governments/YARTS Prepared by LSC Transportation Consultants, Inc. YOSEMITE AREA REGIONAL
TORONTO TRANSIT COMMISSION REPORT NO.
 Revised: March/13 TORONTO TRANSIT COMMISSION REPORT NO. MEETING DATE: SUBJECT: Resubmitted: November 18, 2013 October 23, 2013 TTC Fare Policy - Requests for Fare Discounts ACTION ITEM RECOMMENDATION It
VCTC Transit Ridership and Performance Measures Quarterly Report
 VCTC Transit Ridership and Performance Measures Quarterly Report Overview Quarter 2 Fiscal Year 2018-2019 This report provides performance measures for VCTC Intercity Bus Service covering the FY 2018-19
STAFF REPORT INFORMATION ONLY
 Insert TTC logo here STAFF REPORT INFORMATION ONLY Outstanding Board Items Date: February 25, 2016 To: From: TTC Board Chief Executive Officer Summary A status update on outstanding items is submitted
Chapter 3. Burke & Company
 Chapter 3 Burke & Company 3. WRTA RIDERSHIP AND RIDERSHIP TRENDS 3.1 Service Overview The Worcester Regional Transit Authority (WRTA) provides transit service to over half a million people. The service
TRANSPORTATION SERVICE Actual
 PERFORMANCE REPORT-THIRD QUARTER VISION TO DELIVER REGIONAL MULTI-MODAL TRANSPORTATION SERVICES AND INFRASTRUCTURE IMPROVEMENTS THAT SIGNIFICANTLY AND CONTINUALLY INCREASE TRANSIT MARKET SHARE. MISSION
Ridership Growth Strategy (RGS) Status Update
 Status Update") For Information Ridership Growth Strategy (RGS) Status Update Date: July 10, 2018 To: TTC Board From: Deputy Chief Executive Officer Summary The TTC s Ridership Growth Strategy (RGS), with all its components,
For Information Ridership Growth Strategy (RGS) Status Update Date: July 10, 2018 To: TTC Board From: Deputy Chief Executive Officer Summary The TTC s Ridership Growth Strategy (RGS), with all its components,
Sound Transit Operations August 2015 Service Performance Report. Ridership
 Ridership Total Boardings by Mode Mode Aug-14 Aug-15 % YTD-14 YTD-15 % ST Express 1,534,241 1,553,492 1.3% 11,742,839 12,354,957 5.2% Sounder 275,403 326,015 18.4% 2,139,086 2,463,422 15.2% Tacoma Link
Kathleen Llewellyn-Thomas, Commissioner of Transportation Services
 Transportation Services Department MEMORANDUM TO: FROM: Transportation Services Committee Kathleen Llewellyn-Thomas, Commissioner of Transportation Services DATE: January 21, 2011 RE: December 2010 Transit
Capacity Improvements on Bus and Subway Services
 For Action Capacity Improvements on Bus and Subway Services Date: May 8, 2018 To: TTC Board From: Chief Customer Officer Summary On February 12, 2018 Mayor Tory and TTC Chair Colle announced a Ten-Point
Sound Transit Operations June 2016 Service Performance Report. Ridership
 Ridership Total Boardings by Mode Mode Jun-15 Jun-16 % YTD-15 YTD-16 % ST Express 1,622,222 1,617,420-0.3% 9,159,934 9,228,211 0.7% Sounder 323,747 361,919 11.8% 1,843,914 2,099,824 13.9% Tacoma Link 75,396
APPENDIX 2 TORONTO TRANSIT COMMISSION SERVICE STANDARDS AND DECISION RULES FOR PLANNING TRANSIT SERVICE
 APPENDIX 2 TORONTO TRANSIT COMMISSION SERVICE STANDARDS AND DECISION RULES FOR PLANNING TRANSIT SERVICE Contents 1 Introduction... 1 2 Network Design Standards... 2 2.1 Transit Service Classifications...
METROBUS SERVICE GUIDELINES
 METROBUS SERVICE GUIDELINES In the late 1990's when stabilization of bus service was accomplished between WMATA and the local jurisdictional bus systems, the need for service planning processes and procedures
Bus Operations Report
 Third Quarter FY 216 (January 1 - March 31, 216) Wednesday April 27, 216 Operations Ridership: 783,194 passengers used in the third quarter. This represents a 2% increase over the same period in FY 215.
Sound Transit Operations January 2018 Service Performance Report. Ridership
 January 218 Service Performance Report Ridership Total Boardings by Mode Jan-17 Jan-18 % YTD-17 YTD-18 % ST Express 1,3,33 1,7,91.3% 1,3,33 1,7,91.3% Sounder 367,33 416,8 13.3% 367,33 416,8 13.3% Tacoma
York Region Rapid Transit Corporation. City of Vaughan VMC Sub-Committee October 18, 2017
 York Region Rapid Transit Corporation City of Vaughan VMC Sub-Committee October 18, 2017 0 Agenda Construction update >> current projects in Vaughan > Bathurst & Centre > Highway 7 West > Highway 7 Vaughan
New System. New Routes. New Way. May 20, 2014
 Route Optimization I N I T I A T I V E New System. New Routes. New Way. May 20, 2014 1 Welcome Blueprint for Transportation Excellence (BTE) 20 year strategic plan Blueprint 2020 JTA s five-year plan for
GOVERNMENT PARTNERSHIP CELEBRATES LAUNCH OF ZÜM BUS RAPID TRANSIT SERVICE IN BRAMPTON
 No. H105/10 For release September 17, 2010 GOVERNMENT PARTNERSHIP CELEBRATES LAUNCH OF ZÜM BUS RAPID TRANSIT SERVICE IN BRAMPTON BRAMPTON, ONTARIO David Tilson, Member of Parliament for Dufferin-Caledon;
4 VIVA PHASE 2 YONGE STREET - Y2, AND HIGHWAY 7 - H3 CORRIDORS PRELIMINARY ENGINEERING UPDATE
 4 VIVA PHASE 2 YONGE STREET - Y2, AND HIGHWAY 7 - H3 CORRIDORS PRELIMINARY ENGINEERING UPDATE The Rapid Transit Public/Private Partnership Steering Committee recommends the following: 1. The presentation
ATTACHMENT A.7. Transit Division Performance Measurements Report Fiscal Year Fourth Quarter
 TTCHMENT.7 Transit Division Performance Measurements Report Fiscal Year 2012-13 Fourth Quarter Introduction The Orange County Transportation uthority (OCT) operates a countywide network of local, community,
Fare Policy Discussion Background and History
 Fare Policy Discussion Background and History Transportation Committee Nick Eull Senior Manager of Revenue Operations February 27 th, 2017 2013 Fare Policy Analysis Report Cross-functional group comprised
FIXED ROUTE DASHBOARD JULY 2018
 FIXED ROUTE DASHBOARD JULY 2018 Safety Max Target Goal Preventable Collisions per 100k Miles Non-Preventable Collisions per 100k Miles Total Incidents per 10,000 Boardings 1.6 1.3 0.8 2.63 2.1 2.0 1.60
2018 OPERATING BUDGET BRIEFING NOTE Toronto Transit Commission: Options to Address Bus Overcrowding, Bus Availability & Garage Storage Capacity
 BN# 39 Jan 12 Richard Leary Acting CEO Toronto Transit Commission Toronto Transit Commission 1900 Yonge Street, Toronto, Ontario, M4S1Z2 Tel: (416) 393-3890 Fax: (416) 488-6198 Richard.Leary@ttc.ca www.ttc.ca
Sound Transit Operations March 2018 Service Performance Report. Ridership
 March 218 Service Performance Report Ridership Total Boardings by Mode Mar-17 Mar-18 % YTD-17 YTD-18 % ST Express 1,622,116 1,47,79-4.6% 4,499,798 4,428,14-1.6% Sounder 393,33 39,6.% 1,74,96 1,163,76 8.3%
Sound Transit Operations January 2017 Service Performance Report. Ridership. Total Boardings by Mode
 January 217 Service Performance Report Ridership ST Express Sounder Tacoma Link Link Paratransit Jan-16 Jan-17 % 1,433,7 1,3,33 4.9% 331,27 7,121 98,411 3,633 Total Boardings by Mode 363,6 74,823 1,76,914
P.O. Box 1749 Halifax, Nova Scotia B3J 3A5 Canada Item No Transportation Standing Committee October 25, 2018
 P.O. Box 1749 Halifax, Nova Scotia B3J 3A5 Canada Item No. 12.1.2 Transportation Standing Committee October 25, 2018 TO: Chair and Members of Transportation Standing Committee SUBMITTED BY: Original Signed
PERFORMANCE REPORT DECEMBER Performance Management Office
 PERFORMANCE REPORT DECEMBER 2018 Performance Management Office INTRODUCTION/BACKGROUND Performance Management Office FIXED ROUTE DASHBOARD FY 2019 Safety Max Target Goal Preventable Collisions per 100k
LA Metro Rapid - Considerations in Identifying BRT Corridors. Martha Butler LACMTA, Transportation Planning Manager Los Angeles, California
 LA Metro Rapid - Considerations in Identifying BRT Corridors Martha Butler LACMTA, Transportation Planning Manager Los Angeles, California LA Metro Transportation planner/coordinator, designer, builder
TransAction Overview. Introduction. Vision. NVTA Jurisdictions
 Introduction Vision NVTA Jurisdictions In the 21 st century, Northern Virginia will develop and sustain a multimodal transportation system that enhances quality of life and supports economic growth. Investments
PERFORMANCE REPORT JANUARY Keith A. Clinkscale Performance Manager
 PERFORMANCE REPORT JANUARY 2018 Keith A. Clinkscale Performance Manager INTRODUCTION/BACKGROUND Keith A. Clinkscale Performance Manager FIXED ROUTE DASHBOARD JANUARY 2018 Safety Max Target Goal Preventable
TORONTO TRANSIT COMMISSION REPORT NO.
 Form Revised: February 2005 TORONTO TRANSIT COMMISSION REPORT NO. MEETING DATE: May 6, 2010 SUBJECT: LAKE SHORE BOULEVARD STREETCAR SERVICE ACTION ITEM RECOMMENDATION It is recommended that the Commission
Quarterly Report Transit Bureau, Local Transit Operations. First Quarter, Fiscal Year 2015 (July 2014 September 2014) ART & STAR
 ART & STAR") Quarterly Report Transit Bureau, Local Transit Operations First Quarter, Fiscal Year 2015 (July 2014 September 2014) ART & STAR A Arlington Transit ART 1) Introduction The purpose of ART is to provide
Quarterly Report Transit Bureau, Local Transit Operations First Quarter, Fiscal Year 2015 (July 2014 September 2014) ART & STAR A Arlington Transit ART 1) Introduction The purpose of ART is to provide
Establishes a fare structure for Tacoma Link light rail, to be implemented in September 2014.
 RESOLUTION NO. R2013-24 Establish a Fare Structure and Fare Level for Tacoma Link MEETING: DATE: TYPE OF ACTION: STAFF CONTACT: PHONE: Board 09/26/2013 Final Action Ric Ilgenfritz, Executive Director,
Why we re here: For educational purposes only
 Transportation 2050 Why we re here: For educational purposes only Transportation 2050 Bus Elements PUBLIC TRANSIT DEPARTMENT City of Phoenix Citizens Committee on the Future of Phoenix Transportation (CCFPT)
Board of Directors Information Summary
 Regional Public Transportation Authority 302 N. First Avenue, Suite 700, Phoenix, Arizona 85003 602-262-7433, Fax 602-495-0411 Board of Directors Information Summary Agenda Item #6 Date July 11, 2008 Subject
TORONTO TRANSIT COMMISSION REPORT NO. SUBJECT: TORONTO-YORK SPADINA SUBWAY EXTENSION STATION NAMES IN THE CITY OF VAUGHAN
 TORONTO TRANSIT COMMISSION REPORT NO. MEETING DATE: February 29, 2011 SUBJECT: TORONTO-YORK SPADINA SUBWAY EXTENSION STATION NAMES IN THE CITY OF VAUGHAN ACTION ITEM RECOMMENDATIONS It is recommended that
COMMITTEE OF THE WHOLE (WORKING SESSION) APRIL 19, 2011 YORK REGION RAPID TRANSIT HIGHWAY 7 BUS RAPID TRANSIT- VMC STATION WARD 4.
 APRIL 19, 2011 YORK REGION RAPID TRANSIT HIGHWAY 7 BUS RAPID TRANSIT- VMC STATION WARD 4.") COMMITTEE OF THE WHOLE (WORKING SESSION) APRIL 19, 2011 YORK REGION RAPID TRANSIT HIGHWAY 7 BUS RAPID TRANSIT- VMC STATION WARD 4 Recommendation The Commissioner of Engineering and Public Works and the
COMMITTEE OF THE WHOLE (WORKING SESSION) APRIL 19, 2011 YORK REGION RAPID TRANSIT HIGHWAY 7 BUS RAPID TRANSIT- VMC STATION WARD 4 Recommendation The Commissioner of Engineering and Public Works and the
Sound Transit Operations February 2018 Service Performance Report. Ridership
 February 218 Service Performance Report Ridership Total Boardings by Mode Feb-17 Feb-18 % YTD-17 YTD-18 % ST Express 1,373,96 1,372,88 -.1% 2,877,294 2,88,719.1% Sounder 314,96 32,187 11.9% 681,923 768,69
Request to Improve Transit along the Dufferin Street Corridor
 For Action Request to Improve Transit along the Dufferin Street Corridor Date: July 10, 2018 To: TTC Board From: Chief Customer Officer Summary The 29 Dufferin bus route is one of the top five busiest
SRTA Year End Fixed Route Ridership Analysis: FY 2018
 SRTA Year End Fixed Route Ridership Analysis: FY 2018 2018 Contents Introduction... 1 A. Key Terms Used in this Report... 1 Key Findings... 2 A. Ridership... 2 B. Fare Payment... 4 Performance Analysis
Terms of Reference: Introduction
 Terms of Reference: Assessment of airport-airline engagement on the appropriate scope, design and cost of new runway capacity; and Support in analysing technical responses to the Government s draft NPS
Sound Transit Operations January 2014 Service Performance Report. Ridership
 Ridership Total Boardings by Mode Mode Jan-13 Jan-14 % YTD-13 YTD-14 % ST Express 1,343,290 1,426,928 6.2% 1,343,290 1,426,928 6.2% Sounder 245,135 256,775 4.7% 245,135 256,775 4.7% Tacoma Link 86,229
York Region Rapid Transit Corporation. York Region Council Presentation April 23, 2015 York Region Administrative Building Council Chambers
 York Region Rapid Transit Corporation 0 York Region Council Presentation April 23, 2015 York Region Administrative Building Council Chambers 2014 Annual Report April 2015 1 2014 Annual Report - Overview
Key Statistical Indicator For The International Airports Operator In PPP/BOT/Project Finance Environment
 Key Statistical Indicator For The International Airports Operator In PPP/BOT/Project Finance Environment Introduction Taken over airports in emerging markets and in immature environments (but not always
SKAGIT COUNTY PUBLIC WORKS DEPARTMENT Ferry Operations Division Ferry Fare Revenue Target Report
 SKAGIT COUNTY PUBLIC WORKS DEPARTMENT Ferry Operations Division 2018 Ferry Fare Revenue Target Report Skagit County Public Works Department 2018 Ferry Fare Revenue Target Report The following report is
EUROCONTROL and the Airport Package
 European Economic and Social Committee Public Hearing Brussels, 20 February 2012 EUROCONTROL and the Airport Package François HUET EUROCONTROL Directorate Single Sky, Performance Review Unit The European
Ozaukee County Transit Development Plan
 Ozaukee County Transit Development Plan Record of Public Comments and Recommended Transit Service Plan June 5, 2018 Kevin Muhs Deputy Director #242846 Status of the Transit Development Plan Existing Conditions
Transport Indicators Report June 2018
 Transport Indicators Report June 2018 Board Meeting 21 August 2018 Recommendation That the Board: i. Receives this report. Executive summary 1. The attached Monthly and Quarterly Indicator Reports provide
UK Experience with Bus Restructuring
 UK Experience with Bus Restructuring Outline 1. Background 2. Bus Deregulation outside London 3. London strategy 4. Results to date 5. Edinburgh Case Study 1 Background Prior to mid-1980s, UK local bus
TORONTO TRANSIT COMMISSION REPORT NO.
 Revised: March/13 TORONTO TRANSIT COMMISSION REPORT NO. MEETING DATE: November 18, 2013 SUBJECT: YONGE-EGLINTON AND EGLINTON WEST INTERCHANGE STATIONS METROLINX EGLINTON CROSSTOWN LIGHT RAIL TRANSIT PROJECT
Lessons Learned from Rebuilding the Muni Subway Schedule Leslie Bienenfeld
 Lessons Learned from Rebuilding the Muni Subway Schedule Leslie Bienenfeld Manager of Fixed Guideway Scheduling San Francisco Municipal Transportation Agency San Francisco, California SFMTA & the Municipal
About This Report GAUGE INDICATOR. Red. Orange. Green. Gold
 ATTACHMENT A About This Report The Orange County Transportation Authority (OCTA) operates a countywide network of local, community, rail connector, and express bus routes serving over 6, bus stops. OCTA
RACINE COUNTY PUBLIC TRANSIT PLAN:
 RACINE COUNTY PUBLIC TRANSIT PLAN: 2013-2017 Recommended Transit Service Improvement Plan NEWSLETTER 3 SEPTEMBER 2013 This newsletter describes the final recommended public transit plan for the City of
Operational Performance
 Customer Services, Operations, and Safety Committee Board Action/Information Item III-A January 10, 2008 Operational Washington Metropolitan Area Transportation Authority Board Action/Information Summary
COUNCIL AGENDA REPORT
 COUNCIL AGENDA REPORT Meeting Date: 6 June 2016 Subject: Boards Routed Through: 2017 Airdrie Transit s Community Services Advisory Board Date: 9 May 2016 Issue: Council is being asked to endorse the 2017
APPENDIX B COMMUTER BUS FAREBOX POLICY PEER REVIEW
 APPENDIX B COMMUTER BUS FAREBOX POLICY PEER REVIEW APPENDIX B COMMUTER BUS FAREBOX POLICY PEER REVIEW The following pages are excerpts from a DRAFT-version Fare Analysis report conducted by Nelson\Nygaard
DRAFT Service Implementation Plan
 2017 Service Implementation Plan October 2016 SECTION NAME 2017 Service Implementation Plan October 2016 2017 SERVICE IMPLEMENTATION PLAN TABLE OF CONTENTS Table of Contents... I List of Tables... III
Sound Transit Operations December 2014 Service Performance Report. Ridership
 Ridership Total Boardings by Mode Mode Dec-13 Dec-14 % YTD-13 YTD-14 % ST Express 1,266,130 1,396,787 10.3% 16,605,299 17,661,976 6.4% Sounder 248,710 285,016 14.6% 3,035,735 3,361,317 10.7% Tacoma Link
Peer Performance Measurement February 2019 Prepared by the Division of Planning & Market Development
 2017 Regional Peer Review Peer Performance Measurement February 2019 Prepared by the Division of Planning & Market Development CONTENTS EXECUTIVE SUMMARY... 3 SNAPSHOT... 5 PEER SELECTION... 6 NOTES/METHODOLOGY...
Thank you for participating in the financial results for fiscal 2014.
 Thank you for participating in the financial results for fiscal 2014. ANA HOLDINGS strongly believes that safety is the most important principle of our air transportation business. The expansion of slots
Juneau Comprehensive Operations Analysis and Transit Development Plan DRAFT RECOMMENDATIONS January 2014
 Juneau Comprehensive Operations Analysis and Transit Development Plan DRAFT RECOMMENDATIONS January 2014 Tonight s Agenda System Strengths & Weaknesses Service Improvement Objectives Draft Recommendations
KING STREET TRANSIT PILOT
 KING STREET TRANSIT PILOT Update toronto.ca/kingstreetpilot #kingstreetpilot UPDATE Average streetcar travel times in continued to show similar trends as first observed in November. The most significant
SUB-REGIONAL PERFORMANCE MEASURES
 SUB-REGIONAL PERFORMANCE MEASURES 29 REPORT Overall regional performance is a function of five major areas: Service Coverage - monitors both how much service is available to people in the region (in terms
FY Transit Needs Assessment. Ventura County Transportation Commission
 FY 18-19 Transit Needs Assessment Ventura County Transportation Commission Contents List of Figures and Appendices.. 2 Appendices... 1 Chapter 1: Introduction What is the Ventura County Transportation
Analysis of Transit Fare Evasion in the Rose Quarter
 Analysis of Transit Fare Evasion in the Rose Quarter Shimon A. Israel James G. Strathman February 2002 Center for Urban Studies College of Urban and Public Affairs Portland State University Portland, OR
TORONTO TRANSIT COMMISSION REPORT NO.
 Form Revised: February 2005 TORONTO TRANSIT COMMISSION REPORT NO. MEETING DATE: March 1, 2011 SUBJECT: PROCUREMENT AUTHORIZATION AMENDMENT CONTRACT AMENDMENT NO. 8 ACTION ITEM RECOMMENDATION It is recommended
MUSKEGON AREA TRANSIT SYSTEM PROPOSAL FOR FARE AND SERVICE ADJUSTMENTS TO BE PHASED IN BEGINNING JANUARY 1, 2018
 MUSKEGON AREA TRANSIT SYSTEM PROPOSAL FOR FARE AND SERVICE ADJUSTMENTS TO BE PHASED IN BEGINNING JANUARY 1, 2018 The Muskegon Area Transit System is proposing a series of System Adjustments to be implemented
Capital Metropolitan Transportation Authority. Monthly Performance Report
 Capital Metropolitan Transportation Authority Monthly Performance Report AUGUST 2010 Ridership Report August 23, 2010 Budget to Actual Ridership Budget Target: 2,290,590 Actual: 2,300,796 Ridership Comparison
AGENDA Addendum 1 Special Meeting of the Board of City Commissioners June 6, :30 pm City Hall Williston, North Dakota
 AGENDA Addendum 1 Special Meeting of the Board of City Commissioners June 6, 2018-3:30 pm City Hall Williston, North Dakota 1. Roll Call of Commissioners 2. Farm Plan Group 1 Bid Award 3. Farm Plan Group
P.O. Box 1749 Halifax, Nova Scotia B3J 3A5 Canada Item No. 2 Halifax Regional Council November 13, 2018
 P.O. Box 1749 Halifax, Nova Scotia B3J 3A5 Canada Item No. 2 Halifax Regional Council November 13, 2018 TO: SUBMITTED BY: Mayor Savage and Members of Halifax Regional Council Original Signed Councillor