The Importance of Service Frequency to Attracting Ridership: The Cases of Brampton and York
|
|
|
- Terence Scott
- 5 years ago
- Views:
Transcription
1 The Importance of Service Frequency to Attracting Ridership: The Cases of Brampton and York Jonathan English Columbia University CUTA Conference May 2016
2 Introduction Is density the most important determinant of transit system success? Can transit be successful in areas with relatively low density and a suburban built form? Do service increases and reductions affect ridership? The goal is to find natural experiments that can answer these questions
3 The Region Source: Wikimedia


4 The Comparison York Region Transit Focused expansion on major corridors, including pioneering Viva BRT Tailored service to demand on secondary corridors Brampton Transit Developed grid network of high-service bus routes


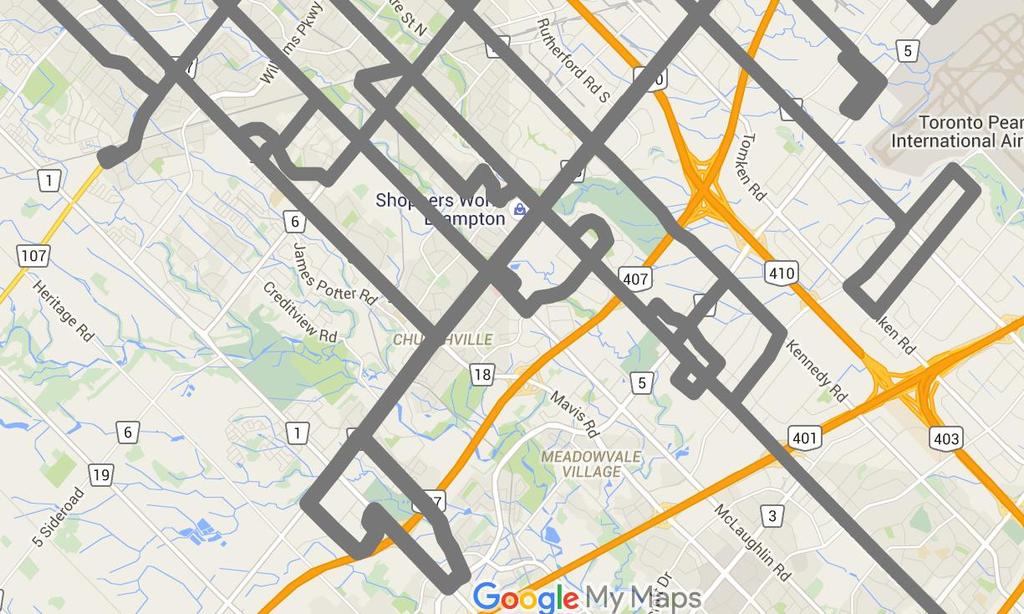
5 High Frequency Routes York Brampton Green = 20 Min Max Headway to Midnight, Mon to Sat (to 10pm on Sun) Grey = 20 Min Max Headway to Midnight, Mon to Sat (to 10pm on Sun) Source: Public Schedules and Google Earth
6 Principal Findings Increased service improves ridership performance Network effect means that comprehensive network of high-service routes, rather than focus on select corridors, produces largest ridership gains Well-designed service improvements can be undertaken while maintaining stable fare recovery
7 Brampton vs York Service Vehicle Kilometres/Capita York Brampton Source: CUTA Fact Book
8 Brampton vs York Ridership Brampton: +57.7% Riders/Capita York: +29.7% Brampton York Source: CUTA Fact Book
9 Brampton Ridership vs Service Riders/Capita Ridership/Capita Vehicle Hours/Capita Vehicle Hours/Capita Source: CUTA Fact Book
10 YRT Ridership vs Service Riders/Capita *Figures affected in 2008 by strike and in by strike and subsequent two months of free fares Ridership/Capita Vehicle Hours/Capita Vehicle Hours/Capita Source: CUTA Fact Book
11 Brampton Fare Recovery Ratio Operating Rev as % of Operating Cost 60% 50% 40% 30% 20% 10% 0% Recovery Ratio Vehicle Hours/Capita Vehicle Hours/Capita Source: CUTA Fact Book
12 YRT Fare Recovery Ratio Operating Rev as % of Operating Cost 50% 45% 40% 35% 30% 25% 20% 15% 10% 5% 0% *Figures affected in 2008 by strike and in by strike and subsequent two months of free fares Recovery Ratio Vehicle Hours/Capita Vehicle Hours/Capita Source: CUTA Fact Book
13 Effect on Individual Routes The following slides will explore the effect of the service changes on a sample of individual routes They have been selected for their comparability The data sources are 2005 and 2016 timetables of York Region Transit and Brampton Transit


14 Highway 7 BRT and local routes in both Brampton and York Both major commercial arteries surrounded by single-family residences, serving major employment areas Comparison made with busier eastern section in York YRT Viva Purple & Pink and Rt 1 Brampton Züm Queen and Rt 1 Source: Google Earth Source: Google Earth


15 :00 5:00 6:00 7:00 8:00 9:00 10:00 11:00 12:00 13:00 14:00 15:00 16:00 17:00 18:00 19:00 20:00 21:00 22:00 23:00 0:00 1:00 2:00 3:00 YRT Viva Purple & Pink and Rt 1 EB at Highway 7 & Leslie, 2016 Brampton Züm Queen and Rt 1 EB at Highway 7 & Kennedy, 2016 Weekday Service Comparison, 2016 Trips per hour YRT Day Total: 149, Brampton Day Total: 201


16 :00 5:00 6:00 7:00 8:00 9:00 10:00 11:00 12:00 13:00 14:00 15:00 16:00 17:00 18:00 19:00 20:00 21:00 22:00 23:00 0:00 1:00 2:00 3:00 YRT Rt 1 EB at Highway 7 & Leslie, 2005 YRT Viva Purple & Pink and Rt 1 EB at Highway 7 & Leslie, 2016 YRT 2005 vs 2016 Service Comparison Weekday trips per hour Pre- and Post-Viva BRT; 2005 Day Total: 55, 2016 Day Total: 149


17 :00 5:00 6:00 7:00 8:00 9:00 10:00 11:00 12:00 13:00 14:00 15:00 16:00 17:00 18:00 19:00 20:00 21:00 22:00 23:00 0:00 1:00 2:00 3:00 Brampton Rt 1 EB at Highway 7 & Kennedy, 2005 Brampton Züm Queen and Rt 1 EB at Highway 7 & Kennedy, 2016 Brampton 2005 vs 2016 Service Comparison Weekday trips per hour Pre- and Post- Züm BRT; 2005 Day Total: 106, 2016 Day Total: 201


18 Two typical secondary routes serving single-family residential areas YRT Route 7 Martin Grove Brampton Route 50 Gore Road Source: Google Earth Source: Google Earth
 2016 YRT Rt 7 Northbound from Martin Grove & Highway 7 2016 Weekday Service Comparison, 2016 Trips per hour YRT Day Total: 27, Brampton Day Total:")
19 :00 5:00 6:00 7:00 8:00 9:00 10:00 11:00 12:00 13:00 14:00 15:00 16:00 17:00 18:00 19:00 20:00 21:00 22:00 23:00 0:00 1:00 2:00 3:00 Brampton Rt 50 Northbound from The Gore and Queen (Highway 7) 2016 YRT Rt 7 Northbound from Martin Grove & Highway Weekday Service Comparison, 2016 Trips per hour YRT Day Total: 27, Brampton Day Total: 55

20 :00 5:00 6:00 7:00 8:00 9:00 10:00 11:00 12:00 13:00 14:00 15:00 16:00 17:00 18:00 19:00 20:00 21:00 22:00 23:00 0:00 1:00 2:00 3:00 YRT Rt 7 Northbound from Martin Grove & Highway YRT Rt 7 Northbound from Martin Grove & Highway YRT 2005 vs 2016 Service Comparison Weekday trips per hour 2005 Day Total: 31, 2016 Day Total: 27
 2005 Brampton Rt 50 Northbound from The Gore and Queen (Highway 7) 2016 Brampton 2005 vs 2016 Service Comparison Weekday trips per hour 2005 Day Total: 8, 2016 Day Total:")
21 :00 5:00 6:00 7:00 8:00 9:00 10:00 11:00 12:00 13:00 14:00 15:00 16:00 17:00 18:00 19:00 20:00 21:00 22:00 23:00 0:00 1:00 2:00 3:00 Brampton Rt 50 Northbound from The Gore and Queen (Highway 7) 2005 Brampton Rt 50 Northbound from The Gore and Queen (Highway 7) 2016 Brampton 2005 vs 2016 Service Comparison Weekday trips per hour 2005 Day Total: 8, 2016 Day Total: 55
 2016 YRT Rt 7 Northbound from Martin Grove & Highway 7 2016 Saturday Service Comparison, 2016 Trips per hour Brampton Day Total: 33, YRT Day Total:")
22 :00 5:00 6:00 7:00 8:00 9:00 10:00 11:00 12:00 13:00 14:00 15:00 16:00 17:00 18:00 19:00 20:00 21:00 22:00 23:00 0:00 1:00 2:00 3:00 Brampton Rt 50 Northbound from The Gore and Queen (Highway 7) 2016 YRT Rt 7 Northbound from Martin Grove & Highway Saturday Service Comparison, 2016 Trips per hour Brampton Day Total: 33, YRT Day Total: 18
 2016 YRT Rt 7 Northbound from Martin Grove & Highway 7 2016 Sunday Service Comparison, 2016 Trips per hour Brampton Day Total: 29, YRT Day")
23 :00 5:00 6:00 7:00 8:00 9:00 10:00 11:00 12:00 13:00 14:00 15:00 16:00 17:00 18:00 19:00 20:00 21:00 22:00 23:00 0:00 1:00 2:00 3:00 Brampton Rt 50 Northbound from The Gore and Queen (Highway 7) 2016 YRT Rt 7 Northbound from Martin Grove & Highway Sunday Service Comparison, 2016 Trips per hour Brampton Day Total: 29, YRT Day Total: 0

24 Effect of Service Increase Brampton Route 23 Sandalwood, 2011 to 2015 Change in Trips per Day Change in Ridership 177% 54% 0% 18% Saturday Sunday Ridership Source: Brampton Transit
25 Timing the Effect Riders Brampton Route 23 Sandalwood Sundays, 2011 to Ridership Trips per Day Trips Ridership Source: Brampton Transit
26 Effect of Service Reductions Route Ridership Change Route 3 Thornhill January to July 2014 vs 2015 (Decrease from 44 to 36 Weekday Trips) Overall Ridership Change in Municipality -0.5% -14.1% Source: York Region Memorandum to the Committee of the Whole Re: York Region Transit (YRT/Viva) Ridership Statistics 2015 Third Quarter
 Route Ridership")

27 Effect of Service Reductions Route 7 Martin Grove January to July 2014 vs 2015 (Decrease from 29 to 27 Weekday Trips, Elimination of Saturday Clockface Schedule) Route Ridership Change Overall Ridership Change in Municipality 1.3% -8.9% Source: York Region Memorandum to the Committee of the Whole Re: York Region Transit (YRT/Viva) Ridership Statistics 2015 Third Quarter
28 The Elephant Next Door Can statistical analysis permit us to draw conclusions on the effect of service based on a comparison with the very different TTC? Data is from the Statistics Canada 2011 National Household Survey
29 Mode Share by Census Tract


30 Across the Boundary Source: Google Earth

31 Census Tracts 239 census tracts selected in a band on either side of Toronto-York municipal boundary Areas of roughly equal size Both predominantly suburban, postwar Include large areas of singlefamily homes as well as employment areas and some towers Both have high percentage new Canadians Both areas predominantly middle class, though York side somewhat more affluent
32 Variables ModeShare The percentage of residents of a given tract who use public transit for their primary work trips. It is used to measure the success of transit at attracting riders. TTC A binary variable based on whether the tract is served by the Toronto Transit Commission. It is a proxy for level of transit service, as the TTC service area offers considerably more service than the non-ttc area MedianHouseholdIncome (control variable) The median household income in Canadian dollars of residents of a census tract Density (control variable) The density of residents per square kilometre in a census tract
33 Regression Results
34 Regression Results (cont d) The results of the regression analysis indicate that all of the analyzed variables added statistically significantly to the prediction. The equation had an r 2 of Controlling for both density and income, there is a statistically significant, positive relationship between being located in the TTC service area and the transit mode share.
35 Validity Threats Doesn t capture off-peak travel Doesn t capture people who walk to TTC Most data problems would understate effect of service on ridership Also may show impact of punitive cross-boundary fares
36 Conclusion Increased service improves ridership performance Network effect means that comprehensive network of high-service routes, rather than focus on select corridors, produces largest ridership gains Well-designed service improvements can be undertaken while maintaining stable fare recovery
37 Jonathan English THANK YOU
Transit System Performance Update
 Clause 5 in Report No. 4 of Committee of the Whole was adopted, without amendment, by the Council of The Regional Municipality of York at its meeting held on March 29, 2018. 5 2017 Transit System Performance
8 CROSS-BOUNDARY AGREEMENT WITH BRAMPTON TRANSIT
 8 CROSS-BOUNDARY AGREEMENT WITH BRAMPTON TRANSIT The Transportation Services Committee recommends the adoption of the recommendations contained in the following report dated May 27, 2010, from the Commissioner
Kathleen Llewellyn-Thomas, Commissioner of Transportation Services
 Transportation Services Department MEMORANDUM TO: FROM: Transportation Services Committee Kathleen Llewellyn-Thomas, Commissioner of Transportation Services DATE: January 21, 2011 RE: December 2010 Transit
1 YORK REGION TRANSIT/ VIVA SYSTEM PERFORMANCE
 Report No. 6 of the Transportation Services Committee Regional Council Meeting of June 23, 2011 1 YORK REGION TRANSIT/ VIVA SYSTEM PERFORMANCE The Transportation Services Committee recommends: 1. Receipt
4 YORK REGION TRANSIT DON MILLS SUBWAY STATION ACCESS AGREEMENT
 4 YORK REGION TRANSIT DON MILLS SUBWAY STATION ACCESS AGREEMENT The Transit Committee recommends the adoption of the recommendations contained in the following report, September 20, 2007, from the General
SAMTRANS TITLE VI STANDARDS AND POLICIES
 SAMTRANS TITLE VI STANDARDS AND POLICIES Adopted March 13, 2013 Federal Title VI requirements of the Civil Rights Act of 1964 were recently updated by the Federal Transit Administration (FTA) and now require
2017 Annual Service Plan
 2017 Annual Service Plan 2017 Annual Service Plan 2017 Annual Service Plan Objectives Transition to a Frequent Transit Network (FTN) with a strong grid network Preparing the Viva Network Expansion Plan
YRT/VIVA PROPOSED FARE INCREASE
 Report No. 7 of the Transportation Services Committee Regional Council Meeting of September 22, 1 2012 YRT/VIVA PROPOSED FARE INCREASE The Transportation Services Committee recommends: 1. Receipt of the
CURRENT SHORT-RANGE TRANSIT PLANNING PRACTICE. 1. SRTP -- Definition & Introduction 2. Measures and Standards
 CURRENT SHORT-RANGE TRANSIT PLANNING PRACTICE Outline 1. SRTP -- Definition & Introduction 2. Measures and Standards 3. Current Practice in SRTP & Critique 1 Public Transport Planning A. Long Range (>
Chapter 3. Burke & Company
 Chapter 3 Burke & Company 3. WRTA RIDERSHIP AND RIDERSHIP TRENDS 3.1 Service Overview The Worcester Regional Transit Authority (WRTA) provides transit service to over half a million people. The service
Date: 11/6/15. Total Passengers
 Total San Diego Metropolitan Transit System POLICY 42 PERFORMANCE MONITORING REPORT Page 1 of 6 OBJECTIVE Develop a Customer-Focused and Competitive System The following measures of productivity and service
2016 Annual Service Plan
 YRT/Viva Five-Year Strategic Plan 2016 Annual Service Plan Presentation to the City of Markham Development Services Committee November 16, 2015 Adrian Kawun Overview 1. System Overview YRT/Viva Services
Mount Pleasant (42, 43) and Connecticut Avenue (L1, L2) Lines Service Evaluation Study Open House Welcome! wmata.com/bus
 and Connecticut Avenue (L1, L2) Lines Service Evaluation Study Open House Welcome! wmata.com/bus") Mount Pleasant (42, 43) and Connecticut Avenue (L1, L2) Lines Service Evaluation Study Open House Welcome! Study Overview and Timeline Phase 1: Collect and Analyze Data Project Kickoff, September 2017
Mount Pleasant (42, 43) and Connecticut Avenue (L1, L2) Lines Service Evaluation Study Open House Welcome! Study Overview and Timeline Phase 1: Collect and Analyze Data Project Kickoff, September 2017
Att. A, AI 46, 11/9/17
 Total s San Diego Metropolitan Transit System POLICY 42 PERFORMANCE MONITORING REPORT Page 1 of 6 Date: 11/8/17 OBJECTIVE Develop a Customer-Focused and Competitive System The following measures of productivity
LA Metro Rapid - Considerations in Identifying BRT Corridors. Martha Butler LACMTA, Transportation Planning Manager Los Angeles, California
 LA Metro Rapid - Considerations in Identifying BRT Corridors Martha Butler LACMTA, Transportation Planning Manager Los Angeles, California LA Metro Transportation planner/coordinator, designer, builder
2 YORK REGION TRANSIT MOBILITY PLUS 2004 SYSTEM PERFORMANCE REVIEW
 2 YORK REGION TRANSIT MOBILITY PLUS 2004 SYSTEM PERFORMANCE REVIEW The Joint Transit Committee and Rapid Transit Public/Private Partnership Steering Committee recommends the adoption of the recommendation
TORONTO TRANSIT COMMISSION REPORT NO.
 Form Revised: February 2005 TORONTO TRANSIT COMMISSION REPORT NO. MEETING DATE: May 6, 2010 SUBJECT: LAKE SHORE BOULEVARD STREETCAR SERVICE ACTION ITEM RECOMMENDATION It is recommended that the Commission
Appendix VII TTC Routes
 Appendix VII TTC Routes Route: TTC 17A Birchmount Type: Local Description: A main north-south route operating along Birchmount Road in Markham southward to Warden Subway Station with peak service to Royal
Memorandum. Committee of the Whole. Paul Jankowski Commissioner of Transportation Services. Date: September 4, 2018
 Office of the Commissioner Transportation Services Memorandum To: From: Committee of the Whole Paul Jankowski Commissioner of Transportation Services Date: September 4, 2018 Re: York University Transit
KING STREET TRANSIT PILOT
 KING STREET TRANSIT PILOT Update toronto.ca/kingstreetpilot #kingstreetpilot HIGHLIGHTS TRANSIT RIDERSHIP TRANSIT CAPACITY To respond to this growth in ridership, the TTC has increased the capacity of
COLT RECOMMENDED BUSINESS PLAN
 COLT RECOMMENDED BUSINESS PLAN 2008 INTRODUCTION The past decade has been one of change in Lebanon County and this situation is expected to continue in the future. This has included growth in population,
PUBLIC TRANSIT IN KENOSHA, RACINE, AND MILWAUKEE COUNTIES
 PUBLIC TRANSIT IN KENOSHA, RACINE, AND MILWAUKEE COUNTIES #118404v1 Regional Transit Authority June 19, 2006 1 Presentation Overview Existing Public Transit Transit System Peer Comparison Recent Transit
Title VI Service Equity Analysis
 Pierce Transit Title VI Service Equity Analysis Pursuant to FTA Circular 4702.1B NE Tacoma Service May 2016 Pierce Transit Transit Development Dept. PIERCE TRANSIT TITLE VI SERVICE EQUITY ANALYSIS TABLE
IT S BACK TO SCHOOL WITH YRT
 FALL 2018 MyTransit > > Follow #RiderAlert on Twitter, @YRTViva, for major service updates > > Have questions? Find the answers on talk2yrt.ca or submit your own questions IT S BACK TO SCHOOL WITH YRT
PORTS TORONTO Billy Bishop Toronto City Airport Summary of 2015 Traffic and Passenger Surveys
 PORTS TORONTO Billy Bishop Toronto City Airport Summary of 2015 Traffic and Passenger Surveys 1 Summary of 2015 BBTCA Traffic and Passenger Surveys Surveys of traffic volumes and pedestrian activity were
Existing Services, Ridership, and Standards Report. June 2018
 Existing Services, Ridership, and Standards Report June 2018 Prepared for: Prepared by: Contents Overview of Existing Conditions... 1 Fixed Route Service... 1 Mobility Bus... 34 Market Analysis... 41 Identification/Description
Development of SH119 BRT Route Pattern Alternatives for Tier 2 - Service Level and BRT Route Pattern Alternatives
 Development of SH119 BRT Route Pattern Alternatives for Tier 2 - Service Level and BRT Route Pattern Alternatives June 1, 2018 Development of SH119 BRT Route Pattern Alternatives for Tier 2 - Service Level
HDR itrans Consulting Inc. 100 York Blvd., Suite 300 Richmond Hill, ON L4B 1J8 Tel: (905) Fax: (905)
 Fax: (905)") !" # $ !" # $ Consulting Inc. 100 York Blvd., Suite 300 Richmond Hill, ON L4B 1J8 Tel: (905) 882-4100 Fax: (905) 882-1557 www.itransconsulting.com November 2009 %&'('$&$ 1. West Brampton Road Network...
!" # $ !" # $ Consulting Inc. 100 York Blvd., Suite 300 Richmond Hill, ON L4B 1J8 Tel: (905) 882-4100 Fax: (905) 882-1557 www.itransconsulting.com November 2009 %&'('$&$ 1. West Brampton Road Network...
Summary of Proposed NH 120 Service
 Proposed NH 120 Bus Route Moody Building Etna Road Summary of Proposed NH 120 Service The Upper Valley Lake Sunapee Regional Planning Commission (UVLSRPC) working together with a Steering Committee comprised
Title VI Service Equity Analysis
 Pierce Transit Title VI Service Equity Analysis Pursuant to FTA Circular 4702.1B September 2013 Service Change February 2013 Page intentionally left blank PIERCE TRANSIT TITLE VI SERVICE EQUITY ANALYSIS
Why we re here: For educational purposes only
 Transportation 2050 Why we re here: For educational purposes only Transportation 2050 Bus Elements PUBLIC TRANSIT DEPARTMENT City of Phoenix Citizens Committee on the Future of Phoenix Transportation (CCFPT)
2017/2018 Q3 Performance Measures Report. Revised March 22, 2018 Average Daily Boardings Comparison Chart, Page 11 Q3 Boardings figures revised
 2017/2018 Q3 Performance Measures Report Revised March 22, 2018 Average Daily Boardings Comparison Chart, Page 11 Q3 Boardings figures revised Contents Ridership & Revenue... 1 Historical Revenue & Ridership...
Ministry of Transportation
 Ministry of Topics: Hurontario Light Rail Transit & Extension Mobility Hubs Regional Express Rail (RER) & High Speed Rail (HSR) Hwy 407/410 Connections to Brampton Uptown GTA West Corridor Connecting Brampton
Analysis of Transit Fare Evasion in the Rose Quarter
 Analysis of Transit Fare Evasion in the Rose Quarter Shimon A. Israel James G. Strathman February 2002 Center for Urban Studies College of Urban and Public Affairs Portland State University Portland, OR
Managed Lanes, Transit Access, and Economic Development: Implementing the Region s First Highway BRT Corridor
 Managed Lanes, Transit Access, and Economic Development: Implementing the Region s First Highway BRT Corridor Tim Burkhardt, AICP William Reynolds, AICP, PTP Matt Horton Who we are/astrological signs Tim
Community Transit Solutions for the Suburbs CTAA Expo June 2014
 Community Transit Solutions for the Suburbs CTAA Expo June 2014 New Suburban Challenges Lower density development patterns Where is the funding to compete with urban and suburban commuter needs? Increased
TORONTO TRANSIT COMMISSION REPORT NO.
 Form Revised: February 2005 TORONTO TRANSIT COMMISSION REPORT NO. MEETING DATE: March 24, 2010 SUBJECT: ACTION ITEM EXTENSION TO EXHIBITION LOOP RECOMMENDATIONS It is recommended that the Commission: 1.
METROBUS SERVICE GUIDELINES
 METROBUS SERVICE GUIDELINES In the late 1990's when stabilization of bus service was accomplished between WMATA and the local jurisdictional bus systems, the need for service planning processes and procedures
APPENDIX B. Arlington Transit Peer Review Technical Memorandum
 APPENDIX B Arlington Transit Peer Review Technical Memorandum Arlington County Appendix B December 2010 Table of Contents 1.0 OVERVIEW OF PEER ANALYSIS PROCESS... 2 1.1 National Transit Database...2 1.2
APPENDIX B COMMUTER BUS FAREBOX POLICY PEER REVIEW
 APPENDIX B COMMUTER BUS FAREBOX POLICY PEER REVIEW APPENDIX B COMMUTER BUS FAREBOX POLICY PEER REVIEW The following pages are excerpts from a DRAFT-version Fare Analysis report conducted by Nelson\Nygaard
Executive Summary. Introduction. Community Assessment
 Executive Summary Introduction The Red Rose Transit Authority (RRTA) Transit Development Plan provides an evaluation of existing RRTA fixed route services, with the outcome being practical recommendations
TRANSIT WINDSOR REPORT
 TRANSIT WINDSOR REPORT MISSION STATEMENT: PROVIDING SAFE, RELIABLE AND AFFORDABLE PUBLIC TRANSIT FOR THE COMMUNITY THROUGH CONTINUOUS IMPROVEMENT IN CUSTOMER CARE, ENVIRONMENTAL STEWARDSHIP AND EMPLOYEE
Fare Guide. YRT/Viva Pay app and PRESTO
 Fare Guide YRT/Viva Pay app and PRESTO How do I pay on YRT and Viva routes? For YRT routes, customers pay when they board the bus. Viva is our rapid transit service that operates on a pre-paid, proof-of-payment
SAN LUIS OBISPO TRANSIT + SAN LUIS OBISPO RTA JOINT SHORT RANGE TRANSIT PLANS: SERVICE STRATEGIES. Presented by: Gordon Shaw, PE, AICP; Principal
 SAN LUIS OBISPO TRANSIT + SAN LUIS OBISPO RTA JOINT SHORT RANGE TRANSIT PLANS: SERVICE STRATEGIES Presented by: Gordon Shaw, PE, AICP; Principal Project Status Review of existing services and setting complete
Fare Policy Discussion Background and History
 Fare Policy Discussion Background and History Transportation Committee Nick Eull Senior Manager of Revenue Operations February 27 th, 2017 2013 Fare Policy Analysis Report Cross-functional group comprised
APPENDIX 2 TORONTO TRANSIT COMMISSION SERVICE STANDARDS AND DECISION RULES FOR PLANNING TRANSIT SERVICE
 APPENDIX 2 TORONTO TRANSIT COMMISSION SERVICE STANDARDS AND DECISION RULES FOR PLANNING TRANSIT SERVICE Contents 1 Introduction... 1 2 Network Design Standards... 2 2.1 Transit Service Classifications...
TransAction Overview. Introduction. Vision. NVTA Jurisdictions
 Introduction Vision NVTA Jurisdictions In the 21 st century, Northern Virginia will develop and sustain a multimodal transportation system that enhances quality of life and supports economic growth. Investments
PREFACE. Service frequency; Hours of service; Service coverage; Passenger loading; Reliability, and Transit vs. auto travel time.
 PREFACE The Florida Department of Transportation (FDOT) has embarked upon a statewide evaluation of transit system performance. The outcome of this evaluation is a benchmark of transit performance that
All Door Boarding Title VI Service Fare Analysis. Appendix P.3
 All Door Boarding Title VI Service Fare Analysis Appendix P.3 Metro Board Report Los Angeles County Metropolitan Transportation Authority One Gateway Plaza 3rd Floor Board Room Los Angeles,
York Region Rapid Transit Corporation. City of Vaughan VMC Sub-Committee October 18, 2017
 York Region Rapid Transit Corporation City of Vaughan VMC Sub-Committee October 18, 2017 0 Agenda Construction update >> current projects in Vaughan > Bathurst & Centre > Highway 7 West > Highway 7 Vaughan
PERFORMANCE REPORT NOVEMBER 2017
 PERFORMANCE REPORT NOVEMBER 2017 Note: New FY2018 Goal/Target/Min or Max incorporated in the Fixed Route and Connection Dashboards. Keith A. Clinkscale Performance Manager INTRODUCTION/BACKGROUND In June
Table of Contents. TRANSIT DEVELOPMENT PLAN UPDATE i
 Table of Contents Chapter 1. Introduction... 1 Chapter 2. Financial Review... 3 2.1 Operating Costs... 3 2.2 Capital Costs... 3 2.3 Revenues... 4 2.4 Overall Funding Implications... 4 Chapter 3. Service
EX28.6 REPORT FOR ACTION. Advancing Fare Integration SUMMARY. Date: October 16, 2017 To: Executive Committee From: City Manager Wards: All
 EX28.6 REPORT FOR ACTION Advancing Fare Integration Date: October 16, 2017 To: Executive Committee From: City Manager Wards: All SUMMARY In July 2016, City Council considered a current state assessment
Regional Fare Change Overview. Nick Eull Senior Manager of Revenue Operations Metro Transit
 Regional Fare Change Overview Nick Eull Senior Manager of Revenue Operations Metro Transit Committee of the Whole April 5 th, 2017 Today s Presentation Fare change goals and considerations Public engagement
Appendix 4.1 J. May 17, 2010 Memorandum from CTPS to the Inter Agency Coordinating Group
 Appendix 4.1 J May 17, 2010 Memorandum from CTPS to the Inter Agency Coordinating Group CTPS CENTRAL TRANSPORTATION PLANNING STAFF Staff to the Boston Region Metropolitan Planning Organization MEMORANDUM
3. Aviation Activity Forecasts
 3. Aviation Activity Forecasts This section presents forecasts of aviation activity for the Airport through 2029. Forecasts were developed for enplaned passengers, air carrier and regional/commuter airline
Memorandum. Roger Millar, Secretary of Transportation. Date: April 5, Interstate 90 Operations and Mercer Island Mobility
 Memorandum To: From: The Honorable Dow Constantine, King County Executive; The Honorable Ed Murray, City of Seattle Mayor; The Honorable Bruce Bassett, City of Mercer Island Mayor; The Honorable John Stokes,
STUDY PROCESS. Study. PHASE I Research. PHASE II Develop & Analyze Options. PHASE III Recommendations. Regional Transit
 STUDY PROCESS PHASE I Research PHASE II Develop & Analyze Options PHASE III Recommendations February 2008 - July 2008 July 2008 - September 2008 September 2008 - December 2008 Analyze transit and projected
Attachment C: 2017/2018 Halifax Transit Year End Performance Report. 2017/2018 Year End Performance Measures Report
 Attachment C: 2017/2018 Halifax Transit Year End Performance Report 2017/2018 Year End Performance Measures Report Contents Annual Key Performance Indicators (KPIs)... 1 Weekday Cost per Passenger... 1
TORONTO TRANSIT COMMISSION REPORT NO.
 Form Revised: February 2005 TORONTO TRANSIT COMMISSION REPORT NO. MEETING DATE: March 30, 2012 SUBJECT: TTC SERVICE TO GEORGE BROWN COLLEGE WATERFRONT CAMPUS ACTION ITEM: RECOMMENDATIONS It is recommended
ROUTE EBA EAST BUSWAY ALL STOPS ROUTE EBS EAST BUSWAY SHORT
 ROUTE EBA EAST BUSWAY ALL STOPS ROUTE EBS EAST BUSWAY SHORT The EBA East Busway All Stops and EBS East Busway Short routes provide the core Martin Luther King Jr. East Busway services. Route EBA operates
DRAFT Service Implementation Plan
 2017 Service Implementation Plan October 2016 SECTION NAME 2017 Service Implementation Plan October 2016 2017 SERVICE IMPLEMENTATION PLAN TABLE OF CONTENTS Table of Contents... I List of Tables... III
14 YORK REGION TRANSIT (YRT/VIVA) SOUTHWEST DIVISION OPERATIONS AND MAINTENANCE CONTRACT EXTENSION
 SOUTHWEST DIVISION OPERATIONS AND MAINTENANCE CONTRACT EXTENSION") Clause No. 14 in Report No. 13 of the was adopted, without amendment, by the Council of The Regional Municipality of York at its meeting held on September 11, 2014. 14 YORK REGION TRANSIT (YRT/VIVA) SOUTHWEST
Clause No. 14 in Report No. 13 of the was adopted, without amendment, by the Council of The Regional Municipality of York at its meeting held on September 11, 2014. 14 YORK REGION TRANSIT (YRT/VIVA) SOUTHWEST
St. Johns County Transit Development Plan Update
 St. Johns County Transit Development Plan Update 2012-2021 Demographic Information Population 190,000 people in 2010 51% increase from 2000 Employment 64% over age 16 in labor force St. Augustine, Ponte
Establishes a fare structure for Tacoma Link light rail, to be implemented in September 2014.
 RESOLUTION NO. R2013-24 Establish a Fare Structure and Fare Level for Tacoma Link MEETING: DATE: TYPE OF ACTION: STAFF CONTACT: PHONE: Board 09/26/2013 Final Action Ric Ilgenfritz, Executive Director,
FALLS FLAT: COMPARING THE TTC`S FARE POLICY TO OTHER LEADING TRANSIT AGENCIES
 FALLS FLAT: COMPARING THE TTC`S FARE POLICY TO OTHER LEADING TRANSIT AGENCIES Brady Yauch Executive Director and Economist of Consumer Policy Institute (416) 964-9223 ext 236 bradyyauch@consumerpolicyinstitute.org
2017/ Q1 Performance Measures Report
 2017/2018 - Q1 Performance Measures Report Contents Ridership & Revenue... 1 Historical Revenue & Ridership... 1 Revenue Actual vs. Planned... 3 Mean Distance Between Failures... 5 Maintenance Cost Quarter
This report recommends two new TTC transit services in southwest Toronto.
 Report for Action New TTC Services - Southwest Toronto Date: March 20, 2018 To: TTC Board From: Chief Customer Officer Summary This report recommends two new TTC transit services in southwest Toronto.
Oakland A s Gondola Economic Impact
 January 2019 Oakland A s Gondola Economic Impact KEY FINDING: The proposed gondola system, which will connect the A s planned stadium to downtown Oakland, will generate $685 million in total economic benefit
TORONTO TRANSIT COMMISSION REPORT NO.
 Revised: March/13 TORONTO TRANSIT COMMISSION REPORT NO. MEETING DATE: SUBJECT: Resubmitted: November 18, 2013 October 23, 2013 TTC Fare Policy - Requests for Fare Discounts ACTION ITEM RECOMMENDATION It
1 SUBWAY EXTENSION TO VAUGHAN CORPORATE CENTRE - OPERATING AGREEMENT UPDATE
 1 Report No. 1 of the Chief Administrative Officer Regional Council Meeting of June 21, 2007 THE REGIONAL MUNICIPALITY OF YORK REPORT NO. 1 OF THE REGIONAL CHIEF ADMINISTRATIVE OFFICER For Consideration
CITY OF VAUGHAN EXTRACT FROM COUNCIL MEETING MINUTES OF JANUARY 25, 2011
 Item 1, Report No. 1, of the Priorities and Key Initiatives Committee, which was adopted without amendment by the Council of the City of Vaughan on January 25,. 1 RAPID TRANSIT UPDATE TORONTO-YORK SPADINA
2016 CENSUS BULLETIN #1 POPULATION & DWELLING COUNTS
 CENSUS BULLETIN #1 POPULATION & DWELLING COUNTS February 8 th, 2017 Bulletin Highlights: Brampton s : Brampton is 9 th largest City in Canada Brampton is 4 th largest City in Ontario Brampton is 3 rd largest
BaltimoreLink Implementation Status Report
 BaltimoreLink Implementation Status Report February 218 Joint Chairmen s Report JH1 Executive Summary BaltimoreLink, implemented on June 18, 217, is the complete overhaul and rebranding of the core transit
FIXED-SITE AMUSEMENT RIDE INJURY SURVEY, 2013 UPDATE. Prepared for International Association of Amusement Parks and Attractions Alexandria, VA
 FIXED-SITE AMUSEMENT RIDE INJURY SURVEY, 2013 UPDATE Prepared for International Association of Amusement Parks and Attractions Alexandria, VA by National Safety Council Research and Statistical Services
Transit in Toronto. Chair Adam Giambrone Sunday, October
 Chair Adam Giambrone Sunday, October 19 2008 1 TTC is a City of Toronto Commission Transit in Toronto 2 2 Serving Toronto since 1921 Transit in Toronto 3 3 Canada s largest transit agency Annual customer-trips,
Chairman and Members of the Planning and Development Committee. Edward R. Sajecki, Commissioner of Planning and Building
 LA.09.TOR TORONTO DATE: TO: FROM: SUBJECT: Chairman and Members of the Planning and Development Committee Edward R. Sajecki, Commissioner of Planning and Building Proposed Rezoning and Master Plan Union
Lessons Learned from Rebuilding the Muni Subway Schedule Leslie Bienenfeld
 Lessons Learned from Rebuilding the Muni Subway Schedule Leslie Bienenfeld Manager of Fixed Guideway Scheduling San Francisco Municipal Transportation Agency San Francisco, California SFMTA & the Municipal
HOW TO IMPROVE HIGH-FREQUENCY BUS SERVICE RELIABILITY THROUGH SCHEDULING
 HOW TO IMPROVE HIGH-FREQUENCY BUS SERVICE RELIABILITY THROUGH SCHEDULING Ms. Grace Fattouche Abstract This paper outlines a scheduling process for improving high-frequency bus service reliability based
Pinellas Suncoast Transit Authority Community Bus Plan
 Pinellas Suncoast Transit Authority Community Bus Plan FINAL REPORT JANUARY 2014 Prepared by: TABLE OF CONTENTS Executive Summary... 2 Community Bus Plan Introduction... 22 Previous Studies... 25 Market
Business Intelligence Development at Winnipeg Transit
 ITS Canada Webinar February 28, 2013 Business Intelligence Development at Winnipeg Transit Bill Menzies Senior Transit Planner, Dillon Consulting Limited Manager of Service Development, Winnipeg Transit
SYNOPSIS OF INFORMATION FROM CENSUS BLOCKS AND COMMUNITY QUESTIONNAIRE FOR TONOPAH, NEVADA
 TECHNICAL REPORT UCED 93-04 SYNOPSIS OF INFORMATION FROM CENSUS BLOCKS AND COMMUNITY QUESTIONNAIRE FOR TONOPAH, NEVADA UNIVERSITY OF NEVADA, RENO i Synopsis of Information from Census Blocks and Community
These elements are designed to make service more convenient, connected, and memorable.
 Transit is most attractive when it is frequent enough that people don t need to consult a timetable, and can instead just go to a stop and know that the train or bus will arrive shortly. Nearly all major
THE EFFECT OF FARE POLICIES ON DWELL TIME: A CASE STUDY FOR THE PITTSBURGH REGION
 Egge, Qian 1 THE EFFECT OF FARE POLICIES ON DWELL TIME: A CASE STUDY FOR THE PITTSBURGH REGION Mark Egge Graduate student researcher School of Information Systems and Management Heinz College Carnegie
A COMPARISON OF THE MILWAUKEE METROPOLITAN AREA TO ITS PEERS
 KRY/WJS/EDL #222377 (PDF: #223479) 1/30/15 PRELIMINARY DRAFT Memorandum Report A COMPARISON OF THE MILWAUKEE METROPOLITAN AREA TO ITS PEERS EXECUTIVE SUMMARY This memorandum report provides a statistical
STONES CORNER SUBURBPROFILE. Situated three kilometres from the Brisbane CBD, Stones Corner is located within one of Brisbane s key growth areas.
 1 SUBURBPROFILE Situated three kilometres from the Brisbane CBD, Stones Corner is located within one of Brisbane s key growth areas. OVERVIEW Situated three kilometres from the Brisbane CBD, Stones Corner
Appendix 8: Coding of Interchanges for PTSS
 FILE NOTE DATE 23 October 2012 AUTHOR SUBJECT Geoffrey Cornelis Appendix 8: Coding of Interchanges for PTSS 1. Introduction This notes details a proposed approach to improve the representation in WTSM
JATA Market Research Study Passenger Survey Results
 JATA Market Research Study Passenger Survey Results Prepared for the Jackson Area Transportation Authority (JATA) April, 2015 3131 South Dixie Hwy. Suite 545 Dayton, OH 45439 937.299.5007 www.rlsandassoc.com
REVIEW OF SUN METRO LIFT SERVICES
 REVIEW OF SUN METRO LIFT SERVICES Prepared for Review by Linda Cherrington, Research Scientist Suzie Edrington, Associate Research Scientist Zachary Elgart, Associate Transportation Researcher Shuman Tan,
City of Murfreesboro. Transit Service and Management Alternatives
 City of Murfreesboro Transit Service and Management Alternatives May, 2005 Table of Contents 1. Introduction... 1 2. Transit Needs... 2 2.1 Demographics...2 2.2 Existing Transit Services...2 2.3 Focus
2nd Quarter. AEDC is pleased to present the Anchorage Quarterly Economic Indicators Report for the second quarter of 2010.
 2010 AEDC is pleased to present the Anchorage Quarterly Economic Indicators Report for the second quarter of 2010. This report summarizes recently updated data from the Anchorage Economic Indicators Database,
This report recommends routing changes resulting from the Junction Area Study.
 For Action Routing Changes Junction Area Study Date: April 11, 2019 To: TTC Board From: Chief Customer Officer Summary The TTC operates an established and mature bus network. TTC staff conduct localized
YARTS ON-BOARD SURVEY MEMORANDUM
 YARTS ON-BOARD SURVEY MEMORANDUM Prepared for the Yosemite Area Regional Transportation System Prepared by LSC Transportation Consultants, Inc. This page left intentionally blank. YARTS On-Board Survey
VCTC Transit Ridership and Performance Measures Quarterly Report
 VCTC Transit Ridership and Performance Measures Quarterly Report Overview Quarter 2 Fiscal Year 2018-2019 This report provides performance measures for VCTC Intercity Bus Service covering the FY 2018-19
2017 Proposed Service Changes. For Public Meetings January 2017
 2017 Proposed Service Changes For Public Meetings January 2017 Peninsula Corridor Electrification Project (PCEP) Schedule First Train Set Env. Clearance (Jan.) Delivered LNTP Award (Sept.) NTP (March)
Potomac River Commuter Ferry Feasibility Study & RPE Results
 1.1 Introduction The Prince William County Department of Transportation conducted a route proving exercise (RPE) and feasibility study of a proposed commuter ferry service on the Potomac River between
Quarterly Report Transit Bureau, Local Transit Operations. First Quarter, Fiscal Year 2015 (July 2014 September 2014) ART & STAR
 ART & STAR") Quarterly Report Transit Bureau, Local Transit Operations First Quarter, Fiscal Year 2015 (July 2014 September 2014) ART & STAR A Arlington Transit ART 1) Introduction The purpose of ART is to provide
Quarterly Report Transit Bureau, Local Transit Operations First Quarter, Fiscal Year 2015 (July 2014 September 2014) ART & STAR A Arlington Transit ART 1) Introduction The purpose of ART is to provide
Interim Growth Management Policies City of Brampton Council
 Interim Growth Management Policies City of Brampton Council October 24, 2007 Agenda City of Brampton 2006 Official Plan Brampton s Growth Management Initiatives Provincial Growth Plan Brampton s Growth
We re listening: service changes to help get you where you re going
 February 2013 MyTransit We re listening: service changes to help get you where you re going More than 40 YRT / Viva service changes will take effect Sunday, February 24. Schedule and frequency adjustments
Presentation to the DRCOG Board August 16, 2017
 Presentation to the DRCOG Board August 16, 2017 Systemwide FY 2015-2016 July June FY 2016-2017 July June Riders 102,577 155,864 Revenue $1,014,781 $1,551,435 Fare Recovery FY = State Fiscal Year. 38% 53%