Development of SH119 BRT Route Pattern Alternatives for Tier 2 - Service Level and BRT Route Pattern Alternatives
|
|
|
- Lee Powers
- 5 years ago
- Views:
Transcription
1 Development of SH119 BRT Route Pattern Alternatives for Tier 2 - Service Level and BRT Route Pattern Alternatives June 1, 2018 Development of SH119 BRT Route Pattern Alternatives for Tier 2 - Service Level and BRT Route Pattern Alternatives... 1 June 1, Overview... 2 BOLT and J Ridership Information... 2 Graphic 1 SH119 BRT Process Pathway... 3 SH119 BRT Scenario #1 (October 30, 2017)... 4 Graphic 2:... 4 SH119 BRT Scenario #2 (December 7, 2017)... 6 Graphic 3:... 6 SH119 BRT Scenario #3-A (December 21, 2017)... 8 Graphic 4:... 8 SH119 BRT Scenario #3-B Sensitivity Test (December 21, 2017)... 9 SH119 BRT Scenario #4 (January 11, 2018) SH119 BRT Scenario #5 (January 11, 2018) SH119 BRT Scenario #6 (January 30, 2018) SH119 BRT Scenario #7 (February 23, 2018) Graphic SH119 BRT Scenario #8 (March 9, 2018) Graphic 6: SH119 BRT Scenario #9 (March 28, 2018) Branch Map Graphic 7: Appendix A Full Scale Maps of SH119 BRT Scenarios Appendix B SH 119 Bus Rapid Transit Scenario Summary _1_2018 1
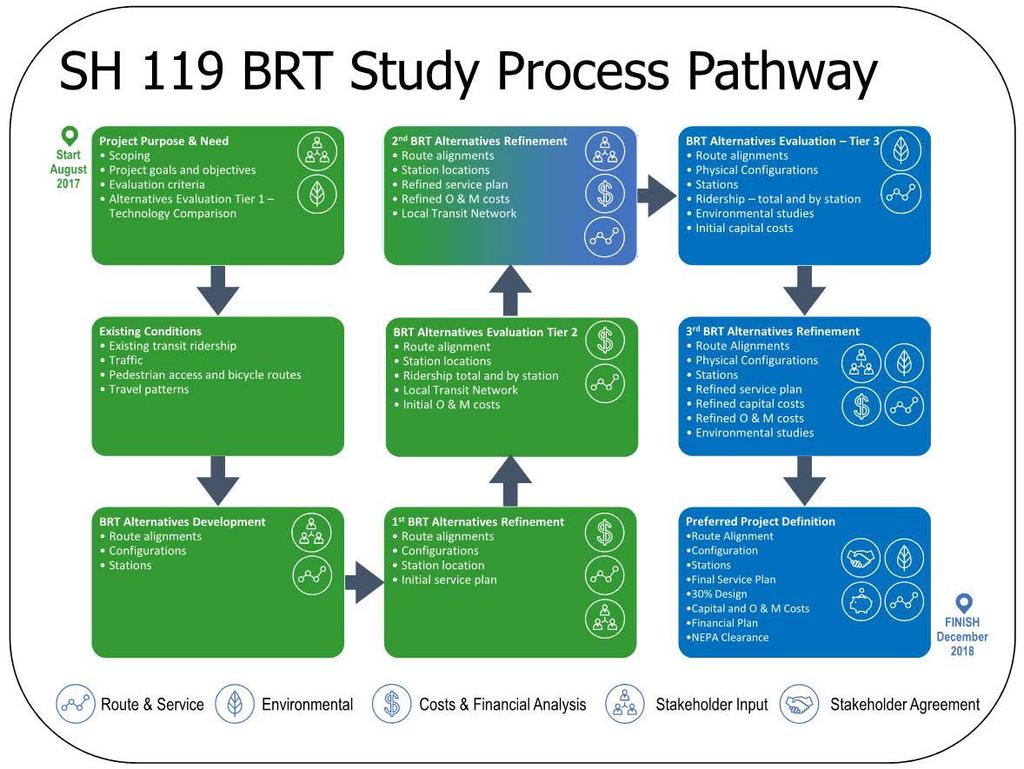
2 Overview Between October 2017 and March 2018, ten different modeling exercises were completed for the alternative analysis for a bus rapid transit (BRT) route between Longmont and Boulder running on the SH119. The purpose of these iterations was to provide 2040 transit ridership forecasts to help determine routes, station locations, and modifications to transit service operations. This is a key step in the Alternatives Analysis process. The SH119 BRT Study Process Pathway, Graphic 1, outlines the various study elements. The BRT scenario analysis is part of the BRT Development, the 1 st BRT Alternatives Refinement, which leads to determining a group of alternatives that will then go through the BRT Alternatives Evaluation Tier 2 process that includes a cost/benefit analysis. The BRT alternative scenario development started with one route connecting the two cities via SH119, as recommended from the 2014 North Area Mobility Study (NAMS). Through different stakeholder meetings and public input, five additional BRT scenarios (Model Iterations #2 - #6) were developed that were based on four routes that were distinct in their colors: blue, green, orange, and purple. For Model Iteration #7 - #9, the four routes were separated into individual starting and end points, that are identified by letters, and then mixed-and-matched with different beginning and end points. For all ten different BRT scenarios, the results include average boardings per day forecasted for 2040, which are unlinked trips. Each scenario is summarized below and documents the purpose of the each scenario iteration, what BRT routes (trunk and branches) were included in the model analysis, the service plan assumptions for the BRT routes, service plan assumptions for the BOLT and the J bus routes, guideway configuration of the BRT on SH119, amount of annual service hours generated from the modeling scenario, the assumption of BRT guideway configuration in the cities, the results, and a summary analysis. The full-scale version of all maps/graphics in the summary are found in Appendix A and a summary table of the BRT scenarios, elements of each iteration, and results are found in Appendix B. These modeling exercises help provide information to develop a set of alternatives that will be analyzed through the BRT Alternatives Evaluation Tier 2. BOLT and J Ridership Information In 2017, there were 232 observed boardings per average weekday on the J route and 1,428 boardings per day on the BOLT. BOLT runs all day service with 15-minute a.m. and p.m. peak and 30-minute offpeak service. The BOLT also has 5 deviated trips included in the daily service to provide connections with the Boulder Junction station. The J bus route runs 5 trips in the peak a.m. period that are between 20- minute and 60-minute headway, and runs 4 trips in the p.m. peak that are between 20-minute and 50- minute headway. This combined BOLT/J service requires approximately 34,700 service hours per year. 6_1_2018 2
3 Alternatives 6_1_2018 3
 recommendation with stakeholder input.")

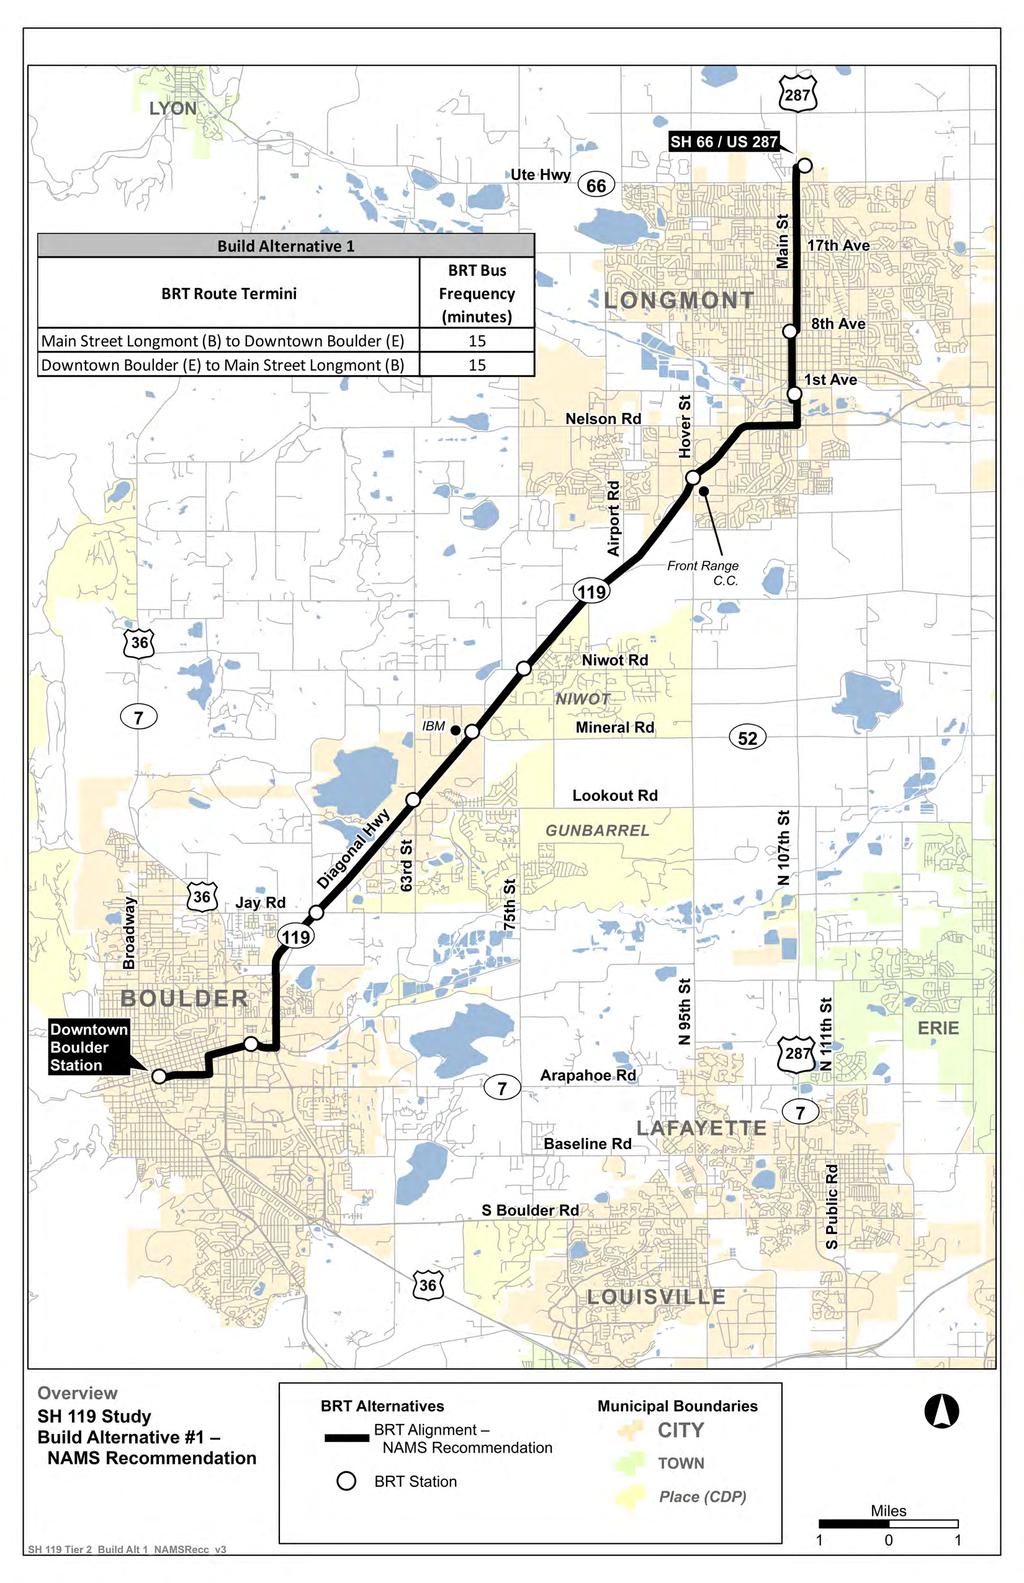
4 Graphic 1 SH119 BRT Process Pathway SH119 BRT Scenario #1 (October 30, 2017) Purpose: The purpose of this first iteration was to model an initial route that used the Northwest Area Mobility Study (NAMS) recommendation with stakeholder input. This iteration also tested the different population, housing, and employment factors between the Denver Regional Council of Governments (DRCOG) forecast model, and what the cities of Boulder and Longmont are assuming, which include higher population and employment figures for the long term. The full-scale version of the map in Graphic 2 is found in Appendix A. BRT Route Included: The BRT modeling scenario included one BRT route from 8 th /Coffman in Longmont to Downtown Boulder via Foothills Parkway. BRT Service Assumptions: 10-minute peak and 15-minute off-peak. BRT service span is the same as the BOLT: 5:00 AM to 12:00 midnight. BOLT and J Service Assumptions: BOLT runs all day service with 20-minute to 30-minute headway in a.m., 30-minute off-peak, and 15- minute p.m. peak. J runs peak a.m. (5 trips a.m. between 20-minute and 60-minute headway) and peak p.m. (4 trips p.m. between 20-minute and 50-minute headway) BRT SH 119 Guideway Configuration: Bus on shoulder at 40 mph. Service Hours Generated: With the BOLT and J = 37, ,700 = 72,600. Without BOLT and J = 37,900 BRT Guideway Configuration in Cities: BRT in mixed traffic Graphic 2: The black line represents the route modeled in Scenario #1. Results: The analysis was completed for 2040 output: 3,450 boardings per day combined for the BRT, BOLT and J using the approved and validated DRCOG inputs; 3,700 boardings in 2040 combined for the BRT, BOLT and J with the cities higher employment/population inputs. The ridership results with the cities inputs are 250 boardings per day (7.2%) higher than with the DRCOG inputs. RTD recognizes this difference and has encouraged the cities to discuss the differences with DRCOG and possibly effect changes in the DRCOG TAZ assumptions. RTD will also use both the DRCOG and city inputs for separate model runs of the Locally Preferred Alternative (LPA) at the end of the Alternatives Analysis process to determine those differences in ridership as well. However, for any potential application for FTA Small Starts funding, FTA will accept only results from the adopted DRCOG regional travel demand model. 6_1_2018 4
5 As for moving people, this scenario generates a total of 3,450 boardings between the BRT, BOLT and J; 1,200 of the riders are associated with the BRT route, while 2,250 boardings are tied to the BOLT and J. Adding the BRT route increases bus boardings by 35%. Assessing the difference between the outputs related to the different population and employment assumptions between DRCOG and the local cities, boardings between the two scenarios show a 7.2% difference in ridership. The model that has the approved and validated inputs with DRCOG shows ridership at 3,450 for all three lines while the model that has higher employment/population figures generates 3,700 boardings per day. Table: Table 1: SH119 BRT Scenario #1 Route DRCOG Local (Cities of Boulder and Longmont) Difference % Difference BRT 1,200 1, % BOLT 1,900 2, % J % Total 3,450 3, % 6_1_2018 5

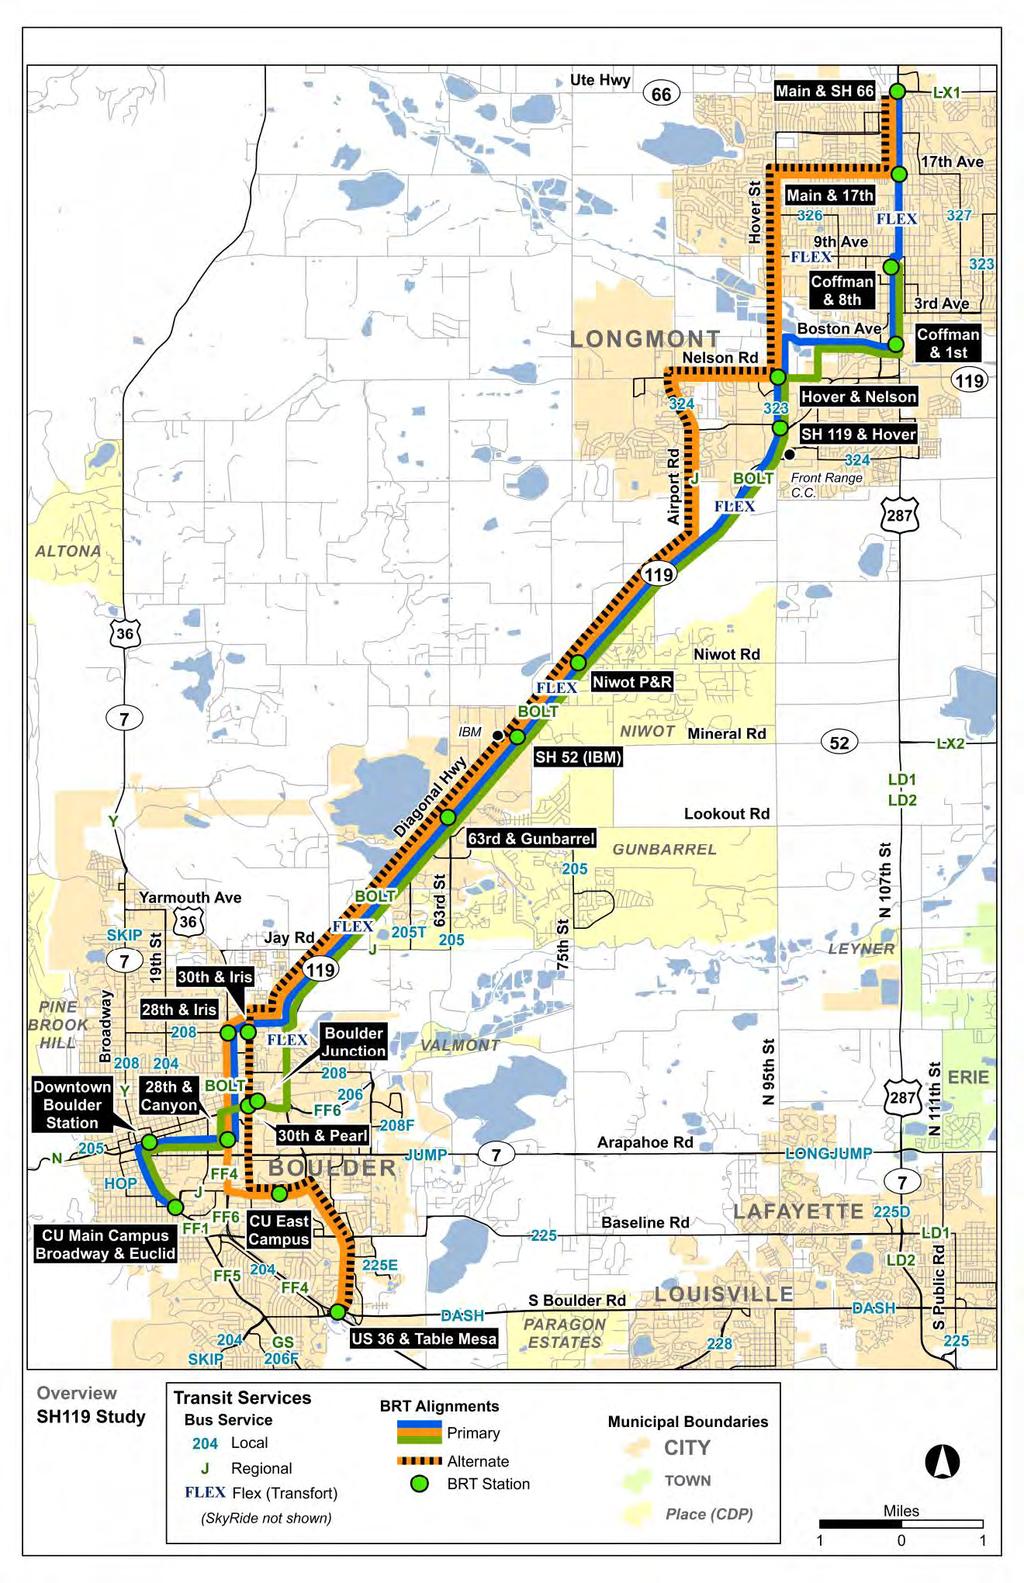
6 SH119 BRT Scenario #2 (December 7, 2017) Purpose: After additional technical, stakeholder, policy and public meetings, 4 BRT routes were developed. For this exercise, the BRT routes were modeled independent of each other to gain an understanding of boardings and performance of each individual route. The full-scale version of the map in Graphic 3 is found in Appendix A. BRT Routes Included: The December 7 th scenario includes 4 BRT Lines: Green, Blue, Orange and an alternate Orange line that had a different route in the City of Boulder, specifically along 30 th Street so it could connect with Bounder Junction. BRT Service Assumptions: 10-minute peak and 15- minute off-peak headways for each route, and the same service time span as the BOLT route. BOLT and J Service Assumptions: BOLT runs all day service with 20-minute to 30-minute headway in a.m., 30-minute off-peak, and 15-minute p.m. peak. J runs peak a.m. (5 trips a.m. between 20-minute 60- minute headway) and peak p.m. (4 trips p.m. between 20-minute and 50-minute headway) BRT SH119 Guideway Configuration: Bus on shoulder at 40 mph. Graphic 3: BRT routes modeled in Scenario #2 Service Hours: With the BOLT and J = 74,200-82,700. Without the BOLT and J = 39,500 to 48,000 BRT Guideway Configuration in Cities: BRT in mixed traffic Results: Analysis was run for each line, independent of each other for 2040 output. The highest total ridership was with the Blue line with BOLT and J at 3,590. The analysis also included 2015 and 2017 observed ridership information, and 2040 local transit ridership forecasts in Boulder and Longmont. The goal of this scenario was two-fold: 1) to further define different lines for the possible BRT routes in each city; and 2) to analyze each independently to gain an understanding of total ridership and station boardings. Table 2 includes observed boardings for the BOLT and J bus routes from 2015 and The observed boardings in 2015 were 1,830 but decreased by 9% in 2017 to 1,660. The BRT Blue route generates a total of 2,620 boardings and when ridership of the BOLT and J are included, it increases to 3,590, or 116% higher than the existing BOLT/J ridership. These results also indicate a shift of ridership from the existing BOLT and J to the BRT. The BRT Green line generates less boardings than the Blue line, with a total of 2,160 boardings. Including existing bus routes at their existing frequencies, the total ridership between Longmont and Boulder increases to 3,280, an increase of 98% from current BOLT/J ridership. 6_1_2018 6
7 The BRT Orange and Alternative Orange routes generate almost the same number of boardings at 1,490 and 1,470, respectively. When included with the BOLT and J bus ridership, the total boardings are the same at 2,850. This is a 72% increase of bus boardings over the current BOLT/J ridership. Table: Table 2: SH119 BRT Scenario # Route Observed Green Line Blue Line Orange Line Alternate Orange Line BRT 0 2,160 2,620 1,490 1,470 BOLT 1, ,120 1,140 J Total 1,660 3,280 3,590 2,850 2,850 Boulder Local Routes 24,400 24,300 24,300 24,400 Longmont Local Routes 2,300 2,200 2,300 2,300 6_1_2018 7
.")

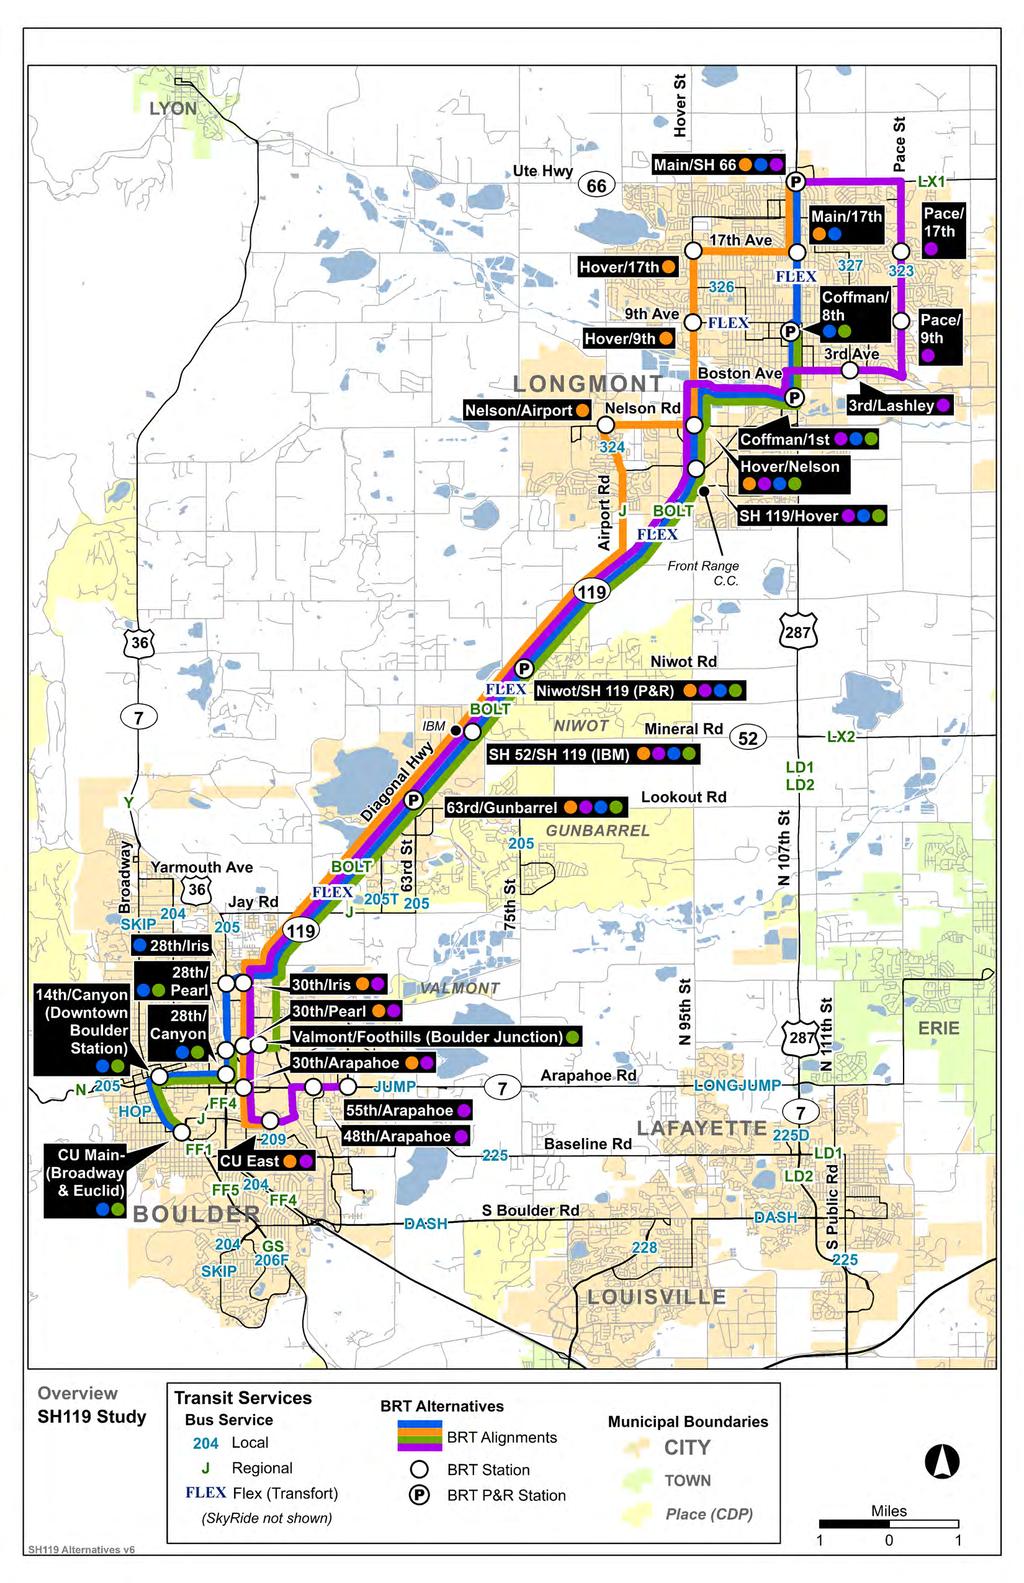
8 SH119 BRT Scenario #3-A (December 21, 2017) Purpose: The third scenario was developed after the stakeholder and technical groups further refined the routes into 4 lines: Blue, Green, Orange, and Purple (which replaced the previous Orange route and provides connections to east Longmont as well as east Boulder). The lines were tested in a combined method with different service assumptions to gain an understanding of what effect this has on transit boardings. The full-scale version of the map in Graphic 4 is found in Appendix A. BRT Routes Included: The third scenario included a total of four refined BRT lines: Blue, Green, Orange and Purple. The Purple route was tested running on Foothills. BRT Service Assumptions: The Blue line was modeled at 15-minute service all day; the Green, Orange, and Purple lines were modeled at 30-minute headway all day service. BOLT and J Service Assumptions: Ran model with AND without BOLT and J. BOLT runs all day service with 20-minute to 30-minute headway in a.m. peak, 30-minute off-peak, and 15- Graphic 4: Map includes all 4 routes modeled in minute p.m. peak. J runs peak a.m. (5 trips a.m. Scenarios #3-A, 3-B, 4, 5, and 6 peak with 20-minute to 60-minute headway) and peak p.m. (4 trips p.m. with 20-minute to 50-minute headway). BRT SH119 Guideway Configuration: Bus on shoulder at 40 mph. Service Hours: With the BOLT and J = 71, ,700 = 106,300. Without BOLT and J = 71,600 BRT Guideway Configuration in Cities: BRT in mixed traffic Results: The highest total ridership was the blue line with BOLT and J at 3,590. The analysis also included 2015 and 2017 observed ridership information for the BOLT/J, and then 2040 ridership of local transit ridership in Boulder and Longmont. The four BRT patterns were modeled with and without BOLT and J service to see the comparison of boardings. Alone, the four BRT routes generated just over 3,000 boardings a day. With the additional bus service of the two existing routes, there are 3,930 boardings a day with all routes operational. Without running the BOLT and the J, boardings are 3,050. 6_1_2018 8
9 While the number of daily boardings is the highest in this scenario, it is only 340 boardings higher, than just the blue line (Table 3). Table: Route Four Patterns (With BOLT and J) Table 3 SH119 BRT Scenario #3-A Four Patterns (No BOLT and J) Difference % Difference Four Patterns (No BOLT and J + Extra Stops) SH 119 BRT 2,850 3, % BOLT 830 (830) -100% J 250 (250) -100% Total 3,930 3,050 (880) -22.0% 3,290 3,290 SH119 BRT Scenario #3-B Sensitivity Test (December 21, 2017) Purpose: This alternative was developed to gain an understanding of the effects of having an exclusive and faster lane (55 mph) on SH 119 in comparison to the NAMS study recommendation of running buson-shoulder, which would run at approximately 40 mph. For this sensitivity test, the Blue line was the only BRT route modeled with the BOLT and J. BRT Routes Included: This sensitivity test only included the Blue line. BRT Service Assumptions: It was assumed that the Blue line was running 10-minute service during peak hours and 15-minute service in the off-peak hours. BOLT and J Service Assumptions: BOLT runs all day service with 20-minute to 30-minute headway in a.m. peak, 30-minute off-peak, and 15-minute p.m. peak. J runs peak a.m. (5 trips a.m. with 20-minute to an hour headway) and peak p.m. (4 trips p.m. with 20-minute to 50-minute headway) BRT SH119 Guideway Configuration: Bus on Shoulder at 40 mph, and exclusive lanes on SH119. Service Hours: With the BOLT and J = 46, ,700 = 81,100. Without BOLT and J = 46,400 BRT Guideway Configuration in Cities: BRT in mixed traffic Results: With the BRT Blue line running on the shoulder (at 40 mph) on SH 119 and making local connections in Boulder and Longmont, it generates 2,620 boardings. The other scenario with BRT operating in an exclusive lane on SH 119 (at 55 mph) with stops in both cities, creates 2,820 boardings a day or 7.6% higher than the bus on shoulder option. When the BRT Blue line and local BOLT and J bus services are analyzed together, ridership increases to a total of 3,590 boardings a day when the BRT is running on shoulder, and to 3,810 boardings when BRT is running in an exclusive lane on SH 119. Although the BRT would be operating 37.5% faster than the bus on shoulder option on SH119, it only attracts 7.6% higher ridership on the BRT. This is because the SH 119 portion of the total route 6_1_2018 9
10 represents only about one-half of the corridor, so the travel time benefit is limited; there are no more access points (stations) with the exclusive lanes vs bus-on-shoulder; and the walk times are the same for both scenarios. Consequently, the speed difference does not generate a significant ridership difference. The annual service hours that are needed for this scenario totals 76,100, which is a 119% increase over existing BOLT/J service hours. Table: Route Table 4 SH119 BRT Scenario (Sensitivity Test) #3-B Blue Line (SH119 bus-onshoulder 40 mph) Blue Line (SH119 exclusive lanes 55 mph) Difference % Difference BRT 2,620 2, % BOLT % J % Total 3,590 3, % SH119 BRT Scenario #4 (January 11, 2018) Purpose: This alternative was completed to test all four branches together with high frequency. BRT Routes Included: The fourth BRT scenario that was completed included the four BRT lines: Blue, Green, Orange and Purple. The routes were modeled together as a combined system, with boardings outlined per route in Table 5. Service Assumptions: 20-minute headway all-day service (3 buses per hour per direction) assumed for all four branches, producing a blended headway of 5 minutes along the SH 119 trunk. BOLT and J Service Assumptions: Ran model with AND without BOLT and J. BOLT runs all day service with 20-minute to 30-minute headway in a.m. peak, 30-minute off-peak, and 15-minute p.m. peak. J runs peak a.m. (5 trips a.m. with 20-minute to 60-minute headway) and peak p.m. (4 trips p.m. with 20- minute to 50-minute headway) BRT SH119 Guideway Configuration: Bus on Shoulder at 40 mph. Service Hours: With the BOLT and J = 91, ,700 = 126,500. Without BOLT and J = 91,800 BRT Guideway Configuration in Cities: BRT in mixed traffic Results: When modeled for boardings in 2040, the four BRT routes generate 3,760 boardings per day; combined with the BOLT and J, ridership increases to 4,845. When the four BRT routes are run without the BOLT and J, ridership is 4,020. The annual service hours that are needed for this 4-line BRT scenario (without the BOLT/J) totals 91,800, which is a 165% increase over existing BOLT/J service hours. 6_1_
11 Table: Route 119 BRT Table 5 SH119 BRT Scenario #4 Alignment 2040 Daily Boardings with 2040 Daily Boardings without BOLT/J BOLT/J Blue 1,220 1,290 Green 970 1,070 Orange 1,020 1,050 Purple Sub-Total ,020 BOLT 840 J 245 Total 4,845 4,020 SH119 BRT Scenario #5 (January 11, 2018) BRT Routes Included: This alternative included just the Blue and Orange BRT lines, without the BOLT/J. Service Assumptions: 20-minute headway all-day service. BOLT and J Service Assumptions: This scenario was modeled without the BOLT and J. BRT SH119 Guideway Configuration: Bus on Shoulder at 40 mph. Service Hours: 57,400 BRT Guideway Configuration in Cities: BRT in mixed traffic. Results: Running two of the proposed BRT lines with dedicated BRT lanes in Boulder and Longmont generated a total of 3,020 boardings. This scenario was developed to determine how much ridership might be generated by two BRT lines. The results demonstrate that the Blue and Orange lines alone generate 75% of the ridership generated by all four BRT lines in the previous model run, with half of the annual service hours. Table: Route 119 BRT Table 6 SH119 BRT Scenario #5 Alignment 2040 Daily Boardings without BOLT/J Blue 1,720 Orange 1,300 Total 3,020 SH119 BRT Scenario #6 (January 30, 2018) Purpose: This scenario was developed to begin testing a possible optimization strategy for the four BRT routes that includes different service levels. Additionally, this scenario tested business access and transit (BAT) lanes along the route alignments in the local cities. BRT Routes Included: This option included operation of all four branch lines. 6_1_
12 Service Assumptions: Blue = 15-minute peak and off-peak, plus weekend service; Green line 15- minute peak only service; Orange and Purple Lines 30-minute= peak only service. BOLT and J Service Assumptions: This scenario was modeled without the BOLT and J. BRT SH119 Guideway Configuration: Bus on Shoulder at 40 mph. Service Hours: 64,500 (4 BRT lines only without BAT lanes) BRT Guideway Configuration in Cities: With AND without business access and transit (BAT) lanes Results: In this scenario, the BAT lanes in the cities generate an additional 90 boardings between the four lines. With a modified operational schedule, this scenario generates projected 2040 boardings between 3,040 and 3,130. The annual service hours that are needed for this scenario totals 64,500, which is an 86% increase over existing BOLT/J service hours. Table: Table 7 SH119 BRT Scenario #6 SH 119 Headways (mins) 2040 Daily Boardings BRT Pattern Peak Off Peak Without BAT Lanes With BAT Lanes Blue Line ,200 2,240 Green Line Orange Line Purple Line Total 3,040 3,130 6_1_

13 SH119 BRT Scenario #7 (February 23, 2018) Purpose: The seventh SH119 BRT scenario was developed to gain an understanding of travel time, service levels, boardings, and the effect of different branch combinations between Longmont and Boulder. Another change that occurred in this model iteration from previous versions is that the purple and orange routes were modified. The purple line was rerouted in Longmont; it was previously running east/west along 3 rd Avenue to County Line Rd., and model iteration #7 moves the route to travel on 3 rd Avenue, and then travel north/south along Pace to connect to Main Street and SH 66. In Boulder, the orange line was shortened to end at CU East Campus, where previously it traveled to US 36 and Table Mesa, and the purple line was routed to follow the orange line through CU East Campus as well. The revised routes can be found in Graphic 5. With these changes, three of the four routes: blue, orange and purple were separated into 3 branch lines in Longmont and 2 in Boulder. In Longmont, the orange line was identified as A, the blue line as B, and the revised purple line as C. The 2 branch lines in Boulder: E (blue) and F (modified purple to include CU East connection). The branch lines were then paired with different beginning and end points that totaled six routes. Each route was modeled independently. This information can be found in Table 8 below. BRT Routes Included: This scenario included the six BRT routes noted in Table 8 that were modeled separately: Graphic 5: Map of routes and branches for Scenario #7 Table 8 - Key and Route Configurations for SH119 BRT Scenario #7 Key Model Iteration #7 Routes A - Longmont Orange AE - Longmont Orange/Boulder Blue B - Longmont Blue AF - Longmont Orange/Boulder Purple C - Revised Longmont Purple (via Pace) BE - Longmont Blue/Boulder Blue D Longmont Green BF - Longmont Blue/Boulder Purple E - Boulder Blue (via Canyon to CU Main) CE - Longmont Purple/Boulder Blue F - Revised Boulder Purple #1 (through CU East Campus) CF - Longmont Purple/Boulder Purple 6_1_
14 Service Assumptions: 15-minute all day. Each route was modeled independently. BOLT and J Service Assumptions: This scenario was modeled without the BOLT and J. BRT SH119 Guideway Configuration: Bus on Shoulder at 40 mph. Service Hours: AE - Longmont Orange/Boulder Blue: 41,400 hours AF - Longmont Orange/Boulder Purple: 46,100 hours BE - Longmont Blue/Boulder Blue: 41,400 hours BF - Longmont Blue/Boulder Purple: 46,100 hours CE - Longmont Purple/Boulder Blue: 46,100 hours CF - Longmont Purple/Boulder Purple: 52,900 BRT Guideway Configuration in Cities: BRT in mixed traffic Results: In this alternative, the various branch combinations independently generated between 2,160 and 2,440 weekday boardings, with annual service hours ranging from 41,400 to 52,900, or 19-52% more than the existing BOLT/J service hours. The mixing and matching of branches produced different results with the highest amount of boardings on the revised Longmont purple branch to the blue line in Boulder (2,440). The lowest amount of riders, 2,160, was the Longmont blue branch ending in Boulder via the purple branch. Table: Table 9 SH119 BRT Scenario #7 BRT Branch Pattern Service Hours 2040 Daily Boardings AE - Longmont Orange/Boulder Blue 41,400 2,380 AF - Longmont Orange/Boulder Purple 46,100 2,310 BE - Longmont Blue/Boulder Blue 41,400 2,260 BF - Longmont Blue/Boulder Purple 46,100 2,160 CE - Longmont Purple/Boulder Blue 46,100 2,440 CF - Longmont Purple/Boulder Purple 52,900 2,350 6_1_

15 SH119 BRT Scenario #8 (March 9, 2018) Purpose: This scenario was developed to test modifications of four route branches (blue, green, orange and purple) in the City of Boulder. BRT Routes Included: This iteration modeled four routes in a combined scenario. The four modified routes in the City of Boulder are shown in Graphic 6 and explained below. The blue line extends along 28 th Street south to Colorado, then west thru CU main campus to Broadway/Euclid, with 15-min. headway all day; no longer goes to Downtown Boulder Green line now goes to Downtown Boulder, with 30- min. headway all day; no longer extends along Broadway to CU main campus Orange line retains previous alignment along 30 th Street and ends at CU east campus, with 15-min. peak/30-min. off-peak headways Purple line now operates on Foothills Parkway to Arapahoe and ends at 55 th /Arapahoe with 30-min. headway all day; no longer goes to CU east campus. The full version of the map can be found in Appendix A. As well, for each revised branch, a letter was assigned to the branch, and the key from model iteration #7 was expanded. This is noted in Table 10. Graphic 6: Map of four routes in Scenario #8 Table 10 - Key and Route Configurations for SH119 BRT Scenario #8 Key Model Iteration #8 Routes A - Longmont Orange BG -Longmont Blue/Rev. Boulder Blue B - Longmont Blue DH - Longmont Green/Rev. Boulder Green C - Revised Longmont Purple (via Pace) AI - Longmont Orange/Rev. Boulder Orange D Longmont Green CJ - Rev. Longmont Purple/Rev. Boulder Purple E - Boulder Blue (via Canyon to CU Main) F - Revised Boulder Purple #1 (through CU East Campus) G - Revised Boulder Blue (via Colorado to CU Main) H - Revised Boulder Green (via Colorado to CU Main) I - Revised Boulder Orange (to CU East) J - Revised Boulder Purple #2 (via Foothills to Arapahoe/55th) 6_1_
16 Service Assumptions: Blue = 15-minute peak and off-peak, plus weekend service; Green line 15- minute peak only service; Orange and Purple Lines 30-minute= peak only service. BOLT and J Service Assumptions: This scenario was modeled without the BOLT and J. BRT SH119 Guideway Configuration: Bus on Shoulder at 40 mph. Service Hours: 84,200 BRT Guideway Configuration in Cities: BRT in mixed traffic Results: The analysis was completed for 2040 projected boardings, with all four routes modeled at once, without the BOLT and J. The daily boardings are projected to be at 3,410 passengers. This iteration shows a higher (3,410 boardings in comparison to Model Iteration #6 3,040 boardings), yet consistent amount of projected boardings in 2040 like other model results. Table: Table 11 - SH119 BRT Scenario #8 Results SH 119 Headways (mins) Daily Boardings BRT Pattern Peak Off Peak BG -Longmont Blue/Rev. Boulder Blue ,730 DH - Longmont Green/Rev. Boulder Green AI - Longmont Orange/Rev. Boulder Orange CJ - Rev. Longmont Purple/Rev. Boulder Purple Total 3,410 SH119 BRT Scenario #9 (March 28, 2018) Purpose: This scenario was developed to conduct a sensitivity test that is based on lowering the speed of the bus in peak periods on the trunk line. The bus on shoulder was modeled in peak period, peak direction at 15 mph speed differential compared to general purpose (GP) lane speeds (averaged speed of 30 mph on entire corridor for all links combined). BRT operates in the general-purpose lanes during off-peak period and off-peak direction in peak period. BRT Routes Included: This iteration modeled four routes in a combined scenario. The four modified routes in the City of Boulder are shown in Graphic 6 and explained below. The blue line extends along 28 th Street south to Colorado, then west thru CU main campus to Broadway/Euclid, with 15-min. headway all day; no longer goes to Downtown Boulder Green line now goes to Downtown Boulder, with 30-min. headway all day; no longer extends along Broadway to CU main campus Orange line retains previous alignment along 30 th Street and ends at CU east campus, with 15-min. peak/30-min. off-peak headways Purple line now operates on Foothills Parkway to Arapahoe and ends at 55 th /Arapahoe with 30-min. headway all day; no longer goes to CU east campus. The full version of the map can be found in Appendix A and the BRT branch patterns are noted in Table 10. 6_1_
17 Service Assumptions: Blue = 15-minute peak and off-peak, plus weekend service; Green line 15- minute peak only service; Orange and Purple Lines 30-minute= peak only service. BOLT and J Service Assumptions: This scenario was modeled without the BOLT and J. BRT SH119 Guideway Configuration: Bus on Shoulder during peak period in peak direction at 15 mph speed differential compared to general purpose (GP) lane speeds (averaged speed of 30 mph on entire corridor for all links combined). BRT operates in General Purpose lanes during off-peak period and offpeak direction in peak period. Service Hours: 84,200 BRT Guideway Configuration in Cities: BRT in mixed traffic Results: The analysis was completed for 2040 projected boardings, with all four routes modeled at once, without the BOLT and J. The daily boardings are projected to be at 3,320 passengers. This iteration shows a slightly lower amount of boardings in comparison to Model Iteration #8 3,410 boardings), yet it is consistent with other model results in the range of projected boardings. Table: Table 12 - SH119 BRT Scenario #8 Results SH 119 Headways (mins) Daily Boardings BRT Pattern Peak Off Peak BG -Longmont Blue/Rev. Boulder Blue ,670 DH - Longmont Green/Rev. Boulder Green AI - Longmont Orange/Rev. Boulder Orange CJ - Rev. Longmont Purple/Rev. Boulder Purple Total 3,320 6_1_
18 Branch Map The alternative development work for the SH119 BRT project began with one route and the iterative process led to testing 10 branches with different routes and service levels. Table 12 is a key for the branches, and Graphic 7 shows the branch locations in Longmont and Boulder that were tested. This map and key will be used to develop a set of alternatives that will be analyzed through the BRT Alternatives Evaluation Tier 2. Table 12 - Key for Branch Lines Branch Lines A - Longmont Orange B - Longmont Blue C - Revised Longmont Purple (via Pace) D Longmont Green E - Boulder Blue (via Canyon to CU Main) F - Revised Boulder Purple #1 (through CU East Campus) G - Revised Boulder Blue (via Colorado to CU Main) H - Revised Boulder Green (via Colorado to CU Main) I - Revised Boulder Orange (to CU East) J - Revised Boulder Purple #2 (via Foothills to Arapahoe/55th) 6_1_

19 Graphic 7: Map of Branch Options 6_1_
20 Appendix A Full Scale Maps of SH119 BRT Scenarios 6_1_
21
22
23
24
25
26
27 Appendix B SH 119 Bus Rapid Transit Scenario Summary 6_1_
28 BRT Routes Included BRT Routes Modeled Combined or Independent? Scenario #1 Oct. 30, 2017 Blue Scenario #2 December 7, 2017 Green Blue Orange Alt. Orange Scenario #3-A December 21, 2017 Green Blue Orange Purple Scenario #3-B December 21, 2017 Blue Scenario #4 January 11, 2018 Green Blue Orange Purple Scenario #5 January 11, 2018 Blue Orange Scenario #6 January 30, 2018 Green Blue Orange Purple Scenario #7 February 23, 2018 AE - Longmont Orange/Boulder Blue AF - Longmont Orange/Boulder Purple BE - Longmont Blue/Boulder Blue BF - Longmont Blue/Boulder Purple CE - Rev. Longmont Purple/Boulder Blue CF - Rev. Longmont Purple/Boulder Orange Scenario #8 March 9, 2018 Scenario #9 March 28, 2018 BG -Longmont Blue/Rev. Boulder Blue BG -Longmont Blue/Rev. Boulder Blue DH - Longmont Green/Rev. Boulder Green DH - Longmont Green/Rev. Boulder Green AI - Longmont Orange/Rev. Boulder Orange AI - Longmont Orange/Rev. Boulder Orange CJ - Rev. Longmont Purple/Rev. Boulder Purple CJ - Rev. Longmont Purple/Rev. Boulder Purple Independent Independent Combined Independent Combined Combined Combined Independent Combined Combined # of Stations Per Route (per route) BRT SH119 Trunk Configuration BRT Guideway Configuration in Cities Bus on 40 mph Bus on 40 mph Bus on 40 mph Bus on 40 mph and Exclusive mph Bus on 40 mph Bus on 40 mph BRT in mixed traffic BRT in mixed traffic BRT in mixed traffic BRT in mixed traffic BRT in mixed traffic BRT in mixed traffic Bus on 40 mph With and without all BAT Lanes Bus on 40 mph Bus on 40 mph Bus on Shoulder during peak period in peak direction at 15mph speed differential compared to general purpose (GP) lane speeds (averaged speed of 30mph on entire corridor for all links combined). BRT operates in General Purpose lanes during off-peak period and off-peak direction in peak period. BRT in mixed traffic BRT in mixed traffic BRT in mixed traffic Was Bolt and J included? Yes Yes Yes and No Yes Yes and No No No No No No Service Level Plans: (minutes) Peak: 10 Off Peak: 15 Peak: 10 Off Peak: 15 Blue: 15-min. all day Green, Orange, and Purple: 30-min. all day SH 119 Bus Rapid Transit Scenario Summary Peak: 10 Off Peak: min. all day 20 - min. all day Blue: 15-min. all day Green: 15-min. peak Orange & Purple: 30- min peak only 15-min. all day (run separately) BG -Longmont Blue/Rev. Boulder Blue: 15-min. all day DH - Longmont Green/Rev. Boulder Green: 30- min. all day AI - Longmont Orange/Rev. Boulder Orange: 15-min. peak, 30-min. off peak CJ - Rev. Longmont Purple/Rev. Boulder Purple, 30-min. all day BG -Longmont Blue/Rev. Boulder Blue: 15-min. all day DH - Longmont Green/Rev. Boulder Green: 30- min. all day AI - Longmont Orange/Rev. Boulder Orange: 15-min. peak, 30-min. off peak CJ - Rev. Longmont Purple/Rev. Boulder Purple, 30-min. all day BRT Boardings 1,200 Green: 2,160 Blue: 2,620 Orange: 1,490 Alt. Orange: 1,470 With the BOLT and J: 2,850 Without the BOLT and J: 3,050 Bus on Shoulder: 2,620 Exclusive: 2,820 With the BOLT and J: 3,760 Without the BOLT and J: 4,020 3,020 Without BAT Lanes: 3,040 With all BAT Lanes: 3,130 (Net gain - 90 boardings with BAT lanes on all local streets) AE - Longmont Orange/Boulder Blue: 2,380 AF - Longmont Orange/Boulder Purple: 2,310 BE - Longmont Blue/Boulder Blue: 2,260 BF - Longmont Blue/Boulder Purple: 2,160 CE - Rev. Longmont Purple/Boulder Blue: 2,440 CF - Rev. Longmont Purple/Boulder Orange: 2,350 BG -Longmont Blue/Rev. Boulder Blue: 1,730 DH - Longmont Green/Rev. Boulder Green: 260 AI - Longmont Orange/Rev. Boulder Orange: 900 CJ - Rev. Longmont Purple/Rev. Boulder Purple: 520 BG -Longmont Blue/Rev. Boulder Blue: 1,670 DH - Longmont Green/Rev. Boulder Green: 260 AI - Longmont Orange/Rev. Boulder Orange: 890 CJ - Rev. Longmont Purple/Rev. Boulder Purple: 500 Bolt & J Boardings 2, ,380 1,080 Bus on Shoulder: 970 Exclusive: 990 1, Total Boardings 3,450 Green: 3,280 Blue: 3,590 Orange: 2,850 Alt. Orange: 2,850 With the BOLT and J: 3,930 Without the BOLT and J: 3,050 Bus on Shoulder: 3,590 Exclusive: 3,810 (Net gain boardings with exclusive lane on SH119) With the BOLT and J: 4,845 Without the BOLT and J: 4,020 3,020 Without BAT Lanes: 3,040 With all BAT Lanes: 3,130 (Net gain - 90 boardings with BAT lanes on all local streets) AE - Longmont Orange/Boulder Blue: 2,380 AF - Longmont Orange/Boulder Purple: 2,310 BE - Longmont Blue/Boulder Blue: 2,260 BF - Longmont Blue/Boulder Purple: 2,160 CE - Rev. Longmont Purple/Boulder Blue: 2,440 CF - Rev. Longmont Purple/Boulder Orange: 2,350 3,410 3,320 Service Hours With the BOLT and J = 37, ,700 = 72,600. Without BOLT and J = 37,900 With the BOLT and J = 74,200-82,700. Without the BOLT and J = 39,500 to 48,000 With the BOLT and J = 71, ,700 = 106,300. Without BOLT and J = 71,600 With the BOLT and J = 46, ,700 = 81,100. Without BOLT and J = 46,400 With the BOLT and J = 91, ,700 = 126,500. Without BOLT and J = 91,800 57,400 64,500 (4 BRT lines only without BAT lanes) 41,400-52,900 (Individual Routes) 84,200 84,200 KEY for Model Iteration #7, #8, and #9 A - Longmont Orange B - Longmont Blue C - Revised Longmont Purple (via Pace) D - Longmont Green E - Boulder Blue (via Canyon to CU Main) F - Revised Boulder Purple #1 (through CU East Campus) G - Revised Boulder Blue (via Colorado to CU Main) H - Revised Boulder Green (ending at Downtown Boulder Station) I - Revised Boulder Orange (to CU East) J - Revised Boulder Purple #2 (via Foothills to Arapahoe/55th)
US287 Asset Inventory FLEX Routes. Figure 3-1 FLEX Routes and Stops
 Chapter 3: FLEX Routes Two transit routes traverse the US287 corridor. Chapter 3 provides information about the two transit routes, the FLEX Loveland/Longmont Local route and the FLEX Boulder Express Route,
PREFACE. Service frequency; Hours of service; Service coverage; Passenger loading; Reliability, and Transit vs. auto travel time.
 PREFACE The Florida Department of Transportation (FDOT) has embarked upon a statewide evaluation of transit system performance. The outcome of this evaluation is a benchmark of transit performance that
Quality of Life Study
 FasTracks: Quality of Life Study Transportation Systems Performance Measurement Conference May 19, 2011 Overview Quality of Life Study Background/Purpose Study Scope Reporting Example Measures 2 RTD Regional
Chapel Hill Transit: Short Range Transit Plan. Preferred Alternative DRAFT
 : Short Range Transit Plan Preferred Alternative August 2018 Table of Contents Executive Summary... 1 Preferred Alternative... 3 Best Practices for Route Design... 3 Project Goals... 4 Preferred Alternative...
Interstate 90 and Mercer Island Mobility Study APRIL Commissioned by. Prepared by
 Interstate 90 and Mercer Island Mobility Study APRIL 2017 Commissioned by Prepared by Interstate 90 and Mercer Island Mobility Study Commissioned by: Sound Transit Prepared by: April 2017 Contents Section
DEMOGRAPHICS AND EXISTING SERVICE
 EXECUTIVE SUMMARY The Central Corridor light-rail transit (LRT) project will open in 2014 and operate between downtown Minneapolis and downtown St. Paul, serving the University of Minnesota and University
Table E1 Summary of Annual Revenue Service Hours. System LTC Routes 581, , , , ,082 (Quick Start)
") L O N D O NT R A N S I TC O MMI S S I O N T r a n s i t N e t w o r k R a p i dt r a n s i t I n t e g r a t i o nf r a me w o r k FI NAL REPORT Augus t2016 Su bmi t t e dby : Di l l on Consul t i ng Li
L O N D O NT R A N S I TC O MMI S S I O N T r a n s i t N e t w o r k R a p i dt r a n s i t I n t e g r a t i o nf r a me w o r k FI NAL REPORT Augus t2016 Su bmi t t e dby : Di l l on Consul t i ng Li
New System. New Routes. New Way. May 20, 2014
 Route Optimization I N I T I A T I V E New System. New Routes. New Way. May 20, 2014 1 Welcome Blueprint for Transportation Excellence (BTE) 20 year strategic plan Blueprint 2020 JTA s five-year plan for
Service Performance 2013 Networked Family of Services
 Service Performance 2013 Networked Family of Services Overview RTD s Mission is: "To meet our constituents' present and future public transit needs by offering safe, clean, reliable, courteous, accessible
Appendix 4.1 J. May 17, 2010 Memorandum from CTPS to the Inter Agency Coordinating Group
 Appendix 4.1 J May 17, 2010 Memorandum from CTPS to the Inter Agency Coordinating Group CTPS CENTRAL TRANSPORTATION PLANNING STAFF Staff to the Boston Region Metropolitan Planning Organization MEMORANDUM
CHERRIOTS 2018 SERVICE PLAN 1
 1. Introduction... 2 2. Changes from proposal... 3 2.1 Route 7 reroute... 3 2.2 Route 6 reroute... 3 3. Service plan... 4 3.1 Transferring at Chemeketa Community College... 4 3.1.1 Route 3... 4 3.1.2 Route
8 CROSS-BOUNDARY AGREEMENT WITH BRAMPTON TRANSIT
 8 CROSS-BOUNDARY AGREEMENT WITH BRAMPTON TRANSIT The Transportation Services Committee recommends the adoption of the recommendations contained in the following report dated May 27, 2010, from the Commissioner
SAN LUIS OBISPO TRANSIT + SAN LUIS OBISPO RTA JOINT SHORT RANGE TRANSIT PLANS: SERVICE STRATEGIES. Presented by: Gordon Shaw, PE, AICP; Principal
 SAN LUIS OBISPO TRANSIT + SAN LUIS OBISPO RTA JOINT SHORT RANGE TRANSIT PLANS: SERVICE STRATEGIES Presented by: Gordon Shaw, PE, AICP; Principal Project Status Review of existing services and setting complete
The Boulder (and Boulder County) Experience. June 6 th, 2017 RTD s Pass Program Working Group 2 nd Meeting
 Experience. June 6 th, 2017 RTD s Pass Program Working Group 2 nd Meeting") The Boulder (and Boulder County) Experience June 6 th, 2017 RTD s Pass Program Working Group 2 nd Meeting The Boulder (and Boulder County) Experience This will cover: 1) Eco Pass Revenues to RTD 2) Public
The Boulder (and Boulder County) Experience June 6 th, 2017 RTD s Pass Program Working Group 2 nd Meeting The Boulder (and Boulder County) Experience This will cover: 1) Eco Pass Revenues to RTD 2) Public
WATERBORNE TRANSIT. April 21, 2010
 WATERBORNE TRANSIT CONCEPTS STUDY April 21, 2010 1 Overview: Summary of previous 2004/2005 Ferry Service analysis Results of recent study focusing on ferry service from Newport News Conclusions 2 2004/2005
Title VI Service Equity Analysis
 Pierce Transit Title VI Service Equity Analysis Pursuant to FTA Circular 4702.1B NE Tacoma Service May 2016 Pierce Transit Transit Development Dept. PIERCE TRANSIT TITLE VI SERVICE EQUITY ANALYSIS TABLE
LA Metro Rapid - Considerations in Identifying BRT Corridors. Martha Butler LACMTA, Transportation Planning Manager Los Angeles, California
 LA Metro Rapid - Considerations in Identifying BRT Corridors Martha Butler LACMTA, Transportation Planning Manager Los Angeles, California LA Metro Transportation planner/coordinator, designer, builder
CobbLinc Forward Service Package
 The Cobb County Department of Transportation is conducting a short-term plan for CobbLinc to meet future transportation needs for residents, workers, and businesses. updates to CobbLinc Transit would be
Ozaukee County Transit Development Plan
 Ozaukee County Transit Development Plan Record of Public Comments and Recommended Transit Service Plan June 5, 2018 Kevin Muhs Deputy Director #242846 Status of the Transit Development Plan Existing Conditions
RACINE COUNTY PUBLIC TRANSIT PLAN:
 RACINE COUNTY PUBLIC TRANSIT PLAN: 2013-2017 Recommended Transit Service Improvement Plan NEWSLETTER 3 SEPTEMBER 2013 This newsletter describes the final recommended public transit plan for the City of
Memorandum. Roger Millar, Secretary of Transportation. Date: April 5, Interstate 90 Operations and Mercer Island Mobility
 Memorandum To: From: The Honorable Dow Constantine, King County Executive; The Honorable Ed Murray, City of Seattle Mayor; The Honorable Bruce Bassett, City of Mercer Island Mayor; The Honorable John Stokes,
Study Overview and Context
 Study Overview and Context North Shore Coordination Plan Study Study Highlights Early 2016 to December 2017 Consultant team assistance Steering Committee review Two rounds of public open house events Project
meeting, focusing instead on making sure everyone participating in the meeting has an opportunity to be heard.
 February 2, 2012 Page 2 meeting, focusing instead on making sure everyone participating in the meeting has an opportunity to be heard. SUMMARY OF PROPOSED SERVICE CHANGES Service Reductions Route 54 Montbello
CURRENT SHORT-RANGE TRANSIT PLANNING PRACTICE. 1. SRTP -- Definition & Introduction 2. Measures and Standards
 CURRENT SHORT-RANGE TRANSIT PLANNING PRACTICE Outline 1. SRTP -- Definition & Introduction 2. Measures and Standards 3. Current Practice in SRTP & Critique 1 Public Transport Planning A. Long Range (>
SAMTRANS TITLE VI STANDARDS AND POLICIES
 SAMTRANS TITLE VI STANDARDS AND POLICIES Adopted March 13, 2013 Federal Title VI requirements of the Civil Rights Act of 1964 were recently updated by the Federal Transit Administration (FTA) and now require
Why we re here: For educational purposes only
 Transportation 2050 Why we re here: For educational purposes only Transportation 2050 Bus Elements PUBLIC TRANSIT DEPARTMENT City of Phoenix Citizens Committee on the Future of Phoenix Transportation (CCFPT)
BaltimoreLink Implementation Status Report
 BaltimoreLink Implementation Status Report February 218 Joint Chairmen s Report JH1 Executive Summary BaltimoreLink, implemented on June 18, 217, is the complete overhaul and rebranding of the core transit
Silver Line Operating Plan
 Customer Service and Operations Committee Information Item IV-A December 6, 2012 Silver Line Operating Plan Washington Metropolitan Area Transit Authority Board Action/Information Summary Action Information
Imagine the result. Bus Rapid Transit Feasibility Study. Laredo Urban Transportation Study. August 31 st, 2011
 Imagine the result Laredo Urban Transportation Study August 31 st, 2011 Bus Rapid Transit Feasibility Study Prepared for: Laredo Urban Transportation Study Prepared by: ARCADIS U.S., Inc. 2410 Paces Ferry
Metro. Board Report. File #: , File Type: Informational Report Agenda Number: 25
 Metro Board Report Los Angeles County Metropolitan Transportation Authority One Gateway Plaza 3rd Floor Board Room Los Angeles, CA File #: 2016-0249, File Type: Informational Report Agenda Number: 25 SYSTEM
DISTRICT EXPRESS LANES ANNUAL REPORT FISCAL YEAR 2017 JULY 1, 2016 JUNE 30, FloridaExpressLanes.com
 DISTRICT EXPRESS LANES ANNUAL REPORT FISCAL YEAR 2017 JULY 1, 2016 JUNE 30, 2017 FloridaExpressLanes.com This page intentionally left blank. TABLE OF CONTENTS List of Figures... ii List of Tables.... ii
TransAction Overview. Introduction. Vision. NVTA Jurisdictions
 Introduction Vision NVTA Jurisdictions In the 21 st century, Northern Virginia will develop and sustain a multimodal transportation system that enhances quality of life and supports economic growth. Investments
CHAPTER 5: Operations Plan
 CHAPTER 5: Operations Plan Report Prepared by: Contents 5 OPERATIONS PLAN... 5-1 5.1 Proposed Service Changes... 5-2 5.1.1 Fiscal Year 2017... 5-2 5.1.2 Fiscal Year 2018... 5-6 5.1.3 Fiscal Year 2019...
APPENDIX 2 TORONTO TRANSIT COMMISSION SERVICE STANDARDS AND DECISION RULES FOR PLANNING TRANSIT SERVICE
 APPENDIX 2 TORONTO TRANSIT COMMISSION SERVICE STANDARDS AND DECISION RULES FOR PLANNING TRANSIT SERVICE Contents 1 Introduction... 1 2 Network Design Standards... 2 2.1 Transit Service Classifications...
APPENDIX B COMMUTER BUS FAREBOX POLICY PEER REVIEW
 APPENDIX B COMMUTER BUS FAREBOX POLICY PEER REVIEW APPENDIX B COMMUTER BUS FAREBOX POLICY PEER REVIEW The following pages are excerpts from a DRAFT-version Fare Analysis report conducted by Nelson\Nygaard
The Importance of Service Frequency to Attracting Ridership: The Cases of Brampton and York
 The Importance of Service Frequency to Attracting Ridership: The Cases of Brampton and York Jonathan English Columbia University CUTA Conference May 2016 Introduction Is density the most important determinant
SRTA Year End Fixed Route Ridership Analysis: FY 2018
 SRTA Year End Fixed Route Ridership Analysis: FY 2018 2018 Contents Introduction... 1 A. Key Terms Used in this Report... 1 Key Findings... 2 A. Ridership... 2 B. Fare Payment... 4 Performance Analysis
Call for Public Hearing August 2019 Service Changes
 Call for Public Hearing August 2019 Service Changes Committee-of-the-Whole January 22, 2019 Rob Smith, AVP Service Planning & Scheduling 1 Recommendation To call a Public Hearing on March 12, 2019 for
Exposition Corridor Transit Project Phase 2
 Exposition Metro Line Construction Authority Final Environmental Impact Report Technical Background Report FINAL Ridership Results Version 0.4 December 2009 Prepared for: Exposition Metro Line Construction
Restoration of Historic Streetcar Services in Downtown Los Angeles
 Restoration of Historic Streetcar Services in Downtown Los Angeles Alternatives Analysis Community Update Meeting November 3, 2011 Introduction Local lead agency: Metro Federal lead agency: Federal Transit
CENTRAL OREGON REGIONAL TRANSIT MASTER PLAN
 Central Oregon Regional Transit Master Plan Volume II: Surveys and Market Research CENTRAL OREGON REGIONAL TRANSIT MASTER PLAN Volume IV: Service Plan Appendices A-B July 213 Nelson\Nygaard Consulting
Executive Summary. Introduction. Community Assessment
 Executive Summary Introduction The Red Rose Transit Authority (RRTA) Transit Development Plan provides an evaluation of existing RRTA fixed route services, with the outcome being practical recommendations
Att. A, AI 46, 11/9/17
 Total s San Diego Metropolitan Transit System POLICY 42 PERFORMANCE MONITORING REPORT Page 1 of 6 Date: 11/8/17 OBJECTIVE Develop a Customer-Focused and Competitive System The following measures of productivity
Mount Pleasant (42, 43) and Connecticut Avenue (L1, L2) Lines Service Evaluation Study Open House Welcome! wmata.com/bus
 and Connecticut Avenue (L1, L2) Lines Service Evaluation Study Open House Welcome! wmata.com/bus") Mount Pleasant (42, 43) and Connecticut Avenue (L1, L2) Lines Service Evaluation Study Open House Welcome! Study Overview and Timeline Phase 1: Collect and Analyze Data Project Kickoff, September 2017
Mount Pleasant (42, 43) and Connecticut Avenue (L1, L2) Lines Service Evaluation Study Open House Welcome! Study Overview and Timeline Phase 1: Collect and Analyze Data Project Kickoff, September 2017
METROBUS SERVICE GUIDELINES
 METROBUS SERVICE GUIDELINES In the late 1990's when stabilization of bus service was accomplished between WMATA and the local jurisdictional bus systems, the need for service planning processes and procedures
Title VI Service Equity Analysis
 Pierce Transit Title VI Service Equity Analysis Pursuant to FTA Circular 4702.1B September 2013 Service Change February 2013 Page intentionally left blank PIERCE TRANSIT TITLE VI SERVICE EQUITY ANALYSIS
rtc transit Before and After Studies for RTC Transit Boulder highway UPWP TASK Before Conditions
 rtc transit Before and After Studies for RTC Transit UPWP TASK 3403-11-14 Before Conditions Report Boulder highway June 2011 Before and After Studies for RTC Transit BOULDER HIGHWAY BEFORE STUDY UPWP Task
Treasure Island Supplemental Information Report Addendum
 1 1 1 1 0 1 0 1 0 1 Treasure Island Supplemental Information Report Addendum Introduction Purpose The purpose of this Supplemental Information Report (SIR) Addendum is to determine if the current land
Corridor Analysis. Corridor Objectives and Strategies Express Local Limited Stop Overlay on Local Service 1 Deadhead
 Corridor Analysis Outline Corridor Objectives and Strategies Express Local Limited Stop Overlay on Local Service 1 Deadhead 1 Stacey Schwarcz, "Service Design for Heavy Demand Corridors: Limited-Stop Bus
(This page intentionally left blank.)
") Executive Summary (This page intentionally left blank.) Executive Summary INTRODUCTION The Cache Valley Transit District (CVTD) contracted with the team of Transportation Consultants, Inc. () and Fehr
Executive Summary (This page intentionally left blank.) Executive Summary INTRODUCTION The Cache Valley Transit District (CVTD) contracted with the team of Transportation Consultants, Inc. () and Fehr
5.1 Traffic and Transportation
 5.1 When it opens in 2009, the Bellevue Nickel Improvement Project will increase the number of vehicles able to travel through the study area, improve travel speeds, and improve safety by reducing the
Table of Contents. List of Tables
 Table of Contents 1. Introduction... 1 2. Service Recommendations... 1 A. Extend Service on Fort Belvoir to New Post Exchange/Commissary Complex... 1 B. Improve Service Frequencies on Sunday from Current
Public Transit Services on NH 120 Claremont - Lebanon
 Public Transit Services on NH 120 Claremont - Lebanon Overview of Preferred Alternative April 12, 2011 Presentation Overview Study Goals Quick Review Methodology and Approach Key Findings Results of Public
This report recommends two new TTC transit services in southwest Toronto.
 Report for Action New TTC Services - Southwest Toronto Date: March 20, 2018 To: TTC Board From: Chief Customer Officer Summary This report recommends two new TTC transit services in southwest Toronto.
From personal to mass transit
 From personal to mass transit Prof. em. Ingmar Andreasson ingmar@logistikcentrum.se 40 years in transportation Transit network planning - VIPS Taxi fleet management - Taxi80 Multi-discipline PRT research
Service Performance 2012 Networked Family of Services
 Service Performance 2012 Networked Family of Services Overview RTD s Mission is: "To meet our constituents' present and future public transit needs by offering safe, clean, reliable, courteous, accessible
COLT RECOMMENDED BUSINESS PLAN
 COLT RECOMMENDED BUSINESS PLAN 2008 INTRODUCTION The past decade has been one of change in Lebanon County and this situation is expected to continue in the future. This has included growth in population,
Date: 11/6/15. Total Passengers
 Total San Diego Metropolitan Transit System POLICY 42 PERFORMANCE MONITORING REPORT Page 1 of 6 OBJECTIVE Develop a Customer-Focused and Competitive System The following measures of productivity and service
KING STREET TRANSIT PILOT
 KING STREET TRANSIT PILOT Update toronto.ca/kingstreetpilot #kingstreetpilot HIGHLIGHTS TRANSIT RIDERSHIP TRANSIT CAPACITY To respond to this growth in ridership, the TTC has increased the capacity of
East Farmingdale Fire Department 930 Conklin Street. Source: Parsons Brinckerhoff
 Route 110 Alternatives Analysis Public Meeting #2 April 27, 2015 East Farmingdale Fire Department 930 Conklin Street Source: Parsons Brinckerhoff Agenda Welcome/Project Background Jonathan Keyes Director,
Chapter 3. Burke & Company
 Chapter 3 Burke & Company 3. WRTA RIDERSHIP AND RIDERSHIP TRENDS 3.1 Service Overview The Worcester Regional Transit Authority (WRTA) provides transit service to over half a million people. The service
Bus Corridor Service Options
 Bus Corridor Service Options Outline Corridor Objectives and Strategies Express Local Limited Stop Overlay on Local Service 1 Deadhead 1 Stacey Schwarcz, "Service Design for Heavy Demand Corridors: Limited-Stop
Memorandum. Fund Allocation Fund Programming Policy/Legislation Plan/Study Capital Project Oversight/Delivery Budget/Finance Contract/Agreement Other:
 Memorandum Date: March 23, 2018 To: Transportation Authority Board From: Eric Cordoba Deputy Director Capital Projects Subject: 4/10/18 Board Meeting: San Francisco Freeway Corridor Management Study Update
Service Change Plan Cowichan Valley Regional Transit System July 2018 Expansion. Prepared by
 Service Change Plan Cowichan Valley Regional Transit System July 18 Expansion Prepared by OVERVIEW In order to continue delivering on the Cowichan Valley Transit Future Plan goals and objectives and to
Service Performance 2010 Networked Family of Services
 Service Performance 2010 Networked Family of Services Overview RTD s Mission is: "To meet our constituents' present and future public transit needs by offering safe, clean, reliable, courteous, accessible
#1. Why is the City doing this project?
 Community Workshop #2 January 2016 #1. Why is the City doing this project? Broadway and Lincoln are in constant change Broadway and Lincoln are in constant change Broadway and Lincoln are in constant change
North Shore Coordination Plan. Steering Committee Meeting #5 November 28, 2017
 North Shore Coordination Plan Steering Committee Meeting #5 November 28, 2017 Today s Meeting Welcome & Introductions Project Activities Recap Route Network Service Changes Implementation Plan & Timeline
Service Performance 2017 Networked Family of Services
 Subsidy per Boarding or Effectiveness Service Performance 2017 Networked Family of Services Overview RTD s Mission is: "To meet our constituents' present and future public transit needs by offering safe,
Madison Metro Transit System
 Madison Metro Transit System 1101 East Washington Avenue Madison, Wisconsin, 53703 Administrative Office: 608 266 4904 Fax: 608 267 8778 TO: FROM: SUBJECT: Plan Commission Timothy Sobota, Transit Planner,
Longmont to Boulder Regional Trail Jay Road Connection DRAFT FINAL REPORT
 Longmont to Boulder Regional Trail Jay Road Connection DRAFT FINAL REPORT December 2018 Project Summary Boulder County, Colorado, in partnership with the City of Boulder, is evaluating options for multi-use
2040 Regional Transit Element Adopted August 6, 2015
 2040 Regional Transit Element Adopted August 6, 2015 TABLE OF CONTENTS LIST OF ACRONYMS... 5 EXECUTIVE SUMMARY... 7 CHAPTER 1: INTRODUCTION... 9 CHAPTER 2: SOCIO-ECONOMIC PROFILE... 12 CHAPTER 3: EXISTING
Rapid Transit From Arbutus Street to UBC. Policy and Strategic Priorities Council Meeting January 30, 2019
 Rapid Transit From Arbutus Street to UBC Policy and Strategic Priorities Council Meeting January 30, 2019 Agenda 1. A History of Planning for Broadway Rapid Transit 2. The Need for Broadway Rapid Transit
HOW TO IMPROVE HIGH-FREQUENCY BUS SERVICE RELIABILITY THROUGH SCHEDULING
 HOW TO IMPROVE HIGH-FREQUENCY BUS SERVICE RELIABILITY THROUGH SCHEDULING Ms. Grace Fattouche Abstract This paper outlines a scheduling process for improving high-frequency bus service reliability based
ROUTE 103. Morrisville Shopping Shuttle ROUTE OVERVIEW
 ROUTE 103 Morrisville Shopping Shuttle ROUTE OVERVIEW Route 103 is a Shuttle route that operates between Stowe and Morrisville. The route travels primarily along VT Route 100 and provides service to Stowe
Kingston Transportation Master Plan Draft Report Transit Forecasting 1
 TRANSIT FORECASTING Transit Forecasting 1 INTRODUCTION A spreadsheet model was developed to identify existing transit deficiencies and additional transit service requirements. The model comprised transit
ROUTE 110. St. Albans Downtown Shuttle ROUTE OVERVIEW
 ROUTE 110 St. Albans Downtown Shuttle ROUTE OVERVIEW Route 110 is a Rural Local route that provides circulator service in and around downtown St. Albans (see Figure 1). To the north, the route serves the
2018 Service Changes Ada County
 2018 Service Changes Ada County System Benefits 15 minute headways on State Street during peak hours o 30 minutes on Saturdays 30 minute headways on Emerald all day on weekdays More frequent and direct
Pinellas Suncoast Transit Authority Community Bus Plan
 Pinellas Suncoast Transit Authority Community Bus Plan FINAL REPORT JANUARY 2014 Prepared by: TABLE OF CONTENTS Executive Summary... 2 Community Bus Plan Introduction... 22 Previous Studies... 25 Market
This report recommends routing changes resulting from the Junction Area Study.
 For Action Routing Changes Junction Area Study Date: April 11, 2019 To: TTC Board From: Chief Customer Officer Summary The TTC operates an established and mature bus network. TTC staff conduct localized
Chapter 5 Alternatives
 Chapter 5 Alternatives DEVELOPMENT OF ALTERNATIVES The TDP alternatives presented in this chapter were based on input collected through rider surveys, community surveys, online surveys, public meetings,
PLEASE READ Proposal for Sustainable Service
 IMPORTANT PLEASE READ 019 Proposal for Sustainable Service 019 Service Change Proposal IMPLEMENT A SUSTAINABLE NETWORK Everett Transit completed its Long Range Plan in May, and the plan was adopted by
Appendix H: North Corridor Alternatives Through Western University - July 2017
 Appendix H: North Corridor Alternatives Through Western University - July 2017 1 Overview The North corridor to Masonville Place from Downtown was examined with respect to three possible routings: 1. Utilizing
Existing Services, Ridership, and Standards Report. June 2018
 Existing Services, Ridership, and Standards Report June 2018 Prepared for: Prepared by: Contents Overview of Existing Conditions... 1 Fixed Route Service... 1 Mobility Bus... 34 Market Analysis... 41 Identification/Description
KING STREET PILOT STUDY PUBLIC MEETING
 KING STREET PILOT STUDY PUBLIC MEETING 2017.02.13 PUBLIC WORK with GEHL STUDIO / NEW YORK SWERHUN ASSOCIATES SAM SCHWARTZ CONSULTING LLC STARTING POINTS 17 1 - TRANSIT FIRST! Transit service is beyond
4. Proposed Transit Improvements
 4. Proposed Transit Improvements The following proposed transit improvements have been assembled based on input received from the community meetings and from review and coordination with the TAC as well
Alternatives: Strategies for Transit Systems Change
 Alternatives: Strategies for Transit Systems Change There is a broad array of options for modification of transit operations to make it more cost effective and efficient. These are typically examined to
A. CONCLUSIONS OF THE FGEIS
 Chapter 11: Traffic and Parking A. CONCLUSIONS OF THE FGEIS The FGEIS found that the Approved Plan will generate a substantial volume of vehicular and pedestrian activity, including an estimated 1,300
HDR itrans Consulting Inc. 100 York Blvd., Suite 300 Richmond Hill, ON L4B 1J8 Tel: (905) Fax: (905)
 Fax: (905)") !" # $ !" # $ Consulting Inc. 100 York Blvd., Suite 300 Richmond Hill, ON L4B 1J8 Tel: (905) 882-4100 Fax: (905) 882-1557 www.itransconsulting.com November 2009 %&'('$&$ 1. West Brampton Road Network...
!" # $ !" # $ Consulting Inc. 100 York Blvd., Suite 300 Richmond Hill, ON L4B 1J8 Tel: (905) 882-4100 Fax: (905) 882-1557 www.itransconsulting.com November 2009 %&'('$&$ 1. West Brampton Road Network...
7:00 p.m. General meeting called to order. Paul Conte, Chair 7:05 p.m. Introductions Reminder: All JWN members should fill out and return a sign-in
 Agenda 7:00 p.m. General meeting called to order. Paul Conte, Chair 7:05 p.m. Introductions Reminder: All JWN members should fill out and return a sign-in card to receive a ballot. All guests are requested
PUBLIC TRANSIT IN KENOSHA, RACINE, AND MILWAUKEE COUNTIES
 PUBLIC TRANSIT IN KENOSHA, RACINE, AND MILWAUKEE COUNTIES #118404v1 Regional Transit Authority June 19, 2006 1 Presentation Overview Existing Public Transit Transit System Peer Comparison Recent Transit
Arlington County Board Meeting Project Briefing. October 20, 2015
 Arlington County Board Meeting Project Briefing October 20, 2015 Project Map 2 Project Context Only Interstate in the Country limited to HOV only traffic during rush hours Stoplight at the end of I-66
I-95/395 HOV/Bus/HOT Lanes Project Overview
 I-95/395 HOV/Bus/HOT Lanes Project Overview 2 I-95/395 HOV/Bus/HOT Lanes Meetings Agenda 7 p.m. to 9 p.m. Open House Information Stations and Q&A With Project Staff 7:30 p.m. and 8:30 p.m. Project Overview
Central Oregon Intergovernmental Council
 Central Oregon Intergovernmental Council Regional Transit Master Plan (RTMP) Technical Advisory Committee March 8, 2013 Agenda Introductions (5 min) Project Update (5 min) Updated Demand Estimates (5 min)
Section II. Planning & Public Process Planning for the Baker/Carver Regional Trail began in 2010 as a City of Minnetrista initiative.
 Section II Planning & Public Process Planning for the began in 2010 as a City of initiative. city staff began discussions with the Park District on the possibility of a north/south regional trail connection
1.2 Corridor History and Current Characteristics
 SECTION 1 Description and Background of Study Area 1.1 Introduction This preliminary engineering report was prepared for the Alaska Department of Transportation and Public Facilities (ADOT&PF). It is part
EVALUATION OF TRANSIT SIGNAL PRIORITY EFFECTIVENESS USING AUTOMATIC VEHICLE LOCATION DATA
 EVALUATION OF TRANSIT SIGNAL PRIORITY EFFECTIVENESS USING AUTOMATIC VEHICLE LOCATION DATA A Thesis Presented to The Academic Faculty by Carl Andrew Sundstrom In Partial Fulfillment of the Requirements
Assessment of Travel Trends
 I - 2 0 E A S T T R A N S I T I N I T I A T I V E Assessment of Travel Trends Prepared for: Metropolitan Atlanta Rapid Transit Authority Prepared by: AECOM/JJG Joint Venture Atlanta, GA October 2011 General
DAILY TRIPS (LOOP) Monday-Friday 6:55 AM to 6:20 PM 60/60/ 11 Saturday 7:55 AM to 5:55 PM 60/ 10 Sunday
 Monday-Friday 6:55 AM to 6:20 PM 60/60/ 11 Saturday 7:55 AM to 5:55 PM 60/ 10 Sunday") ROUTE 81 BARRE HOSPITAL HILL ROUTE OVERVIEW Route 81 is a Rural Local route that operates between Downtown Barre and the Berlin Shaw s. The route travels outbound from downtown Barre along Airport Road
ROUTE 81 BARRE HOSPITAL HILL ROUTE OVERVIEW Route 81 is a Rural Local route that operates between Downtown Barre and the Berlin Shaw s. The route travels outbound from downtown Barre along Airport Road
Call for Public Hearing August 2019 Service Changes
 Call for Public Hearing August 2019 Service Changes Operations, Safety & Security Committee January 8, 2019 Rob Smith, AVP Service Planning & Scheduling 1 Recommendation To call a Public Hearing on March
EL PASO COUNTY REGIONAL TRANSIT INSTITUTIONAL OPTIONS ASSESSMENT STUDY
 EL PASO COUNTY REGIONAL TRANSIT INSTITUTIONAL OPTIONS ASSESSMENT STUDY Sponsored by: El Paso County Funding Support: Texas Department of Transportation Technical Assistance to the County: Texas A&M Transportation