TravelClick: Business Intelligence Lodging Outlook. Sara Duggan. Regional Vice President, Business Intelligence TravelClick 03/23/18
|
|
|
- Roderick Curtis
- 5 years ago
- Views:
Transcription
1 TravelClick: Business Intelligence 2018 Lodging Outlook Sara Duggan Regional Vice President, Business Intelligence TravelClick 03/23/18


2 25,000+ Partners
3 Million $49 Billion 365 North America Markets Room Nights Annual Room Revenue Days in the future
4 2017 Q4 Wrap Up


5 2017 Q4 Customer Segmentation Transient Room Nights 3.5% 13.4% 24.8% Retail Discount 21.3% Brand.com 30.8% CRO 23.1% Negotiated Direct 35.2% Qualified Wholesale 17.8% 19.5% 10.6% GDS OTA 100% 80% 60% 40% 20% 0% Brand.com CRO Direct GDS OTA Wholesale Qualified Negotiated Discount Retail
6 2017 Q4 Channel Performance Transient Room Nights 30.6% % of Transient Var % vs LY Var % vs LY (Across All Markets) 19.4% 17.7% 21.2% 3.5% 1.7% 5.8% 10.5% 8.8% Brand.com Direct GDS CRO OTA -3.9%


7 2017 Q4 Loyalty vs. Non-Loyalty Performance % of Transient Room Nights 45% 40% Loyalty Non-Loyalty 39.3% 35% 30% 25% 60.7% 20% 15% 10% 5% 0% Brand.com GDS Direct CRO OTA
8 GDS Year over Year Performance Hotel Bookings (In Millions)

9 2017 Q4 Channel Performance Transient Average Daily Rate ADR $163 $155 $199 $178 Var % to LY $ % 1.4% 1.9% 0.3% 1.2% Brand.com Direct GDS CRO OTA
10
11 2017 Q4 Group Occupancy Atlanta Boston Charlotte Chicago Dallas Denver Detroit Honolulu Houston Indianapolis Los Angeles Miami Minneapolis St Paul New York Orlando Philadelphia Phoenix San Antonio San Diego San Francisco Seattle St Louis Tampa Toronto Washington DC Variance % versus Last Year -40% -20% 0% 20% 40% +5.2% As Of: March 1, 2018 Scope: Occupancy (Group Sold) Legend: Group Block Variance All Markets
12 2017 Q4 Segment Mix for Top 25 Markets Group Segmentation SMERF Government Association Corporate Top 10 Corporate Sub Segments 2016 Q Q4 Change Training/Education 6.94% 7.68% 0.74% Technology 6.98% 7.45% 0.47% HealthCare 7.14% 7.23% 0.09% Financial/Banking 6.47% 6.71% 0.24% Manufacturing 5.31% 5.44% 0.13% Pharmaceutical 3.93% 3.89% -0.04% Travel 2.90% 2.50% -0.40% Insurance 2.47% 2.73% 0.26% Legal 2.52% 2.64% 0.12% Consulting 2.43% 2.60% 0.17% Top 10 Total 47.09% 48.87% 1.78% Other Corp Sub Segments 52.92% 51.15% -1.77% As Of: March 14, 2018 Scope: Segmentation of Top 25 Markets Top 10 Corporate Sub Segments 2016 Q Q4 Change Corporate 65.38% 66.66% 1.28% Association 13.92% 12.89% (1.03%) Government 2.45% 2.53% 0.08% SMERF 18.25% 17.91% (0.34%) Source: Knowland
13 2018
14 Room Nights Var % to LY Nationally, business on the books for the coming 12 months is up 1.4% over same time last year 20,000,000 16,000,000 Top 25 North American Markets 50.00% 40.00% 12,000, % 8,000, % 4,000, % 0 Mar Apr May Jun Jul Aug Sep Oct Nov Dec Jan Feb Group Transient Var % to LY Full Yr Var % 0.00%
15 Room Nights 12 Month Outlook by Month 20,000,000 15,000,000 10,000,000 Current on the Books and Last Year Variance Future 12 Months As Of: March 1, 2018 Scope: Committed Occupancy (Group Block + Transient Reserved) Legend: TY Room Night LY Room Nights 5,000, /18 04/18 05/18 06/18 07/18 08/18 09/18 10/18 11/18 12/18 01/19 02/19
16 Group & Transient both show occupancy growth while still holding strong on rate Room Nights ADR Group Transient Business Transient Leisure +0.4% +1.3% +1.4% +2.8% +4.7% +2.2% Negotiated, Retail Discount, Qualified, Wholesale Year over year variance % to same time last year for demand on the books for 2018 in top 25 North American markets
17 Group
18 2018 Q2 - Q4 Group Occupancy Outlook Variance % versus Last Year -30% -15% 0% 15% 30% Pace Variance % versus Last Year -20% -10% 0% 10% 20% Atlanta Boston Charlotte Chicago Dallas Denver Detroit Honolulu Houston Indianapolis Los Angeles Miami Minneapolis St Paul New York Orlando Philadelphia Phoenix San Antonio San Diego San Francisco Seattle St Louis Tampa Toronto Washington DC +1.3% Atlanta Boston Charlotte Chicago Dallas Denver Detroit Honolulu Houston Indianapolis Los Angeles Miami Minneapolis St Paul New York Orlando Philadelphia Phoenix San Antonio San Diego San Francisco Seattle St Louis Tampa Toronto Washington DC +0.1% As Of: March 1, 2018 Scope: Occupancy (Group Block) Legend: Group Block Variance All Markets
19 Room Nights on the Books Percent Change From STLY Pace for the next 5 Years Group Occupancy Outlook 14,000,000 11,818,302 11,659, % As Of: January 1, ,000,000 - (7,000,000) (14,000,000) 9,627,249 9,985, % 7,764,570 7,496,696 5,888,542 6,017, % 2 Years Out 3 Years Out 4 Years Out 5 Years Out -1.3% -3.4% 3.0% 1.0% -1.0% -3.0% -5.0% Scope: Occupancy (Group Block) Markets Included: Atlanta Charlotte Chicago Dallas Denver Hawaii Houston Indianapolis Los Angeles Miami Orlando Philadelphia Phoenix San Antonio San Francisco Seattle St. Louis Tampa Toronto Washington, DC STLY Current Percent Change Source: Knowland TAP Report
20 Transient
21 Transient Occupancy Outlook 2018 Q1 vs 2017 Q Q2 Outlook* North America OCC ADR OCC ADR Transient 2.4% 1.2% 1.2% 2.0% Retail 5.8% 0.6% 0.5% 2.6% Negotiated -2.0% 1.2% -1.4% 2.4% Discount -0.2% 0.9% 0.5% 1.8% Qualified 8.2% 1.3% 8.0% 1.2% Wholesale 8.1% 0.2% -2.7% 1.5%


22 2018 Q2 Transient Occupancy Outlook Atlanta Boston Charlotte Chicago Dallas Denver Detroit Honolulu Houston Indianapolis Los Angeles Miami Minneapolis St Paul New York Orlando Philadelphia Phoenix San Antonio San Diego San Francisco Seattle St Louis Tampa Toronto Washington DC Variance % versus Last Year -30% -15% 0% 15% 30% +1.2% Atlanta Boston Charlotte Chicago Dallas Denver Detroit Honolulu Houston Indianapolis Los Angeles Miami Minneapolis St Paul New York Orlando Philadelphia Phoenix San Antonio San Diego San Francisco Seattle St Louis Tampa Toronto Washington DC Pace Variance % versus Last Year -5% 0% 5% -0.4% Legend: Transient Reserved Variance All Markets
 19.3% 0.8% 7.4% 4.1% 11.3% 25.")
23 2018 Q2 Channel Performance Transient Room Nights 36.2% % of Transient Var % vs LY Var % vs LY (Across All Markets) 19.3% 0.8% 7.4% 4.1% 11.3% 25.2% 9.2% -5.4% -6.2% Brand.com Direct GDS CRS OTA
24 2018 Q2 Channel Performance Transient Average Daily Rate ADR Var % to LY $194 $176 $245 $221 $ % 2.1% 2.4% 1.0% 0.2% Brand.com Direct GDS CRS OTA
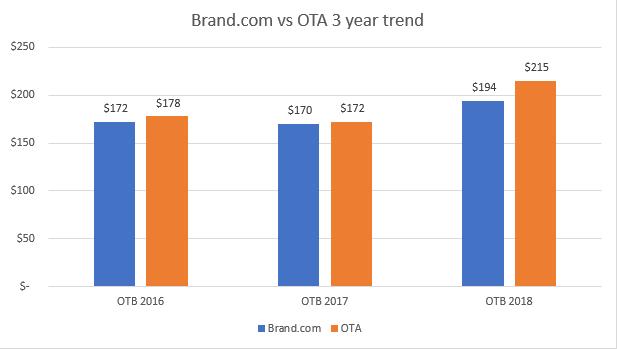
25 2018 Outlook The Knowland data indicates Corporate Group still growing. However, Individual Corporate Travel continues to decline. How are your sales teams adjusting their strategy to drive this mid-week business? Looking out 4 years, the Knowland data shows convention business is strong, excluding Larger big box hotels should monitor 2021 and consider a strategy to compensate for this potential gap. Although Brand.com continues to drive the majority of bookings, OTA growth YOY is significant. The ADR gap between these two channels continues to widen, will it actualize? Don t lose focus on cost per channel Loyal guest bookings continue to grow. They form the backbone of Brand.com s continued dominance in overall room night contribution Business on the books for 2018 is positive RevPAR is up - 4.4% Driven by a strong Occupancy base - 5.8% (Business 4.3% and Leisure 7.0%) ADR on the books is up 2% over last year
26 Sara Duggan March 23, 2018
Lodging Industry Overview. 14 December Bobby Bowers Smith Travel Research / STR Global
 Lodging Industry Overview 14 December 2011 Bobby Bowers Smith Travel Research / STR Global Global / U.S. Overview Key U.S. Markets Construction Pipeline Forecast Takeaways Today s Agenda RevPar Growth
Fort Lauderdale August 8, 2017
 Fort Lauderdale August 8, 2017 8/10/2017 TAP Software Analytics Division Brian Finucane TAP Reports Jeff Eastman TAP Hotel Reports Jeanne Eastman TAP Data Source Jeff Eastman Cloud Database Numerous Data
Hotel Industry Performance Overview Washington Lodging Convention
 Hotel Industry Performance Overview Washington Lodging Convention Valerie Woods Director of Business Development, Hotels vwoods@str.com Valerie_STR 2016 STR, Inc. All Rights Reserved. Any reprint, use
Measures & Projections October 31, GoToBermuda.com
 Measures & Projections October 31, 2015 GoToBermuda.com October Total Vacation Visitor Arrivals Vacation Arrivals Oct-14 Oct-15 2015 Air Vacation 9,203 10,344 1,141 12.40 126,842 127,044 202 0.16 Cruise
Hotel InduSTRy Overview What Lies Ahead
 University of Massachusetts Amherst ScholarWorks@UMass Amherst Tourism Travel and Research Association: Advancing Tourism Research Globally 2013 Marketing Outlook Forum - Outlook for 2014 Hotel InduSTRy
San Francisco Travel Association Selling in a Seller s Market DMO Perspective. May 21, 2014
 San Francisco Travel Association Selling in a Seller s Market DMO Perspective May 21, 2014 Agenda Discussion Themes 1. Meetings Are Important 2. Market Meetings Pace 3. Occupancy & Rate 4. Booking Windows
Hotel InduSTRy Overview
 Hotel InduSTRy Overview Lindsay Culbreath, CMHS, CHIA Senior Director of Business Development & Marketing STR Tennessee Business Travel Association October 14, 2014 STR provides monthly, weekly and daily
Monthly Employment Watch: Milwaukee and the Nation's Largest Cities
 Monthly Employment Watch: Milwaukee and the Nation's Largest Cities A monthly report on employment trends in the nation s largest cities Prepared by: The University of Wisconsin-Milwaukee Center for Economic
University of Denver
 Glenn R. Mueller, Ph.D. Professor University of Denver Franklin L. Burns School of Real Estate & Construction Management & Real Estate Investment Strategist glenn.mueller@du.edu Supply The new supply of
National Housing Trends
 National Housing Trends America s Choice of Best Long Term Investment Gallup 2017 The Cost of RENTING vs. BUYING HISTORICALLY: NOW: Percentage of Income Needed to Afford Median Rent 25.8% 29.2% Percentage
HOTEL INDUSTRY OVERVIEW. Texas
 HOTEL INDUSTRY OVERVIEW Texas DEMAND GROWTH STRONG BALANCED OCC & ADR GROWTH % Change Room Supply* 149M 1.3% Room Demand* 92M 5.6% Occupancy 61.6% 4.3% A.D.R. $90 4.4% RevPAR $55 8.9% Room Revenue* $8.3B
Mango Market Development Index
 Mango Market Development Index 2016-2017 Understanding the Market Index The Mango Market Development Index is designed to measure and compare mango volume sold at retail relative to population by region
Finding Rationality in an Irrational World: The Economics of Successful Hotel Negotiations
 Finding Rationality in an Irrational World: The Economics of Successful Hotel Negotiations Isaac Collazo, Vice President, Performance Strategy & Planning, InterContinental Hotels Group (IHG) Maria Lowry,
U.S. Hotel Industry Performance HBI Annual Conference
 U.S. Hotel Industry Performance HBI Annual Conference February 17, 2017 Jeff Higley VP/Editorial Director jeff@str.com @jeffhigley1 2016 STR, Inc. All Rights Reserved. Any reprint, use or republication
Monthly Employment Watch: Milwaukee and the Nation's Largest Cities
 Monthly Employment Watch: Milwaukee and the Nation's Largest Cities A monthly report on employment trends in the nation s largest cities Prepared by: The University of Wisconsin-Milwaukee Center for Economic
MPI Nashville Chapter
 MPI Nashville Chapter Monthly Meeting Embassy Suites Cool Springs September 20, 2017 Veronica Andrews Director, Digital Data Solutions vandrews@str.com @STR_Data 2017 STR, Inc. All Rights Reserved. Any
BLACK KNIGHT HPI REPORT
 CONTENTS 1 OVERVIEW 2 NATIONAL OVERVIEW 3 LARGEST STATES AND METROS 4 FEBRUARY S BIGGEST MOVERS 5 20 LARGEST STATES 6 40 LARGEST METROS 7 ADDITIONAL INFORMATION OVERVIEW Each month, the Data & Analytics
August Air Traffic Statistics. Prepared by the Office of Marketing & Consumer Strategy
 August 218 Air Traffic Statistics Prepared by the Office of Marketing & Consumer Strategy This report includes only data submitted by airlines as of the date of publication: October 17, 218. Reports are
January 2018 Air Traffic Activity Summary
 January 2018 Air Traffic Activity Summary Jan-2018 Jan-2017 CY-2018 CY-2017 Passengers 528,947 505,421 4.7% 528,947 505,421 4.7% Passengers 537,332 515,787 4.2% 537,332 515,787 4.2% Passengers 1,066,279
Puget Sound Trends. Executive Board January 24, 2019
 Puget Sound Trends Executive Board January 24, 2019 Overview Topics covered in today s presentation: How many jobs are there? Housing Trends Where do people work? How long does it take to get to work?
September Air Traffic Statistics. Prepared by the Office of Marketing & Consumer Strategy
 September 217 Air Traffic Statistics Prepared by the Office of Marketing & Consumer Strategy This report includes only data submitted by airlines as of the date of publication: November 15, 217. Reports
November Air Traffic Statistics. Prepared by the Office of Corporate Risk and Strategy
 November 214 Air Traffic Statistics Prepared by the Office of Corporate Risk and Strategy Air Traffic Statistics Table of Contents Summary Air Traffic Summary... 1 SH&E Air Traffic Schedule Activity...
U.S. Hotel Industry Performance What Lies Ahead
 U.S. Hotel Industry Performance What Lies Ahead Vail R. Brown, CHMS Vice President, Global Business Development & Marketing vail_str May 5, 2015 vbrown@str.com 1. Visit www.hotelnewsnow.com 2. Create Free
U.S. Hotel Industry Performance. Brad Garner Chief Operating Officer
 U.S. Hotel Industry Performance Brad Garner Chief Operating Officer 1 Agenda Total US Review Scale Review Segmentation Markets Supply Pipeline 2013 / 2014 Forecast 2 www.hotelnewsnow.com Click on Hotel
Have Higher Transportation Costs and a Slowing U.S. Economy Shifted Lodging Demand Within Lodging Sectors?
 Have Higher Transportation Costs and a Slowing U.S. Economy Shifted Lodging Demand Within Lodging Sectors? Trends and implications for sales and marketing strategies: Hotel Sales Strategy Conference Washington,
December Air Traffic Statistics. Prepared by the Office of Marketing & Consumer Strategy
 December 217 Air Traffic Statistics Prepared by the Office of Marketing & Consumer Strategy 1 This report includes only data submitted by airlines as of the date of publication: February 2, 217. Reports
MANGO MARKET DEVELOPMENT INDEX REPORT
 MANGO MARKET DEVELOPMENT INDEX REPORT 2015-2016 UNDERSTANDING THE MARKET INDEX The Mango Market Development Index is designed to measure and compare mango sales volume relative to population by region
Visit Loudoun 2016 Lodging Market Research
 2016 Lodging Market Research Prepared for: Loudoun County Lodging Market Research & Analysis Study Conducted: November December 2016 Final Report Submitted: December 2016 2016 Lodging Market Analysis Summary
Lower Income Journey to Work Market Share From American Community Survey
 Lower Income Journey to Work Market Share From American Community Survey 2006-2010 Table 1: Overall National Data Table 2: Car, Truck or Van Table 3: Transit Table 4: Metrics Table 1 Work Trip Market Share:
January Air Traffic Statistics. Prepared by the Office of Marketing & Consumer Strategy
 January 218 Air Traffic Statistics Prepared by the Office of Marketing & Consumer Strategy This report includes only data submitted by airlines as of the date of publication: March 21, 218. Reports are
2013 District 11 Tournament Calendar Dates REGIONALS/Sectionals Other Events Club Events Special Days
 Feb is Junior Apr is Charity Jun 1-Aug 31 NAP Qualifying Games Sep is Int l Oct is Club App n Month 2013 District 11 Tournament Calendar Dec 30-Jan 6 New Year's Day 1/1 Jan 7-13 Columbus Jan 14-20 CLEVELAND
October Air Traffic Statistics. Prepared by the Office of Corporate Risk and Strategy
 October 214 Air Traffic Statistics Prepared by the Office of Corporate Risk and Strategy Metropolitan Washington Airports Authority Air Traffic Statistics Table of Contents Summary Air Traffic Summary...
Distribution Channel Analysis
 Distribution Channel Analysis NYU Investor s Conference Phantom of the OTA, Distribution Gone Wild Steve Hood Senior VP of Research, STR Components of the Study Economic Analysis Adam Sacks/ Tourism Economics
Monthly Employment Watch: Milwaukee and the Nation's Largest Cities
 Monthly Employment Watch: Milwaukee and the Nation's Largest Cities A monthly report on employment trends in the nation s largest cities Prepared by: The University of Wisconsin-Milwaukee Center for Economic
The Housing Market and the Macroeconomy
 The Housing Market and the Macroeconomy New England Mortgage Bankers Association October 2, 2009 1 The World is in a Deep Recession In the U.S. EMPLOYMENT: Job losses in August, 2009: -216,000 Job losses
Monthly Employment Watch: Milwaukee and the Nation's Largest Cities
 Monthly Employment Watch: Milwaukee and the Nation's Largest Cities A monthly report on employment trends in the nation s largest cities Prepared by: The University of Wisconsin-Milwaukee Center for Economic
Hotel InduSTRy Overview
 Hotel InduSTRy Overview Chris Klauda, CHIA Director, Destination Research cklauda@str.com ESTO Webinar November 12, 2015 1 1. Visit www.hotelnewsnow.com 2. Create Free Login 3. Click on Data Presentations
September Air Traffic Statistics. Prepared by the Office of Marketing & Consumer Strategy
 September 2018 Air Traffic Statistics Prepared by the Office of Marketing & Consumer Strategy This report includes only data submitted by airlines as of the date of publication: November 14, 2017. Reports
May 2011 Passenger and Cargo Traffic Statistics Reno-Tahoe International Airport
 May 2011 Passenger and Cargo Traffic Statistics Reno-Tahoe International Airport July 5, 2011 U.S. DOMESTIC INDUSTRY OVERVIEW FOR MAY 2011 All RNO Carriers Systemwide year over year comparison Average
REGIONALLY FOCUSED. GLOBALLY COMPETITIVE.
 ABOUT EDC WHO WE ARE Mission: San Diego Regional Economic Development Corporation s mission is to maximize the region s economic prosperity and global competitiveness. Vision: The San Diego Region will
Monthly Employment Watch: Milwaukee and the Nation's Largest Cities
 Monthly Employment Watch: Milwaukee and the Nation's Largest Cities A monthly report on employment trends in the nation s largest cities Prepared by: The University of Wisconsin-Milwaukee Center for Economic
Hotel Valuation and Transaction Trends for the U.S. Lodging Industry
 Hotel Valuation and Transaction Trends for the U.S. Lodging Industry June 2010 Presented by Steve Rushmore, MAI, FRICS, CHA srushmore@hvs.com - 1 - Value Trend for a Typical U.S. Hotel 1987 1988 1989 1990
Table of Contents PAGE
 DECEMBER 2018 EL PASO INTERNATIONAL AIRPORT MONTHLY ACTIVITY REPORT December 2018 Table of Contents PAGE AIRPORT ACTIVITY OVERVIEW 1 NONSTOP DESTINATION ANALYSIS 2 MAP OF NONSTOP DESTINATIONS 3 FLIGHT
Table of Contents PAGE
 NOVEMBER 2018 EL PASO INTERNATIONAL AIRPORT MONTHLY ACTIVITY REPORT November 2018 Table of Contents PAGE AIRPORT ACTIVITY OVERVIEW 1 NONSTOP DESTINATION ANALYSIS 2 MAP OF NONSTOP DESTINATIONS 3 FLIGHT
Table of Contents PAGE
 OCTOBER 2018 EL PASO INTERNATIONAL AIRPORT MONTHLY ACTIVITY REPORT October 2018 Table of Contents PAGE AIRPORT ACTIVITY OVERVIEW 1 NONSTOP DESTINATION ANALYSIS 2 MAP OF NONSTOP DESTINATIONS 3 FLIGHT SCHEDULE
Presentation overview
 Presentation overview Retail is a key component of tourist and business destinations and can act as major draw Retail is #1 or #2 leisure activity among travelers One of most important reasons meeting
SEPTEMBER 2014 BOARD INFORMATION PACKAGE
 SEPTEMBER 2014 BOARD INFORMATION PACKAGE MEMORANDUM TO: Members of the Airport Authority FROM: Lew Bleiweis, Executive Director DATE: September 19, 2014 Informational Reports: A. July, 2014 Traffic Report
International Convention Badges
 Images may not be the actual size. (Reduced the image sizes to save white space in the catalog) Images provided by Lion Verle Malik Created 07/24/2015. 1923 1924 1925 7th Annual Convention June 26-29,
U.S. Lodging Industry Update
 U.S. Lodging Industry Update First Watch on a Long Voyage R. MARK WOODWORTH AMERICAS RESEARCH AGENDA THE ECONOMY WHAT COULD END THE CURRENT CYCLE? LABOR COSTS OUR FORECASTS SHARING ECONOMY UPDATE First
Annual Meeting full listing
 Annual Meeting full listing May 7-11, 2017 Baltimore, Md. Annual Meeting May 1-5, 2016 Seattle, Wash Annual Meeting May 3-7, 2015 Denver, Colo. Annual Meeting May 4-8, 2014 Orlando, Fla. Annual Meeting
HelmsBr Meeting I ndustry T rends 2011 September 10, 2010
 HelmsBriscoe Meeting Industry Trends 2011 September 10, 2010 Agenda HelmsBriscoe Overview Market Conditions Key Meeting Industry Trends Q&A HB By the Numbers The largest meetings procurement firm in the
Hotel Association of North Texas. Karrie Keen Director, Destination and Trend Operations
 Hotel Association of North Texas Karrie Keen Director, Destination and Trend Operations To view this presentation, go to HotelNewsNow.com and click on Industry Analysis then Hotel data presentations. Agenda
WILL TOMORROW BE BETTER THAN YESTERDAY?
 CBRE HOTELS The World s Leading Hotel Experts. WILL TOMORROW BE BETTER THAN YESTERDAY? HOTEL SECTOR UPDATE OCTOBER 31, 2017 THE AGENDA 1. U.S. Lodging Market The Macro-Economy and Hotels The Changing Traveler
August Air Traffic Statistics. Prepared by the Office of Corporate Risk and Strategy
 August 215 Air Traffic Statistics Prepared by the Office of Corporate Risk and Strategy Metropolitan Washington Airports Authority Air Traffic Statistics Table of Contents Summary Air Traffic Summary...
Hotel Valuation and Transaction Trends For the U.S. Lodging Industry
 Hotel Valuation and Transaction Trends For the U.S. Lodging Industry Stephen Rushmore, CHA, MAI President and Founder HVS International 372 Willis Avenue Mineola, NY 11501 516-248-8828 ext. 204 srushmore@hvsinternational.com
Table of Contents PAGE
 FEBRUARY 2018 EL PASO INTERNATIONAL AIRPORT MONTHLY ACTIVITY REPORT February 2018 Table of Contents PAGE AIRPORT ACTIVITY OVERVIEW 1 NONSTOP DESTINATION ANALYSIS 2 MAP OF NONSTOP DESTINATIONS 3 FLIGHT
Monthly Employment Watch: Milwaukee and the Nation's Largest Cities
 Monthly Employment Watch: Milwaukee and the Nation's Largest Cities A monthly report on employment trends in the nation s largest cities Prepared by: The University of Wisconsin-Milwaukee Center for Economic
September Air Traffic Statistics. Prepared by the Office of Corporate Risk and Strategy
 September 214 Air Traffic Statistics Prepared by the Office of Corporate Risk and Strategy Air Traffic Summary September 214 Commercial Total Dom Int'l Passengers % Change Passenger Activity (in Millions)
Visit Phoenix Market Update January Eric Kerr Director of Research & Business Analysis
 Visit Phoenix Market Update January 2019 Eric Kerr Director of Research & Business Analysis Visitation totals 2012-2017 & Spending trends Hotel Market Overview YTD - November Chain scales, Submarkets,
High-Speed Rail: Realizing the Potential of Megaregion Economies
 High-Speed Rail: Realizing the Potential of Megaregion Economies Petra Todorovich Director, America 2050 Regional Plan Association May 4, 2010 Rayburn House Office Building 1 2 1 Where High-Speed Rail
October 2018 October 2017 Change
 AIR TRAFFIC REPORT SUMMARY: OCTOBER PASSENGERS October October Change Domestic Passengers 1,969,141 1,861,225 5.8% International Passengers 89,328 74,157 20.5% Total Passengers 2,058,469 1,935,382 6.4%
February Air Traffic Statistics. Prepared by the Office of Corporate Risk and Strategy
 February 215 Air Traffic Statistics Prepared by the Office of Corporate Risk and Strategy Commercial Total Dom Int'l Passengers % Change Air Traffic Summary February 215 Passenger Activity (in Millions)
Parking Property Advisors and Parkopedia present: TOP 40 US CITIES PARKING INDEX
 Parking Property Advisors and Parkopedia present: TOP 40 US CITIES PARKING INDEX 2018 Parking Property Advisors and Parkopedia proudly present this 2018 Top 40 US Cities Parking Index. Whether you are
ustravel.org/travelpromotion
 Agenda 1. Power of Travel Promotion Resources 2. New Tool: Travel Economic Impact Calculator 3. Accessing data through Interactive Travel Analytics 4. Unused Vacation Time Opportunity 5. Highlights from
Billings Area COC. For the Month of April 2017 Date Created: May 17, 2017
 United Kingdom United States Blue Fin Building 735 East Main Street 110 Southwark Street Hendersonville London SE1 0TA TN 37075 Phone: +44 (0)20 7922 1930 Phone: +1 (615) 824 8664 Fax: +44 (0)20 7922 1931
St. Petersburg/Clearwater Area Convention and Visitors Bureau. September 2006 Visitor Profile
 RESEARCH DATA SERVICES, INC. 405 NORTH REO STREET SUITE 100 TAMPA, FLORIDA 33609 TEL (813) 254-2975 FAX (813) 254-2986 St. Petersburg/Clearwater Area Convention and Visitors Bureau September 2006 Visitor
Table of Contents PAGE
 April 2015 EL PASO INTERNATIONAL AIRPORT MONTHLY ACTIVITY REPORT April 2015 Table of Contents PAGE AIRPORT ACTIVITY OVERVIEW 1 NONSTOP DESTINATION ANALYSIS 2 MAP OF NONSTOP DESTINATIONS 3 FLIGHT SCHEDULE
February Air Traffic Statistics. Prepared by the Office of Marketing & Consumer Strategy
 February 218 Air Traffic Statistics Prepared by the Office of Marketing & Consumer Strategy 1 This report includes only data submitted by airlines as of the date of publication: April 18, 218. Reports
Park-Related Total* Expenditure per Resident, by City
 Park-Related Total* per Resident, by City FY 2008 City Population Total Park per Resident Washington, D.C. 591,833 $153,324,830 $259 Seattle 598,541 $150,672,543 $252 Scottsdale 235,371 $50,429,049 $214
Impact of Advance Purchase and Length-of-Stay on Average Ticket Prices in Top Business Destinations
 Impact of Advance Purchase and Length-of-Stay on Average Ticket Prices in Top Business Destinations Research Summary Average ticket prices continue to trend downward in 2016, but since 2014 there have
Passenger and Cargo Statistics Report
 Passenger and Cargo Statistics Report Reno-Tahoe International Airport October 2018 U.S. DOMESTIC INDUSTRY OVERVIEW FOR OCTOBER 2018 Systemwide RNO Carriers Domestic Flights year over year comparison Average
Location, Location, Location. 19 th Annual NIC Conference NIC MAP Data & Analysis Service
 Location, Location, Location 19 th Annual NIC Conference NIC MAP Data & Analysis Service The Great Occupancy Decline 94% Occupancy Trends Majority Nursing Seniors Housing 93% 92% 91% 92.8% 91.0% 90% 89%
PUBLIC TRANSPORTATION INTRODUCTION
 PUBLIC TRANSPORTATION INTRODUCTION 1 OUTLINE Current Status and Recent Trends Significant Influences A Critical Assessment Arguments Supporting Public Transport Future Influences Ingredients for Future
June Air Traffic Statistics. Prepared by the Office of Corporate Risk and Strategy
 June 214 Air Traffic Statistics Prepared by the Office of Corporate Risk and Strategy Air Traffic Statistics Table of Contents Summary Air Traffic Summary... 1 SH&E Air Traffic Schedule Activity... 3 Passenger
 Snakes & Lattes is currently composed of three corporate owned and operated board game cafes in Toronto, ON. Over the last 7 years these have become renowned as Toronto's premiere board game cafe destinations.
Glenn R. Mueller, Ph.D. Professor University of Denver. Franklin L. Burns School of Real Estate & Construction Management &
 Real Estate Cycles Glenn R. Mueller, Ph.D. Professor University of Denver Franklin L. Burns School of Real Estate & Construction Management & Real Estate Investment Strategist Dividend Capital Research
September 2016 Visitor Profile
 RESEARCH DATA SERVICES, INC. 777 SOUTH HARBOUR ISLAND BOULEVARD SUITE 26 TAMPA, FLORIDA 3362 TEL (813) 254-2975 FAX (813) 223-2986 Visit St. Petersburg/Clearwater September 216 Visitor Profile Prepared
ITINERARIES
 ALASKA SAN FRANCISCO DEPARTURES 8-Day Alaska Norwegian Sun May 8, 2016 14-Day Ultimate Alaska Norwegian Sun May 15, 2017 SEATTLE DEPARTURES 7-Day Alaska Glacier Bay Norwegian Pearl May 15 Sep 18, 2016
EXECUTIVE SUMMARY. hospitality compensation as a share of total compensation at. Page 1
 EXECUTIVE SUMMARY Applied Analysis was retained by the Las Vegas Convention and Visitors Authority (the LVCVA ) to review and analyze the economic impacts associated with its various operations and southern
Union Pacific Update September 22, 2016 North East Association of Rail Shippers Conference
 Union Pacific Update September 22, 2016 North East Association of Rail Shippers Conference I Sam Calabro Assistant Vice President Domestic Intermodal Sales 1 Seattle Eastport Portland Twin Cities Duluth
Rank Place State Native Hawaiian and Pacific Islander population (alone or in combination
 TABLE 2a: 100 Largest Places Ranked by Number of s (race alone or in *) Living in Hard-to- Census Rank Place State (alone or in 1 Honolulu (CDP) HI 64,196 11,130 17.3 2 New York City NY 14,981 8,211 54.8
Passenger and Cargo Statistics Report
 Passenger and Cargo Statistics Report RenoTahoe International Airport September 2018 U.S. DOMESTIC INDUSTRY OVERVIEW FOR SEPTEMBER 2018 Systemwide RNO Carriers Domestic Flights year over year comparison
Billings Area COC. For the Month of December 2010 Date Created: Jan 18, 2011
 1 United Kingdom United States Blue Fin Building 735 East Main Street 110 Southwark Street Hendersonville London SE1 0TA TN 37075 Phone: +44 (0)20 7922 1930 Phone: +1 (615) 824 8664 Fax: +44 (0)20 7922
ANNUAL BUSINESS TRAVEL INDEX MARCH 2018
 ANNUAL BUSINESS TRAVEL INDEX MARCH 2018 www.ovationtravel.com www.lawyerstravel.com 800.431.1112 TABLE OF CONTENTS ANNUAL DOMESTIC AIRFARE AVERAGE PRICE PAID...3 ANNUAL INTERNATIONAL AIRFARE AVERAGE PRICE
GoToBermuda.com. Q4 Arrivals and Statistics at December 31 st 2015
 Q4 Arrivals and Statistics at December 31 st 1 Q4 Total Vacation Visitor Arrivals Q4 Arrivals Air - Vacation 23,770 23,125-2.7% -645 141,509 139,820-1.2% -1,689 Cruise 39,118 48,344 23.6% 9,226 355,880
Washington, DC 2013 Visitor Statistics
 Washington, DC 2013 Visitor Statistics Washington, DC 2013 Visitor Statistics TOTAL VISITATION TO WASHINGTON, DC In Millions 20 18 16 14 15.8 15.4 1.0 0.8 14.8 15.1 14.9 1.0 1.0 1.0 15.9 1.1 16.6 1.4 16.3
Enhancing Air Service Through Community Partnerships ACI NA Marketing & Communications Partnering with Carriers
 Enhancing Air Service Through Community Partnerships ACI NA ACI NA Marketing & Communications Partnering with Carriers June 21 21, 2011 Bradley D. Penrod, A.A.E., CEO/Executive Director Allegheny County
December 2012 Passenger and Cargo Traffic Statistics Reno-Tahoe International Airport
 December 2012 Passenger and Cargo Traffic Statistics Reno-Tahoe International Airport January 29, 2013 U.S. DOMESTIC INDUSTRY OVERVIEW FOR DECEMBER 2012 All RNO Carriers Systemwide year over year comparison
Passenger and Cargo Statistics Report
 Passenger and Cargo Statistics Report Reno-Tahoe International Airport December 2014 U.S. DOMESTIC INDUSTRY OVERVIEW FOR DECEMBER 2014 All RNO Carriers Domestic Systemwide year over year comparison Average
air traffic statistics
 October 213 air traffic statistics Prepared by the Office of Finance Department of Internal Controls, Compliance and Financial Strategy Metropolitan Washington Airports Authority Air Traffic Statistics
July air traffic statistics. Prepared by the Office of Corporate Risk and Strategy
 July 214 air traffic statistics Prepared by the Office of Corporate Risk and Strategy Air Traffic Statistics Table of Contents Summary Air Traffic Summary... 1 SH&E Air Traffic Schedule Activity... 3 Passenger
March 2011 Visitor Profile
 RESEARCH DATA SERVICES, INC. 777 SOUTH HARBOUR ISLAND BOULEVARD SUITE 260 TAMPA, FLORIDA 33602 TEL (813) 254-2975 FAX (813) 223-2986 Visit St. Petersburg/Clearwater March 2011 Visitor Profile Prepared
Houston Economic Update. Presented by Patrick Jankowski Vice President, Research Greater Houston Partnership
 Houston Economic Update Presented by Patrick Jankowski Vice President, Research Greater Houston Partnership Houston Astros - Percent Regular Season Games Won Help from the bullpen this year Help from the
Passenger and Cargo Statistics Report
 Passenger and Cargo Statistics Report RenoTahoe International Airport July 2018 U.S. DOMESTIC INDUSTRY OVERVIEW FOR JULY 2018 Systemwide RNO Carriers Domestic Flights year over year comparison Average
Passenger and Cargo Statistics Report
 Passenger and Cargo Statistics Report RenoTahoe International Airport June 2018 U.S. DOMESTIC INDUSTRY OVERVIEW FOR JUNE 2018 Systemwide RNO Carriers Domestic Flights year over year comparison Average
Emerging Trends in Real Estate Sustaining Momentum but Taking Nothing for Granted
 Emerging Trends in Real Estate 2015 Sustaining Momentum but Taking Nothing for Granted PwC-ULI Outlook on trends 36th edition 368 interviews 1,055 survey responses 1,400+ participants, a record Who? District
May 2009 Visitor Profile
 RESEARCH DATA SERVICES, INC. 3825 HENDERSON BOULEVARD SUITE 300 TAMPA, FLORIDA 33629 TEL (813) 254-2975 FAX (813) 254-2986 Visit St. Petersburg/Clearwater May 2009 Visitor Profile Prepared for: Pinellas
Southern Innkeepers 104 th Annual Meeting Lodging Overview. Jan D. Freitag Senior Vice President
 Southern Innkeepers 104 th Annual Meeting Lodging Overview Jan D. Freitag Senior Vice President 1 Agenda Total US Review Scales Segmentation Markets Pipeline Southern Innkeepers Hotels Performance 2012
air traffic statistics
 December 213 air traffic statistics Prepared by the Office of Finance Department of Internal Controls, Compliance and Financial Strategy Commercial Total Dom Int'l Passengers % Change Air Traffic Summary
Passenger and Cargo Statistics Report
 Passenger and Cargo Statistics Report RenoTahoe International Airport April 2018 U.S. DOMESTIC INDUSTRY OVERVIEW FOR APRIL 2018 Systemwide RNO Carriers Domestic Flights year over year comparison Average