Hotel InduSTRy Overview
|
|
|
- Moses Holmes
- 6 years ago
- Views:
Transcription
1 Hotel InduSTRy Overview Chris Klauda, CHIA Director, Destination Research ESTO Webinar November 12,

2 1. Visit 2. Create Free Login 3. Click on Data Presentations 2

3 3
4 About STR The recognized leader in hotel benchmarking Founded in 1985 Sample 72% of total U.S. room supply; 50% of total global room supply. Provide monthly, weekly, and daily STAR reports to over 46,000 hotels, representing 6.1 million rooms worldwide Provide reports to DMOs, CVBs and any organization working in the lodging industry Impartial, timely, confidential 4
5 5 Things to Know.. 1. Industry Record Breaking Continues 2. Group and Transient Pricing Power What do Meeting Planners Think? 3. Highest & Lowest Growth Markets 4. Pipeline Growth 5. Where Are We Headed? 5

6 1 U.S. Pulse Going Gangbusters
7 U.S. Hotels TTM Sept 2015 Metric No. Status Remarks OCC 65.4% 2.5% RECORD ADR $ % RECORD REVPAR $78 7.2% RECORD AVAIL ROOMS 1.8B 1.0% RECORD OCC ROOMS * 1.2B 3.4% RECORD ROOM REV $141B 8.2% RECORD 7 * Demand SOURCE: STR
8 Demand Growth Rates Slow. Supply Growth Now Back At 1% Supply % Change Demand % Change Total U.S., Supply & Demand % Change, 12 MMA 1/ /2015 8
9 ADR Growth Healthy. Occ Growth Easing Occ % Change ADR % Change Total U.S., ADR & OCC % Change, 12 MMA 1/ /2015 9
10 ADR Growth Healthy. Demand Easing Demand % Change ADR % Change Total U.S., ADR & OCC % Change, 12 MMA 1/ /
11 TTM September 2015 $141 billion U.S. hotel room revenue 11

12 52% of U.S. rooms revenue in 2015 came from 8 states 33% from California, Florida and New York U.S. Hotels TTM Sept

13 Where are we in the lodging cycle? The Back 9 13
14 TTM September 2015 $78 U.S. hotel RevPAR 14
15 Expect More Of The Same: Positive (but slowing) Growth % 8.5% 5 7.2% Months 65 Months 61 Months % % % Total U.S., RevPAR % Change, 12 MMA 1/1990 9/

16 2 Group and Transient Pricing Power Group Transient Contract Segmentation 16
17 Chain Scales - examples Luxury Upper Upscale Upscale Upper Midscale Midscale Economy Four Seasons Hilton Courtyard Comfort Suites Best Western Days Inn Loews Hyatt DoubleTree Hampton Inn La Quinta EconoLodge Ritz Carlton Marriott Hilton Garden Inn Holiday Inn Ramada Motel 6 W Hotel Westin Radisson Holiday Inn Express Sleep Inn Super 8
18 Demand Segmentation: Continued Group Rebound Transient % Change Group % Change Luxury Upper Upscale *Segmentation Occupancy % Change, by Class, September 2015 TTM

19 ADR Segmentation: Transient and Group Increases Growth Pace Transient % Change Group % Change Luxury *Segmentation ADR % Change, by Class, September 2015 TTM Upper Upscale
20 Transient ADR Growth Follows High Occupancies 6% 5% 4% 4.4% 3% 2.6% 2% 1% Demand % Change ADR % Change 0% Feb 12 Feb 13 Feb 14 Feb-15 *Transient Demand and ADR % Change, 12 MMA, 1/ /
21 Group Demand Growth Slows As Hotels Are Full 6% 5% 4% Demand % Change ADR % Change 3.8% 3% 2% 1.9% 1% -1% -2% *Group Demand and ADR % Change, 12 MMA, 1/ /
22 September million more transient rooms sold than in the prior 12 months 22

23 September million more group rooms sold than in the prior 12 months 23

24 MEETING SIZE Meetings of attendees make up the largest major meeting segment and are on the rise. OVERALL ATTENDANCE AT LARGEST MEETING PLANNED IN LAST YEAR 30% % 38% 35% 32% 37% Less than *DMAP 2015, a national survey of meeting planners 24

25 What Are Meeting Planners Saying? 25

26 Sources that are personal or directly connected to meeting planner are the most trustworthy and valued. VERY IMPORTANT INFORMATION SOURCES 83% 76% 58% 57% 56% 45% Past experience Attendee feedback Hotel website Colleague recommendations Hotel rating/user review sites Destination website 26
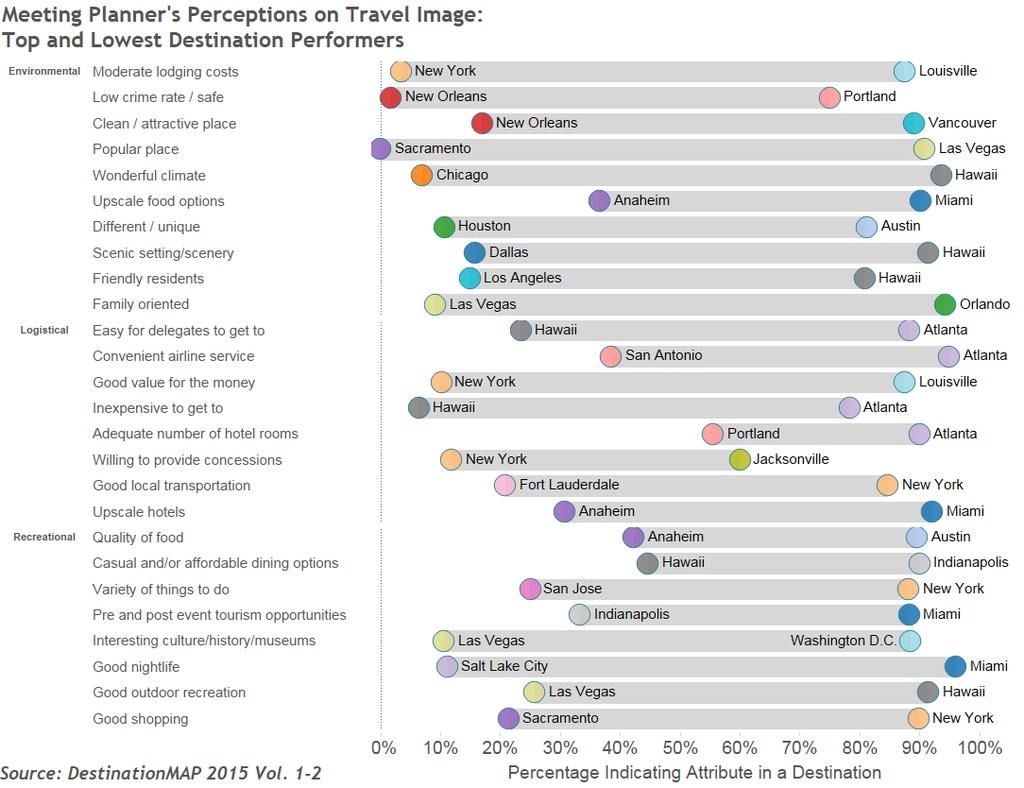
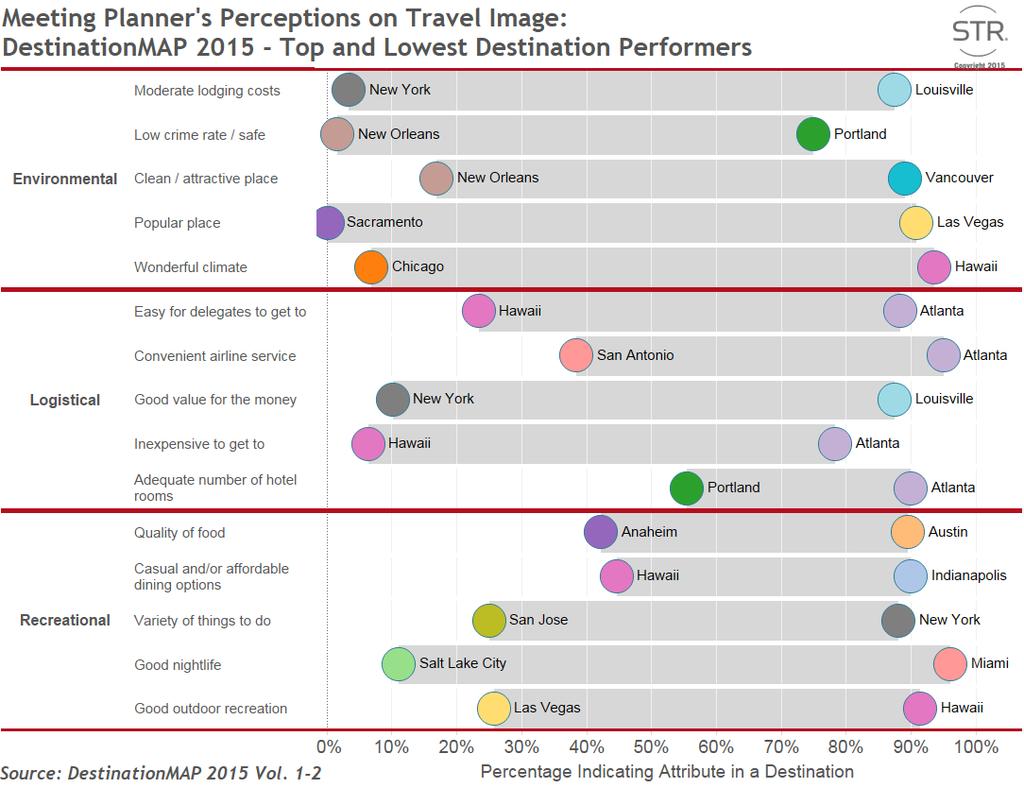
27 Meeting planners are demanding when selecting a meeting site CONSIDERATIONS RATED VERY IMPORTANT IN SITE SELECTION COSTS Good value for the money Travel costs to destination Food and lodging costs CONVENIENCE Easy for delegates to get to Convenient airline service # of hotel rooms available CLEAN/ ATTRACTIVE Attractive conference hotels Clean/attractive city 50% 60% 70% 80% 90% 100% 27

28 Meeting planners are demanding when selecting a meeting site CONSIDERATIONS RATED VERY IMPORTANT IN SITE SELECTION COSTS Good value for the money Travel costs to destination Food and lodging costs CONVENIENCE CLEAN/ ATTRACTIVE Easy for delegates to get to Convenient airline service # of hotel rooms available Attractive conference hotels Clean/attractive city % 60% 70% 80% 90% 100% 28
29 29
30 30
31 3 U.S. Market Performance 162 markets
32 RevPAR September 2015 YTD: Low Oil Price = Lower RevPAR Market RevPAR % Change Market RevPAR % Change Macon/Warner Robbins, GA 19.0 New York, NY (1.6) San Jose/Santa Cruz, CA 18.9 West Virginia (1.8) Oakland, CA 16.6 Texas North (1.9) Portland, OR 15.1 New Mexico South (2.1) Phoenix, AZ 14.9 Houston, TX (2.4) Chattanooga, TN-GA 14.7 Augusta, GA-SC (7.1) Fort Myers, FL 14.5 Texas South (7.3) Greenville/Spartanburg, SC 14.3 Oklahoma Area (9.4) Melbourne/Titusville, FL 14.1 Texas West (14.9) California North Central 13.7 North Dakota (16.2) *September 2015 YTD RevPAR: Best / Worst Performing Markets 32
33 ADR September 2015 YTD: West Coast Very Strong, NYC Still Weak Market ADR % Change Market ADR % Change San Jose/Santa Cruz, CA 15.2 Jackson, MS 1.0 Oakland, CA 12.2 Texas North 1.0 Portland, OR 10.9 New Mexico South 0.8 Sarasota/Bradenton, FL 10.1 Bergen/Passaic, NJ 0.1 Phoenix, AZ 9.6 McAllen/Brownsville, TX Nashville, TN 9.2 Oklahoma Area Melbourne/Titusville, FL 9.0 New York, NY Seattle, WA 9.0 North Dakota Savannah, GA 8.7 Texas South Wyoming 8.5 Texas West * September 2015 YTD ADR : Best / Worst Performing Markets (0.1) (0.9) (1.4) (3.1) (4.3) (5.8) 33

34 3 U.S. Market Performance 50 markets
35 September 2015 YTD: Houston and NYC Perform Poorly Market OCC % ADR % Change Phoenix, AZ Tampa/St Petersburg, FL Nashville, TN Seattle, WA Orlando, FL New Orleans, LA Minneapolis/St Paul, MN-WI Oahu Island, HI New York, NY Houston, TX * September 2015 YTD ADR % Change in Top 25: 5 Best / 5 Worst Performing ADR % Markets 35
36 Markets 26-50: Markets Around SF Lead Market OCC % ADR % Change San Jose/Santa Cruz, CA Oakland, CA Portland, OR Richmond/Petersburg, VA Austin, TX Fort Worth/Arlington, TX San Antonio, TX Pittsburgh, PA Oklahoma City, OK Baltimore, MD *September 2015 YTD ADR % Change, Markets 26-50: 5 Best / 5 Worst Performing ADR % Markets 36
37 Making the Grade: Top 25 Markets Brad Garner SVP August, 2015
38 Methodology of Grades Data from June 2009, 2011, 2013, and MMA Calculated the relative position (rank) of supply, demand, ADR Applied weighted factors to each of the metrics (in each year) Averaged all the metrics to come up with the index Averaged the index for all four years Gave 1-3 points based on average index Gave 1-3 points based on RevPAR forecast for 2015 & 2016 Totaled points to come up with grades

39 Top 25 markets A Grade Dallas Denver Los Angeles Nashville Orlando San Francisco Seattle Tampa

40 Most Likely to be Famous: Nashville Highest ADR and RevPAR growth at 10.5% and 14.9% Highest group RevPAR growth at 14.3% Its Own TV Show (Get on Board) *forecast is preliminary *all metrics reported are as of June 15 12MMA


41 Most Athletic: Phoenix Super Bowl XLIX & Phx. Open 2/2015 January RevPAR up 43% February RevPAR up 18% 2 nd largest RevPAR growth as of June 12MMA Highest forecast RevPAR growth for 2015 at 12.8% *forecast is preliminary

42 Most Likely to enter Rehab: Houston Occ down 3.8% YTD RevPAR down 1.7% YTD 2 nd lowest RevPAR forecast for 2015 at 2.5% *forecast is preliminary
43 4 Pipeline Accelerates
44 Under Contract STR Pipeline Phases 4. In Construction Vertical construction on the physical building has begun. (This does not include construction on any sub-grade structures.) 3. Final Planning construction will begin within the next 12 months. 2. Planning construction will begin in more than 13 months. 1. Unconfirmed (formerly Pre-Planning) - Potential projects that remain unconfirmed at this time. 44
45 US Pipeline: Construction Today Will Impact 2016 / 2017 Phase % Change In Construction % Final Planning % Planning % Under Contract % *Total US Pipeline, by Phase, 000s Rooms, September 2015 and

46 Limited Service Construction Has Been Strong For 2 Years % Luxury Upper Upscale Upscale Upper Midscale Midscale Economy Unaffiliated *US Pipeline, Rooms In Construction, 000s Rooms, by Scale, September
, Top 26 Markets vs.")
47 Pipeline ( 000s rooms): Top 26 Markets Have ~50% Of U/C Rooms In Construction(132) Final Planning (175) Planning (134) Top 26 Markets Rest of the US *US Pipeline, Rooms ( 000s), Top 26 Markets vs. All Other Markets, September
48 Construction In Top 26 Markets: 11 Markets w/4%+ Of Supply Market Rooms U/C % Of Existing 1 New York, NY 13,107 11% 2 Houston, TX 6,639 9% 3 Miami/Hialeah, FL 3,314 7% 4 Denver, CO 2,404 6% 5 Nashville, TN 1,703 4% 6 Dallas, TX 3,427 4% 7 Anaheim/Santa Ana, CA 2,291 4% 8 Los Angeles/Long Beach, CA 4,052 4% 9 Boston, MA 2,144 4% 10 Philadelphia, PA-NJ 1,846 4% 11 Minneapolis/St Paul, MN-WI 1,548 4% *US Pipeline, Top 26 Markets, U/C Rooms as % of Existing Supply, September
49 Construction In Top 26 Markets: Eight With 2%+ Of Supply Market Rooms U/C % Of Existing 12 Washington, DC-MD-VA 3,588 3% 13 Seattle, WA 1,334 3% 14 San Diego, CA 1,785 3% 15 Detroit, MI 1,126 3% 16 Phoenix, AZ 1,577 3% 17 Chicago, IL 2,753 2% 18 Las Vegas, NV 3,905 2% 19 Tampa/St Petersburg, FL 1,012 2% 20 New Orleans, LA 792 2% 21 Atlanta, GA 1,398 1% 22 Orlando, FL 1,645 1% 23 Norfolk/Virginia Beach, VA 394 1% 24 St Louis, MO-IL 332 1% 25 San Francisco/San Mateo, CA 430 1% 26 Oahu Island, HI 0% *US Pipeline, Top 26 Markets, U/C Rooms as % of Existing Supply, September


50 5 Where Are We Headed? 50
51 Total United States Key Performance Indicator Outlook (% Change vs. Prior Year) Outlook 2015 Forecast 2016 Forecast Supply 1.2% 1.4% Demand 2.9% 2.2% Occupancy 1.7% 0.8% ADR 5.1% 5.2% RevPAR 6.8% 6.0% *As of 8/1/15 51
52 Total United States Chain Scale Key Performance Indicator Outlook 2015F by Chain Scale 2015 Year End Outlook Chain Scale Occupancy (% chg) ADR (% chg) RevPAR (% chg) Luxury 0.4% 5.4% 5.9% Upper Upscale 0.9% 5.0% 5.9% Upscale 0.6% 5.4% 6.1% Upper Midscale 1.9% 5.0% 7.0% Midscale 2.0% 4.5% 6.5% Economy 1.9% 5.3% 7.2% Independent 2.0% 4.8% 6.9% Total United States 1.7% 5.1% 6.8% *As of 8/1/15 52

53 Total United States Chain Scale Key Performance Indicator Outlook 2016F by Chain Scale 2016 Year End Outlook Chain Scale Occupancy (% chg) ADR (% chg) RevPAR (% chg) Luxury 0.5% 5.3% 5.8% Upper Upscale 0.7% 5.6% 6.4% Upscale 0.7% 5.2% 5.9% Upper Midscale 0.8% 4.6% 5.4% Midscale 0.9% 4.1% 5.0% Economy 1.0% 4.4% 5.4% Independent 0.4% 5.1% 5.5% Total United States 0.8% 5.2% 6.0% *As of 8/1/15 53
54 2015 Year End RevPAR Forecast (Total U.S. 6.8%) Top 25 US Markets, August 2015 Forecast (Markets sorted alphabetically) -5% to 0% 0% to 5% 5% to 10% 10% to 15% New York Houston Anaheim Phoenix Oahu Atlanta Tampa Philadelphia Boston Chicago Dallas Denver Detroit Los Angeles Miami Minneapolis Nashville New Orleans Norfolk Orlando San Diego San Francisco Seattle St. Louis Washington, DC 54
55 2016 Year End RevPAR Forecast (Total U.S. 6.0%) Top 25 US Markets, August 2015 Forecast (Markets sorted alphabetically) -5% to 0% 0% to 5% 5% to 10% 10% to 15% Atlanta Boston Chicago Los Angeles Miami New Orleans New York Norfolk Anaheim Dallas Denver Detroit Houston Minneapolis Nashville Oahu Orlando Philadelphia Phoenix San Diego San Francisco Seattle St. Louis Tampa Washington, DC 55

56 In sum.. (mostly) 56
57 5 Things to Know.. 1. Industry Record Breaking Continues And Continues 2. Group and Transient Pricing Power Is All Good What do Meeting Planners Think? Tough Bunch 3. Highest & Lowest Growth Markets Some Challenged 4. Pipeline Growth Scattered 5. Where Are We Headed? Up 57
58 Other Items of Interest 58

 Hotel Industry Performance Reports One or two-day CHIA workshops")
59 Certification in Hotel Industry Analytics (CHIA) STR and AHLEI have partnered to launch the Certification in Hotel Industry Analytics for a variety of industry professionals. There are four core content areas: o o o o Hotel Industry Foundations Hotel Math Fundamentals the metrics used by the hotel industry Property Level Benchmarking (STAR Reports) Hotel Industry Performance Reports One or two-day CHIA workshops are available To find out more please contact us at sharecenter@str.com 59


60 Airbnb 60
61 Questions: Slides: Thank you! 61
62 2015 DESTINATIONMAP MARKETS Anaheim Atlanta Austin Baltimore Boston Charlotte Chicago Dallas Denver Fort Lauderdale Houston Indianapolis Jacksonville Las Vegas Los Angeles Louisville Miami Minneapolis Montreal Nashville New Orleans New York Oahu Orlando Philadelphia Phoenix Portland Sacramento Salt Lake City San Antonio San Diego San Francisco San Jose Scottsdale Seattle St. Louis Tampa Toronto Vancouver Washington, D.C. 62
Hotel Industry Performance Overview Washington Lodging Convention
 Hotel Industry Performance Overview Washington Lodging Convention Valerie Woods Director of Business Development, Hotels vwoods@str.com Valerie_STR 2016 STR, Inc. All Rights Reserved. Any reprint, use
Hotel InduSTRy Overview What Lies Ahead
 University of Massachusetts Amherst ScholarWorks@UMass Amherst Tourism Travel and Research Association: Advancing Tourism Research Globally 2013 Marketing Outlook Forum - Outlook for 2014 Hotel InduSTRy
U.S. Hotel Industry Performance HBI Annual Conference
 U.S. Hotel Industry Performance HBI Annual Conference February 17, 2017 Jeff Higley VP/Editorial Director jeff@str.com @jeffhigley1 2016 STR, Inc. All Rights Reserved. Any reprint, use or republication
Hotel InduSTRy Overview
 Hotel InduSTRy Overview Lindsay Culbreath, CMHS, CHIA Senior Director of Business Development & Marketing STR Tennessee Business Travel Association October 14, 2014 STR provides monthly, weekly and daily
U.S. Hotel Industry Performance What Lies Ahead
 U.S. Hotel Industry Performance What Lies Ahead Vail R. Brown, CHMS Vice President, Global Business Development & Marketing vail_str May 5, 2015 vbrown@str.com 1. Visit www.hotelnewsnow.com 2. Create Free
U.S. and Fort Lauderdale Hotel Industry Performance Fort Lauderdale August 8, 2017
 U.S. and Fort Lauderdale Hotel Industry Performance Fort Lauderdale August 8, 2017 Chris Klauda Director, Destination Research cklauda@str.com 2017 STR, Inc. All Rights Reserved. Any reprint, use or republication
Lower Income Journey to Work Market Share From American Community Survey
 Lower Income Journey to Work Market Share From American Community Survey 2006-2010 Table 1: Overall National Data Table 2: Car, Truck or Van Table 3: Transit Table 4: Metrics Table 1 Work Trip Market Share:
U.S. Hotel Industry Performance. Brad Garner Chief Operating Officer
 U.S. Hotel Industry Performance Brad Garner Chief Operating Officer 1 Agenda Total US Review Scale Review Segmentation Markets Supply Pipeline 2013 / 2014 Forecast 2 www.hotelnewsnow.com Click on Hotel
MPI Nashville Chapter
 MPI Nashville Chapter Monthly Meeting Embassy Suites Cool Springs September 20, 2017 Veronica Andrews Director, Digital Data Solutions vandrews@str.com @STR_Data 2017 STR, Inc. All Rights Reserved. Any
Lodging Industry Overview. 14 December Bobby Bowers Smith Travel Research / STR Global
 Lodging Industry Overview 14 December 2011 Bobby Bowers Smith Travel Research / STR Global Global / U.S. Overview Key U.S. Markets Construction Pipeline Forecast Takeaways Today s Agenda RevPar Growth
2017 Kansas Tourism Conference Hotel Industry Overview October 25, 2017
 2017 Kansas Tourism Conference Hotel Industry Overview October 25, 2017 Chris Klauda, Research Director cklauda@str.com 2017 STR, Inc. All Rights Reserved. Any reprint, use or republication of all or a
Hotel Industry Performance Overview
 Hotel Industry Performance Overview GWTTRA Conference Valerie Woods Associate Director of Business Development, Hotels vwoods@str.com Valerie_STR 2017 STR, Inc. All Rights Reserved. Any reprint, use or
Southern Innkeepers 104 th Annual Meeting Lodging Overview. Jan D. Freitag Senior Vice President
 Southern Innkeepers 104 th Annual Meeting Lodging Overview Jan D. Freitag Senior Vice President 1 Agenda Total US Review Scales Segmentation Markets Pipeline Southern Innkeepers Hotels Performance 2012
U.S. Lodging Industry Update
 U.S. Lodging Industry Update First Watch on a Long Voyage R. MARK WOODWORTH AMERICAS RESEARCH AGENDA THE ECONOMY WHAT COULD END THE CURRENT CYCLE? LABOR COSTS OUR FORECASTS SHARING ECONOMY UPDATE First
The Very Good Will Continue
 The Very Good Will Continue HOTEL SECTOR UPDATE - SEPTEMBER 2015 PKF Consulting USA, A CBRE Company Presented By: Andrea Foster, Managing Director, PKF Consulting USA, a CBRE Company September 17, 2015
Have Higher Transportation Costs and a Slowing U.S. Economy Shifted Lodging Demand Within Lodging Sectors?
 Have Higher Transportation Costs and a Slowing U.S. Economy Shifted Lodging Demand Within Lodging Sectors? Trends and implications for sales and marketing strategies: Hotel Sales Strategy Conference Washington,
Rank Place State Native Hawaiian and Pacific Islander population (alone or in combination
 TABLE 2a: 100 Largest Places Ranked by Number of s (race alone or in *) Living in Hard-to- Census Rank Place State (alone or in 1 Honolulu (CDP) HI 64,196 11,130 17.3 2 New York City NY 14,981 8,211 54.8
Location, Location, Location. 19 th Annual NIC Conference NIC MAP Data & Analysis Service
 Location, Location, Location 19 th Annual NIC Conference NIC MAP Data & Analysis Service The Great Occupancy Decline 94% Occupancy Trends Majority Nursing Seniors Housing 93% 92% 91% 92.8% 91.0% 90% 89%
Investment Overview of the U.S. Lodging Industry
 Investment Overview of the U.S. Lodging Industry Presented to: NYSSCPA/FAE Restaurant and Hospitality Breakfast Conference November 7, 2007 Daniel H. Lesser Senior Managing Director Industry Leader Hospitality
San Francisco Travel Association Selling in a Seller s Market DMO Perspective. May 21, 2014
 San Francisco Travel Association Selling in a Seller s Market DMO Perspective May 21, 2014 Agenda Discussion Themes 1. Meetings Are Important 2. Market Meetings Pace 3. Occupancy & Rate 4. Booking Windows
Access Across America: Transit 2014
 Access Across America: Transit 2014 Final Report CTS 14-11 Prepared by: Andrew Owen David Levinson Accessibility Observatory Department of Civil, Environmental, and Geo- Engineering University of Minnesota
HOTEL INDUSTRY OVERVIEW. Texas
 HOTEL INDUSTRY OVERVIEW Texas DEMAND GROWTH STRONG BALANCED OCC & ADR GROWTH % Change Room Supply* 149M 1.3% Room Demand* 92M 5.6% Occupancy 61.6% 4.3% A.D.R. $90 4.4% RevPAR $55 8.9% Room Revenue* $8.3B
For Example. Stabilized Hotels 1Q 2015: 1Q 2016: Today: Leverage: 60-65% Rate: ±5.5% Fixed. Leverage: 60-65% Rate: ±5.0%-5.
 Lodging Transaction Market Key 2016 Themes Transaction activity started slowly in 2016 primarily due to choppiness in the broader capital markets space. CMBS market dislocation has resulted in lower leverage,
Census Affects Children in Poverty by Professors Donald Hernandez and Nancy Denton State University of New York, Albany
 Phone: (301) 457-9900 4700 Silver Hill Road, Suite 1250-3, Suitland, MD 20746 Fax: (301) 457-9901 Census Affects in Poverty by Professors Donald Hernandez and Nancy Denton State University of New York,
Norwegian's Free Airfare Promotion
 Norwegian's Free Airfare Promotion Start planning your next vacation with 200+ cruises to incredible destinations, including Alaska, Bahamas & Florida, Bermuda, Canada & New England, Caribbean, Mexican
Population Estimates for U.S. Cities Report 1: Fastest Growing Cities Based on Numeric Increase,
 ulation s for U.S. Cities Report 1: Fastest Growing Cities Based on Numeric Increase, 2015-2015 1 Phoenix AZ 32,113 2.0 1,582,904 1,615,017 167,393 11.6 2 Los Angeles CA 27,173 0.7 3,949,149 3,976,322
Major Metropolitan Area Sales Tax Rates
 August 19, 2010 No. 239 FISCAL FACT Major Metropolitan Area Sales Tax Rates By Lawrence Summers Introduction General sales taxes levied by state, county and city governments in the United States vary greatly,
World Class Airport For A World Class City
 World Class Airport For A World Class City Air Service Update December 2018 2018 Air Service Updates February 2018 Delta Air Lines Seattle new departure, seasonal, 2x weekly Delta Air Lines Boston new
Fort Lauderdale August 8, 2017
 Fort Lauderdale August 8, 2017 8/10/2017 TAP Software Analytics Division Brian Finucane TAP Reports Jeff Eastman TAP Hotel Reports Jeanne Eastman TAP Data Source Jeff Eastman Cloud Database Numerous Data
Hector International Airport Fargo, North Dakota
 Hector International Airport Fargo, North Dakota Volume 073 Twelve Months Ended September 2007 January 2008 Airlines Serving Fargo Carried 831 Onboard Passengers Per Day for the Twelve Months Ended September
Hector International Airport Fargo, North Dakota
 Hector International Airport Fargo, North Dakota Volume 072 Twelve Months Ended June 2007 November 2007 Airlines Serving Fargo Carried 830 Onboard Passengers Per Day for the Twelve Months Ended June 2007,
Higher Education in America s Metropolitan Areas A Statistical Profile
 Higher Education in America s Metropolitan Areas A Statistical Profile MSA Study No.2 Higher Education in America s Metropolitan Areas A Statistical Profile CONTENTS Why Metro Areas? 1 Executive Summary
 Snakes & Lattes is currently composed of three corporate owned and operated board game cafes in Toronto, ON. Over the last 7 years these have become renowned as Toronto's premiere board game cafe destinations.
District Match Data Availability
 District Match Data Availability National & State Data Location Available National Data Australia Parliament, Provincial and Territory Assemblies Canada Parliament, Provincial Legislative Assemblies New
1Q 2014 Greater Atlanta HBA Builder Developer Lender Council meeting Information presented by. Atlanta Job Growth
 1Q 2014 Greater Atlanta HBA Builder Developer Lender Council meeting 5-21-2014 Information presented by Eugene James, Regional Director ejames@metrostudy.com 404-510-1080 connect on LinkedIn Atlanta Job
Hotel Valuation and Transaction Trends For the U.S. Lodging Industry
 Hotel Valuation and Transaction Trends For the U.S. Lodging Industry Stephen Rushmore, CHA, MAI President and Founder HVS International 372 Willis Avenue Mineola, NY 11501 516-248-8828 ext. 204 srushmore@hvsinternational.com
2016 Air Service Updates
 Air Service Update May 2016 2016 Air Service Updates February 2016 Pittsburgh new destination, 2x weekly April 2016 Los Angeles new departure, 1x daily Atlanta new departure, 1x daily Jacksonville new
PUBLIC TRANSPORTATION INTRODUCTION
 PUBLIC TRANSPORTATION INTRODUCTION 1 OUTLINE Current Status and Recent Trends Significant Influences A Critical Assessment Arguments Supporting Public Transport Future Influences Ingredients for Future
FBI Drug Demand Reduction Coordinators
 FBI Drug Demand Reduction Coordinators Alabama 2121 Building, Room 1400 Birmingham, AL 35203 (205) 252 7705 One St. Louis Centre One St. Louis Street Mobile, AL 36602 (334) 438 3674 Alaska 222 West Seventh
BLACK KNIGHT HPI REPORT
 CONTENTS 1 OVERVIEW 2 NATIONAL OVERVIEW 3 LARGEST STATES AND METROS 4 FEBRUARY S BIGGEST MOVERS 5 20 LARGEST STATES 6 40 LARGEST METROS 7 ADDITIONAL INFORMATION OVERVIEW Each month, the Data & Analytics
Passengers Boarded At The Top 50 U. S. Airports ( Updated April 2
 (Ranked By Passenger Enplanements in 2006) Airport Table 1-41: Passengers Boarded at the Top 50 U.S. Airportsa Atlanta, GA (Hartsfield-Jackson Atlanta International) Chicago, IL (Chicago O'Hare International)
Hector International Airport Fargo, North Dakota
 Hector International Airport Fargo, North Dakota Volume 081 Twelve Months Ended March 2008 July 2008 Airlines Serving Fargo Carried 838 Onboard Passengers Per Day for the Twelve Months Ended March 2008,
World Class Airport For A World Class City
 World Class Airport For A World Class City Air Service Update October 2017 2017 Air Service Updates February 2017 Cleveland new destination, 2x weekly Raleigh-Durham new destination, 2x weekly March 2017
Monthly Employment Watch: Milwaukee and the Nation's Largest Cities
 Monthly Employment Watch: Milwaukee and the Nation's Largest Cities A monthly report on employment trends in the nation s largest cities Prepared by: The University of Wisconsin-Milwaukee Center for Economic
University of Denver
 Glenn R. Mueller, Ph.D. Professor University of Denver Franklin L. Burns School of Real Estate & Construction Management & Real Estate Investment Strategist glenn.mueller@du.edu Supply The new supply of
2016 Air Service Updates
 Air Service Update September 2016 2016 Air Service Updates February 2016 Pittsburgh new destination, 2x weekly April 2016 Los Angeles new departure, 1x daily Atlanta new departure, 1x daily Jacksonville
Monthly Employment Watch: Milwaukee and the Nation's Largest Cities
 Monthly Employment Watch: Milwaukee and the Nation's Largest Cities A monthly report on employment trends in the nation s largest cities Prepared by: The University of Wisconsin-Milwaukee Center for Economic
WILL TOMORROW BE BETTER THAN YESTERDAY?
 CBRE HOTELS The World s Leading Hotel Experts. WILL TOMORROW BE BETTER THAN YESTERDAY? HOTEL SECTOR UPDATE OCTOBER 31, 2017 THE AGENDA 1. U.S. Lodging Market The Macro-Economy and Hotels The Changing Traveler
ustravel.org/travelpromotion
 Agenda 1. Power of Travel Promotion Resources 2. New Tool: Travel Economic Impact Calculator 3. Accessing data through Interactive Travel Analytics 4. Unused Vacation Time Opportunity 5. Highlights from
MARKETBEAT U.S. Office
 MARKETBEAT U.S. Office Q3 2017 U.S. OFFICE Employment Indicators Net Absorption/Rent 4-QTR TRAILING AVERAGE Q3 16 Q3 17 Total Nonfarm Employment 144.7M 146.6M Office-using Employment 31.3M 31.9M Unemployment
Metropolitan Votes and the 2012 U.S. Election: Population, GDP, Patents and Creative Class
 politan Votes and the 2012 U.S. Election: Population, GDP, Patents and Creative Class Author: Shawn Gilligan, Shawn.Gilligan@rotman.utoronto.ca Zara Matheson, Zara.Matheson@rotman.utoronto.ca Kevin Stolarick,
World Class Airport For A World Class City
 World Class Airport For A World Class City Air Service Update April 2018 2018 Air Service Updates February 2018 Seattle new departure, seasonal, 2x weekly Boston new departure, seasonal, 2x weekly March
A CORPORATE OR MEDICAL USER OPPORTUNITY WELL-LOCATED OFF THE PA TURNPIKE AM Drive. Quakertown, PA INVESTMENT SUMMARY. Page 1
 A CORPORATE OR MEDICAL USER OPPORTUNITY WELL-LOCATED OFF THE PA TURNPIKE 1900 AM Drive Quakertown, PA INVESTMENT SUMMARY Page 1 EXECUTIVE SUMMARY On behalf of ownership, Avison Young is pleased to offer
Parking Rates & Policies Survey. December 2013
 METER OVERVIEW RATE & POLICY PRESENTATION SURVEY / 1 Parking Rates & Policies Survey December 2013 METER OVERVIEW RATE & POLICY PRESENTATION SURVEY / 2 Parking rates and policies survey The purpose of
2016 Air Service Updates
 Air Service Update June 2016 2016 Air Service Updates February 2016 Pittsburgh new destination, 2x weekly April 2016 Los Angeles new departure, 1x daily Atlanta new departure, 1x daily Jacksonville new
Hotel Valuation and Transaction Trends for the U.S. Lodging Industry
 Hotel Valuation and Transaction Trends for the U.S. Lodging Industry June 2010 Presented by Steve Rushmore, MAI, FRICS, CHA srushmore@hvs.com - 1 - Value Trend for a Typical U.S. Hotel 1987 1988 1989 1990
333 W. Campbell Road, Suite 440 Richardson, Texas Cruising for Charity with Randy Limbacher in Tahiti July 28, 2007
 333 W. Campbell Road, Suite 440 Richardson, Texas 75080 972.238.1998 800.952.1998 Cruising for Charity with Randy Limbacher in Tahiti July 28, 2007 Join me for this special annual event to raise money
MARKETBEAT U.S. Office
 MARKETBEAT U.S. Office Q2 2017 U.S. OFFICE Employment Indicators Q2 16 Q2 17 Total Nonfarm Employment 143.9M 146.2M Office-using Employment 30.1M 31.8M Unemployment 4.9% 4.4% Source: BLS Market Indicators
MARKETBEAT U.S. Office
 MARKETBEAT U.S. Office Q1 2017 U.S. OFFICE Employment Indicators Q1 16 Q1 17 Total Nonfarm Employment 143.4M 145.7M Offi ce-using Employment 30.9M 31.7M Unemployment 4.9% 4.6% Source: BLS Market Indicators
2016 Air Service Updates
 2016 Air Service Updates February 2016 Pittsburgh new destination, 2x weekly April 2016 Los Angeles new departure, 1x daily Atlanta new departure, 1x daily Jacksonville new destination, 2x weekly Philadelphia
World Class Airport For A World Class City
 World Class Airport For A World Class City Air Service Update April 2017 2017 Air Service Updates February 2017 Cleveland new destination, 2x weekly Raleigh-Durham new destination, 2x weekly March 2017
International Convention Badges
 Images may not be the actual size. (Reduced the image sizes to save white space in the catalog) Images provided by Lion Verle Malik Created 07/24/2015. 1923 1924 1925 7th Annual Convention June 26-29,
MARKETBEAT U.S. Office
 MARKETBEAT U.S. Office Q4 2018 U.S. OFFICE Employment Indicators Market Indicators (Overall) Office: Net Absorption/Asking Rent 4Q TRAILING AVERAGE Office: Overall Vacancy Q4 17 Q4 18 Total Nonfarm Employment
Mango Market Development Index
 Mango Market Development Index 2016-2017 Understanding the Market Index The Mango Market Development Index is designed to measure and compare mango volume sold at retail relative to population by region
MANGO MARKET DEVELOPMENT INDEX REPORT
 MANGO MARKET DEVELOPMENT INDEX REPORT 2015-2016 UNDERSTANDING THE MARKET INDEX The Mango Market Development Index is designed to measure and compare mango sales volume relative to population by region
Impact of Hurricane Irma on US Metropolitan Areas
 Impact of Hurricane Irma on US Metropolitan Areas Puerto Ricans in mainland Prepared for: Jorge Restrepo, CEO 2017 EurekaFacts LLC September 29, 2017 Climate refugees from Puerto Rico in US metropolitan
Distribution Channel Analysis
 Distribution Channel Analysis NYU Investor s Conference Phantom of the OTA, Distribution Gone Wild Steve Hood Senior VP of Research, STR Components of the Study Economic Analysis Adam Sacks/ Tourism Economics
Hotel Valuation and Transaction Trends For the U.S. Lodging Industry
 Hotel Valuation and Transaction Trends For the U.S. Lodging Industry Steve Rushmore, MAI, FRICS, CHA President and Founder HVS 372 Willis Avenue Mineola, NY 11501 516-248-8828 ext. 204 srushmore@hvs.com
MARKETBEAT U.S. Office
 MARKETBEAT U.S. Office Q3 2018 U.S. OFFICE Employment Indicators Market Indicators (Overall) Office: Net Absorption/Asking Rent 4Q TRAILING AVERAGE Office: Overall Vacancy Q3 17 Q3 18 Total Nonfarm Employment
OB-GYN Workload & Potential Shortages: The Coming U.S. Women s Health Crisis
 OB-GYN Workload & Potential Shortages: The Coming U.S. Women s Health Crisis JULY 2017 Introduction Obstetricians and Gynecologists (OB-GYNs) are a critical part of the health care provider community.
The FMR history file contains the following fields, all for 2-bedroom FMRs. It is in EXCEL format for easy use with database or spreadsheet programs.
 The FMR history file contains the following fields, all for 2-bedroom FMRs. It is in EXCEL format for easy use with database or spreadsheet programs. GENERAL NOTES 1. There are no Fiscal Year 1984 FMRs
U.S. Metropolitan Area Exports, 2015
 U.S. Metropolitan Area Exports, 2015 Jeffrey Hall Office of Trade and Economic Analysis Industry and Analysis Department of Commerce International Trade Administration September 2016 U.S. Metro Exports:
TravelClick: Business Intelligence Lodging Outlook. Sara Duggan. Regional Vice President, Business Intelligence TravelClick 03/23/18
 TravelClick: Business Intelligence 2018 Lodging Outlook Sara Duggan Regional Vice President, Business Intelligence TravelClick 03/23/18 25,000+ Partners 25 283 Million $49 Billion 365 North America Markets
ATLANTA HOUSING MARKET Fourth Quarter 2017 Presentation for HBA Builder Developer Lender Council. Expanded. Unemployment Rate (U 6) Official
 Official") Eugene James Senior Regional Director 404-510-1080 ejames@metrostudy.com connect on LinkedIn Mike Overley Business Development Director 770-380-0827 moverley@metrostudy.com To volunteer call 404 408 0716
Eugene James Senior Regional Director 404-510-1080 ejames@metrostudy.com connect on LinkedIn Mike Overley Business Development Director 770-380-0827 moverley@metrostudy.com To volunteer call 404 408 0716
MARKETBEAT U.S. Office
 MARKETBEAT U.S. Office Q4 2017 U.S. OFFICE Employment Indicators Q4 16 Q4 17 Total Nonfarm Employment 145.2M 147.2M Office-using Employment 31.5M 32.1M Unemployment 4.7% 4.1% Source: BLS Market Indicators
2019 Preferred Rate Hotel Program Rates
 Atlanta, GA The Ritz-Carlton, Atlanta 800-241-3333 $292 $303 $379 $390 The Whitley, A Luxury Collection,Atlanta Buckhead 404-348-5650 $299 $321 $410 $384 The St. Regis Atlanta 404-215-4666 $318 $348 $518
MARKETBEAT U.S. Industrial Snapshot Q4 2015
 MARKETBEAT U.S. Industrial Snapshot Q4 2015 U.S. INDUSTRIAL Employment Indicators Q4 14 Q4 15 Total Nonfarm Employment 140.2M 143.0M Industrial Employment 23.4M 23.6M Unemployment 5.7% 5.0% Market Indicators
Monthly Employment Watch: Milwaukee and the Nation's Largest Cities
 Monthly Employment Watch: Milwaukee and the Nation's Largest Cities A monthly report on employment trends in the nation s largest cities Prepared by: The University of Wisconsin-Milwaukee Center for Economic
MARKETBEAT U.S. Industrial
 MARKETBEAT U.S. Industrial Q3 2018 U.S. INDUSTRIAL Employment Indicators Q3 17 Q3 18 Total Nonfarm Employment 146.9M 149.3M Industrial Employment 31.5M 32.3M Unemployment 4.4% 3.9% Source: BLS Market Indicators
INDIANA INTERSTATE AND INTRASTATE LOCAL REDUCED CITY-PAIR FARES
 The following section contains city-pair fares that are lower than walkup mileage-based fares. Although shown in only one direction, the fares in this section apply in both directions, unless otherwise
U.S. Office Snapshot Q1 2016
 MARKETBEAT U.S. Office Snapshot Q1 2016 U.S. OFFICE Employment Indicators Q1 15 Q1 16 Total Nonfarm Employment 140.8M 143.5M Offi ce-using Employment 30.2M 31.0M Unemployment 5.6% 4.9% Source: BLS Market
MARKETBEAT U.S. Office
 MARKETBEAT U.S. Office Q4 2016 U.S. OFFICE Employment Indicators Market Indicators (Overall) Q4 15 Q4 16 Vacancy Rate 13.5% 13.2% Net Absorption 20.5M 6.9M Under Construction 94.5M 100.2M Weighted Asking
Monthly Employment Watch: Milwaukee and the Nation's Largest Cities
 Monthly Employment Watch: Milwaukee and the Nation's Largest Cities A monthly report on employment trends in the nation s largest cities Prepared by: The University of Wisconsin-Milwaukee Center for Economic
Monthly Employment Watch: Milwaukee and the Nation's Largest Cities
 Monthly Employment Watch: Milwaukee and the Nation's Largest Cities A monthly report on employment trends in the nation s largest cities Prepared by: The University of Wisconsin-Milwaukee Center for Economic
Monthly Employment Watch: Milwaukee and the Nation's Largest Cities
 Monthly Employment Watch: Milwaukee and the Nation's Largest Cities A monthly report on employment trends in the nation s largest cities Prepared by: The University of Wisconsin-Milwaukee Center for Economic
Major US City Preparedness For an Oil Crisis Which Cities and Metro Areas are Best Prepared for $4 a Gallon Gas and Beyond?
 Major US City Preparedness For an Oil Crisis Which Cities and Metro Areas are Best Prepared for $4 a Gallon Gas and Beyond? March 4, 2008 By Warren Karlenzig President Common Current www.commoncurrent.com
RANKING OF THE 100 MOST POPULOUS U.S. CITIES 12/7/ /31/2016
 OVERVIEW OF THE DATA The following information is based on incoming communication to the National Human Trafficking Hotline via phone, email, and online tip report from December 7, 2007 December 31, 2016
Join us! Dare to imagine and take your business from great to outstanding!
 JAFRA Coming to a city near you! Join us! Dare to imagine and take your business from great to outstanding! Get the latest company news. Learn new & different ways to maximize your holiday sells. Discover
2019 Preferred Rate Hotel Program Rates
 ABA 2019 TWO EASY WAYS TO MAKE RESERVATIONS USING THE ABA PREFERRED RATE HOTEL PROGRAM: PROBLEM BOOKING THE ABA PREFERRED RATES? CONTACT ABA TRAVEL SERVICES AT travel.services@americanbar.org 1. Contact
MARKETBEAT U.S. Industrial
 MARKETBEAT U.S. Industrial Q2 2017 U.S. INDUSTRIAL Employment Indicators Q2 16 Q2 17 Total Nonfarm Employment 143.9M 146.2M Industrial Employment 25.2M 25.6M Unemployment 4.9% 4.4% Source: BLS Market Indicators
United States Office 2Q 2016
 MARKETBEAT United States Office 2Q 2016 U.S. OFFICE Employment Indicators Market Indicators Net Absorption/Rent 4Q TRAILING AVERAGE Overall Vacancy 2Q 15 2Q 16 Total Nonfarm Employment 141.5M 143.9M Offi
2018 Preferred Rate Hotel Program Rates
 Atlanta, GA The Ritz-Carlton, Atlanta 800-241-3333 $279 $298 $361 $372 The Ritz-Carlton, Buckhead 800-241-3333 $303 $321 $410 $384 The St. Regis Atlanta 404-832-8065 $294 $321 $444 W Midtown Atlanta -NEW-
2012 Airfares CA Out-of-State City Pairs -
 2012 Airfares Out-of-State City Pairs - Contracted rates are from July 1, 2012 through June 30, 2013. Please note all fares are designated as () and ( ) in airline computer reservation systems. fares are
Industry. OH&LA Hospitality It s not all BLACK & WHITE. Duane Vinson Vice President
 State of the Industry OH&LA Hospitality 2010 It s not all BLACK & WHITE Duane Vinson Vice President For a copy of this presentation go to www.hotelnewsnow.com Click on Industry Presentation Supply Growth
Park-Related Total* Expenditure per Resident, by City
 Park-Related Total* per Resident, by City FY 2008 City Population Total Park per Resident Washington, D.C. 591,833 $153,324,830 $259 Seattle 598,541 $150,672,543 $252 Scottsdale 235,371 $50,429,049 $214
Get Smart Market Insights from Our Research Team Customer Conference
 Get Smart Market Insights from Our Research Team 217 Customer Conference Presenters Amanda Nunnink Amanda Nunnink Steve Steve Guggenmos Guggenmos Sara Steve Hoffman Griffin Steve Sara Griffin Hoffmann
ILLINOIS INTERSTATE AND INTRASTATE LOCAL REDUCED CITY-PAIR FARES
 The following section contains city-pair fares that are lower than walkup mileage-based fares. Although shown in only one direction, the fares in this section apply in both directions, unless otherwise
San Francisco Travel Association Citywide Customer Advisory Council Meeting. August 21, 2014
 San Francisco Travel Association Citywide Customer Advisory Council Meeting August 21, 2014 Agenda Discussion Themes 1. Meetings Are Important 2. Market Meetings Pace 3. Occupancy & Rate 4. Economic Impact
Arizona - Phoenix Last Updated by Seyed 12 hours ago Tempe Mission Palms Hotel 60E. 5th St. Tempe, AZ Tel.
 www.iran.org COMPLETE LIST OF ILLEGAL POLLING PLACES SET UP BY THE ISLAMIC REPUBLIC OF IRAN IN THE UNITED STATES FOR THE JUNE 12, 2009 PRESIDENTIAL ELECTIONS 1 Source: Islamic Republic of Iran Interest
(See Note 1) Solar Energy Factor (SEF D ) Solar Fraction (SF D ) Estimated Energy Savings SYSTEM DETAILS
 Solar Energy Factor (SEF D ) Solar Fraction (SF D ) Estimated Energy Savings SYSTEM DETAILS") OG-300 ICC-SRCC TM CERTIFIED SOLAR SYSTEM # SYSTEM INFORMATION Pumped Internal Backup: Gas Tank Collector Type: Glazed Flat Plate Solar Tank Volume: 379 liter (100 gal) Collector Heat Transfer Fluid: GRAS
OG-300 ICC-SRCC TM CERTIFIED SOLAR SYSTEM # SYSTEM INFORMATION Pumped Internal Backup: Gas Tank Collector Type: Glazed Flat Plate Solar Tank Volume: 379 liter (100 gal) Collector Heat Transfer Fluid: GRAS