South County Airport Master Plan Report. County of Santa Clara San Martin, California
|
|
|
- Cody Holmes
- 5 years ago
- Views:
Transcription


1 South County Airport Master Plan Report County of Santa Clara San Martin, California July 2006


 as provided under Section 505 of the Airport and")

2 County of Santa Clara Board of Supervisors Donald F. Gage Blanca Alvarado Peter A. McHugh James T. Beall, Jr. Liz Kniss District 1 District 2 District 3 District 4 District 5 COUNTY EXECUTIVE S OFFICE Peter Kutras, Jr. County Executive Jane Decker, Deputy County Executive ROADS AND AIRPORTS DEPARTMENT Michael J. Murdter, P.E., Director COUNTY AIRPORT ADMINISTRATION Carl Honaker, Director Eric S. Peterson, Asst. Director Larry Feldman, Business Manager Ken Betts, Noise Abatement Coordinator Chris Nucci, Operations Manager MEAD & HUNT, INC. David Dietz, AICP, Project Manager Maranda Thompson, Airport Planner Todd Eroh, Graphics Technician Susan Norvall, Publication Coordinator The preparation of this document was financed in part through a planning grant from the Federal Aviation Administration (FAA) as provided under Section 505 of the Airport and Airway Improvement Act as amended. The contents of this document do not necessarily reflect the official views of the FAA. Acceptance of this report by the FAA does not in any way constitute a commitment on the part of the United States to participate in any development depicted herein, nor does it indicate that the proposed development is environmentally acceptable in accordance with applicable public laws.
3 !" # $%%&
4 ! "#!$#!$!# %% # &''( ') '%'))!*+!,))!*,$!)) )- )- )-./'!0!)- 12!'!0!)3 %4%%+" )5 $)5!!2$)6 171$)6 )( )( 8!! $) %"'%'*& )) "'")) "& )- +'&9' )3 0$271 $!):!!1 $!!00!!+/$)5 )6 )6 ))( %% ))(!!2$))( $)) 171$))
5 &&; +'" $! $,) ) $,<'!/ ; "=% # ; "&5!"5 # $ 5 %& $$ & '6 ( $$ & '6 '!!'!6 1/12!/7!!( %+)./) 11!) ; "%%&% %%% )!!*!!./ /0!!!)*! /123(,!!7!2!!!*! /12)3(,!!7!2!!00!! /0!- 7!,! '!/!0!- 12;7-!0!!/7# 12/7/>%?/>&1 12!B!3 ::0/1,!: ;!/0!!!: 4; % :./: !5 5 6 )(,?/0)( +1 /!!)(!) /+).2%?//7/) //) = ))
6 !!!2- '!/-) +'" --,/!?/-- /--!2--.!+!$!-- $,, 2!-# "-# "!!!0 +1 /-# %!!+1 /-3,1! /!'$!/-3,;7?-3,!!1-3 &!2/!-: '!!+-: ;!/!?-5 ;!;!!0!-5 "#$% '# '&&;# %! "1/$!#!!1!#).$!1!#!!/#- &'4' #- %&% #3 $0$!0!/01!$ A!#3 1!$ A!#3 4"'+' #: #: %1$7!$!#: 10 7!!#5 %% #5!%! 1 ' + ",!0!0$@ ' 0!!!2
7 & $1 ) $1 '7!! $! - $$71,!'! %$) +!$5 $!!6 ) +!,'!0!) 12!/7!!,, /0!!!,,5 $!$!C1) ' $!,,) # $!$!1!!1!#) #+ $!$!1.$!1!# # 171$!!1!## #' 171$.$!1!## $,!- + $!3!$: ' 001,! )!! )- )+!!) )# )!! )# )' 12!+!,!): )!!$!,!!2$)6 )!!$!, $)6 )"!$!,171$))( ) %!!)) $'!/3 + 12!/7!C1!0!5 12)6$$7%010( '!C1!/'!# 12.!!!5 #,++!,#:
8 Chapter 1 Background and Inventory South County Airport Master Plan

9 1 Background and Inventory SOUTH COUNTY AIRPORT Location and Environs South County Airport is located within the unincorporated community of San Martin in Santa Clara County (Figure 1A). The Airport is located one mile east of the community s downtown area. At an elevation of 281 feet Mean Sea Level (MSL), the Airport lies on the flat Santa Clara Valley floor, which runs through the middle of the County. The Santa Cruz Mountains bound the Airport to the west and rise to nearly 3,500 feet MSL. The Airport is bounded by U.S. Highway 101 to the east, San Martin Avenue to the north and Murphy Avenue to the west. A mixture of residential, commercial, and industrial uses surrounded the Airport on all sides. The Airport s general aviation terminal is situated off Murphy Avenue. Automobile access to South County Airport is via U.S. Highway 101, San Martin Avenue and Murphy Avenue. Highway 101 connects the San Martin area to San Francisco to the north and Los Angeles to the south. South County Airport Master Plan (July 2006) 1-1
10
11 BACKGROUND AND INVENTORY CHAPTER 1 History South County Airport opened in The Airport was constructed in what was a relatively rural area of south Santa Clara County. The of demand (parking and operational) from northern and central Santa Clara County. Facilities South County Airport is owned in fee by the County of Santa Clara. The day-to-day operation and management of the Airport is the responsibility of the County s Roads and Airports Department. Policy decisions affecting the Airport are made by the five-member Board of Supervisors. The Santa Clara County Airports Commission serves in an advisory capacity to the Board of Supervisors and staff on matters involving County-managed airports. The Airport encompasses 179 acres and consists of a single runway and two parallel taxiways on either side of the runway. A large building area, containing nearly all of the airport buildings, is located west of Runway A full-length apron edge taxiway serves the building area. Runway is 3,100 feet in length and 75 feet wide. It is asphalt paved with basic markings. The surface is rated at 12,500 pounds for aircraft with main landing gear in a single-wheel configuration. Runway is a nonprecision runway with a GPS straight-in instrument approach to Runway 32. The runway is supported by a Medium-Intensity Runway Lighting System (MIRL). To facilitate landing operations, a two-box Precision Approach Path Indicator (PAPI) with a 4.0 visual glide slope is located to the left side of Runway South County Airport s principal building area is located west Runway and backs to Murphy Avenue. Ninety tiedown spaces are located on the main apron positioned west of Runway 32. Several fixed based operator buildings, hangars (e.g., T-hangars and portable hangars), and a tiedown apron are located in the northern portion of the building area, west of Runway 14. A mixture of box hangars and T-hangars (totaling 100 units) were recently constructed in the central section of the building area. A summary of the facilities is presented in Table 1A. South County Airport Master Plan (July 2006) 1-3
12 CHAPTER 1 BACKGROUND AND INVENTORY MAJOR FEATURES MANAGEMENT AND SERVICES Property 179 acres owned in fee by the County of Santa Clara Airfield Elevation: 281 feet MSL (estimated) Runway 14-32: 3,100 feet long, 75 feet wide Pilot-controlled MIRL Glide Slope Indicator (PAPI-4.0 ) on left side of runway Asphalt-paved with basic markings Beacon; lighted wind indicator; segmented circle Management Management and maintenance provided by County of Santa Clara, Roads and Airports Department Fixed Base Operations Fuel service: 100LL, Jet Fuel FBO services: Flight instruction Aircraft rental, sales and charter Aircraft maintenance Aircraft storage Building Area West side of Runway Aircraft parking: 90 marked tiedown positions on main apron 33 unmarked FBO tiedown spaces 100 hangars (FBO, box, and T-hangars) ENVIRONS Topography Airport lies on flat Santa Clara Valley floor Relatively level terrain close to Airport Rising terrain to the west and east, exceeding 4,000 feet and 2,000 feet, respectively AIR TRAFFIC PROCEDURES Traffic Patterns Right traffic pattern to Runway 32 Pattern altitude: 1,281 feet MSL (1,000 feet AGL) Instrument Approaches/Navaids GPS to Runway 32: straight-in; 1¼ mile visibility; 1,320 feet MSL minimum descent height San Jose VOR/DME: MHz Salinas VORTAC: MHz Communications UNICOM/CTAF: MHz Access Primary access is Murphy Avenue via US Highway 101 and San Martin Avenue Jurisdiction Santa Clara County: Airport is located in the unincorporated portion of County Nearby Land Uses All quadrants: principally a mixture of residential and agricultural sites scattered throughout countryside Source: Data compiled by Shutt Moen Associates (August 2001) Table 1A Airport Profile South County Airport 1-4 South County Airport Master Plan Report (July 2006)
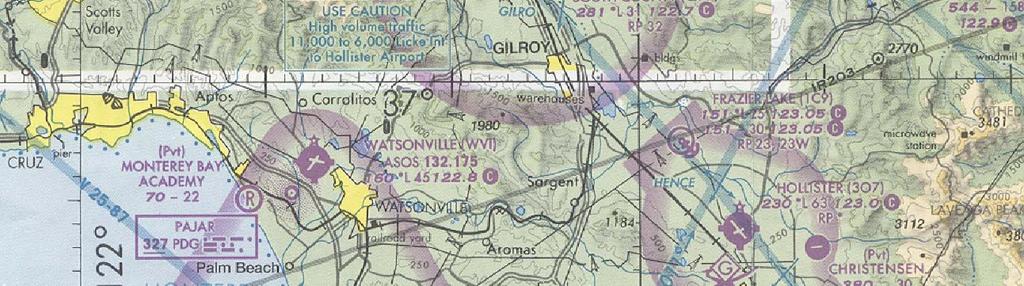
13 BACKGROUND AND INVENTORY CHAPTER 1 The full range of general aviation services is available from one fixed base operator to pilots and aircraft. The available services are summarized in Table 1B. AERONAUTICAL SETTING Area Airports Six public-use airports and two private-use airports are located within 25 nautical miles of South County Airport. Of these airports, Frazier Lake is the nearest. Watsonville Airport is the nearest airport with a hard surfaced runway. Table 1C summarizes selected features of each of these airports and Figure 1B shows their location. Area Airspace Federal regulations define various categories of airspace with distinct operating requirements for each type. The airspace in the vicinity of South County Airport is relatively simple. South County Airport is located in Class G airspace. The Class E airspace that overlies the airport has a floor of 700 feet AGL. The Class B airspace associated with San Francisco International Airports and the San Jose Class C airspace start about 17 and 7 nautical miles to the northwest, respectively. Air traffic control clearance is required for all aircraft intending to operate in the Class B airspace. The airspace classifications are illustrated in Figure 1C. One low-altitude Victor Airways passes near South County Airport: V-485 immediately west of the Airport. This airway provides a defined route that can be flown under instrument conditions. Pilots using this airway normally do not interact with air traffic utilizing South County Airport. COMMUNITY PROFILE Santa Clara County is bounded by San Mateo County to the northwest; Alameda County to the north; Stanislaus County to the east; Merced County to the southeast; San Benito County to the south; Monterey County to the southwest; and Santa Cruz County to the west. The County encompasses nearly thousand acres. The unincorporated community of San Martin is located in the southern portion of Santa Clara County. San Martin is situated 5 miles south of the City of Morgan Hill and 6 miles north of the City of Gilroy. South County Airport Master Plan (July 2006) 1-5
14 CHAPTER 1 BACKGROUND AND Fixed Base Operations (Aviation-Related Services) Fuel Sales Flight Instruction Aircraft Rental Aircraft Parts & Maintenance Aircraft Storage Miscellaneous Name 100/100LL Jet-A 80 Fixed Wing Sailplane Fixed Wing Sailplane Engine Airframe Avionics Sailplane Other Based Tiedowns Hangars Transient Ramp Pilots' Supplies Charter (FAR 135) Aircraft Sales Other 2 Genes Aviation, Inc. Source: Data compiled by Mead & Hunt, Inc. (August 2003) Table 1B Airport Tenants South County Airport 1-6 South County Airport Master Plan Report (July 2006)
15 BACKGROUND AND INVENTORY CHAPTER 1 Location Facilities Services Airport Owner Community/County Distance 1 /Direction Based Aircraft Number of Runways Longest Runway (ft.) Surface 2 Lighted-Intensity 3 Approach Visibility 4 Control Tower Airline Service AvGas Jet Fuel Maintenance Automobile Rentals 5 Food Area Airports South County Public San Martin/ Santa Clara ,100 Asph M 1¼ a a a Reid-Hillview Public San Jose/ Santa Clara 20 NW ,101 Asph M VFR a a a a Salinas Public Salinas/ Monterey 25S ,000 Asph M ½ a a a a a a Hollister Public Hollister/ San Benito 15 SE ,350 Asph M 1 a a a a a Watsonville Public Watsonville/ Santa Cruz 13 SW ,501 Asph M 1 a a a a a San Jose International Public San Jose/ Santa Clara 24 NW ,200 Asph H ½ a a a a a a a Frazier Lake Airpark Private Hollister/ San Benito 11 SE ,500 Turf/ Water Private Use Christensen Ranch Private Hollister/ San Benito 18 SE 1 3,000 Asph Private Use Monterey Bay Academy Private Watsonville/ Santa Cruz 16 SW 1 2,200 Dirt Private Use 1 Distance limited to 25 nautical miles from South County Airport 2 Asph=asphalt 3 L=low; M=medium; H=high 4 Statute mile 5 On-field (outlet) Source: Data compiled by Mead & Hunt, Inc. (August 2005) Table 1C Area Airports South County Airport South County Airport Master Plan (July 2006) 1-7


16

17 BACKGROUND AND INVENTORY CHAPTER 1 AGL above ground level MSL mean sea level FL flight level Airspace Classes Communications Entry Requirements Separation A Required ATC clearance All N/A B Required ATC clearance All Yes C Required Two-way communications prior to entry VFR/IFR Yes D Required Two-way Runway communications operations prior to entry Yes E Not required for VFR None for VFR None for VFR Yes G Not required None None N/A Special VFR in Surface Area Figure 1C Airspace Classes South County Airport Master Plan 1-9
18 CHAPTER 1 BACKGROUND AND INVENTORY The City of Gilroy has grown by 28 percent over the last decade from 31,487 residents in 1990 to 40,150 residents in Comparatively, the City of Morgan Hill has realized a 38 percent growth in population over the same 10-year period, from 23,928 in 1990 to 33,100 in The County has grown by 16 percent and has a population of just over 1.7 million as of January Additional information is provided in Table 1D. The County s local economy is supported predominantly by manufacturing, trade, and service-oriented industries. The City of Morgan Hill, located south of Silicon Valley, is well known for its manufacturing and research firms. The City of Gilroy s economy has historically been based on agricultural products and processing. Today, agricultural industries continue to contribute to the area s local economy. In fact, the City of Gilroy is often regarded as the Garlic Capital of the World. PREVIOUS AIRPORT PLANS AND STUDIES South County Airport was one of three County-owned or leased airports addressed in the Santa Clara County Airports Master Plan (1982). The Master Plan examined the feasibility of providing new development (e.g., additional aircraft parking, FBO sites, etc.) at the Airport while providing maximum efficiency and convenience South County Airport Master Plan (July 2006)
19 GEOGRAPHY POPULATION AND ECONOMY Location Unincorporated community of San Martin is located in Santa Clara County, California Nearby cities within 5 miles: Gilroy (south) and Morgan Hill (north) Topography Santa Cruz Mountains located west, rise to nearly 2,200 feet MSL SURFACE TRANSPORTATION Major Highways US Highway 101 extends north-south Public Transportation CAL Train VTA Local Bus VTA Express Rental Car Service Enterprise Current/Historical Population Santa Clara County: 1,528,600 1,597,400 1,709,500 City of Gilroy: 31,487 NA 40,150 City of Morgan Hill: 23,928 NA 33,100 Community of San Martin: --data not available-- (Source: California Department of Finance and Santa Clara County Government Website) Projected Population Santa Clara County: 1,987,800 2,063,000 2,163,000 Community of San Martin: --data not available-- (Source: Association of Bay Area Governments) Basis of Economy Industry groups with greatest percentage of employment in Santa Clara County: Service 36% Manufacturing 25% Trade 19% (Source: California Department of Finance) Taxi Service Yellow Cab South County CLIMATE Temperatures Avg. High Avg. Low Hottest month (July): 88.2 F 53.7 F Coldest month (January): 60.1 F 36.4 F Precipitation Average annual rainfall in Gilroy: inches (Source: Western Regional Climatic Center*) Winds Prevailing winds from the northwest * Weather data provided on this table is for the City of Gilroy, which is located approximately 5 miles south of San Martin. Source: Data compiled by Shutt Moen Associates (August 2001)
20 Chapter 2 Airport Role and Activity Forecasts South County Airport Master Plan
21 2 Airport Role and Activity Forecasts INTRODUCTION This version of the Airport Roles and Forecasts Discussion Paper reflects the action taken by the Santa Clara Board of Supervisors on November 19, A key purpose of an airport master plan is to define the role of the airport. The airport s adopted role in turn drives its basing capacity, which is the type and number of aircraft that the airport will be developed to accommodate. Once a role is defined, then the facilities necessary to implement the role can be specified. The term role is used in two different contexts. In a strategic context, it means the function and purpose of the airport with respect to the overall transportation network (e.g., whether the airport will be geared to small piston propeller aircraft, larger turboprops, or even business jets). In another context, it means the function of each airport with respect to accommodating growth in the number of based general aviation aircraft. The process by which we may determine the airports roles is outlined as follows: Forecast the overall demand for the airports (in terms of the number of based aircraft) over the 20-year time horizon of the Master Plan. Determine the hypothetical maximum basing capacity of each airport. Compare the forecasted overall demand to the total hypothetical maximum basing capacity of the airports. Identify policy alternatives available with respect to the role of each airport (i.e., the extent to which a particular airport should be developed to accommodate the forecasted demand). South County Airport Master Plan (July 2006) 2-1
22 CHAPTER 2 AIRPORT ROLES AND FORECASTS Select a role for each airport based on the Guiding Principles adopted at the beginning of the master planning process. Airport Facility Plans based on the adopted role for each airport will be developed as part of subsequent phases of the master planning process. Appropriate environmental documentation will also be developed in accordance with the California Environmental Quality Act (CEQA). DEMAND FORECAST An aggregate forecast of based aircraft was prepared for the four airports in Santa Clara County: Palo Alto, Reid-Hillview, South County and San Jose International. The specific methodology is presented below. Historical Trends Based Aircraft Historical data for Reid-Hillview, Palo Alto, and South County airports was taken from Santa Clara County records. Data for San Jose International Airport was taken from City of San Jose and Federal Aviation Administration records. It is appropriate to start a discussion of forecasts with an examination of the historical record. Figure 2-1 presents the annual count of based aircraft within Santa Clara County, beginning in The early 1980s reflect the small residual growth following the boom years of the 1970s. Through the middle 1980s there was little change in the number of based aircraft, merely minor year-toyear variations. The total number of based aircraft remained slightly above 2,000. Beginning in about 1988 the number of based aircraft within the county started a slow decline. This general trend continued through the mid to late 1990s, although there were short periods of increase. The lowest recent total occurred in 1999 when the number of based aircraft dropped to 1,467. The last three years have seen an increase in based aircraft. In February 2002, the number of based aircraft countywide had increased to 1,580. Anecdotal information suggests that these may be the initial steps in a reversal of a decade-long decline. However, the current economic decline may slow the resurgence. Operation (definition): Either a landing or a takeoff. A touch and go, a common training operation that involves a landing and an immediate takeoff without stopping, counts as two operations. Historical Trends Aircraft Operations Data on aircraft operations for the three airports is readily available for all three airports back to 1978 and for Reid-Hillview back to The operations counts for Reid-Hillview and Palo Alto Airports are based upon counts made by the air traffic control tower staff. South County Airport data is based upon estimates and should be considered to be order-of-magnitude only. 2-2 South County Airport Master Plan (July 2006)
23 AIRPORT ROLES AND FORECASTS CHAPTER Number of Based Aircraft Year Historical County (Low) County (High) Federal (TAF) National Statewide Bay Area (Low) Bay Area (High) Figure 2A Based Aircraft Demand Forecast Santa Clara County South County Airport Master Plan (July 2006) 2-3
24 CHAPTER 2 AIRPORT ROLES AND FORECASTS Some of the recent estimates for South County Airport are based upon sample counts made by Caltrans Division of Aeronautics staff using an acoustical counter. These recent estimates can be assumed to be significantly more accurate than prior estimates. Reid-Hillview Trends Aircraft operations at Reid-Hillview grew fairly consistently through the late 1960s and peaked in 1978, with almost 400,000 annual operations (398,640). A very rapid decline followed with a reduction by nearly two-thirds to 137,019 operations in This was the lowest volume of operations in over 30 years. A second cycle of growth occurred through the 1980s, reaching a plateau of around 200,000 annual operations. Operations again declined, reaching its next low in 1995 with 151,916 operations. Since that time, operations have grown slightly each year. The total for the most recent year (2001) was 235,213. Palo Alto Trends The pattern of historical operations at Palo Alto Airport shows markedly less variation than at Reid-Hillview. There was a significant decline in operations from 1978 through 1982 (that paralleled that at Reid-Hillview): 252,425 operations to 144,223 operations. However, the percentage change was much less (44% versus 66%) than at Reid-Hillview. Following that low point, operations grew, reaching its next peak in 1990 with 240,496 operations. Again paralleling the experience at Reid-Hillview, operations declined through the early 1990s reaching its next low in 1995 with 184,285. Since that time, annual operations have hovered around the 200,000 level, with year-to-year variations as high as 10%. In 2001, the annual count was 209,709. South County Trends The lack of reliable data sharply limits the ability to discern trends at South County Airport. The most that can be said is that in recent years the number of operations has remained around 56,000 annual operations. Existing Demand Forecasts Both the Federal Aviation Administration (FAA) and Caltrans Division of Aeronautics have current forecasts of based aircraft for the four airports located in Santa Clara County. Additionally, it is appropriate to consider the FAA s national forecast for general aviation aircraft and Caltrans statewide forecast. FAA data are 2-4 South County Airport Master Plan (July 2006)
25 AIRPORT ROLES AND FORECASTS CHAPTER 2 taken from the National Plan for Integrated Airport Systems (NPIAS), the on-line Terminal Area Forecasts, and the Aerospace Forecasts report. Caltrans data are taken from its California Aviation System Plan (CASP). Specifically, seven existing forecasts are evaluated in the paragraphs that follow: 1. NPIAS Terminal Area Forecast for airports in Santa Clara County 2. NPIAS national growth rate 3. CASP San Francisco Bay Area high forecast 4. CASP San Francisco Bay Area low forecast 5. CASP high forecast for airports in Santa Clara County 6. CASP low forecast for airports in Santa Clara County 7. CASP statewide growth rate The Metropolitan Transportation Commission prepared forecasts of general aviation based aircraft and operations in its Regional Airport System Plan Update. The document provided forecasts through the year Although this document was released in 1994, it relies upon statewide data from 1988 and earlier, and national data from 1990 and earlier. This data is judged to be too old to reflect current trends and is not used in this analysis. The FAA annually prepares Terminal Area Forecasts for all airports listed in the National Plan of Integrated Airport Systems. The year 2005 Terminal Area Forecasts for the four airports in Santa Clara County predict an increase in the number of based aircraft for the four airports to 1,818 by the year If this growth rate continues, the total for the four airports would reach 1854 by This growth rate is somewhat less than FAA s forecast national growth rate of about 0.9% annually. If the national growth rate occurred, the total number of aircraft based in Santa Clara County would grow to 1,782 by 2015 and 1,890 by Caltrans California Aviation System Plan (CASP) contains statewide, regional and individual airport forecasts. The most recent forecasts were published in Forecasts were prepared through the year The statewide CASP forecast was for 0.978% annual growth. The high forecast for the San Francisco Bay Area was 1.3% annual growth and the low forecast was % annual growth. By comparison, the four airports in Santa Clara County were forecast to grow by 14% under the low forecast and 20% under the high forecast. These forecasts were extended to the year 2022, using the following methodology: The forecast statewide and Bay Area growth rates were applied to the actual current (2002) number of based aircraft South County Airport Master Plan (July 2006) 2-5
26 CHAPTER 2 AIRPORT ROLES AND FORECASTS The 2010 forecasts for the individual airports were extended by applying the growth rates out to The results of this effort are forecasts for the year 2022 as follows: 2022 Forecast Number of Based Aircraft CASP Santa Clara County high forecast 2,290 CASP San Francisco Bay Area - high forecast 2,046 CASP statewide growth rate 1,920 FAA national growth rate 1,890 FAA Terminal Area Forecast Santa Clara County 1,854 CASP Santa Clara County low forecast 1,725 CASP San Francisco Bay Area low forecast 1,553 Countywide Demand Forecast Change in the number of based aircraft at any one airport is a function of newly manufactured aircraft entering the system and migration of existing aircraft between airports. The first factor is affected by the state of the economy, economic factors within the aviation industry, regulatory constraints, etc. Migration of aircraft is shaped indirectly by the larger economic factors that affect the aircraft owners. However, the single largest short-term factor currently affecting migration of aircraft within Santa Clara County is the availability of hangars. There appears to be a very large, unmet demand for hangars throughout the San Francisco Bay Area and aircraft owners are willing to drive longer distances to where they base their aircraft if they are able to obtain a hangar. In the short run, whichever airports are the first to build hangars can expect to attract aircraft from surrounding areas. In the long term, aircraft owners will try to base as close to their home (or office) as possible, assuming that cost, facilities, etc. are equal. However, given the very slow turnover in hangars, it is likely that the distribution of aircraft will never reach equilibrium where all aircraft are based at the airport most convenient to the owner. It is appropriate to first eliminate from consideration those forecasts that do not appear to be plausible or are otherwise inappropriate. In examining the various existing forecasts, the CASP high forecast for the four airports in Santa Clara County projects the highest number of based aircraft (2,290) in the year 2022, which equates to a growth rate of about 36 aircraft per year. Over the last 2-6 South County Airport Master Plan (July 2006)
27 AIRPORT ROLES AND FORECASTS CHAPTER 2 three years, the number of aircraft based in Santa Clara County has increased an average of 26 aircraft per year. Therefore, the CASP high forecast for Santa Clara County is not supported by current trends and was removed from further consideration. The CASP low forecast for the San Francisco Bay Area has a negative growth rate. In light of the positive growth rate over the last several years, this forecast was also judged inappropriate and removed from further consideration. The FAA TAF forecasts for San Jose International and South County Airports indicate no change from current totals. The TAF forecasts for Reid-Hillview and Palo Alto both show increases over present levels. However, the most recent (2003) TAF totals for all of these airports differ significantly from the actual counts. The TAF for San Jose indicates 417 based aircraft, while only 279 are actually present. The 2003 TAF count for the other three airports were lower than actual: Reid-Hillview: TAF = 567; actual = 687 Palo Alto: TAF = 458; actual = 524 South County: TAF 70, actual = 90 Given that the most recent TAF counts for the three countyoperated airports are lower than actual, this may result in TAF forecasts that understate growth trends. In this forecast it is assumed that Moffett Federal Airfield will not serve as a base for civilian, general aviation aircraft during the 20-year span of this plan. If Moffett becomes available for general aviation aircraft, it could reduce demand at other nearby airports. The remaining CASP forecasts, if extended to the year 2022, project between 1,725 and 2,046-based aircraft. If the current growth rate of 26 aircraft per year continued for 20 years, about 2,100 aircraft would be based in the county by However, it is believed that the current growth rate will not be sustained for 20 years. Therefore, for the purposes of this master plan, a figure between the CASP statewide growth-rate forecast and the CASP high forecast for Bay Area airports was selected. This growth rate is equivalent to an average increase of 19 aircraft per year or 1,960 based aircraft in the year This recommended forecast is 5.7% higher than the TAF forecasts for the four airports. Given that the most recent TAF count is 4.5% lower than actual, this slightly higher number can be considered consistent with the trend identified in the TAF. South County Airport Master Plan (July 2006) 2-7
28 CHAPTER 2 AIRPORT ROLES AND FORECASTS HYPOTHETICAL MAXIMUM BASING CAPACITY Determining the extent to which each airport will be developed to meet forecasted demand first requires examination of the physical constraints that affect the ability of each airport to accommodate additional based aircraft. Once the hypothetical maximum basing capacity of each airport has been established we will be in a position to compare the aggregate maximum basing capacity for the three airports against the total forecasted demand. This comparison provides the foundation for identifying policy alternatives available to the Board of Supervisors regarding the role of each airport with respect to meeting future demand. It is important to note that an airport s ability to physically accommodate additional aircraft is only one constraint affecting its ultimate basing capacity and that the hypothetical maximum basing capacity does not represent a specific plan or policy recommendation. The following assumptions were made solely for the purpose of determining hypothetical maximum basing capacity: No additional real property acquisition at RHV and PAO is feasible (i.e., development would be limited to the existing airport property). No net change in basing capacity will occur on the airport property already developed, including the 12 Fixed Base Operator (FBO) leaseholds. All developable real property at RHV and PAO would be used for aircraft storage. The additional basing capacity figures discussed below are approximate and based on preliminary site layouts and standard airport design parameters with respect to clearances, setbacks etc. The actual number of additional aircraft that could be accommodated may vary slightly. Palo Alto Airport Palo Alto Airport s current role is to serve light, single- and twinengine piston aircraft. The airport also sees limited use by turboprop aircraft. The airport currently has 524-based aircraft with a capacity to accommodate up to 553 aircraft, including approximately 30 spaces needed by fixed base operators to accommodate long-term transient aircraft at the airport for maintenance and other purposes. For the purposes of this document, the 30 spaces used for long-term transient aircraft will be treated the same as spaces for permanently based aircraft in the calculation of basing capacity. 2-8 South County Airport Master Plan (July 2006)
29 AIRPORT ROLES AND FORECASTS CHAPTER 2 The airport is severely constrained. The presence of tidal waters near both ends of the runway makes it infeasible to lengthen the runway and only about eight acres at the south and southeast areas of the airport remain available for development. Approximately 60 aircraft storage hangars could be developed on the vacant areas, which would increase the airport s basing capacity from 553 to 613. Therefore, although there is limited potential for additional development, there is no potential to change the role of the airport to accommodate larger aircraft. Reid-Hillview Airport Reid-Hillview Airport s current role is to serve light, single- and twin-engine piston aircraft. The airport also sees limited use by turboprop aircraft and the smallest business jets. The airport currently has 687-based aircraft with sufficient existing capacity to accommodate a total of 726 aircraft. The airport has 8 acres of undeveloped property in the southeast corner of the airport between the existing southernmost row of hangars and Tully Road. This property is adjacent to the existing taxiway and could accommodate an additional 167 aircraft. Total capacity for based aircraft would increase to 893. Approximately 35 acres on the west side of the airport could accommodate an additional 136 aircraft if a new taxiway were constructed on the west side of Runway 31L/13R, bringing the hypothetical maximum basing capacity to 1,029 aircraft. While it would be possible to extend the length of runway available for departures, it is infeasible to extend significantly the runway for landings. Therefore, it would not be possible to expand substantially the current role of the airport. The most that is physically possible is to use minor extensions to marginally increase the airport s ability to serve turboprops and small business jets. South County Airport South County Airport was established in the 1960s to serve as a: General Aviation airport to serve local users in southern Santa Clara County Reliever airport to serve the overflow of demand (parking and operational) from northern and central Santa Clara County The Airport was originally envisioned as a dual-runway facility with capacity to base 550 aircraft, although the 1982 Airports Master South County Airport Master Plan (July 2006) 2-9
30 CHAPTER 2 AIRPORT ROLES AND FORECASTS Plan recommended redefining the airport s role to a single-runway facility including aircraft parking capacity commensurate with its single-runway airfield capacity. The 1982 Master Plan went on to describe how the airfield capacity could become the limiting factor with regard to the airport s basing capacity if the number of annual operations per based aircraft remained high. At 650 annual operations per aircraft, for example, only 300 or so aircraft could be based at the airport because of the throughput limitations of the single runway, even though the airport has the physical space to accommodate over 600 aircraft. At less than 650 annual operations per aircraft, basing capacity increases accordingly. This issue is discussed here because some feel that the 1982 Master Plan reduced the basing capacity at South County to 300 aircraft. Santa Clara County is currently undertaking development of about 100 hangars at South County Airport. However, as these units do not currently exist, they are not included as existing capacity. The airport currently serves light, single- and twin-engine piston aircraft; limited use by turboprop and the smallest business jet aircraft also occurs. The airport currently has 90-based aircraft and a total of 178 aircraft storage spaces, not including the hangars currently under design. Among the three County airports, South County Airport is the only one without severe physical constraints on its future development. Two scenarios were developed to illustrate the range of development that could occur at the airport, one based on the existing airport property and one based on airport expansion. South County Existing Property Under this development scenario the airport would retain its current property boundaries. Approximately 45 acres are available for future development within the existing airport footprint, 32 of which would be devoted to aircraft storage while 13 acres would be reserved for FBO leaseholds. This alternative would increase the based aircraft capacity by 519 to 697 aircraft, including approximately 444 aircraft in storage hangars and 75 aircraft on FBO leaseholds. South County - Expansion Under this development scenario, the 38-acre parcel adjacent to the southwest part of the airport would be acquired and Murphy Avenue would be realigned. Approximately 83 acres would be available for development. About 68 acres would be devoted to aircraft storage, including large box hangars for corporate aircraft. An additional 15 acres would be reserved for FBO leaseholds and, potentially, limited non-aviation use. This alternative would increase the based aircraft capacity by 794 to 972 aircraft. This in South County Airport Master Plan (July 2006)
31 AIRPORT ROLES AND FORECASTS CHAPTER 2 cludes an increase in 694 aircraft in storage hangars and 100 aircraft on FBO leaseholds. It is important to note that although the airport would be physically capable of accommodating 972 aircraft under this scenario, airfield capacity limitations in terms of the number of annual operations would most likely limit the maximum basing capacity to less than 972 aircraft. Existing Basing Capacity vs. Maximum Basing Capacity Airport Existing Basing Capacity Increase in Basing Capacity Possible Maximum Basing Capacity Palo Alto Reid-Hillview South County Totals San Jose International Airport San Jose International Airport currently has 279-based aircraft. The number of based aircraft has been declining in recent years due to elimination of hangars and tiedowns, increasing rental rates, and conversion of FBOs from flight schools to uses oriented towards business jet aircraft. The current SJC master plan adopted in 1997 forecast that the number of general aviation aircraft based at the airport would decline to 320 by Since the current number of based aircraft has already fallen below the level forecast in the master plan, there is no source of official guidance on whether the number will decrease further and, if so, by how much. However, it is likely that the number of based aircraft will continue to decline even if the airport does not eliminate any additional publicly owned hangars or tiedowns. Fee increases, continued conversion of FBOs to uses oriented towards business jets and increased security measures are likely to encourage significant further relocation of smaller general aviation aircraft. For the purposes of evaluating demand at the airports operated by Santa Clara County, it will be assumed that the number of aircraft based at San Jose International will be reduced by an additional 100 aircraft by the year This would reduce the capacity at San Jose International to 179-based aircraft. South County Airport Master Plan (July 2006) 2-11
32 CHAPTER 2 AIRPORT ROLES AND FORECASTS MEETING DEMAND ALTERNATIVES Earlier in this chapter, we forecasted the countywide demand for based aircraft to reach 1,960 by the year To fully meet this demand, the four public-use airports would need to provide aircraft storage facilities for 1,960 aircraft. Based upon the preceding analysis, San Jose International Airport (SJC) is forecast to have only 179 general aviation aircraft in the year Since the number of general aviation aircraft based at SJC is driven in large part by the previously adopted Master Plan for that airport, we assume that the County has very limited ability to influence this number. This means that space for 1,781 aircraft will need to be provided at the three airports operated by Santa Clara County, if demand is to be met (1, = 1,781). Current capacity at the three airports is 1,457. Therefore, there will be a need for space for 324 additional aircraft if the demand is to be fully accommodated. Since the preceding section established that the three County airports have the ability to accommodate within their existing boundaries up to 882 additional aircraft over twice the forecasted growth in demand - some latitude exists regarding the extent to which each airport could be developed to accommodate the aggregate demand. In this section, alternatives to the current capacity and role are presented for each of the four airports in Santa Clara County. GUIDING PRINCIPLES On April 27, 1999, the Board of Supervisors adopted a set of principles to guide the master planning process. Discussion of these Guiding Principles is appropriate since they represent values to be applied to the available alternatives and will therefore influence to a great degree which alternatives are selected. The following summarizes the Guiding Principles: Financial Self-Sufficiency. The Airport Enterprise Fund should be self-sustaining without subsidy from the County General Fund. Revenue from fees and charges, state and federal grants and other sources should be sufficient to fund operating and maintenance costs, capital improvements and an appropriate level of reserves. The principle of financial self-sufficiency forges an inextricable link between the Master Plan and the Business Plan. Although the Master Plan focuses primarily on the role of each airport 2-12 South County Airport Master Plan (July 2006)
33 AIRPORT ROLES AND FORECASTS CHAPTER 2 and the subsequent capital improvements necessary to fulfill that role, the influence of these decisions on the Business Plan must be understood in order to properly coordinate the two Plans. The Board may also wish to formally expand this principle to require that each airport maintain financial self-sufficiency to the maximum extent practicable. Preserving the Quality of Life. The safekeeping of the quality of life of residents who live near County-operated facilities is important. Since this issue is directly related to the number of operations, forecasting the number of operations for various levels of based aircraft is an integral part of the decision-making process. Maintenance of Safety Zones. Maintaining the integrity of our safety zones by discouraging the encroachment of incompatible land uses will maintain the safety of airport users as well as those persons who live or work nearby. Since we have determined that it is infeasible to expand either Palo Alto or Reid-Hillview beyond their current boundaries and the area surrounding both airports is already at its ultimate state of development, this issue will not be a factor in the selection of a role for each airport. However, the Master Plan will consider the potential acquisition of property to ensure adequate safety zones. Meeting the Needs of the Aviation Community. Considering the needs of the aviation community with respect to basing capacity and airport operational issues (including availability of on-airport services) is an integral part of the master planning process. This element of the master planning process is concerned primarily with meeting the forecasted need for basing capacity. The needs of the aviation community with respect to specific services offered at the airports (whether by the County or the FBOs) are the subject of future phases of the Master Plan. South County Airport Master Plan (July 2006) 2-13
34 CHAPTER 2 AIRPORT ROLES AND FORECASTS RANGE OF ALTERNATIVES The South County hangar project currently under design could in itself satisfy almost one-third of the forecasted growth in demand for based aircraft storage by providing about 100 of the 324 additional spaces needed to meet the 2022 forecasted demand of 1,781 spaces. Upon project completion, only 224 additional spaces would be required over the next 20 years to meet the forecasted demand. The extent to which the basing capacity is increased at each airport or not increased, as the case may be is a policy decision of the Board of Supervisors. Fortunately, a wide range of alternatives is available to the Board. Three broad approaches are discussed below: 1. Develop each airport based on its own demand. This approach focuses on developing each individual airport based on the demand for basing capacity at that particular airport. Although the total forecasted growth in demand for based aircraft storage at the three County airports is 324, it is reasonable to assume that, absent constraints on basing capacity, demand for spaces at each individual airport would approximate the existing distribution of aircraft. However, we know that Palo Alto s basing capacity could be expanded by a maximum of 60 aircraft. Therefore, the forecasted growth in demand cannot occur with the same distribution pattern that currently exists, and the basing capacity of Reid-Hillview and South County combined would need to increase by 264 to meet the forecasted demand (60+264=324). If we assume that aircraft owners unable to base their aircraft at Palo Alto would look first to Reid-Hillview as an alternative home base and then to South County, we could expect the Year 2022 distribution of based aircraft shown in the following table: Table 2A: Alternative 1 Develop Each Airport Based on Its Own Demand Airport Existing Basing Capacity Change in Basing Capacity Year 2022 Number of Based Aircraft Year 2022 Distribution of Based Aircraft Palo Alto % Reid-Hillview % South County % Totals % 2-14 South County Airport Master Plan (July 2006)
35 AIRPORT ROLES AND FORECASTS CHAPTER 2 2. Designate South County Airport to accommodate all of the forecasted growth in demand. This approach attempts to direct the anticipated increase in demand for basing capacity to South County. South County could both accommodate the entire forecasted increase in demand plus expand its role with respect to the type and size of aircraft it could accommodate entirely within its existing boundaries. If the airport boundary is expanded through the acquisition of adjacent property, basing capacity and on-airport facilities and services could expand even further. The following table illustrates the Year 2022 distribution of based aircraft resulting from this alternative: Table 2B ALTERNATIVE 2: Designate South County Airport to Accommodate All Forecasts Growth In Demand Year 2022 Year 2022 Existing Change in Number of Distribution Airport Basing Basing Based of Based Capacity Capacity Aircraft Aircraft Palo Alto % Reid-Hillview % South County % Totals % 3. Develop policies that combine elements of Alternatives 1 and 2. Alternatives that combine elements of the two approaches are possible as well. For example, even if South County is selected to accommodate the majority of growth in demand for basing capacity, building additional hangars at Palo Alto should be considered, for example, to make that airport financially self-sufficient. The following table illustrates one example of the Year 2022 distribution of based aircraft that could result from this alternative: Table 2C ALTERNATIVE 3: Develop Policies that Combine Elements of Alternatives 1 and 2 Year 2022 Existing Change in Year 2022 Number of Airport Basing Basing Distribution of Based Capacity Capacity Based Aircraft Aircraft Palo Alto % Reid-Hillview % South County % Totals % South County Airport Master Plan (July 2006) 2-15
36 CHAPTER 2 AIRPORT ROLES AND FORECASTS In all three scenarios our approach up to this point has been focused on how to meet future demand for additional aircraft storage, but it is important to avoid exceeding demand as well. The marketplace attempts to reach equilibrium between supply and demand and we know that other airports on the periphery of Santa Clara County are planning construction of hangars in the near term: San Carlos Airport expects to build 40 units in the next two years and an additional 80 units within 5 years Hayward Executive Airport plans to construct 43 T-hangars within the next two years and is seeking developers for 20 box hangars Hollister Airport has just completed construction of 28 T- hangars and expects to construct additional T-hangars and 6-8 box hangars within 5 years In the short term, these adjacent airports can expect to receive some of the aircraft whose owners would prefer to locate in Santa Clara County but cannot because space is not available. In the long term, some redistribution could be expected to take place. BOARD OF SUPERVISORS DIRECTION At its meeting on November 19, 2002, the Santa Clara County Board of Supervisors adopted Alternative 3 to guide development of airport master plans for the three county-operated airports. The Board believes that this alternative would best meet the following overall objectives, which conform to the Guiding Principles: Achieve greater parity in the distribution of based aircraft to preclude disproportionate quality of life impacts at any one airport; Meet the needs of the aviation community by accommodating all of the forecasted growth in demand for basing capacity; Ensure the Airport Enterprise Fund remains self-sustaining without subsidy from the County General Fund South County Airport Master Plan (July 2006)
37 AIRPORT ROLES AND FORECASTS CHAPTER 2 Airport Table 2D Countywide Based Aircraft Forecast Existing Basing Capacity Previous Master Plan Basing Capacity Change in Basing Capacity* Year 2022 Number of Based Aircraft* Year 2022 Distribution of Based Aircraft Palo Alto % Reid-Hillview % South County % San Jose Int l % Totals % * The Airport Master Plan forecasts for San Jose International Airport adopted by the City of San Jose do not extend to The forecasted change in basing capacity and based aircraft were developed by Santa Clara County as part of this master plan process and reflect current trends at San Jose International Airport. The above table is based on the demand forecast of 1,960 aircraft by the Year 2022 and will require adjustment if the demand forecast changes. Staff recommends re-forecasting demand every five years. Comparisons with Individual Airport TAF Forecasts While the TAF total for Santa Clara County differs by only 5.7% from the master plan forecast, the assumed allocation among airports does differ more significantly. The 2020 TAF forecast for Palo Alto shows a growth of 64 based aircraft. These master plan forecasts anticipate an increase of 89 based aircraft. The 2020 TAF forecast for Reid-Hillview shows a growth of 242 based aircraft. These master plan forecasts anticipate an increase of 63 based aircraft. The 2020 TAF forecast for South County shows no change in based aircraft. These master plan forecasts anticipate an increase of 328 based aircraft. The 2020 TAF forecast for San Jose International shows no change in based aircraft. These master plan forecasts anticipate a decrease of 100 based aircraft. South County Airport Master Plan (July 2006) 2-17
38 CHAPTER 2 AIRPORT ROLES AND FORECASTS Forecasted Annual Operations at Recommended Basing Capacity An airport s impact on the surrounding community is proportional to the number of annual operations, which is a function of the number of based aircraft. Since the purpose of this phase of the master planning process is to determine the role and therefore the basing capacity of each airport, it is important to know how a change in based aircraft would affect the number of annual flight operations. This section forecasts the number of annual flight operations that would occur if the airports were at their recommended basing capacity. Forecasts of annual aircraft operations at the recommended basing capacity have been developed by multiplying the recommended number of based aircraft by a ratio of annual operations per based aircraft. Unique ratios were developed for each airport based upon historical data. This ratio reflects the many factors that shape the volume of operations at an airport: The amount of training activity The volume of transient aircraft Congestion Weather cycles Availability and quality of instrument approach procedures The number and quality of aviation businesses Proximity to pilots residences Two general principles affect the operations per based aircraft ratios: As the number of based aircraft increases, the average number of operations per based aircraft will decline due to congestion, especially as activity levels approach the operational capacity of the runway(s). Flight training generates more operations per based aircraft than recreational or business flying. In the previous discussion regarding hypothetical maximum basing capacity, we assumed that all developable property at RHV and PAO would be used for aircraft storage (i.e., none of the property would be made available for aviation businesses, including new flight schools). Therefore, each additional based aircraft would generate on average fewer annual operations than the existing mix of based aircraft, which includes aircraft used primarily for flight training. Therefore, we may conclude that the number of annual 2-18 South County Airport Master Plan (July 2006)
39 AIRPORT ROLES AND FORECASTS CHAPTER 2 flight operations would not change in the same proportion as the increase in the number of based aircraft. Reid-Hillview There are currently about 342 annual operations per based aircraft at Reid-Hillview Airport with 687-based aircraft. The following table summarizes the forecasted annual operations per based aircraft and total annual operations for the existing level of based aircraft, the current basing capacity, and the 2022 recommended basing capacity. Table 2E Forecasted Operations for Reid-Hillview Airport Scenario Based Aircraft Annual Operations per Based Aircraft Total Annual Operations Existing Based Aircraft ,213 Existing Capacity ,882 Recommended Capacity ,986 The 2020 TAF operations forecast for Reid-Hillview is 290,061. If the forecast trend was extended to 2022 the total would be 298,406. Therefore, the maser plan forecast is over 50,000 lower than the trend implicit in the TAF forecast. Palo Alto There are currently about 400 annual operations per based aircraft at Palo Alto Airport with 524-based aircraft. The following table summarizes the forecasted annual operations per based aircraft and total annual operations for the existing level of based aircraft, the current basing capacity, and the 2022 recommended basing capacity. Table 2F Forecasted Operations for Palo Alto Airport Scenario Based Aircraft Annual Operations per Based Aircraft Total Annual Operations Existing Based Aircraft ,709 Existing Capacity ,509 Recommended Capacity ,509 South County Airport Master Plan (July 2006) 2-19
40 CHAPTER 2 AIRPORT ROLES AND FORECASTS The 2020 TAF operations forecast for Palo Alto is 243,862. If the forecast trend was extended to 2022 the total would be 247,495. Therefore, the maser plan forecasts are about 20,000 lower than the trend implicit in the TAF forecast. South County There are currently about 630 annual operations per based aircraft at South County Airport with 90-based aircraft. The very high number of annual operations per based aircraft reflects the low number of based aircraft relative to the high volume of training activity much of it generated by aircraft based at other airports. The following table summarizes the forecasted annual operations per based aircraft and total annual operations for the existing level of based aircraft, the current basing capacity, and the 2022 recommended basing capacity: Table 2G Forecast Operations for South County Airport Scenario Based Aircraft Annual Operations per Based Aircraft Total Annual Operations Existing Based Aircraft ,708 Existing Capacity ,000 Recommended Capacity ,560 The TAF for South County Airport forecasts no growth in operations from its current estimate of 55,000 annual operations. The master plan forecasts are higher by 120,000 annual operations. SUMMARY OF FORECASTS Table 2H presents a summary of the 20-year forecasts presented earlier in this chapter. It also contains forecasts of intermediate years. A brief description of the factors that shaped the forecast for each airport is presented. Reid-Hillview Airport This airport s location in a dense suburban residential area makes significant increases in based aircraft and operations inappropriate. No new acreage will be allocated to fixed base operators, so increases in training activities are not anticipated. A limited number 2-20 South County Airport Master Plan (July 2006)
41 AIRPORT ROLES AND FORECASTS CHAPTER 2 of new hangars will increase the level of activity slightly during the 20-year planning period. Palo Alto Airport This airport is constrained by the levees that protect the facility from San Francisco Bay. There is limited ability to accommodate additional aircraft. The small growth in activity will come from the creation of hangars or an additional fixed base operator on the remaining unutilized land. South County Airport The current hangar project will add about 100 based aircraft. These hangars are expected to be occupied in Continued growth in based aircraft is expected to occur as additional hangars become available; demand is very high. The addition of one or more fixed base operators will become more likely following extension of the runway. The anticipated addition of high-end golf courses and estate homes in the area is expected to generate increase use by turboprops and small jets. Over the long term, development of commercial and industrial uses in the San Jose- Gilroy corridor will also boost activity levels. Table 2H Based Aircraft Master Plan Activity Forecasts Current Year Year Year 2022 Reid-Hillview Airport Palo Alto Airport South County Airport Total 1,301 1,445 1,605 1,781 Annual Aircraft Operations Reid-Hillview Airport 235, , , ,986 Palo Alto Airport 209, , , ,509 South County Airport 56,000 95, , ,560 Source: Mead & Hunt, January 2005 South County Airport Master Plan (July 2006) 2-21
42 Chapter 3 Airfield Design South County Airport Master Plan
43 3 Airfield Design OVERVIEW The Facilities Plan, Figure 3D, presents the recommended airfield improvements. The principal airfield design issues examined in this chapter are the optimal length and alignment of the airport s single runway. Although the airport s role has been established a general aviation airport the airport s classification remains to be determined. Selection of the classification will determine the appropriate runway length, as well as optimal taxiway locations and other airfield design elements. BASIC DESIGN FACTORS The Federal Aviation Administration (FAA) provides guidance for airport design through a series of Advisory Circulars. These guidelines promote airport improvements that enhance airport safety and operational utility for the types of aircraft currently using or anticipated to use the airport on a regular basis. Major considerations include: Airport Role Airport Classification Meteorological Conditions and Prevailing Winds Airport Role South County Airport currently functions as a general aviation airport serving a variety of aeronautical purposes, including: South County Airport Master Plan Report (July 2006) 3-1
44 CHAPTER 3 AIRFIELD DESIGN recreation, flight training, and business. The mix of airplanes using the airfield range from single-engine piston aircraft to twin-engine turboprops and business jets. Its role as a general aviation airport is not proposed to be changed. Airline service is not proposed to be accommodated, nor are any military facilities anticipated to be established at the airport. AIRCRAFT APPROACH CATEGORY Category A: aircraft approach speed less than 91 knots. Category B: speed 91 knots or more but less than 121 knots. Category C: speed 121 knots or more but less than 141 knots. Category D: speed 141 knots or more but less than 166 knots. Category E: speed 166 knots or more. AIRPLANE DESIGN GROUP Group I: wingspan up to but not including 49 feet. Group II: 49 feet up to but not including 79 feet. Group III: 79 feet up to but not including 118 feet. Group IV: 118 feet up to but not including 171 feet Group V: 171 feet up to but not including 214 feet. Group VI: wingspan greater than 214 feet. Airport Classification To be useful for facility planning purposes, the broadly characterized airport role must be more precisely defined. The Federal Aviation Administration has established a set of airport classifications known as Airport Reference Codes (ARC) applicable to each airport and its individual runway and taxiway components. The primary determinants of these classifications are the operational and physical characteristics of the most demanding types of airplanes intended to use the runway and taxiway system (i.e. the design aircraft ) and the instrument approach minimums applicable to a particular runway end. Each Airport Reference Code consists of two components relating to an airport s design aircraft: Aircraft Approach Category Depicted by a letter (A-E), this component relates to aircraft approach speed, an operational characteristic that provides an indication of runway length requirements. Airplane Design Group Depicted by a Roman numeral (I-VI), this component relates to airplane wingspan, a physical characteristic that provides an indication of setback requirements (i.e. separation criteria for structures, taxiways, taxilanes etc.) In Approach Categories A and B, FAA standards distinguish between small aircraft (12,500 lbs. or less) and large aircraft (over 12,500 pounds). Above Category C, all aircraft are assumed to be large. Generally, Aircraft Approach Category applies to criteria for runways and runway related facilities. Airplane Design Group primarily relates to separation criteria involving taxiways and taxilanes. Design Aircraft In this context, the FAA defines regularly as more than 500 operations per year. For airfield planning purposes, the operational and physical characteristics of the most demanding airplane intended to regularly operate at the airport is considered the critical design aircraft. The design criteria for the length, width, and strength of 3-2 South County Airport Master Plan Report (July 2006)
45 AIRFIELD DESIGN CHAPTER 3 the runways and taxiways are tied directly to the speed, wingspan, and weight of the design aircraft, respectively. In its current capacity, the airport is capable of serving most small general aviation aircraft. The majority of aircraft that operate at South County Airport are single-engine and light, twin-engine propeller-driven airplanes (e.g., Cessna Skyhawk and Beech Baron). The airport also sees limited use by turbo-props (e.g., Cessna 441 Conquest) and smaller business jet aircraft (e.g., Cessna Citation I) that operate at the airport on a transient basis. There is a range of alternative critical aircraft that would fit within the general role defined for South County Airport. The choice of critical aircraft will affect the recommended runway length and other airfield design elements. Four alternative critical aircraft have been identified that represent the range of physcially possible alternatives: 1. Beech Baron 2. Beech King Air B Cessna Citation Encore 4. Hawker 800XP Airport Classification/Design Standards A basic airfield design requirement which must be assessed is the capability of the facilities to safely accommodate the types of aircraft which seek to operate at the airport. Runway length is a key component of this assessment, but other facility dimensions such as pavement widths and the lateral clearances from the runway to adjacent taxiways and structures also are important. FAA design standards for these features are set in accordance with the Airport Reference Code (ARC) applicable to the airport as a whole or, in many cases, to individual runways or taxiways. The primary determinants of ARC classifications are: The approach speed, wingspan, and weight of the most demanding types of aircraft a runway or taxiway is intended to serve; and The existing or planned runway approach type and visibility minimums. Ideally, an airport s runway/taxiway system can be designed to conform to the standards associated with these two ARC determinants. Often, though, the ARC which may be appropriate South County Airport Master Plan Report (July 2006) 3-3


. However, some of the aircraft which occasionally operate at the airport slightly exceed these criteria.")
46 CHAPTER 3 AIRFIELD DESIGN with respect to airport usage is not consistent with the ARC which fits the existing airfield dimensions. Additionally, the opportunities to upgrade the facilities to conform to current and future operational needs may be limited by the development constraints of the site. Beech Baron Beech King Air B200 By usage and design, the current airport reference code for South County Airport falls into the B-I (small aircraft) classification for runways having approach visibility minimums of ¾ mile or more. This classification is intended to accommodate aircraft having approach speeds of less than 121 knots (Approach Category B), wingspans less than 49 feet (Design Group I), and maximum takeoff weights of 12,500 pounds or less (small airplanes). However, some of the aircraft which occasionally operate at the airport slightly exceed these criteria. The Cessna 441 Conquest, for example, has a wingspan of 49.3 feet and fits within the Design Group II specifications. Additionally, the airport s runway width of 75-feet falls under the B-II category. Despite these minor variances, if the role of the airport remains unchanged, the overall character of the airport s usage would remain within the ARC B-I (small) category. Four alternative design aircraft were identified previously in the chapter. Although there is considerable overlap in the airfield design requirements of these aircraft, each represents a distinct package of requirements. The airport reference code and descriptive name for each alternative is as follows: 1. Beech Baron: ARC B-I (small) No Change 2. Beech King Air B200: ARC B-I (small) All Small Aircraft 3. Cessna Citation Encore: ARC B-II Basic Accommodation of Business Jets 4. Hawker 800XP: ARC C-II Enhanced Accommodation of Business Jets Cessna Citation Encore All of these aircraft are in production. A brief description of each follows. Beech Baron: A twin-engine piston aircraft with six seats (including one for the pilot). It has a gross weight of 5,500 pounds and a 37.8 foot wingspan. Hawker 800XP Beech King Air B200: A twin-engine turboprop with a gross weight of 12,500 pounds. Depending upon seating configuration can accommodate between 8 and 16 seats (including one for the pilot). It has a wingspan of 54.5 feet. 3-4 South County Airport Master Plan Report (July 2006)
47 AIRFIELD DESIGN CHAPTER 3 Cessna Citation Encore: A twin-engine jet aircraft with a gross weight of 16,630 pounds. Depending upon the seating configuration will have between 7 and 11 seats (including crew). This aircraft has a wingspan of 54.1 feet. It is a small-cabin jet typically not used for transcontinental flights. Hawker 800XP: A midsize corporate jet aircraft with a gross weight of 28,000 pounds. Typical seating configuration for corporate layout is 8 passengers with a flightcrew of two. The maximum seating configuration for this aircraft is 16 (including crew). This aircraft has a wingspan of 51.8 feet. Hawker 800XP is an aircraft commonly used for fractional ownership. Fractional ownership: A growing aircraft ownership arrangement in which one purchases a share of an aircraft. Much like a time-share, this purchase gives one access to an aircraft at a specified rate. Table 3A summarizes the FAA design standards associated with several ARC classifications potentially applicable to South County Airport. The significance of these standards with respect to individual components of the airfield design is discussed in subsequent sections of this chapter. RUNWAY LENGTH REQUIREMENTS Design temperature: the average high temperature for the hottest month. Runway length is a fundamental airfield design factor. Runway length requirements for specific aircraft are dependent upon airfield elevation and temperature because these variables have a direct effect on aircraft performance. The lower the elevation and temperature, the better the aircraft performance, which translates into shorter runway requirements. The length of the runway is determined by considering either the family of airplanes having similar performance characteristics or a specific airplane needing the longest runway. In either case, the choice is based upon airplanes that are forecast to use the runway on a regular basis. The FAA s computer program derived from Advisory Circular 150/5325-4A, Runway Length Requirements for Airport Design, was utilized to aid in defining the appropriate future runway length at South County Airport. This program calculates runway length for various classes of aircraft using several inputs: airport elevation, mean maximum temperature, and other factors. Runway lengths are categorized by the percentage of the aircraft fleet that can utilize the runway at a given percentage of their maximum load. An aircraft s load includes passengers and their baggage, cargo, and fuel. The results are presented in Table 3B. South County Airport Master Plan Report (July 2006) 3-5
48 CHAPTER 3 AIRFIELD DESIGN Item FAA Airport Design Standards 1 Airport Reference Code B-I (small) B-II C-II Aircraft Approach Speed <121 kts <121 kts <141 kts Aircraft Wingspan <49 ft. <79 ft. < 79 ft. Aircraft Weight Group (lbs) 12,500 >12,500 >12,500 Approach Visibility Minimums Visual or ¾ mile Visual or ¾ mile Visual or ¾ mile Runway Design Width 60 ft. 75 ft. 100 ft. Blast Pad Width 80 ft. 95 ft. 120 ft. Length beyond Runway End 60 ft. 150 ft. 150 ft. Safety Area Width 120 ft. 150 ft. 500 ft. Length beyond Runway End 240 ft. 300 ft. 1,000 ft. Obstacle Free Zone 2 Shape 3 A A A Width (W) 250 ft. 400 ft. 400 ft. Vertical Height (H) 4, 5 NA NA NA Slope (S) 6 NA NA NA Object Free Area Width 250 ft. 500 ft. 800 ft. Length beyond Runway End 240 ft. 300 ft. 1,000 ft. Gradient (maximum) 2.0% 2.0% 1.5% Runway Setbacks From Runway Centerline to: Parallel Runway Centerline ft. 700 ft. 700 ft. Hold Line 125 ft. 200 ft. 250 ft. Parallel Taxiway 150 ft. 240 ft. 300 ft. Aircraft Parking Line 125 ft. 250 ft. 400 ft. Building Restriction Line ft. 495 ft. 495 ft. Helipad for: Small Helicopters ( 6,000 lbs.) 300 ft. 500 ft. 500 ft. Medium Helicopters ( 12,000 lbs.) 500 ft. 500 ft. 500 ft. Heavy Helicopters (>12,000 lbs.) 700 ft. 700 ft. 700 ft. Taxiway Design Width 25 ft. 35 ft. 35 ft. Safety Area Width 49 ft. 79 ft. 79 ft. Taxiway and Taxilane Setbacks From Taxiway Centerline to: Parallel Taxiway/Taxilane 8 69 ft. 105 ft. 105 ft. Fixed or Movable Object 45 ft. 66 ft. 66 ft. From Taxilane Centerline to: Fixed or Movable Object 40 ft. 58 ft. 58 ft. Runway Protection Zone Width at Inner End 250 ft ft ft. 10 Width at Outer End 450 ft. 700 ft. 1,010 ft. Length 1,000 ft. 1,000 ft. 1,700 ft. Table 3A Airport Design Standards South County Airport 3-6 South County Airport Master Plan (July 2006)
49 AIRFIELD DESIGN CHAPTER 3 Notes to Table 3A: 1 Source: FAA Advisory Circular 150/ , Change 7, Airport Design (October 2002). 2 Obstacle Free Zone normally extends 200 feet beyond end of runway; additional length required for runways with approach lighting systems. 3 Runway Obstacle Free Zone cross-section shapes: 4 Height increases 3 feet per 1,000 feet of airport elevation. 5 Indicated dimensions for runways with approach visibility minimums <¾ mile are for Category I instrument runways. Criteria for Category II and Category III runways are more restrictive. 6 Maximum of 0.8% in first and last quarters of runway. 7 Indicated runway separation is for planning purposes. FAA air traffic control criteria permit simultaneous operations by light, single-engine propeller airplanes with runways as close as 300 feet apart and by twin-engine propeller airplanes with runway separation of 500 feet. (FAA Order ). 8 The FAA no longer has fixed-distance standards for the Building Restriction Line location. The indicated setback distances are based on providing 7:1 transitional slope clearance over a 35-foot building situated at the same base elevation as the adjacent runway and can be adjusted in accordance with local conditions. 9 Assumes same size airplane uses both taxiway and adjacent taxiway/taxilane. Distance can be reduced if secondary taxiway/taxilane is limited to use only by smaller airplanes. 10 For runways with approach visibility minimums of ¾ mile or more, but less than 1 mile, runway protection zone dimensions are 1,000 feet width at inner end, 1,510 feet width at outer end, and a length of 1,700 feet. Table 3A, continued South County Airport Master Plan (July 2006) 3-7
50 CHAPTER 3 AIRFIELD DESIGN Table 3 B Runway Length Requirements for South County Airport Airport Elevation Mean daily maximum temperature of the hottest month Maximum difference in runway centerline elevation Wet and slippery runways SMALL AIRPLANE WITH LESS THAN 10 PASSENGER SEATS: 75 percent of these small airplanes 95 percent of these small airplanes 100 percent of these small airplanes 284 feet 88 F (July) 20 feet 2,570 feet 3,120 feet 3,720 feet LARGE AIRPLANES OF 60,000 POUNDS OR LESS: 75 percent of these large aircraft with 60 percent useful load 5,380 feet 75 percent of these large aircraft with 90 percent useful load 7,000 feet 100 percent of these large aircraft with 60 percent useful load 5,600 feet 100 percent of these large aircraft with 90 percent useful load 8,430 feet Source: Advisory Circular 150/5325-4A, Runway Length Requirements for Airport Design Runway Length Alternatives The above tabulation shows the various runway lengths required by South County Airport s 284-foot elevation and 88 F design temperature for various classes of aircraft. One may deduce from the table that runway length requirements are on a continuum determined by size of aircraft, percentage of a particular size aircraft to be accommodated and, for large aircraft, the percent maximum useful load that may be carried. This data was used to develop the following four distinct runway length alternatives: Alternative 1 No Change Drawings of each alternative are presented in Figure 3A. Currently, South County Airport s single runway (Runway 14-32) is 3,100 feet long. In this alternative the existing runway length would be retained. The Beech Baron would remain the design aircraft and the runway is designed to meet ARC B-I (small) criteria. This length is sufficient to accommodate nearly 95 percent of all small aircraft. Under almost all conditions this length is adequate for use by single-engine and light, twin-engine piston aircraft; and very limited use by light turbo-prop and the smallest business jet aircraft. Alternative 2 All Small Aircraft With minimal facility upgrades, the airport could serve 100 percent of all small general aviation aircraft. Essentially all of these airplanes have less than 10 passenger seats and fall within the ARC B-I (small) criteria. The design aircraft would be the Beech King Air B200. For the airport to fully accommodate all of these 3-8 South County Airport Master Plan Report (July 2006)
51 Alternative 1 - No Change 1. Runway Length = 3,100 Feet 2. ARC B-I (small) 500' X:\ \02003\TECH\Cadd\SCA\DWG\SCA-rwy length-alts.dwg Jul 20, :05am Alternative 2 - All Small Aircraft 1. Runway Length = 3,700 Feet 2. ARC B-I (small) 0 FEET 1" = 500' 1,000' Figure 3A Runway Length Alternatives South County Airport
52 Alternative 3- Basic Accommodation of Business Jets 1. Runway Length = 5,000 Feet 2. ARC B-II 500' X:\ \02003\TECH\Cadd\SCA\DWG\SCA-rwy length-alts.dwg Jul 20, :41am Alternative 4 - Enhanced Accommodation of Business Jets 1. Runway Length = 4,700 Feet 2. ARC C-II 0 FEET 1" = 500' 1,000' Figure 3A (continued) Runway Length Alternatives South County Airport
53 Alternative 1 - Retain Existing Alignment 1. Runway Length = 4,955 Feet 2. ARC B-II Alternative 2 - Realign Runway 160 Feet 1. Runway Length = 5,141 Feet 2. ARC B-II X:\ \02003\TECH\Cadd\SCA\DWG\SCA-runway-align-alts.dwg Jul 20, :50am Alternative 3 - Realign Runway 260 Feet 1. Runway Length = 5,129 Feet 2. ARC B-II LEGEND Future Pavement Building to be Removed Figure 3B Runway Alignment Alternatives South County Airport
54 AIRFIELD DESIGN CHAPTER 3 airplanes, a runway length of 3,700 feet would be needed. This would require lengthening the runway 600 feet. Alternative 3 Basic Accommodation of Business Jets Alternative 3 designs the runway to meet ARC B-II criteria. The design aircraft would be the Cessna Citation Encore. In order to accommodate regular use by business jets, the runway would need to be extended 1,900 feet to achieve a length of 5,000 feet. This length is slightly less than required to accommodate 75 percent of large aircraft weighing less than 60,000 pounds with 60 percent useful load. However, at airports near sea level, a length of 5,000 feet is typically the minimum length required to accommodate small and medium business jets. Many business jets will be significantly constrained by this runway length during warm weather. The runway pavement would require strengthening to accommodate the heavier aircraft loads. A pavement strength of 35,000 pounds for dual wheel aircraft would be appropriate for this length. Alternative 4 Enhanced accommodation of business jets Although South County Airport is the least constrained facility of the three County-operated airports, some site constraints do exist. Public roads located beyond each end of the runway limit the configuration of the airfield. This alternative assumes that the roads are fixed constraints. See Table 3A for a comparison of FAA standards for ARC B-II and C-II.. In this alternative, the runway is designed to accommodate ARC C-II aircraft (e.g., Hawker 800XP). The intent of this alternative is to extend the airport s runway length to accommodate faster (e.g., Category C) jets. However, in order to accommodate this class of aircraft, the runway safety area requirements and required clear areas become larger. Under this scenario, the maximum feasible length attainable for South County Airport s single runway is about 4,700 feet. This length would consequently preclude most of the higher performance aircraft the types of aircraft which this alternative is intended to accommodate from operating at the airport. This conflict indicates that the airport s runway can not be designed to meet ARC C-II criteria. Declared Distances Runways are normally fully usable in both directions. Furthermore, they normally have clear approaches to each runway South County Airport Master Plan Report (July 2006) 3-9
55 CHAPTER 3 AIRFIELD DESIGN end. The declared distances concept can come into play on runways where providing a conventional configuration is impractical for cost or other reasons. Declared distances allow portions of the runway to be counted for certain aircraft operational requirements, but not included for others. For example, an obstruction might limit the landing distance available in one direction, but not restrict takeoffs in the same direction. The resulting operational lengths must be shown on the airport layout plan and approved by the FAA. Using declared distances to provide the longest feasible runway for South County Airport was investigated. A runway length of over 6,000 feet is possible using declared distance. However, the FAA strongly discourages the use of declared distances on new runways. Typically, declared distances are used to address operational limitations of existing facilities. Therefore, declared distances were not utilized in the above runway length alternatives. Evaluating Runway Length Alternatives As stated earlier, the selection of an appropriate runway length alternative (and hence the airport s classification) depends on the family of aircraft forecast to use the runway on a regular basis. Since the existing runway is adequate for nearly 95 percent of all small aircraft, the question becomes whether future demand by larger aircraft is likely. In order to answer this question one must estimate the future level of demand by the corporate segment of general aviation, which entails an examination of the surrounding land uses and the projected level of development in the San Jose Gilroy corridor. The General Plans and relevant Specific Plans adopted by the cities of San Jose, Morgan Hill and Gilroy are a primary source of this information, as well as the Association of Bay Area Governments (ABAG) Household and Job Projections San Jose s General Plan identifies the Coyote Valley as one of the areas having the highest job growth potential. The San Jose City Council s vision and expected outcomes for the Coyote Valley Specific Plan currently under development includes a minimum of 25,000 new households and 50,000 new jobs. The 50,000 jobs are primarily to be industrial/office jobs, not including the additional retail support or public/quasi-public jobs that must also be accommodated in the Plan area. (Source: handout to Coyote Valley Specific Plan Task Force.) Gilroy and Morgan Hill s General Plans clearly state that those cities have large amounts of undeveloped land for residential, 3-10 South County Airport Master Plan Report (July 2006)

56 AIRFIELD DESIGN CHAPTER 3 commercial and industrial uses. In both cities, a significant amount of undeveloped land is designated for industrial/business park use. Gilroy has 440 acres of land set aside for campus industrial use plus another business park parcel of 184 areas, altogether allowing for over 5 million square feet of growth in industrial/office uses. A primary marketing objective for two of the campus/business parks is to bring in high-tech and biotech companies. The City has the potential for some large employers and/or corporate headquarters in these industries to be added in the next 15 to 20 years. (Source: Gilroy Economic Development Corporation) Morgan Hill s General Plan identifies over 700 acres of vacant industrial land. The City seeks a diversity of uses for these industrial acres, including a variety of small businesses. However, four sites adding up to 225 acres have been identified for development of large, distinct business parks that will attract clean, high-tech businesses and have the potential for attracting large employers and/or corporate headquarters. (Source: Morgan Hill General Plan) Given the nature and extent of the development expected in the San Jose Gilroy corridor, it is reasonable to assume that a significant increase in demand by the corporate segment of general aviation will accompany the arrival of the corporate headquarters, jobs and households. These corporate aircraft will require appropriate airport facilities in order to meet the increased demand. Given the existing demand for these types of facilities at San Jose International Airport (SJC), it appears unlikely that SJC would be able to accommodate the future demand discussed here. Alternative 1 (No Change) and Alternative 2 (All Small Aircraft) do not accommodate large aircraft (i.e., those over 12,500 pounds), and would limit or exclude larger turboprops and most business jets from operating at South County Airport. As noted above, there is a paradox inherent in Alternative 4 (Enhanced Accommodation of Business Jets) that makes this alternative infeasible. Hawker 800XP Alternative 3 (Basic Accommodation of Business Jets) could serve the full range of aircraft types with some limitations for large aircraft during warmer weather and is the only one of the four alternatives that preserves the ability to accommodate future demand. Therefore, the Cessna Citation Encore will be used as the critical aircraft, the future runway length will be set at 5,000 feet, and ARC B-II design standards will apply to the runway/taxiway system. South County Airport Master Plan Report (July 2006) 3-11
57 CHAPTER 3 AIRFIELD DESIGN INSTRUMENT APPROACH CAPABILITIES Existing The Global Positioning System (GPS) is a worldwide radio-navigation system formed from a constellation of 24 satellites and their ground stations. While there are many thousands of civil users of GPS world-wide, the system was designed for and is operated by the U. S. military. GPS provides specially coded satellite signals that can be processed in a GPS receiver, enabling the receiver to compute position, velocity and time. South County Airport is presently served by a GPS-based nonprecision instrument approach to Runway 32. The lowest approach minimums for the airport are 1,040 feet above the airport elevation and 1¼ mile visibility. Runway 14 has only a visual approach procedure. Future Obtaining reduced approach minimums is one of the County s most desired facility improvements. Improved minimums would increase the utility of the airport by enabling it to be used during a wider range of weather conditions. Pilots who are instrument rated routinely want airports to have the best possible instrument approach procedures. In the past, the cost of installing on-airport navigational aids necessary for approaches with low visibility and cloud ceiling minimums often precluded establishment of these types of procedures. Airports had to have regular airline service or a high volume of general aviation aircraft operations, as well as the weather conditions under which the added approach capabilities would be beneficial. However, within the last few years, introduction of GPS as an airport navigational aid has begun to offer much lower cost opportunities for establishment of new instrument approach procedures. Now, any airport can theoretically have some type of GPS instrument approach with no need for on-ground facilities. As a practical matter, however, nearby obstructions and the design of the airfield itself often limit the approach minimums that can be obtained. For example, to obtain approach minimums lower than 3/4 mile, the FAA requires application of more stringent criteria with regard to the height and location of trees and other objects near the runway end. Also the FAA design standards indicate that a minimum runway landing length of 4,200 feet would be required for approach minimums of less than ¾ mile to be established. POTENTIAL RUNWAY REALIGNMENT TO IMPROVE INSTRUMENT APPROACH MINIMUMS The airport is constrained by State Highway 101 to the east, associated interchanges on the north and south, and a public road 3-12 South County Airport Master Plan Report (July 2006)
58 AIRFIELD DESIGN CHAPTER 3 to the west. Additionally, the existing building area located in the northwesterly corner of the airport is substantially developed. For airfield planning purposes, these objects are considered fixed constraints. This discussion examines options for realigning the runway to enable the airport to achieve lower approach/visibility minimums. Three runway alignment alternatives were evaluated as part of this planning effort (See Figure 3B). All three alternatives apply ARC B-II design criteria, consistent with the recommended runway length alternative (Alternative 3 Basic Accommodation of Business Jets). Alternative 1 - Retain existing alignment In its present alignment, Runway 32 is served by both a straight-in instrument approach procedure with visibility minimums of 1 ¼ statute mile and instrument night circling procedures. As noted above, Runway 14 is currently a visual runway. Due to the proximity of an on-ramp off the end of Runway 14, the best instrument approach minimums possible would be greater than 1 statute mile, day only. In either case, these instrument procedures merely bring the aircraft to the airport vicinity, from which point they can then, under visual conditions, land on the runway. Alternative 2 - Realign Runway 160 feet to the west In this alternative, the runway would be relocated 160 feet west of the existing runway centerline. This realignment would enable Runway 32 to meet the planning criteria for instrument straight-in night operations. However, operationally, the airport already has this capability. The consequence of relocating the runway is that all of the required lateral clearances also shift. The result is that several of the buildings in the northwest corner of the property do not meet setback requirements. Specifically, one row of hangars and portions of other buildings penetrate the building restriction line. Additionally, shifting the runway/taxiway system to the west would reduce the parallel taxilane separation to 87 feet. The standard is 105 feet. Unless the FAA approved modifications to standards, these structures would need to be removed. Alternative 3 - Realign Runway 260 feet to the west The third option is to relocate the runway 260 feet west from the runway centerline. This would enable a straight-in instrument approach with visibility minimums as low as ¾ statute mile or lower (e.g., precision approach). As in alternative 2, the lateral clearances would also shift accordingly. However, this alternative South County Airport Master Plan Report (July 2006) 3-13
59 CHAPTER 3 AIRFIELD DESIGN is much more devastating to the building area due to more stringent criteria. Consequently, a large portion of the building area would penetrate the building restriction limit line and FAR Part 77 transitional surface. Many of the hangars and other buildings would require obstruction lighting or demolition. Additionally, property acquisition and other facility modifications would be required to make this alternative feasible. Recommended Alignment The benefit gained by realigning the runway/taxiway system, as described in the latter two alternatives, is judged to be modest. Alternative 2 (Realign Runway 160 feet) would provide no enhancement to the airport s existing instrument approach procedures. Realigning the runway 260 feet to the west (Alternative 3) to accommodate a precision approach to the airport would essentially eliminate the entire building area and require numerous facility improvements. Although airspace restrictions and physical constraints surrounding the airport limit the potential for obtaining lower instrument approach minimums, Alternative 1 (Retaining Existing Alignment) is considered the preferred alternative. Additionally, advancements in technology could possibly enable the airport to obtain reduced approach minimums in the future. OTHER AIRFIELD DESIGN ELEMENTS Runway Width Runway is currently 75 feet wide. The FAA standard for a runway accommodating aircraft in the ARC B-II design category is 75 feet. However, two factors taken together suggest that the runway should be upgraded to a width of 100 feet. First, it is expected that the airport will receive use by transient Category C aircraft as the San Jose - Gilroy corridor continues to develop. Second, corporate jets are anticipated to comprise a significant portion of the B-II aircraft using the airport a factor which is not accounted for in the FAA width standard. Jet aircraft are much more susceptible to engine damage from foreign object debris ( FOD ) on or adjacent to the runway than propeller aircraft; a wider runway reduces risk of FOD damage. For these two reasons, this plan proposes increasing the runway width to 100 feet South County Airport Master Plan Report (July 2006)
60 AIRFIELD DESIGN CHAPTER 3 Pavement Strength Runway is designed to accommodate small aircraft (i.e., aircraft weighing less than 12,500 pounds). The pavement strength is 12,500 pounds for aircraft with single-wheel main landing gear. However, the design weight is insufficient to accommodate heavier aircraft, such as those in the ARC B-II category. It is recommended that the pavement strength for the entire length of the runway and all taxiways/taxilanes intended to accommodate the future design aircraft (Cessna Citation Encore) be increased to 35,000 pounds for aircraft with dual wheel configuration. This should be accomplished by the time that the proposed extension is constructed. Runway Lighting, Marking, and Visual Approach Aids Runway is equipped with medium intensity runway lighting (MIRL). This lighting is suitable for the runway s existing and future use. The lighting system will need to be extended as part of the proposed runway extension project. Runway currently has basic markings, which indicates a visual runway. As noted above, the airport currently provides a GPS-based nonprecision instrument approach to Runway 32. Additionally, a nonprecision approach to Runway 14 is anticipated in the future. Although two ends of a runway having different approach categories (e.g., visual vs. nonprecision) can have different markings, it is more common to upgrade the markings to reflect the higher approach category. Therefore, it is recommended that both ends of the runway be remarked with nonprecision markings to reflect existing and future conditions. The approach ends of Runway are equipped with a precision approach path indicator (PAPI-P2L) with an approach slope of 4.0 degrees. As nighttime operations increase at the airport, the addittion of runway end identifier lights (REILs) is proposed. These lights are useful in locating the runway threshold during hours of darkness and periods of low visibility. Runway Safety Areas Runway Safety Area (RSA): A cleared, drained, graded, and preferably stabilized surface, symmetrically located around a runway. Under dry conditions an RSA should be capable of supporting the passage of aircraft without causing major damage to the aircraft. FAA design standards for ARC B-I (small) facilities (with 3/4 mile or greater visibility minimums), such as South County Airport s Runway 14-32, specify that the runway safety area (RSA) be 120 feet wide the full length of the runway and extend 240 feet beyond each end of the runway. The runway at South County Airport currently meets or exceeds this standard. When the proposed South County Airport Master Plan Report (July 2006) 3-15
61 CHAPTER 3 AIRFIELD DESIGN 1,900-foot runway extension is constructed and the airport is upgraded to a ARC B-II facility, the RSA dimensions would increase to 150 feet wide for the full length of the runway and 300 feet beyond the ends of the runway. South County Airport has adequate space to provide full RSA requirements. Object Free Areas Object Free Area: (OFA): A twodimensional surface surrounding runways, taxiways, and taxilanes. OFA clearing standards preclude parked aircraft or other objects, except for objects that need to be located within the OFA for air navigation or aircraft ground maneuvering. The OFA should be under the direct control of the airport operator. Object Free Area (OFA) dimensions for an ARC B-I (small) facility with visibility minimums greater than ¾ mile are 250 feet wide for the full length of the runway and 240 feet beyond each runway end. The existing runway meets this design standard. When the airport becomes an ARC B-II facility, OFA dimensions would increase to 500 feet wide and 300 feet beyond the ends of the runway. There is sufficient space to accommodate these larger OFAs. Obstacle Free Zones Obstacle Free Zone (OFA): The airspace along the runway and extended runway centerline that is required to be clear of all objects, except for frangible visual NAVAIDs that need to be located in the OFZ because of function, In order to provide clearance protection for aircraft landing or taking off fro the runway, and for missed approaches The dimensions of obstacle free zones (OFZs) vary depending upon the size of aircraft served and the visibility minimums of any associated instrument approach. The design aircraft for South County Airport is in ARC B-I (small) and the airport currently has a GPS-based nonprecision approach with minimums greater than 3/4-mile to Runway 32. An OFZ for a runway with these characteristics is 250 feet wide and extends 200 feet beyond each runway end. The single runway at South County Airport currently meets this standard. The planned extension and facility upgrade to ARC B-II would increase the OFZ width to 400 feet. There is adequate space to accommodate these larger OFZs. Runway Protection Zone Runway Protection Zone (RPZ): A trapezoidal area beyond a runway end in which land uses are limited to enhance the protection of people and property on the ground. The runway protection zone (RPZ) for Runway are 250 feet wide at its inner end, 1,000 feet long, and 450 wide at its outer end. About half of the RPZ area for Runway 14 lies on airport property. The balance of the RPZ area falls within the right-of-way of the West San Martin Avenue interchange. About 90% of the RPZ area for Runway 32 is on airport property. The balance encompasses the county s animal shelter. No easements exist. The future RPZ for Runway as an ARC B-II facility will be 500 feet wide at its inner end, 1,000 feet long, and 700 feet at its outer end. About 40% of the RPZ area for Runway 14 is off airport property and encompasses the West San Martin Avenue interchange. Nearly 30% of the RPZ area for Runway 32 is off 3-16 South County Airport Master Plan Report (July 2006)
62 AIRFIELD DESIGN CHAPTER 3 airport property and encompasses the Church Avenue interchange. The County of Santa Clara will need to acquire avigation easements for the portions of the future RPZ areas that extend off airport property. FAR Part 77 Imaginary Surfaces Federal Aviation Regulations (FAR) Part 77, Objects Affecting Navigable Airspace, identifies the airspace necessary to ensure the safe operation of aircraft to, from, and around airports. This airspace is defined for each airport by a series of imaginary surfaces. The dimensions and slopes of these surfaces depend on the configuration and approach categories of each airport s runway system. Generally, most critical among the FAR Part 77 surfaces are the approach surfaces. South County Airport has one published instrument approach to Runway 32 (a GPS-based nonprecision approach). Runway 14 is currently a visual runway. It is anticipated that Runway 14 will also be served by a nonprecision instrument approach in the future. Overpasses and onramps associated with Highway 101 underlie the approach surfaces for both Runway 14 and 32. Portions of these objects penetrate the the future approach surface (34:1 slope) for each runway. However, the runway ends have been set to ensure threshold siting surface clearance (20:1 slope) over these objects. Existing and future lateral clearances of 15 feet over Highway 101 is not provided. Obstruction lighting may be required if lower approach minimums are pursued. Wind Indicators and Segmented Circle There is currently one lighted wind cone on the airport. The wind cone is located at the center of the airport s segmented circle approximately 200 feet from the approach end of Runway 34 and 150 feet west of the runway centerline. A supplemental wind cone should be provided near the end of Runway 32 when the runway is extended. TAXIWAY SYSTEM Existing South County Airport is currently an ARC B-I (small) facility. The runway centerline-to-parallel taxiway centerline dimension recommended by the FAA for an ARC B-I (small) facility is 150 South County Airport Master Plan Report (July 2006) 3-17
63 CHAPTER 3 AIRFIELD DESIGN feet. The taxiway centerline-to-parallel taxiway centerline separation standard is 69 feet. The taxiway width standard is 25 feet. The taxiway system at South County Airport meets or exceeds these standards. Parallel Taxiways The centerline of the full-length parallel taxiway (Taxiway A) serving the west side of Runway is located 275 feet from the runway centerline and is 25 feet wide. Parallel Taxiway F is located 150 feet east of the runway centerline and is 30 feet wide. Taxiway E, the parallel taxiway fronting the building area on the west side of the airfield, is located 213 feet from the centerline of parallel Taxiway A (487 feet from the runway centerline). Exit Taxiways Taxiway A is also an access/exit taxiway for Runway 32. This segment of the taxiway leading up to the holding bay for Runway 32 is 35 feet wide. Exit taxiways (A, B, C, and D) are located about every 1,000 feet to expedite aircraft leaving the runway. Exit Taxiways B and C are 25 feet wide and Taxiway D narrows down from 35 feet near the runway to 25 feet past the parallel taxiway (Taxiway A). Future As discussed in the preceding sections, ARC B-II aircraft (e.g., Cessna Citation Encore) are anticipated to operate at South County Airport within the 20-year planning period. Portions of the existing taxiway system will need to be upgraded to accommodate this class of aircraft. The runway centerline-to-parallel taxiway centerline dimension recommended by the FAA for an ARC B-II facility is 240 feet. The taxiway centerline-to-parallel taxiway centerline separation standard is 69 feet. The separation standard from the taxiway centerline to a fixed or movable object is 65 feet. The taxiway width standard is 35 feet. In general, the taxiway system meets or exceeds most of these standards. However, some upgrades are required to bring the airport into full compliance with FAA design standards for an ARC B-II facility. Parallel Taxiways The full-length parallel taxiway (Taxiway A) serving the west side of Runway exceeds ARC B-II runway-to-taxiway separation 3-18 South County Airport Master Plan Report (July 2006)
64 AIRFIELD DESIGN CHAPTER 3 standard by 35 feet. The existing width of Taxiway A is 10 feet less than the design standard. To minimize construction costs and to deepen the usable building area, it is recommeded that this additional width be provided on the inside portion of the taxiway (on the runway side) for the full length of Taxiway A. Additionaly, Taxiway A will need to be extended as part of the proposed runway extension project. Parallel Taxiway F is located east of the runway. There is no existing need for this parallel taxiway, as there is no building area on the east side of the airfield. Additionally crossing an active runway at a nontowered airport is a safety concern. As the volume of aircraft operations increase and the airport has an air traffic control tower, Taxiway F could potentially be of some benefit. This parallel taxiway could be used to hold and separate aircraft performing flight training operations from transient aircraft and aircraft taxiing to/from the building area. However, at the point that the airport is upgraded to an ARC B-II facility, parallel Taxiway F would no longer meet the runway-to-taxiway separation standard. Therefore, eventural closure, and physical removal, of parallel Taxiway F is recommended. However, there has been recent interest in using a portion of Taxiway F as a runway for ultralights. As ultralights have much slower cruising and landing speeds that standard aircraft, it is desirable to separate their operations. As an interim measure, use of Taxiway F would be acceptable. It would be important to ensure that no support vehicles crossed the runway to access Taxiway F. Over the longer term, if activity levels increase as forecast, Taxway F will need to be closed to all uses. The parallel taxiway fronting the building area on the west side of the airfield (Taxiway E) would not accommodate ARC B-II aircraft in its present alignment. Wingtip clearance from the taxiway centerline to existing buildings, especially those within the FBO leasehold, is insufficient. Therefore, the parallel taxiway must be realigned 105 feet west of the centerline of parallel Taxiway A. Extension of parallel Taxiway E is recommended at the time that the proposed runway extension project is constructed. Exit Taxiways When the proposed runway extension is constructed, it will become appropriate to construct at least two additional exit taxiways. These taxiways will continue to be located about every 1,000 feet. Additionally, all taxiways will need to meet the FAA s taxiway width standard of 35 feet for an ARC B-II facility. South County Airport Master Plan Report (July 2006) 3-19
65 CHAPTER 3 AIRFIELD DESIGN Existing Taxiway: None None Exit Taxiway A Exit Taxiway B Exit Taxiway C Exit Taxiway D Parallel Taxiway E None Parallel Taxiway A Parallel Taxiway F Future Taxiway: Exit Taxiway A (Future End of Runway 32) Exit Taxiway B C D E F W Parallel Taxiway X Y Z Taxiway Designation At the time that the proposed runway extension and the two additional exit taxiways are constructed, renaming the taxiway system would be appropriate. Following the present naming convention, the changes indicated in the adjacent table would apply. Aircraft Parking Limits Aircraft parking limit (APL) lines are established to define where it is appropriate to park aircraft. Depending upon the configuration of an airfield, aircraft parking limit lines are set with respect to a runway or a parallel taxiway. As South County Airport has two full-length parallel taxiways (Taxiway A and E) on the west side of the runway, the APL is established with respect to the outboard parallel taxiway (Taxiway E). The appropriate setback distance from a taxiway centerline to a parked aircraft is based upon the taxiway s object free area (OFA). Similar in concept to the runway OFA, the taxiway OFA defines an area that should be clear of objects that rise above the level of the runway. The size of the taxiway OFA is related to the wingspan of the critical aircraft. The existing APL is set in accordance with FAA design standards for ARC B-I (small) aircraft. However, when the airport is upgraded to an ARC B-II facility, the APL will need to be set 65 feet from the centerline of the realigned parallel taxiway (Future Taxiway X). This setback will provide standard wingtip clearance for the future design aircraft, the Cessna Citation Encore. Creation of this taxiway will require elimination of one row of tiedowns along existing Taxiway E. Building Restriction Line The building restriction line (BRL) defines the limits of development of all on-airport structures, except facilities required by their function to be located near runways and taxiways. Although FAA offers only limited guidance on defining the appropriate location for building restriction lines, most airports use Part 77 surfaces. In the case of South County Airport, both taxiway-to-object separation standards and Part 77 surfaces are considered. As noted above, the future taxiway-to-object separation distance for future Taxiway X is 66 feet. The future BRL is also set at this 3-20 South County Airport Master Plan Report (July 2006)
66 AIRFIELD DESIGN CHAPTER 3 point and provides FAR Part 77 clearance over a structure of up to 28 feet in height. The future APL and BRL are set 441 feet from the the centerline of Runway Hold Lines The FAA requires hold lines on all taxiways intersecting with runways. The hold lines at the access/exit taxiways serving Runway are set 125 feet from the runway centerline, consistent with ARC B-I (small) standards. At an ARC B-II facility, the FAA standard for hold lines is 200 feet. At the time that the runway is extended, the hold lines will need to be relocated the additonal 75 feet. Holding Bays The approach ends of Runway 14 and 32 are adequately served by holding bays (runup aprons). When the runway is extended, a new holding bay will need to be constructed at the future end of Runway 32 and the pavement of the old holding bay will need to be striped to indicate unusable pavement. Additionally, when the airport is upgraded to an ARC B-II facility and the required clear areas increase, the new holding bays at each end of the runway will need to be constructed 200 feet from the centerline of Runway Taxiway Marking and Lighting The full-length taxiways (except for Taxiway F and portions of Taxiway E) and exit taxiways are equipped with medium intensity taxiway lighting (MITL). All taxiways are appropriately marked with centerline stripes and appropriate hold lines. Centerline stripes also exist on taxilanes throughout the building area. Striping of new taxiways should follow FAA standards. New parallel and exit taxiways should have medium intensity edge lights installed. Signing Only a few signs exist at South County Airport. It is recommended that the airport s sign system be upgraded to conform with FAA design standards as specified in Advisory Circular 150/ C, Standards for Airport Sign System. South County Airport Master Plan Report (July 2006) 3-21
67 CHAPTER 3 AIRFIELD DESIGN PROPERTY ACQUISITION Historically airports have not acquired sufficient property to prevent development of incompatible uses in their vicinity. For most airports in the San Francisco Bay Area it is too late to rectify this problem. The cost and level of community disruption is too high. At South County Airport it remains possible to acquire sufficient property to protect approaches to the runway and buffer adjacent areas from the effects of airport operations. Figure 3C presents the parcels (totaling approximately 332 acres) that are candidates for fee simple acquisition on the open market should they become available or through the use of eminent domain. Many of these parcels could be leased back to the owners following acquisition. However, the lease period and conditions should be crafted to ensure compatible uses and prevent conflicts with planned airport uses South County Airport Master Plan Report (July 2006)

68
69 X:\ \02003\TECH\Cadd\SCA\DWG\SCA-facilities2.dwg Jul 20, :00am 600' 0 FEET 200' 0 FEET 1,200' 400' AIRFIELD DESIGN CHAPTER 3 AIRFIELD PAVEMENT OTHER PAVEMENT BUILDINGS LEASE LEGEND EXISTING FUTURE Figure 3D Airport Facilities South County Airport
70 Chapter 4 Building Area Design South County Airport Master Plan
71 ! "#$%&' () *+,%( -. #$!/' +)) #0+ 0' - #$!/'& -
):\" & - 5 $!/#$!/' -!\" 3 -!")
72 () (,+4 ' "" # ""$ % & # & % # ()))) %7))) )):" & - 5 $!/#$!/' -!" 3 -! 2,,7*+,%( ;; +)) #;) ' <) #7) ' 3=!
73 $!/! $!/ () *!55 > 8 - *! *%(? (

74 "(*A$,+4 ()((! " $!/! $!/ +)) $!/ %; #;) ' $!/ " %7 *%(9 -,( - # $ $ #$!/' # '!$!/ $!/ > 6 $!/ $!/ $!/ -
75 $!/5 $!/() $$!/ - 1 +,0 $!/ %+ #+4'5 +,( +4 $%" $!/? %& ' %(% +())) ()6 1 - )
76 (' )% - ;) -- "-.- "- "- 8$!/ -- * (% B 6 # ' ;)))4))) ( % $ $!/ (, $- <2%)72)) 9 - $!/ $!/1 + " - 1 -! " % (, 8 *
77 @ $ -6 / $!/ = B $ 9 ()% " &- - * 5+00; - +
78 $()), $ - - ' - $!/ -,
79 Chapter 5 E16 Business Plan South County Airport Master Plan
80 5 E16 Business Plan INTRODUCTION Just as previous chapters have outlined plans for the airport s physical development, this chapter outlines a plan for the airport s financial development. More specifically, this chapter will: Present an overview and analysis of the Airport Enterprise Fund (AEF) and the airport s finances; Identify the capital projects and local funding required to implement the portions of the Master Plan that are not eligible for FAA funding; and Identify issues relating to various parcels of airport real property. AIRPORT ENTERPRISE FUND OVERVIEW Master Plan Guiding Principles At the beginning of the planning process, the Board adopted principles to guide the development of the Master Plan. These Guiding Principles include the following: The Airport Enterprise Fund should be self-sustaining without subsidy from the General Fund. Revenue from fees and charges, state and federal grants and other sources should be sufficient to fund operating and maintenance costs, capital improvements and an appropriate level of reserves. South County Airport Master Plan (July 2006) 5 1
81 CHAPTER 5 BUSINESS PLAN Since the creation of the Roads & Airports Department, the AEF has generated sufficient operating revenue to fund operating expenses. Capital projects have been funded on a pay-as-you-go basis using primarily federal and state grants, the one notable exception being the South County Airport Hangar Project, which was ineligible for grant funding and was therefore bond-funded. Therefore, the AEF has been self-sustaining financially even prior to the Board s formal adoption of such a principle. Even in the unusual case that occurred in the early 1990s where the County bought out two RHV leaseholders in order to settle litigation brought by the lessees and the General Fund made loans to the AEF to fund the buyouts, the airport generated sufficient revenue from the acquired leasehold assets to pay back the loans with interest. Transient Fees 2% Interest Income 3% Fuel Flowage Fees 4% Property Rental 5% FBO Lease Income 16% Misc Other Income 2% Aircraft Storage 68% Figure 5A: Airport Enterprise Fund Revenue AEF Revenues Total annual AEF revenue is approximately $2.6 million. Figure 5A above presents the AEF revenue categories and shows that 68% of AEF operating revenue is generated from County-owned aircraft storage spaces (i.e. hangars, shelters and tiedowns). Although demand for aircraft storage is projected to remain strong in the foreseeable future, the AEF s reliance on this revenue source makes it vulnerable to downturns in the general aviation market. The next largest revenue component (16%) is lease revenue from the Fixed Base Operators (FBO). The FBO leases specify an annual ground rent of 8.5% of the fee simple value of the leasehold premises (not including improvements) and provide for periodic adjustments pursuant to a reappraisal of the premises. Given the long-term nature of the FBO leases, the revenue from this source 5 2 South County Airport Master Plan (July 2006)
82 BUSINESS PLAN CHAPTER 5 is essentially fixed aside from the occasional minor adjustment to the lease rate. All other revenue categories including property rental, fuel flowage fees, transient aircraft fees and interest income collectively generate only 16% of AEF revenues. Reid Hillview Airport generates approximately 56% of the total AEF revenue - far more than Palo Alto Airport (PAO) and South County Airport (E16), primarily due to the income from the 145 County-owned hangars. Prior to the South County Airport Hangar Project it was the only one of the three airports to have Countyowned hangars. Historically, RHV revenue has exceeded expenditures and the surplus has been used to subsidize operations at PAO and E16. AEF Expenditures Figure 5B below presents the AEF expenditure categories and shows that 45% of AEF expenditures are staffing costs (salaries and benefits). Services and supplies account for 34% of AEF expenditures, while the local funding component of capital projects represents 6% of AEF expenditures. Debt service on bonds issued to fund the South County Airport Hangar project and to retire the General Fund loans mentioned above makes up 11% of AEF expenditures. Debt Service 11% Minor Remodeling & Improvement 4% Capital Projects 6% Services and Supplies 34% Salaries and Employee Benefits 45% Figure 5B. Airport Enterprise Fund Expenditures South County Airport Master Plan (July 2006) 5 3
83 CHAPTER 5 BUSINESS PLAN Retained Earnings Cash flow from revenues and expenditures generally is not uniform and predictable. The AEF Fund Balance (called Retained Earnings since the AEF is an enterprise fund) dampens the effect of the irregular cash flow. The unencumbered portion of the Retained Earnings balance represents the AEF s rainy day fund and is a measure of the AEF s financial health. The projected AEF unencumbered Retained Earnings balance as of the end of FY 2005 is $1,700,000. A level of unencumbered Retained Earnings equal to at least one year s operating expenses is advisable. Upon completion of the South County Airport Hangar Project, the AEF will be in a position to begin increasing the level of Retained Earnings. Long-term Debt The AEF carries $6,115,000 in long-term bond debt (projected as of June 30, 2005) of which $5,576,000 is attributable to the South County Airport Hangar project and $539,000 is attributable to the refinancing of the General Fund loans discussed above. The current long-term debt level is approximately 1.9 times annual revenue and 3.6 times the level of unencumbered Retained Earnings. SOUTH COUNTY AIRPORT REVENUE AND EXPENDITURES Although the AEF captures all airport finances in a single budget unit, the revenue and expenses associated with each of the three airports are tabulated for internal management accounting purposes. Revenue and expenses directly attributable to each airport such as FBO lease revenue, aircraft storage space rental revenue, operations staff salaries, etc. are easily identified. General and administrative expenses not attributable directly to an individual airport (insurance, management staff salaries, etc.) are captured in an expense pool and prorated to each airport based on a weighted formula that uses cost drivers such as the number of based aircraft, number of aircraft operations and number of major facilities. 5 4 South County Airport Master Plan (July 2006)
84 BUSINESS PLAN CHAPTER 5 Transient Fees 0.2% Misc Other Income 0.4% Interest Income 31.7% Aircraft Storage 5.0% Fuel Flowage Fees 5.1% FBO Lease Income 38.7% Property Rental 18.8% Figure 5C: South County Airport Revenue E16 revenue is shown in Figure 5C. Including projected revenue from the South County Airport Hangar Project mentioned above, the airport generates approximately 22% of the total AEF operating revenue. The new hangars and the small number of occupied tiedowns comprise 5% of E16 revenue. Revenue from the new hangars will help enable the airport to become consistently self-sustaining financially, which in turn will increase the portion of the RHV operating surplus available for reinvestment at RHV. Service and Supplies 37% Salaries and Employee Benefits 3% Minor Remodeling & Improvements 3% Debt Service 57% Figure 5D: South County Airport Expenditures Expenditures are shown in Figure 5D. The largest component of E16 expenditures is debt service related to the hangar project. South County Airport Master Plan (July 2006) 5 5
85 CHAPTER 5 BUSINESS PLAN AIRPORT CAPITAL IMPROVEMENT PLAN (ACIP) This section examines both AIP-funded and locally-funded capital improvements identified in the Airfield Design and Building Area Design chapters of the Master Plan. FAA Airport Improvement Program - Funded Capital Projects All projects identified in Chapter 3, Airfield Design (including property acquisition around the airport), as well as airfield-related repair projects are eligible for FAA funding under the Airport Improvement Program (AIP). Currently, AIP-eligible projects approved by the FAA receive 95% federal funding and are also eligible for an additional 2.5% state match, subject to availability of funds. Therefore, the local match required for AIP projects can be as low as 2.5%. However, the federal percentage is subject to change whenever the AIP is periodically reauthorized. Previously, the AIP provided 90% funding and there is the possibility that the program may revert to this funding level when the next reauthorization occurs. A small number of AIP-eligible projects are also contained in Chapter 4, Building Area Design. These projects are primarily related to physical security. Since AIP-eligible projects are identified in Chapters 3 and 4, a discussion of these projects will not be repeated here. Locally - Funded Capital Projects This section discusses the funding requirements for projects that are not eligible for AIP funding and therefore must be funded entirely with local funds. Most of the airport s future utility and building infrastructure falls into this category. The following projects identified in Chapter 4, Building Area Design, will require local funding: 36 additional box hangars Terminal building and parking lot Additional water storage tank Maintenance building Storm water detention basins Waste water treatment plant As a practical matter, the projects will be implemented in phases over the life of the Master Plan in conjunction with the airfield de- 5 6 South County Airport Master Plan (July 2006)
86 BUSINESS PLAN CHAPTER 5 velopment and the increase in the number of based aircraft as development in the San Jose Gilroy corridor generates demand for an airport capable of handling corporate aircraft. Phasing the projects will also help facilitate a pay-as-you-go strategy. Projected net revenue from 36 future hangars and lease revenue from the future second FBO are two sources of potential funding. EXISTING AND FUTURE FBO LEASEHOLDS There is one existing FBO leasehold at E16, resulting in a ratio of based aircraft per FBO slightly lower than other general aviation airports in Northern California with 200 or more based aircraft (see Table 5A). Chapter 4 designated a portion of the airport property for lease to a second FBO as the airport grows. Upon full implementation of the Master Plan, the ratio of FBOs to based aircraft will be 209:1, which is nearly identical to the current ratio. Ratio of FBOs to Based Aircraft at Northern California Airports AIRPORT BASED AIRCRAFT FBOs RATIO OF BASED AIRCRAFT TO FBOs South County Airport* : 207 Charles M. Schulz - Sonoma County Airport : 380 Sacramento Executive Airport : 365 Watsonville Municipal Airport : 331 Livermore Municipal Airport : 302 Gnoss Field Airport [Novato] : 301 Buchanan Field Airport : 296 Palo Alto Airport : 262 San Carlos Airport : 252 Hayward Executive Airport : 222 Reid-Hillview Airport : 76 * Includes 107 based aircraft and 100 (future) new hangar occupants. Table 5A: Ratio of FBO s to Based Aircraft OTHER REAL PROPERTY ISSUES This section discusses issues related to various airport properties. While not a comprehensive analysis, this section does address major issues to be considered with respect to the: Murphy Ave. Property The airport property on the west side of Murphy Avenue is not required to implement the Airfield Design and Building Area Design elements of the Master Plan. The previous 20-year below-market South County Airport Master Plan (July 2006) 5 7
87 CHAPTER 5 BUSINESS PLAN lease to the Lions Club has expired and current FAA regulations require fair market rent for leases of airport real property. Roads & Airports Department staff is currently developing a Request for Proposals for review and approval by the Board of Supervisors to solicit lease proposals for the site. A long term lease should be avoided in order to keep the property available for potential relocation of the County animal shelter as discussed below. County Animal Shelter The County Animal Shelter, operated by the Department of Agriculture and Resource Management, must be relocated eventually to accommodate the planned runway extension. The Murphy Avenue property discussed above should be considered as a potential site to house the shelter when the runway extension project is ultimately implemented. SUMMARY The AEF has been financially self-sustaining since at least the inception of the Roads & Airports Department. Operating revenue has been sufficient to fund operating expenses including the local match required for grant-funded capital projects, which have been implemented on a pay-as-you-go basis. Approximately three-quarters of AEF operating revenue is derived from the rental of County-owned aircraft storage spaces, which makes the AEF vulnerable to fluctuations in the general aviation market. Most other components of AEF revenue such as existing FBO lease revenue and fuel flowage fees present little opportunity for short-term growth. The unencumbered Retained Earnings balance should be increased to the equivalent of one year of operating expenses. South County Airport infrastructure projects should be funded on a pay-as-you-go basis to the extent practicable. All airfieldrelated projects identified in Chapter 3 are eligible for FAA funding. Revenue from the 36 future hangars and lease revenue from the future second FBO are two sources of potential funding for projects ineligible for FAA funding. The Murphy Avenue parcel should be re-leased at current fair market rates to generate revenue for the airport and should be considered as a potential site to house the County animal shelter when the runway extension project is implemented. 5 8 South County Airport Master Plan (July 2006)
88 Appendices South County Airport Master Plan
89 Appendix C Land Use Compatibility COMPATIBILITY PLANNING Compatibility Concerns Ensuring the maximum level of compatibility between an airport and surrounding land uses is essential. The land use compatibility concerns for airports fall into four functional categories. These categories are: Noise: Generally, defined by cumulative noise exposure contours describing noise from aircraft operations near an airport. Overflight: The impacts of routine aircraft flight over a community. Safety: From the perspective of minimizing the risks of aircraft accidents beyond the runway environment. Airspace Protection: Accomplished by limits on the height of structures and other objects in the airport vicinity and restrictions on other uses which potentially pose hazards to flight. For each compatibility category, four features are outlined below: Compatibility Objective: The objective to be sought by establishment and implementation of the compatibility policies; Measurement: The scale on which attainment of the objectives can be measured; Compatibility Strategies: The types of strategies which, when formulated as compatibility policies, can be used to accomplish the objectives; and Basis for Setting Criteria: The factors which should be considered in setting the respective compatibility criteria. Noise Noise is one of the most basic airport land use compatibility concerns. Moreover, at major airline airports, many busy general aviation airports, and most military airfields, noise is usually the most geographically extensive form of airport impact. Compatibility Objective The clear objective of noise compatibility criteria is to minimize the number of people exposed to frequent and/or high levels of airport noise capable of disrupting noise-sensitive activities. Measurement For the purposes of airport land use compatibility planning, noise generated by the operation of aircraft to, from, and around an airport is primarily measured in terms of the cumulative noise levels of all aircraft operations. In California, the cumulative noise level metric established by state regulations, including for airport noise, is the South County Airport Master Plan C-1
90 APPENDIX C LAND USE COMPATIBILITY Community Noise Equivalent Level (CNEL). This metric provides a single measure of the average sound level in decibels (db) to which any point near an airport is exposed. To reflect an assumed greater community sensitivity to nighttime and evening noise, events during these periods are counted as being louder than actually measured. Cumulative noise levels are usually illustrated on airport area maps as contour lines connecting points of equal noise exposure. Mapped noise contours primarily show areas of significant noise exposures ones affected by high concentrations of aircraft takeoffs and landings. Noise contours for the current, and five- and twenty-year forecast activity levels are presented in Appendix D. Compatibility Strategies The basic strategy for achieving noise compatibility in an airport vicinity is to limit development of land uses which are particularly sensitive to noise. The most acceptable land uses are ones which either involve few people (such as most forms of agriculture) or generate significant noise levels themselves (such as other transportation facilities or some industrial uses). Where historical development makes this infeasible (as at South County), noise insulation of the most effective means of reducing noise impacts. Basis for Setting Criteria Compatibility criteria related to cumulative noise levels are wellestablished in federal and state laws and regulations. The basic state and federal criterion sets a CNEL of 65 db as the maximum noise level normally compatible with urban residential land uses. Overflight Experience at many airports has shown that noise-related concerns do not stop at the boundary of the outermost mapped CNEL contour. Many people are sensitive to the frequent presence of aircraft overhead even at noise low levels. These reactions can mostly be expressed in the form of annoyance. At many airports, complaints often come from locations beyond any of the defined noise contours. Areas that underlie common flight patterns are likely places for this to occur. The basis for such complaints may be a desire and expectation that outside noise sources not be intrusive or, in some circumstances, even distinctly audible above background noise levels. While these impacts may be important community concerns, the question of importance here is whether any land use planning actions can or should be taken to mitigate the impacts or otherwise address the concerns. There is typically little that can be done to modify the pattern of air traffic close to the airport; FAA procedures dictate there location. Funding for noise insulation outside of the 65 CNEL contour is commonly not available. Even if it was, the concern would not address annoyance when residents are outdoors These limitations notwithstanding, there are steps which ALUCs can and should take to help minimize overflight impacts. Compatibility Objective In an idealistic sense, the compatibility objective with respect to overflight is the same as for noise: avoid land use development which can lead to annoyance and complaints. However, given the extensive geographic area over which the impacts occur, this objective is unrealistic except in rural areas and relatively close to the airport. A more realistic objective therefore might be to promote conditions under which annoyance will be minimized. Possible strategies in this regard are described below. C-2 South County Airport Master Plan
91 LAND USE COMPATIBILITY APPENDIX C Measurement Determining where to draw boundaries around areas of potentially significant overflight noise exposure is difficult because these locations extend beyond the well-defined CNEL contours. The general locations over which aircraft regularly fly as they approach and depart an airport are thus a better indicator of overflight annoyance concerns. For general aviation airports, such locations include areas beneath the standard airport traffic patterns, the portions of the pattern entry and departure routes flown at normal traffic pattern altitude, and perhaps additional places which experience a high concentration of overflights. Also, at all types of airports, common IFR arrival and departure routes can produce overflight concerns, sometimes many miles from the airport. Compatibility Strategies As noted above, the ideal land use compatibility strategy with respect to overflight annoyance is to avoid development of residential and other noisesensitive uses in the affected locations. To the extent that this approach is not practical, two different (but not mutually exclusive) strategies are apparent. One strategy is to help people with above-average sensitivity to aircraft overflights people who are highly annoyed by overflights to avoid living in locations where frequent overflights occur. This strategy involves making people more aware of an airport s proximity and its current and potential aircraft noise impacts on the community before they move to the area. This can be accomplished through buyer awareness measures such as dedication of avigation or overflight easements, recorded deed notices, and/or real estate disclosure statements. In new residential developments, posting of signs in the real estate sales office and/or at key locations in the subdivision itself can be further means of alerting the initial purchasers about the impacts (signs are of little long-term value, however). A second strategy is to minimize annoyance by reducing the intrusiveness of aircraft noise above normal background noise levels. In this regard, multi-family residences because they tend to have comparatively little outdoor living areas, fewer external walls through which aircraft noise can intrude, and relatively high noise levels of their own are preferable to single-family dwellings. However, there may be limited potential for multifamily residences in the vicinity of South County Airport. Basis for Setting Criteria The basis for setting criteria is primarily the experience and knowledge that airport proprietors and airport land use commissions have about the noise sensitivity of the specific communities involved. This information can come from discussions held during development of an airport master plan, noise complaints, or other interactions with area residents. Safety Compared to noise, safety is in many respects a more difficult concern to address in airport land use compatibility policies. A major reason for this difference is that safety policies address uncertain events which may occur with occasional aircraft operations, whereas noise policies deal with known, more or less predictable events which do occur with every aircraft operation. Because aircraft accidents rarely happen and the time, place, and consequences of their occurrence cannot be predicted, the concept of risk is central to the assessment of safety compatibility. From the standpoint of land use planning, two variables determine the degree of risk posed by potential aircraft accidents: South County Airport Master Plan C-3
92 APPENDIX C LAND USE COMPATIBILITY Accident Frequency: Where and when aircraft accidents occur in the vicinity of an airport; and Accident Consequences: Land uses and land use characteristics which affect the severity of an accident when one occurs. Compatibility Objective The overall objective of safety compatibility criteria is simply to minimize the risks associated with potential aircraft accidents. There are two components to this objective, however: Safety on the Ground: The most fundamental safety compatibility component is to provide for the safety of people and property on the ground in the event of an aircraft accident near an airport. Safety for Aircraft Occupants: The other important component is to enhance the chances of survival of the occupants of an aircraft involved in an accident which takes place beyond the immediate runway environment. Measurement In measuring the degree of safety concerns around an airport, the frequency component of risk assessment is most important: what is the potential for an accident to occur? As mentioned above, there are both where and when variables to the frequency equation: Spatial Element: The spatial element describes where aircraft accidents can be expected to occur. Of all the accidents which occur in the vicinity of airports, what percentages occur in any given location? Time Element: The time element adds a when variable to the assessment of accident frequency. In any given location around a particular airport, what is the chance that an accident will occur in a specified period of time? Compatibility Strategies Safety compatibility strategies focus on the consequences component of risk assessment. Basically, the question is: what land use planning measures can be taken to reduce the severity of an aircraft accident if one occurs in a particular location near an airport? Although there is a significant overlap, specific strategies must consider both components of the safety compatibility objective: protecting people and property on the ground; and enhancing safety for aircraft occupants. In each case, the primary strategy is to limit the intensity of use (the number of people concentrated on the site) in locations most susceptible to an off-airport aircraft accident. This is accomplished by: Density and Intensity Limitations: Establishment of criteria limiting the maximum number of dwellings or people in areas close to the airport is the most direct method of reducing the potential severity of an aircraft accident. Open Land Requirements: Creation of requirements for open land near an airport addresses the objective of enhancing safety for the occupants of an aircraft forced to make an emergency landing away from a runway. Highly Risk-Sensitive Uses: Certain critical types of land uses particularly schools, hospitals, and other uses in which the mobility of occupants is effectively limited should be avoided near the ends of runways regardless of the number of people involved. Aboveground storage of large quantities of highly flammable or hazardous materials also should be avoided near airports. C-4 South County Airport Master Plan
93 LAND USE COMPATIBILITY APPENDIX C Basis for Setting Criteria Setting safety compatibility criteria presents the fundamental question of what is safe. Expressed in another way: what is an acceptable risk? In one respect, it may seem ideal to reduce risks to a minimum by prohibiting most types of land use development from areas near airports. However, there are usually costs associated with such high degrees of restrictiveness. In practice, safety criteria are set on a progressive scale with the greatest restrictions established in locations with the greatest potential for aircraft accidents. Airspace Protection Relatively few aircraft accidents are caused by land use conditions which are hazards to flight. The potential exists, however, and protecting against it is essential to airport land use safety compatibility. Compatibility Objective Because airspace protection is in effect a safety factor, its objective can likewise be thought of in terms of risk. Specifically, the objective is to avoid development of land use conditions which, by posing hazards to flight, can increase the risk of an accident occurring. The particular hazards of concern are: Airspace obstructions; Wildlife hazards, particularly bird strikes; and Land use characteristics which pose other potential hazards to flight by creating visual or electronic interference with air navigation. Measurement The measurement of requirements for airspace protection around an airport is a function of several variables including: the dimensions and layout of the runway system; the type of operating procedures established for the airport; and, indirectly, the performance capabilities of aircraft operated at the airport. Airspace Obstructions: Whether a particular object constitutes an airspace obstruction depends upon the height of the object relative to the runway elevation and its proximity to the airport. The acceptable height of objects near an airport is most commonly determined by application of standards set forth in Part 77 of the Federal Aviation Regulations. These regulations establish a three-dimensional space in the air above an airport. Any object which penetrates this volume of airspace is considered to be an obstruction and may affect the aeronautical use of the airspace. Wildlife and Other Hazards to Flight: The significance of other potential hazards to flight is principally measured in terms of the hazards specific characteristics and their distance from the airport and/or its normal traffic patterns. Compatibility Strategies Compatibility strategies for the protection of airport airspace are relatively simple and are directly associated with the individual types of hazards: Airspace Obstructions: Buildings, antennas, other types of structures, and trees should be limited in height so as not to pose a potential hazard to flight. Wildlife and Other Hazards to Flight: Land uses which may create other types of hazards to flight near an airport should be avoided or modified so as not to include the offending characteristic. South County Airport Master Plan C-5
94 APPENDIX C LAND USE COMPATIBILITY Basis for Setting Criteria The criteria for determining airspace obstructions and other hazards to flight have been long-established in FAR Part 77 and other Federal Aviation Administration regulations and guidelines. Also, state of California regulation of obstructions under the State Aeronautics Act (Public Utilities Code, Section 21659) is based on FAR Part 77 criteria. Agency Responsibilities Ensuring the maximum level of compatibility between the South County Airport and adjacent uses is the responsibility of five agencies: Santa Clara County, Santa Clara County Airport Land Use Commission, City of San Jose, California Division of Aeronautics, and the Federal Aviation Administration. Each agencies role is discussed below. Santa Clara County Santa Clara County has two roles related to land use compatibility. As owner and operator of the South County Airport, the county has a central role in ensuring the safety of aircraft operations and minimizing off-airport impacts. Although federal preemptions limit the County s authority, it remains responsible for implementation of modifications to the airfield to maximize safety and minimize off-airport effects. Santa Clara County also has jurisdiction over land uses in the vicinity of the airport. This is an important role because land uses in the area are largely compatible with airport operations. When the Santa Clara County Airport Land Use Commission updates its compatibility plan for this airport (see below), Santa Clara County will be the implementing agency. Santa Clara County Airport Land Use Commission Requirements for creation of airport land use commissions (ALUCs) were first established under the California State Aeronautics Act (Public Utility Code Sections et seq.) in Although the law has been amended numerous times since then, the fundamental purpose of ALUCs to promote land use compatibility around airports has remained unchanged. As expressed in the present statutes, this purpose is:...to protect public health, safety, and welfare by ensuring the orderly expansion of airports and the adoption of land use measures that minimize the public s exposure to excessive noise and safety hazards within areas around public airports to the extent that these areas are not already devoted to incompatible uses. The statutes give ALUCs two principal powers by which to accomplish this objective. First, ALUCs must prepare and adopt an airport land use compatibility plan. Secondly, they must review the plans, regulations, and other actions of local agencies and airport operators for consistency with that plan. C-6 South County Airport Master Plan
95 LAND USE COMPATIBILITY APPENDIX C The basic function of airport land use compatibility plans is to promote compatibility between airports and the land uses that surround them. Compatibility plans serve as a tool for use by airport land use commissions in fulfilling their duty to review proposed development plans for airports and surrounding land uses. Additionally, compatibility plans set compatibility criteria applicable to local agencies in their preparation or amendment of land use plans and ordinances and to landowners (including special district and other local government entities as well as private parties) in their design of new development. The most recent version of the Santa Clara County Airport Land Use Commission s compatibility plan was adopted in September This document is entitled Land Use Plan for Areas Surrounding Santa Clara County Airports. As this is a key document, it is described in a separate section below. Limitations This fundamental objective notwithstanding, airport land use commissions are limited in their powers to achieve it. Two limitations are explicitly written into the law: ALUCs have no authority over either existing land uses (Section 21674(a)) or the operation of airports (Section 21674(e)). Neither of these terms is defined within the statutes, but the interpretation of their meaning is fairly standard throughout the state. Existing Land Uses The precise wording of the Aeronautics Act is that the authority of ALUCs extends only to land in the vicinity of airports that is not already devoted to incompatible uses. The working interpretation of this language is that ALUCs have no stateempowered authority over existing land uses. Operation of Airports Any actions pertaining to how and where aircraft operate on the ground or in the air around an airport are clearly not within the jurisdiction of ALUCs to regulate. ALUC involvement with aircraft operations is limited to taking the operational characteristics into account in the development of land use compatibility plans. This limitation on the jurisdiction of ALUCs cannot, however, be taken to mean that they have no authority with respect to new development on airport property. For example, the law specifically requires ALUCs to review proposed airport master plans for consistency with the commission s plans. ALUCs also have authority to review proposals for nonaviation development on airport property. A third, less absolute, limitation concerns the types of land use actions that are subject to ALUC review. The law emphasizes local general plans as the primary mechanism for implementing the compatibility policies set forth in an ALUC s plan. Thus, Santa Clara County and each city affected by an airport land use compatibility plan is required to make its general plan consistent with the ALUC plan (or to overrule the commission). Once a local agency has taken this action to the satisfaction of the Airport Land Use Commission, the ALUC s authority to review projects within that jurisdiction is narrowly limited. The only actions for which review remains mandatory are proposed adoption or amendment of general plans, specific plans, zoning ordinances, and building regulations affecting land within an airport influence area. For an ALUC to review individual projects, the local agency must agree to submit them. One final limitation worth noting is that ALUCs have no jurisdiction over federal lands such as lands controlled by the U.S. Forest Service, Bureau of Land Management, or Indian tribes. ALUCs can merely inform these agencies about the ALUC policies and seek their cooperation.. South County Airport Master Plan C-7
96 APPENDIX C LAND USE COMPATIBILITY California Division of Aeronautics The Division of Aeronautics has multiple roles that directly or indirectly affect compatibility. Annual airfield inspections supplement the ongoing inspections by airport staff. It provides an independent review of airfield conditions and potential obstructions in the approaches to the runways. Agency staff also monitors noise reduction strategies at airports designated as having noise problems as defined in California s Airport Noise Regulations. The grant program administered by this agency is a potential source for land use compatibility planning and implementation of airfield safety improvements. Federal Aviation Administration The many divisions within the Federal Aviation Administration (FAA) play a variety of roles that affect compatibility around South County Airport. A few of those that have the most significant affect are mentioned in the text that follows. The staff of the FAA s Nor Cal Approach has as their primary responsibility ensuring the separation of aircraft arriving and departing the South County Airport while on instrument flight plans. On a voluntary basis, Nor Cal Approach will also assist in ensuring separation of aircraft on visual flights. The airport may ultimately qualify for an air traffic control tower depending upon the actual activity level. In a less direct manner, the FAA also contributes to safety through the promulgation of regulations relating to flight and designation of various classes of airspace. As a grant funding agency the FAA supports measures to reduce noise impacts and improve airfield safety. For example, acquisition of properties that might be exposed to unacceptable levels of noise is expected to be funded by the FAA. Airport Land Use Compatibility Plan The airport land use compatibility plan for an airport is the key document providing guidance on compatible land uses. As part of this master plan, the current plan has been evaluated. The Land Use Plan for Areas Surrounding Santa Clara Airports is a comprehensive document. It begins with an introduction that describes the state-mandated purposes of airport land use commissions. The relationship to local planning agencies and airport owners is documented. The introduction is followed by a description of the public airports in Santa Clara County covered by the plan. South County Airport is one of these airports. Next there is an extensive discussion of the characteristics of aviation noise and its measurement. Safety issues are covered in the subsequent chapter. Recommended safety zones are also presented in this chapter. The next two sections contain implementation procedures and the ALUC s policies. The balance of the document contains a glossary and various appendices. In the most general sense, both the adopted compatibility plan contains policies that are judged to be technically supportable and appropriate for an airport with the characteristics of South County. This airport master plan contains some changes that should be incorporated into the compatibility plan: Airfield: The compatibility plan assumes that two parallel runways will be constructed at South County Airport. The master plan anticipates that one, longer runway will be constructed. Airspace plan: has been modified to reflect the extension of the runway C-8 South County Airport Master Plan
97 LAND USE COMPATIBILITY APPENDIX C Noise contours: the new, larger noise contours should be used The safety zone boundaries should be modified to account for the change in runway length. Figure C-1 presents the proposed configuration for the safety zones. In addition to those mechanical changes, it is also recommended that other changes be considered: Reformat the plan so that policies are clearly differentiated from supporting text. Specifically, it is suggested that all text, tables, and figures associated with policies be placed in one section. Numbered headings should be reserved for policies. The infill policies should be clarified. Given the large average parcel size in the area, careful consideration should be given to this policy. Policies controlling the creation of wildlife attractants should be added to the plan. The rural character of much of the area around the South County Airport leaves the potential for a variety of wildlife attractants to be proposed. Evaluate the existing plan concepts in light of the data and methodologies contained in the 2002 California Airport Land Use Handbook. The value of consolidating noise, safety and overflight policies into one set of compatibility zones should also be considered. This could simplify implementation of the policies. South County Airport Master Plan C-9
98
99 PREPARED BY MEAD & HUNT 133 AVIATION BOULEVARD, SUITE 100 SANTA ROSA, CA (707) PREFACE Many technical terms and expressions are used in airport master planning and noise management programs. This glossary has been prepared for the County of Santa Clara and interested members of the public. The definitions in this glossary were compiled from various sources including government publications such as Federal Aviation Administration (FAA) Advisory Circulars, FAA Orders, the Federal Aviation Regulations (FARs) and professional literature.
100 !"#"$!"#$ " % & $ #%!"#"" $ %! ' ( & &%# %'&%&"% & &!)# $!*#!+ # %#%"'%((& # %'&%&"%&, %!&"&% ((&" &" #%!!!& "%$ #%!"#" -%%!)!( %!!"
101 % % %% % % #!% % %&%%% & %&%%%*&%(&%. /. 01%2 /)*), 3!,3# %&%%%*& %,3/)45!)# & & $!*# 1%/% %&%(&&! & & 6 %&%(% && %' )4,. 7)&." 8 ). % 7)& *." %7)& )*)& 4.. %)*)& )9)& 9.2 %)9)& )::& 5. %)::& %&%(&"-,; & % <. => %8 ) = & 4????? * > )*5?? & 4????? 4 % )*5?? & %&%( %+!"!" " & %("&&' %"'! &# &
102 %!)!( %!!", 0 % 1%./ + % % & % %"#! % %!#%! % %,% 6 & % % % #!% % / 6 & + % %"!&!"&. + % %"!"!". >1. % %"' "!! # % % %"! 6 >/ % %! & $"'"!!!' 0./ % 8
103 !)#& &$!*# $!4#.!,3/)5?# % %% % %@ /)2 7/ 1. % %%% %#& % % 3,.,3 A,3%)7743%.. % %%(%!&! & % %! % + + % % %#""!&%% % %3 +.%3 :? % % %((& % 1,3/ ??? 1 +. &.+ % % %((&&!% " % &.
104 %% %#""!&%% %%!3..# 3%3 %% %((&&!% "&!% %&&,!,3# / )45, 3! # 1%/% + B5?? 4? %%((& & % %((&&"%!&.&&"%!& + & % %((&&!% " &!,# % '.(%"% '.!% &!% "" %&# "%% + " / " 6 C >!C># < %>!<%># "&%% %"!&! "%% %"!"! $!! & = '& ( ' (!% $!! "#"#
105 $!! "#"-! & # % &&"%!&+. % &" ' " % & & %!.% & %%%%% %#""!&%% %&&%%% %((&&!% "&!%!%#!('!! $!& (/010 %%% %%#""!&%% &%%%((&&!% " % &%!"!( %!%#& % $%#!' + &%!"!( %!%#&! # #%"'%((& 2 #!('!! $!& (/010!/>7: )74,)D)7D? E ))7DD
106 /4:, 3!,3 /4:,3/)5?#, 1%. )7D4,, 1% #!!! "!( < 6,=+ $? &4:? $&+& % % & + 6 >%+ $&+%!! % $!! $((",! # $%&%( $"!% %((&%!# $" &!)5?4??# 6 & $"!& %
107 $"!%%&!"! $%" 6, 3 /BB!,3/BB# $!#!!.@# &"( %!!#%!!"2"'&&23 %. 8!)# &!*#!4# / 6!9# 2 6!.FC %)5??*GH# & %&" -!.F 6 6 &$. " 2 &"!= '& ('(' ( ' ('( &2%&!&"!!#%!!"2"' &2/4553,. F!.F# 0 /!0/# &2%&"( %!!#%!!"2"'& &%(& % % &%%% % % &%%%* &%(& % &%&"! % &.&%&" "!!#% &"%,!%%!'% &!,!
108 &"% ', *7)757 5?? )*5 6 = *: &!"%&!'! 2#"!"#" &!%((&# %'(%2!&'&(.,10.@<<,%2% & " & % &!>%# &!'! 2#"!"#"&!". 0%.0> *96 ; B8??/<)?8??/< )?8??/<B8??< & %%&%%%%%&%%%*& % & %!#"!"!&"%" & % "!.!>.0># &!% ""%& 6,3 A, / 7)! /7)#,,3,3.."...2
109 !,3 /B)# &!&"!!#%!!" 2"' &2 0 /!0/#)7:7. / 6. &(%&!%((&# %'(%2!&' $!#!# +' ( '! #%!"#"!" " >!# > & *9! *9 +#2 )? )?8?? B8?? > > $%&$"*$ &$"*$ *? )? *?!*? # %"!& )7BD2 & #"!%3 + > '( '( $ &!# $, +
110 "&% "! #!& %!2!! # 2< %!& %!2!!"%'!#%!"#"!!" %!>!< # %!#%!!"! ((&% & %%!#%!!" &% % %!#%!!" &!!!%!% 6!#%!!"! +, %!%#, 0%!,@0%#,@)?5?)2 5?5?9!#%!!" &% %%- 3.F 6 + 6!#%!!"&! 0 /)7:7!0/#% )?*!*#!# % 0 %,@)?5?)2 5?5?9
111 !"!."!!%! #! # 2#"!!%'"#"*"6 > )D *9 1% / (%(%"#!!%! (! "&' 0 / 2, 0)D)7B: & ( %%,, ( %%/5457/, 2*))7D4.F)5??3 (%-%(%"#!%"!(% (% % 9:, 3 / 4: % % 0 )7B7!# (% % 11, 3 / BB (%%11%(& 8!)#!*#!4#!9# +!5# (%%0/- (%%/;/!/94, 3
112 (%%/45, 3 /)5?,*D)7D*,3/ )5? % 0 )7B7!%0#,3/)5? 0 < 0./,3/)5?,3 %)9)774 ($ %(-$ % % (%"#!!%!, 1%2!)# $!*# 1 %$!4# $!9# $!5# (%" #!%"! (% 3,!,# ( ""! &2! %&!# (%%'("-8 ) 3 * 2 4 < (!! (!!(&!&(!,! #%,@0%!#,@)?5?)2 5?5?9 (-$ % %($ -!)# $ $& $ $ I $!*# (".%&+ &
113 (" %#&! (, <,%% A,3. 0 0%,3 0A2,%%,%!, ; #&. ("!%%& ((&(,,% (" & 3,%$'@&,; ( ("#$"'%#$"' (" &!% "< 6!# + (!%(!! (!!(&! &!%" #! 6!%" #! "" >% " $"!! "" ' + + %!#$"'%#$"' #'%&%(&4????? "& %3+
114 " I& I & & " %- & 1%2 = 1 2 & + (%%!%!("%" (%&!!; (%!!%%% &%(%%0//&, & " "%!%!"!!' "& %3 ) >%.- >% *?? )D?? * >%. - >% )?? )*?? 4 >%. - >% B?? "- >% )5?.- >% & '(.F)5??!% )5?DD# &!"!&" &
115 !& $""! 3!> # *,3/)5?!%! % & % &%!%!("%"(%3,!%!"!!' "!%! %!,3,3!%!%!'!#%2%"2 1 :"!%! %! "!& $"' "! & $"' %!& 2, + & & 6 % & % 5))!#!5# )7D)! //# "!&!% ". +!
116 & #! # "!"!!!. 6 + "% %&%( )*5?? & 4????? "%'!#%!"#" "< "!&'. 6 > > 6 % )5?5).F "6%2#"!!%'"#"*"6 "!(&2!%&! # ""!&2!# "<% -! "#" " &%" &",% " &"!&'. '> ( + " &" %! *5 )5 " &"%((& &
117 " &",% " & >%+ " &",%'%&!""0A2 + >% "!6 &!)?# " % & A,3 & = %% %#"! %+%$&! >% +! &! # & & & &!"#" " &% #"!!' " 1%<>% C/%!# "%' %!@ 0 C1%,1%1%<.1%0 "%' %! %,3 A,3! &! " +! (" /7)
118 !; $,3&,3 A,3 % &- ) < /!</# </ *. 4..!% &!#.F)5??!% )5?D*?#' ( 8!# &!# < +!# 3!# 3!#. 6 6.F.F!. /3.*)??*# "% &% #"!!' "-%!"#"!!" %& '.! & 1% $ $ $ 6!#%!#!"!#!"!#! #!$-!!%&!"% $&!!$
119 !0 /)7:7!/>7))7?#!! $!% &%.! #!!! ( $"!! & "! &! &! %>!>.0># 5" > B5"> B?" > :5"! &!% ""!2 & &, +!# #! "#"%&!!"% ' (!!#"!> 3!!& $""!%!& $""!!!%&!"% $&!!$ '( &!!%&! % & % &% A@3C/%>@.!'(#
120 !!%&!!%!%!' + +! -%! & %!! & %!! & + #!+ 0 %#& $&" 6 6 $&"(%,! (, 6 6, & $%&! 6, 3!/BB# %!& %%%( %% %%+%& >% %%&!% &!& % "!&! "'! '+ ( %&! % &!& % A% %&! % & % &%- I$>%I<>% /3
121 %&!!%!% &%!>%# %&!!%!%!' +!>%#!<>%#!/3#C/% %(%!"%! '% %, 2 6,2!# % %%'%%&!3 $"&!&'..F %% % &&!% "(&"'. /. I % 8 3. I3.!# 3.,I3.,!0I,# 3. I3/.@0!,I,# 3. I3.@0!,# I. I.!,# G H %"%%! '!!(%" %"#% % % %!$"!&'. 6> 30 2,.F '3 ( > 6 %%&%2 6
122 %% ( 6 %! ' & 3 )?$3?)3 *5 %! '"> %! '!!(%"%" + %! '! ; 'I (. $3 $3 %! ' % &!,! + 6 %,3/BB +,3/BB/% %5?, + & %! '('% 6 %!'% " &!%"&% "# %! '% % %%(%!"%! '% % "-%!- %"#"" #%! - % & $ >!.0>#B5"!%!(&!! - %# "!
123 !(&!!#%!!"((& 6!(&!! - % & $ >!.0>#:5"!%#%! - %# ""%&%()*5?? &! - %"#" "- < *?!!"!!)#!*#!"#"! "#"!"#"% &!%!!&"& &!%!!" &" %& + I &"#(%&!!< A,3.".2
124 &"#(% %!.".2 A,3 %.!%!%!%! %%!,3# I %2!%%!"%%#"% %!,3# I%3 I ' & & & %!!%! % & $ $#! %"! %!!& 3 %!)#!*# $!"#!&1.F 6 3% 8 - -"! & & - ' %!"%&%%!"%
125 %!"% %!"!%! % &% % / 8!)#!*#!4#!9# % / % " &! %! & J & %%% %%((&&!% " %& %((& %! & ) 1 >- *. >- 4 2 >- 9 ">- 5, - & A,3 %!(% (#"!%% !#, & > 2 & %!!%&%( %!!"%&
126 %! % >% %! %% % )*)& %$ =%&%( 6 6 %$ % %&%( 6 6!&! % # I! # "'% % )*)& %$!%!! 1C<!)# 7*#!4# 6 + 1C< + 1C< 1C< & "%"#&", +. #%#"% &"!& % #& % #%' (%2!&' #(!%&!" %! # % ; 0!.0# A@3. #(%#"("%" #(%&!!;
127 #& %% ' #$"' 6 6 A )!" #+ & 6 6 * $" #/ + 1 %0 ; % #"% &,3 A,3 + #"% &"!& %#!# % #"("%"#(%3!, 3 /7)# #"%! ', # %%#%'(%2!&'!%&!"%! +%$"!&/ 66 %!! %- +!% I +,!!!,!! %!!&@ + K & + 6+
128 ,3 /)5? + 68!)#!*#
129 APPENDIX A Noise Model Calculation Data South County Airport Table 1 Existing (2002) Itinerant Operations (Arrivals and Departures are equal and half of listed number) and Local Operations (Two Operations per Local Pattern) Aircraft (INM) Operations Type Annual % Day Evening Night Total Single-Engine, Propeller, Fixed- Pitch (GASEPF) Itinerant 19, % Local 20, % Single-Engine, Itinerant 5, % Propeller, Variable- Pitch (GASEPV) Local 4, % Twin-Engine Propeller, Piston Itinerant 2, % (BEC58P) Single-Engine, Turboprop Itinerant 1, % (GASEPV) Business Turboprop (Twin) Itinerant 2, % (CAN441) Small Fanjet (MU3001) Itinerant % Medium Fanjet (LEAR35) Itinerant % Helicopter (H500D) Itinerant % TOTAL 56, % South County Airport Master Plan A-1
130 APPENDIX A NOISE MODEL CALCULATION DATA Table 2 Five-Year Forecast (2007) Itinerant Operations (Arrivals and Departures are equal and half of listed number) and Local Operations (Two Operations per Local Pattern) Aircraft (INM) Operations Type Annual % Day Evening Night Total Single-Engine, Propeller, Fixed-Pitch (GASEPF) Itinerant 26, % Local 29, % Single-Engine, Propeller, Variable-Pitch (GASEPV) Twin-Engine Propeller, Piston (BEC58P) Single-Engine, Turboprop (GASEPV) Business Turboprop (Twin) (CAN441) Itinerant 14, % Local 12, % Itinerant 6, % Itinerant 1, % Itinerant 4, % Small Fanjet (MU3001) Itinerant % Medium Fanjet (LEAR35) Itinerant % Helicopter (H500D) Itinerant 1, % TOTAL 95, % A 2 South County Airport Master Plan
131 NOISE MODEL CALCULATION DATA APPENDIX A Table 3 Twenty-Year Forecast (2022) Itinerant Operations (Arrivals and Departures are equal and half of listed number) and Local Operations (Two Operations per Local Pattern) Aircraft (INM) Operations Type Annual % Day Evening Night Total Single-Engine, Itinerant 41, % Propeller, Fixed- Pitch (GASEPF) Local 45, % Single-Engine, Itinerant 31, % Propeller, Variable- Pitch (GASEPV) Local 28, % Twin-Engine Propeller, Piston (BEC58P) Single-Engine, Turboprop (GASEPV) Business Turboprop (Twin) (CAN441) Small Fanjet (MU3001) Medium Fanjet (LEAR35) Itinerant 12, % Itinerant 5, % Itinerant 8, % Itinerant 1, % Itinerant % Helicopter (H500D) Itinerant 2, % TOTAL 175, % Table 4 Time of Day Distribution for Years 2002 and 2007 Aircraft Type Single-Engine, Propeller, All Twin-Engine, Propeller, Piston Single-Engine, Turboprop Business Turboprop (Twin) Jets, All Helicopter Takeoff Landing Takeoff Landing Takeoff Landing Takeoff Landing Takeoff Landing Takeoff Landing Day 7:00 a.m. 7:00 p.m. 94.0% 94.0% 94.0% 94.0% 94.0% 94.0% 94.0% 94.0% 94.0% 94.0% 95.0% 95.0% Percentage of Operations by Aircraft Type Evening 7:00 p.m. 10:00 p.m. 5.0% 5.0% 5.0% 5.0% 5.0% 5.0% 5.0% 5.0% 5.0% 5.0% 5.0% 5.0% Night 10:00 p.m. 7:00 a.m. 1.0% 1.0% 1.0% 1.0% 1.0% 1.0% 1.0% 1.0% 1.0% 1.0% 0.0% 0.0% South County Airport Master Plan A 3
132 APPENDIX A NOISE MODEL CALCULATION DATA Table 5 Time of Day Distribution for Year 2022 Aircraft Type Day 7:00 a.m. 7:00 p.m. Percentage of Operations by Aircraft Type Evening 7:00 p.m. 10:00 p.m. Night 10:00 p.m. 7:00 a.m. Single-Engine, Propeller, All Takeoff Landing 82.0% 82.0% 15.0% 15.0% 3.0% 3.0% Twin-Engine, Propeller, Piston Takeoff Landing 82.0% 82.0% 15.0% 15.0% 3.0% 3.0% Single-Engine, Turboprop Takeoff Landing 82.0% 82.0% 15.0% 15.0% 3.0% 3.0% Business Turboprop (Twin) Takeoff Landing 80.0% 80.0% 15.0% 15.0% 5.0% 5.0% Jets, All Takeoff Landing 80.0% 80.0% 15.0% 15.0% 5.0% 5.0% Helicopter Takeoff Landing 98.0% 98.0% 2.0% 2.0% 0.0% 0.0% RUNWAY UTILIZATION Runway Utilization for all years and all fixed-wing aircraft types was 15% on Runway 14 and 85% on Runway 32. Helicopter or rotary-wing aircraft followed the same percentages for direction of arrival or departure. Table 6 Flight Tracks Takeoff, All Years Aircraft Type Single- Engine, Propeller, All Twin-Engine, Propeller, Piston Single- Engine Turboprop Business Turboprop (Twin) Straight Out Runway 14 Left Downwind Left turn at 2 miles Percentage of Track Usage by Runway Runway 32 Left turn at Right Runway End Downwind Straight Out Helipad Straight Out Jets, All Helicopter A 4 South County Airport Master Plan
133 NOISE MODEL CALCULATION DATA APPENDIX A Table 7 Flight Tracks Landing, All Years Percentage of Track Usage by Runway Aircraft Type Straight In Runway 14 Runway 32 Helipad From Left Downwind Straight In From Right Downwind Straight In Single-Engine, Propeller, All Twin-Engine, Propeller, Piston Single-Engine Turboprop Business Turboprop (Twin) Jets, All Helicopter Source: Data compiled by Mead & Hunt and HMMH (April 2005) South County Airport Master Plan A 5
 and the United States. Both levels of government have environmental regulations that must be considered.")
134 Appendix D Environmental Overview ENVIRONMENTAL CONSTRAINTS Development projects for South County Airport will occur within the regulatory structure of the State of California (including its subunits) and the United States. Both levels of government have environmental regulations that must be considered. This section is intended to identify potential environmental concerns that should be assessed as part of the environmental review. Biological Potential biological issues were identified based upon information obtained from available data sources. Based upon these sources, the following have been identified as potential biological issues: Wetlands The project is not expected to have any negative effects on wetlands or riparian areas; none were observed in the vicinity of the proposed improvements. Sensitive Species There are no federal or state listings for endangered species on the airport site. However, there is an occurrence of Metcalf Canyon jewel-flower (Streptanthus albidus ssp. albidus), listed as a Federal Endangered Species, near the project area. There are no known active raptor nests within the immediate vicinity of South County Airport; however, there is a remote possibility that nests could be established in the future. There are no native resident or migratory fish or wildlife species, or established native resident or migratory wildlife corridors, or native wildlife nursery sites known to exist on the project site. Dense trees are located in Llagas Creek, west of the airport across Murphy Avenue. The trees are approximately 100 to 200 feet from any proposed improvements. There is also a small grove of oak trees approximately 1,200 feet south of the hanger location along Murphy Avenue; these existing oak trees would not be disturbed. Metcalf Canyon jewel-flower The Airport Master Plan does not expect conflict with any existing Habitat Conservation Plan, Natural Community Conservation Plan, or any other approved conservation plan, since none have been adopted for the project site or within the immediate vicinity around the airport. As no project specific biological investigations have been performed, a biological reconnaissance should be conducted as a part of the environmental documentation process. South County Airport Master Plan Report D-1
Public Review Draft South County Airport Master Plan Report. County of Santa Clara San Martin, California
 Public Review Draft South County Airport Master Plan Report County of Santa Clara San Martin, California July 2005 County of Santa Clara Board of Supervisors Donald F. Gage Blanca Alvarado Peter A. McHugh
Draft Palo Alto Airport Master Plan Report County of Santa Clara, California October 2005
 Draft Palo Alto Airport Master Plan Report County of Santa Clara, California October 2005 County of Santa Clara Board of Supervisors Donald F. Gage Blanca Alvarado Peter A. McHugh James T. Beall, Jr. Liz
Background and Inventory
 1 Background and Inventory HANFORD MUNICIPAL AIRPORT Hanford Municipal Airport is a general aviation facility serving Kings County and the surrounding communities of Hanford, Armona and Lemoore in south-central
The purpose of this Demand/Capacity. The airfield configuration for SPG. Methods for determining airport AIRPORT DEMAND CAPACITY. Runway Configuration
 Chapter 4 Page 65 AIRPORT DEMAND CAPACITY The purpose of this Demand/Capacity Analysis is to examine the capability of the Albert Whitted Airport (SPG) to meet the needs of its users. In doing so, this
Notice of Extended Comment Period for an Intent to Adopt a Negative Declaration
 County of Santa Clara Department of Planning and Development Planning Office County Government Center, East Wing, 7 th Floor 70 West Hedding Street San Jose, California 95110-1705 (408) 299-5770 FAX (408)
Business Plan INTRODUCTION AIRPORT ENTERPRISE FUND OVERVIEW. Master Plan Guiding Principles
 5 Business Plan INTRODUCTION Just as previous chapters have outlined plans for the airport s physical development, this chapter outlines a plan for the airport s financial development. More specifically,
STAFF REPORT. Airport Land Use Plan Consistency Review: Santa Barbara Airport Master Plan. MEETING DATE: November 19, 2015 AGENDA ITEM: 7D
 STAFF REPORT SUBJECT: Airport Land Use Plan Consistency Review: Santa Barbara Airport Master Plan MEETING DATE: AGENDA ITEM: 7D STAFF CONTACT: Peter Imhof, Andrew Orfila RECOMMENDATION: Adopt findings
According to FAA Advisory Circular 150/5060-5, Airport Capacity and Delay, the elements that affect airfield capacity include:
 4.1 INTRODUCTION The previous chapters have described the existing facilities and provided planning guidelines as well as a forecast of demand for aviation activity at North Perry Airport. The demand/capacity
Executive Summary. MASTER PLAN UPDATE Fort Collins-Loveland Municipal Airport
 Executive Summary MASTER PLAN UPDATE Fort Collins-Loveland Municipal Airport As a general aviation and commercial service airport, Fort Collins- Loveland Municipal Airport serves as an important niche
FACILITY REQUIREMENTS SUMMARY OF KEY ISSUES OVERVIEW
 FACILITY REQUIREMENTS SUMMARY OF KEY ISSUES OVERVIEW This summary is intended to provide a brief overview of the key issues associated with conformance to FAA standards at Methow Valley State Airport.
FORECASTING FUTURE ACTIVITY
 EXECUTIVE SUMMARY The Eagle County Regional Airport (EGE) is known as a gateway into the heart of the Colorado Rocky Mountains, providing access to some of the nation s top ski resort towns (Vail, Beaver
Yolo County Airport. ALP Narrative Report. April Prepared by Mead & Hunt, Inc. for the County of Yolo, California
 Yolo County Airport ALP Narrative Report April 2016 Prepared by Mead & Hunt, Inc. for the County of Yolo, California Yolo County Airport ALP Narrative Report Prepared for the County of Yolo Mindi Nunes,
2009 Muskoka Airport Economic Impact Study
 2009 Muskoka Airport Economic Impact Study November 4, 2009 Prepared by The District of Muskoka Planning and Economic Development Department BACKGROUND The Muskoka Airport is situated at the north end
Background and Inventory
 1 Background and Inventory HEMET-RYAN AIRPORT Locations and Environs Hemet-Ryan Airport is situated in the San Jacinto Valley at the foot of the San Jacinto Mountains in Riverside County, California. The
Document prepared by MnDOT Office of Aeronautics and HNTB Corporation. MINNESOTA GO STATE AVIATION SYSTEM PLAN
 LAST UPDATE JULY 2013 Acknowledgements The preparation of this document was financed in part by a grant from the Federal Aviation Administration (Project No: 3-27-0000-07-10), with the financial support
Runway Length Analysis Prescott Municipal Airport
 APPENDIX 2 Runway Length Analysis Prescott Municipal Airport May 11, 2009 Version 2 (draft) Table of Contents Introduction... 1-1 Section 1 Purpose & Need... 1-2 Section 2 Design Standards...1-3 Section
at: Accessed May 4, 2011.
 3.11 SAFETY 3.11.1 Background and Methodology As with other forms of transportation, there is risk associated with aviation activities. This section focuses on risk to those on the ground near airports.
Agenda: SASP SAC Meeting 3
 Agenda: SASP SAC Meeting 3 Date: 04/12/18 Public Involvement Plan Update Defining the System Recommended Classifications Discussion Break Review current system Outreach what we heard Proposed changes Classification
1.1.3 Taxiways. Figure 1-15: Taxiway Data. DRAFT Inventory TYPICAL PAVEMENT CROSS-SECTION LIGHTING TYPE LENGTH (FEET) WIDTH (FEET) LIGHTING CONDITION
 WIDTH (FEET) LIGHTING CONDITION") 1.1.3 Taxiways EWN has an extensive network of taxiways and taxilanes connecting the terminal, air cargo, and general aviation areas with the runways as listed in Figure 1-15. A 50-foot wide parallel taxiway
1.1.3 Taxiways EWN has an extensive network of taxiways and taxilanes connecting the terminal, air cargo, and general aviation areas with the runways as listed in Figure 1-15. A 50-foot wide parallel taxiway
CHAPTER 1 BACKGROUND AND PROPOSED ACTION
 CHAPTER 1 BACKGROUND AND PROPOSED ACTION 1.0 INTRODUCTION An Environmental Assessment (EA) evaluates the effects of a proposed Federal action on the surrounding environment and is prepared in compliance
Technical Memorandum. Synopsis. Steve Carrillo, PE. Bryan Oscarson/Carmen Au Lindgren, PE. April 3, 2018 (Revised)
") Appendix D Orange County/John Wayne Airport (JWA) General Aviation Improvement Program (GAIP) Based Aircraft Parking Capacity Analysis and General Aviation Constrained Forecasts Technical Memorandum To:
Appendix D Orange County/John Wayne Airport (JWA) General Aviation Improvement Program (GAIP) Based Aircraft Parking Capacity Analysis and General Aviation Constrained Forecasts Technical Memorandum To:
Hartford-Brainard Airport Potential Runway Closure White Paper
 Hartford-Brainard Airport Potential Runway 11-29 Closure White Paper June 2012 In recent years there has been discussion regarding the necessity of Runway 11-29 to the Hartford- Brainard Airport (HFD)
Westover Metropolitan Airport Master Plan Update
 Westover Metropolitan Airport Master Plan Update June 2008 INTRODUCTION Westover Metropolitan Airport (CEF) comprises the civilian portion of a joint-use facility located in Chicopee, Massachusetts. The
Appendix B. February 26, Robert Lee FAA ADO Office 1000 Marina Blvd., Suite 220 Brisbane, CA Sent via . Dear Mr.
 Appendix B February 26, 2015 Robert Lee FAA ADO Office 1000 Marina Blvd., Suite 220 Brisbane, CA 94005-1853 Sent via e-mail Dear Mr. Lee: The County of Santa Clara is the owner and sponsor for Reid-Hillview
Chapter 2 FINDINGS & CONCLUSIONS
 Chapter 2 FINDINGS & CONCLUSIONS 2.01 GENERAL Dutchess County acquired the airport facility in 1947 by deed from the War Assets Administration. Following the acquisition, several individuals who pursued
Addendum - Airport Development Alternatives (Chapter 6)
") Bowers Field Addendum - Airport Development Alternatives (Chapter 6) This addendum to the Airport Development Alternatives chapter includes the preferred airside development alternative and the preliminary
Bowers Field Addendum - Airport Development Alternatives (Chapter 6) This addendum to the Airport Development Alternatives chapter includes the preferred airside development alternative and the preliminary
MONTEREY REGIONAL AIRPORT MASTER PLAN TOPICAL QUESTIONS FROM THE PLANNING ADVISORY COMMITTEE AND TOPICAL RESPONSES
 MONTEREY REGIONAL AIRPORT MASTER PLAN TOPICAL QUESTIONS FROM THE PLANNING ADVISORY COMMITTEE AND TOPICAL RESPONSES Recurring topics emerged in some of the comments and questions raised by members of the
Milton. PeterPrinceAirportislocatedinSantaRosaCounty, approximatelythreemileseastofmilton.
 Milton GeneralAviationAirport PeterPrinceAirportislocatedinSantaRosaCounty, approximatelythreemileseastofmilton. Existing Facilities Peter Prince Airport is served by one runway, Runway 18/36, 3,700 feet
Finance and Implementation
 5 Finance and Implementation IMPLEMENTATION The previous chapters have presented discussions and plans for development of the airfield, terminal, and building areas at Sonoma County Airport. This chapter
CHAPTER 1 EXECUTIVE SUMMARY
 CHAPTER 1 EXECUTIVE SUMMARY 1 1 EXECUTIVE SUMMARY INTRODUCTION William R. Fairchild International Airport (CLM) is located approximately three miles west of the city of Port Angeles, Washington. The airport
JOSLIN FIELD, MAGIC VALLEY REGIONAL AIRPORT DECEMBER 2012
 1. Introduction The Federal Aviation Administration (FAA) recommends that airport master plans be updated every 5 years or as necessary to keep them current. The Master Plan for Joslin Field, Magic Valley
Dallas Executive Airport
 648 DECLARED DISTANCE OPTION 1a DISPLACE 31 THRESHOLD BY 97 Considers RSA Limiting Factor No runway extensions 13 31 TORA 6,451 6,451 TODA 6,451 6,451 ASDA 5,958 6,451 LDA 5,958 6,354 Runway 17-35 (3,8
Chapter Seven COST ESTIMATES AND FUNDING A. GENERAL
 Chapter Seven COST ESTIMATES AND FUNDING A. GENERAL This chapter delineates the recommended 2005 2024 Sussex County Airport Capital Improvement Program (CIP). It further identifies probable construction
SAN MARTIN BUSINESS PLAN COMMUNITY MEETING
 SAN MARTIN BUSINESS PLAN COMMUNITY MEETING Summary of Community Meeting Wednesday May 23, 2018 Santa Clara County Roads and Airports Department hosted a community meeting on Wednesday May 23 nd, 2018 from
Chapter 3 Aviation Activity Forecasts
 Chapter 3 Aviation Activity Forecasts Introduction This chapter provides updated forecasts of aviation activity for Albany Municipal Airport (S12) for the twenty-year master plan horizon (2012-2032). The
Table of Contents. Overview Objectives Key Issues Process...1-3
 Table of Contents Chapter One Introduction Overview...1-1 Objectives...1-1 Key Issues...1-2 Process...1-3 Chapter Two Inventory of Existing Conditions Airport Setting...2-1 Locale...2-1 Airport Surroundings...2-5
COMMERCIAL AND GENERAL AVIATION
 Existing Facilities Daytona Beach International Airport is served by a number of airside and landside facilities. The airport has three asphalt runways: Runway 07L/25R (10,500 feet long by 150 feet wide),
BUSINESS OF THE CITY COUNCIL CITY OF MERCER ISLAND, WA
 BUSINESS OF THE CITY COUNCIL CITY OF MERCER ISLAND, WA AB 4564 September 7, 2010 Regular Business RENTON AIRPORT STATUS UPDATE Proposed Council Action: Receive update. No action required. DEPARTMENT OF
CATCODE ] CATCODE
![CATCODE ] CATCODE](/thumbs/82/85644630.jpg "CATCODE ] CATCODE") Runways. FAC: 1111 CATCODE: 111111 OPR: AFCEC/COS OCR: AF/A3O-A 1.1. Description. The runway is the paved surface provided for normal aircraft landings and take offs. Runways are classified as either Class
Runways. FAC: 1111 CATCODE: 111111 OPR: AFCEC/COS OCR: AF/A3O-A 1.1. Description. The runway is the paved surface provided for normal aircraft landings and take offs. Runways are classified as either Class
CHAPTER 3 ALTERNATIVES CONSIDERED
 CHAPTER 3 ALTERNATIVES CONSIDERED 3.0 ALTERNATIVES The 2010 Stevensville Airport Master Plan contained five (5) airside development options designed to meet projected demands. Each of the options from
1. Background and Proposed Action
 1. Background and Proposed Action This chapter describes Hillsboro Airport and the planning background for the proposed project. The Port of Portland (the Port) is the sponsor for the Hillsboro Airport
APPENDIX B: NPIAS CANDIDATE AIRPORT ANALYSIS
 APPENDIX B: NPIAS CANDIDATE AIRPORT ANALYSIS The National Plan of Integrated Airport Systems (NPIAS) is the Federal Aviation Administration s (FAA) national airport plan. The NPIAS includes nearly 3,500
Preliminary Findings of Proposed Alternative
 Preliminary Findings of Proposed Alternative The attached drawing provides a schematic layout of the proposed alternative that will be discussed on July 27, 2010. A full report will follow and should be
Punta Gorda Airport Master Plan Update
 Punta Gorda Airport Master Plan Update Draft Executive Summary Prepared for: The Charlotte County Airport Authority January 2018 Charlotte County Airport Authority James Herston, Chair Robert D. Hancik,
Lopez Island Airport Master Plan Update. Public Meeting June 15, 2017
 Lopez Island Airport Master Plan Update Public Meeting June 15, 2017 Master Plan Update Team Reid Middleton/Everett, WA Shannon Kinsella, Project Manager Melania Haagsma, Project Engineer Mead & Hunt/Tulsa,
Appendix D Project Newsletters. Tacoma Narrows Airport. Master Plan Update
 Appendix D Project Newsletters Tacoma Narrows Airport Master Plan Update This appendix contains the newsletters distributed throughout the project. These newsletters provided updates and information on
AIRPORT MASTER PLAN UPDATE
 AIRPORT MASTER PLAN UPDATE PENSACOLA INTERNATIONAL AIRPORT Technical Advisory Committee Meeting #2 June 20, 2017 Agenda» Introduction» Facility Requirements Airside Terminal Landside General Aviation Cargo
CHAPTER 1 INTRODUCTION AND BACKGROUND
 CHAPTER 1 INTRODUCTION AND BACKGROUND An Environmental Assessment (EA) evaluates the effects of a proposed Federal action on the surrounding environment and is prepared in compliance with the National
The forecasts evaluated in this appendix are prepared for based aircraft, general aviation, military and overall activity.
 Chapter 3: Forecast Introduction Forecasting provides an airport with a general idea of the magnitude of growth, as well as fluctuations in activity anticipated, over a 20-year forecast period. Forecasting
Airport Master Plan. Rapid City Regional Airport. October 2015 FAA Submittal
 Airport Master Plan Rapid City Regional Airport October 2015 FAA Submittal Rapid City Regional Airport Master Plan Update Table of Contents Executive Summary... i Scope & Timeline... i Forecasts... i Preferred
CHAPTER 3 AIRPORT FACILITY REQUIREMENTS
 CHAPTER 3 AIRPORT FACILITY REQUIREMENTS 3.1 Introduction The existing runway and taxiway system at Skyhaven Airport provides more than adequate operational capacity to accommodate future peak hour and
Appendix B Ultimate Airport Capacity and Delay Simulation Modeling Analysis
 Appendix B ULTIMATE AIRPORT CAPACITY & DELAY SIMULATION MODELING ANALYSIS B TABLE OF CONTENTS EXHIBITS TABLES B.1 Introduction... 1 B.2 Simulation Modeling Assumption and Methodology... 4 B.2.1 Runway
Draft Concept Alternatives Analysis for the Inaugural Airport Program September 2005
 Draft Concept Alternatives Analysis for the Inaugural Airport Program September 2005 Section 3 - Refinement of the Ultimate Airfield Concept Using the Base Concept identified in Section 2, IDOT re-examined
Vista Field Airport. Master Plan Update. February, Prepared for: Port of Kennewick One Clover Island Kennewick, Washington
 Vista Field Airport February, 2006 Prepared for: Port of Kennewick One Clover Island Kennewick, Washington 99336 Prepared by: J-U-B ENGINEERS, Inc. 2810 W. Clearwater Avenue, Suite 201 Kennewick, Washington
SECTION 5.0 FORECASTS OF AVIATION DEMAND
 SECTION 5.0 FORECASTS OF AVIATION DEMAND SECTION 5.0 FORECASTS OF AVIATION DEMAND 5.1 GENERAL This section provides an update of aviation activity forecasts for through the year 2021. The aviation activity
CHAPTER THREE AVIATION ACTIVITY FORECASTS
 CHAPTER THREE AVIATION ACTIVITY FORECASTS Introduction The purpose of this chapter is to update the forecasts of aviation activity for the twenty year planning period addressed in the Update (2007-2027).
CHAPTER THREE AVIATION ACTIVITY FORECASTS INTRODUCTION
 CHAPTER THREE AVIATION ACTIVITY FORECASTS INTRODUCTION The purpose of this chapter is to update the forecasts of aviation activity for the twenty-year planning period addressed in the Update (2007-2027).
Chapter 1 EXECUTIVE SUMMARY
 Chapter 1 EXECUTIVE SUMMARY Contents Page Aviation Growth Scenarios................................................ 3 Airport Capacity Alternatives.............................................. 4 Air Traffic
Current Airport Roles
 Chapter Four: Current Airport Roles Introduction Current airport roles are defined differently from national, state, and local perspectives. The Federal Aviation Administration (FAA) has established two
Airfield Design OVERVIEW BASIC DESIGN FACTORS. Airport Role
 3 Airfield Design OVERVIEW Due to the presence of significant physical constraints, little change to the existing airfield is anticipated. The emphasis in this plan is on identifying airfield improvements
Inventory of Existing Conditions.
 A Inventory of Existing Conditions. Fort Collins-Loveland Municipal Airport, jointly owned and operated by the Cities of Fort Collins and Loveland, is located in the heart of a region with a thriving economy,
DRAFT FINAL REPORT AIRPORT MASTER PLAN. Rifle Garfield County Airport Revised May 15, 2014
 DRAFT FINAL REPORT AIRPORT MASTER PLAN Rifle Garfield County Airport Revised May 15, 2014 As required by Paragraph 425.B(4) of FAA Order 5100.38C, Airport Improvement Program (AIP) Handbook: The preparation
New Opportunities PUBLIC WORKSHOP. Venice Municipal. Bringing g the pieces together
 Bringing g the PUBLIC WORKSHOP Venice Municipal Airport New Opportunities Presented for Venice City Council & Citizens of Venice September 25, 2009 Slide 1 Bringing g the Welcome & Introductions May 12th
Airport Master Plan for. Brown Field Municipal Airport PAC Meeting #3
 Airport Master Plan for Brown Field Municipal Airport PAC Meeting #3 Public Meeting #1 > 8/24/17 from 5:30 to 8:00 pm > 41 attendees signed-in > Comments: > EAA area > Environmental constraints > Focus
Norman Y. Mineta San Jose International Airport Annual Noise Report
 Norman Y. Mineta San Jose International Airport 2015 Annual Noise Report Annual Noise Report for Norman Y. Mineta San José International Airport Introduction and Purpose The purpose of this annual report
Merritt Island Airport
 TABLE OF CONTENTS CHAPTER 1 INTRODUCTION... 1-1 INTRODUCTION AND PROJECT OVERVIEW... 1-1 General Guidelines... 1-1 Prior Planning Documentation... 1-2 Key Issues... 1-2 Goals and Objectives... 1-2 Regulatory
Lake Tahoe Airport Master Plan Public Meeting March 16, 2015
 Lake Tahoe Airport Master Plan Public Meeting March 16, 2015 What is an Airport Master Plan? a comprehensive study of an airport [that] usually describes the short, medium, and long term development plans
PLU Airport Master Plan Master Plan Advisory Committee (MPAC) Meeting #4 MASTER PLAN ADVISORY COMMITTEE (MPAC) - MEETING #4
 Meeting #4 MASTER PLAN ADVISORY COMMITTEE (MPAC) - MEETING #4") MASTER PLAN ADVISORY COMMITTEE (MPAC) - MEETING #4 MASTER PLAN ADVISORY COMMITTEE (MPAC) MEETING #4 AGENDA & ACTION ITEMS Date/Time: Location: Monday, March 19, 2018 from 1:30-3:30 p.m. Thun Field Airport
MASTER PLAN ADVISORY COMMITTEE (MPAC) - MEETING #4 MASTER PLAN ADVISORY COMMITTEE (MPAC) MEETING #4 AGENDA & ACTION ITEMS Date/Time: Location: Monday, March 19, 2018 from 1:30-3:30 p.m. Thun Field Airport
FORT LAUDERDALE-HOLLYWOOD INTERNATIONAL AIRPORT ENVIRONMENTAL IMPACT STATEMENT DRAFT
 D.3 RUNWAY LENGTH ANALYSIS Appendix D Purpose and Need THIS PAGE INTENTIONALLY LEFT BLANK Appendix D Purpose and Need APPENDIX D.3 AIRFIELD GEOMETRIC REQUIREMENTS This information provided in this appendix
TABLE OF CONTENTS. Washington Aviation System Plan Update July 2017 i
 TABLE OF CONTENTS Chapter 1 Overview... 1-1 1.1 Background... 1-1 1.2 Overview of 2015 WASP... 1-1 1.2.1 Aviation System Performance... 1-2 1.3 Prior WSDOT Aviation Planning Studies... 1-3 1.3.1 2009 Long-Term
STUDY OVERVIEW MASTER PLAN GOALS AND OBJECTIVES
 INTRODUCTION An Airport Master Plan provides an evalua on of the airport s avia on demand and an overview of the systema c airport development that will best meet those demands. The Master Plan establishes
CHAPTER 4 DEMAND/CAPACITY ANALYSIS
 CHAPTER DEMAND/CAPACITY ANALYSIS INTRODUCTION The demand/capacity analysis examines the capability of the airfield system at Blue Grass Airport (LEX) to address existing levels of activity as well as determine
AERONAUTICAL SURVEYS & INSTRUMENT FLIGHT PROCEDURES
 AERONAUTICAL SURVEYS & INSTRUMENT FLIGHT PROCEDURES Current as of November 2012 ALASKA AVIATION SYSTEM PLAN UPDATE Prepared for: State of Alaska Department of Transportation & Public Facilities Division
Regional Jets ,360 A319/ , , , ,780
 Excel Tab Name: Seats (18 MAP) PASSENGER AIRLINE FLIGHT SCHEDULE CALCULATION RECORD Summary 17.2 MAP flight schedule* (with Southwest Airlines B737-800s changed to B737-700s) Number of Total Seats Avg.
Comparison Between Old and New ALUC Plans
 A P P E N I X H Comparison Between Old and New ALUC Plans OVERVIEW This Placer County Airport Land Use Compatibility Plan (ALUCP) sets forth land use compatibility criteria for the environs of Auburn Municipal,
Prepared By: Mead & Hunt, Inc Port Lansing Road Lansing, MI 48906
 Master Plan The preparation of this document was financed in part through a planning grant from the Federal Aviation Administration (FAA) as provided under Section 505 of the Airport and Airway Improvement
BELFAST MUNICIPAL AIRPORT OVERVIEW
 BELFAST MUNICIPAL AIRPORT OVERVIEW LOCATION AND HISTORY Belfast Municipal Airport (Federal Aviation Administration (FAA) airport code BST, International Civil Aviation Organization airport code KBST, FAA
SouthwestFloridaInternational Airport
 SouthwestFloridaInternational Airport SouthwestFloridaInternationalAirportislocatedinLee CountyalongtheGulfCoastofSouthFlorida,tenmiles southeastofthefortmyerscentralbusinessdistrict. Theprimaryhighwayaccesstotheairportfrom
APPENDIX H 2022 BASELINE NOISE EXPOSURE CONTOUR
 APPENDIX H 2022 BASELINE NOISE EXPOSURE CONTOUR This appendix sets forth the detailed input data that was used to prepare noise exposure contours for 2022 Baseline conditions. H.1 DATA SOURCES AND ASSUMPTIONS
Summary of Committee Discussion/Questions Metropolitan Transportation Services Senior Planner Russ Owen presented this item.
 Committee Report Business Item No. 2017-191 Transportation Committee For the Metropolitan Council meeting of September 13, 2017 Subject: Final Crystal Airport 2035 Long Term Comprehensive Plan (LTCP) Proposed
STAFF REPORT. Airport Land Use Consistency Determination Betteravia Plaza. MEETING DATE: January 21, 2016 AGENDA ITEM: 8D
 STAFF REPORT SUBJECT: Airport Land Use Consistency Determination Betteravia Plaza MEETING DATE: AGENDA ITEM: 8D STAFF CONTACT: Andrew Orfila RECOMMENDATION: Adopt findings for the Betteravia Plaza project
Airport Master Plan Update
 Duttchessss Countty Airrporrtt Masstterr Plan Updatte Airport Master Plan Update Final Report Dutchess County Airport Town of Wappingers, New York C&S Engineers, Inc. 499 Col. Eileen Collins Blvd. Syracuse,
System Oriented Runway Management: A Research Update
 National Aeronautics and Space Administration System Oriented Runway Management: A Research Update Gary W. Lohr gary.lohr@nasa.gov Senior Research Engineer NASA-Langley Research Center ATM 2011 Ninth USA/EUROPE
PLAN Anoka County - Blaine Airport
 Reliever Airports: NOISE ABATEMENT PLAN Anoka County - Blaine Airport INTRODUCTION The noise abatement plan for the Anoka County-Blaine Airport was prepared in recognition of the need to make the airport
Chapter 8.0 Implementation Plan
 Chapter 8.0 Implementation Plan 8.1 Introduction This chapter is the culmination of the analytical work accomplished in the previous chapters. The result is a prioritized list of the essential projects.
Airfield Design. Public Review Draft OVERVIEW BASIC DESIGN FACTORS. Airport Role
 Public Review Draft 3 Airfield Design OVERVIEW The Facilities Plan, Figure 3D, presents the recommended airfield improvements. The principal airfield design issues examined in this chapter are the optimal
Chapter Six ALP Drawings. Tacoma Narrows Airport. Master Plan Update
 Chapter Six ALP Drawings Master Plan Update The master planning process for the (Airport) has evolved through efforts in the previous chapters to analyze future aviation demand, establish airside and landside
SUBJECT: 2016 ANNUAL NOISE REPORT DATE: April 18, 2017 INFORMATION
 CITY OF SAN JOSE CAPITAL OF SILICON VALLEY Memorandum TO: HONORABLE MAYOR AND CITY COUNCIL FROM: Kimberly J. Becker SUBJECT: 2016 ANNUAL NOISE REPORT DATE: April 18, 2017 Approved Date 11ts 11* INFORMATION
Airport Master Plan for Montgomery-Gibbs Executive Airport PAC Meeting #3
 Airport Master Plan for Montgomery-Gibbs Executive Airport PAC Meeting #3 Agenda > Introductions > Public Meetings Overview > Working Paper 3 - Facility Requirements > Working Paper 4 - Environmental Baseline
RSAT RUNUP ANALYSIS 1. INTRODUCTION 2. METHODOLOGY
 RSAT RUNUP ANALYSIS 1. INTRODUCTION The FAA Runway Safety Action Team (RSAT) is a team of FAA staff that works with airports to address existing and potential runway safety problems and issues. The RSAT
Demand. Typical Building Area Functions and Facilities Commonly Found at General Aviation Airports:
 OVERVIEW The building area of an airport encompasses all of the airport property not devoted to runways, major taxiways, required clear areas, and other airfieldrelated functions. Typical facilities found
CHAPTER 4: ALTERNATIVES
 MSP Long Term Comprehensive Plan Update Metropolitan Airports Commission 4.1 INTRODUCTION CHAPTER 4: ALTERNATIVES Several alternatives were developed and evaluated based on their capability to meet the
Reliever Airports: NOISE ABATEMENT PLAN Flying Cloud Airport (FCM)
") Reliever Airports: NOISE ABATEMENT PLAN Flying Cloud Airport (FCM) INTRODUCTION The Noise Abatement Plan (FCM Plan) for the Flying Cloud Airport has been prepared in recognition of the need to make the
Reliever Airports: NOISE ABATEMENT PLAN Flying Cloud Airport (FCM) INTRODUCTION The Noise Abatement Plan (FCM Plan) for the Flying Cloud Airport has been prepared in recognition of the need to make the
1.0 Project Background Mission Statement and Goals Objectives of this Sustainable Master Plan
 TABLE OF CONTENTS CHAPTER 1 INTRODUCTION 10 Project Background 1-1 11 Mission Statement and Goals 1-1 12 Objectives of this Sustainable Master Plan 1-2 CHAPTER 2 INVENTORY 20 Airport Background 2-1 201
SECTION 5 ALTERNATIVE DEVELOPMENT CONCEPT ANALYSES
 SECTION 5 ALTERNATIVE DEVELOPMENT CONCEPT ANALYSES 5.1 INTRODUCTION This section investigates Airfield Development Alternatives, generalized Land Use Alternatives, and more detailed General Aviation Alternatives.
Bremerton National Airport Airport Master Plan Project Update February 12, 2013
 Bremerton National Airport Airport Master Plan Project Update February 12, 2013 Project Team Century West Engineering Northwest firm founded in 1969 500+ airport projects completed throughout the Pacific
ACTION TRANSMITTAL
 Transportation Advisory Board of the Metropolitan Council of the Twin Cities ACTION TRANSMITTAL 2018-16 DATE: February 9, 2018 TO: Transportation Advisory Board FROM: Technical Advisory Committee PREPARED
Background Data: Lincoln Regional Airport and Environs
 6 Background Data: and Environs INTRODUCTION /Karl Harder Field is a former military training airfield built during World War II on a mile-square section of open rangeland some three miles west of central
APPENDIX X: RUNWAY LENGTH ANALYSIS
 APPENDIX X: RUNWAY LENGTH ANALYSIS Purpose For this Airport Master Plan study, the FAA has requested a runway length analysis to be completed to current FAA AC 150/5325-4B, Runway Length Requirements for
MASTER PLAN CONCEPT 1 DRAFT
 The Airport Master Plan Update for Dallas Executive Airport has included the development of aviation demand forecasts, an assessment of future facility needs, and the evaluation of airport development