The UCD community has made this article openly available. Please share how this access benefits you. Your story matters!
|
|
|
- Michael McKenzie
- 6 years ago
- Views:
Transcription
1 Provided by the author(s) and University College Dublin Library in accordance with publisher policies., Please cite the published version when available. Title Characterisation of airline networks : a North American and European Comparison Authors(s) Reynolds-Feighan, Aisling J. Publication date Publication information Journal of Air Transport Management, 16 (3): Conference details Publisher Paper originally presented at the 48th Congress of the European Regional Science Association, University of Liverpool, United Kingdom, August 2008 Elsevier Link to online version Item record/more information Publisher's statement All rights reserved. Publisher's version (DOI) /j.jairtraman Downaloaded T09:16:11Z The UCD community has made this article openly available. Please share how this access benefits you. Your story matters! (@ucd_oa) Some rights reserved. For more information, please see the item record link above.
2 Characterisation of Airline Networks: a North American and European Comparison Aisling Reynolds-Feighan 1 School of Economics, University College Dublin, Belfield, Dublin 4, Ireland aisling.reynolds@ucd.ie Abstract This paper compares and contrasts the North American and European air transport markets using the extensive OAG Databases. The pattern of network development in the two continental regions is examined using data for the period The top 10 carriers in both regions are analysed closely in terms of network structures and the basic geographical characteristics of these networks are highlighted. In addition, different measures of air transport activity such as seating capacity, number of movements and number of routes are compared. Visualisations of carrier networks are presented to highlight the different network strategies operated by low cost carriers and full service carriers. It is shown that European carrier networks display many significant differences to North American carrier networks. European carriers generally organise their networks around one or two key nodes within the member state in which they are registered and generally do not operate interactive, continental-wide, multiple hub-and-spoke networks as do North American carriers. European and North American low cost carriers operate much more interconnected networks than full services carriers. Southwest Airlines stands out as operating a highly interconnected network compared to all other carriers. 1 Funding for this research was provided by the Irish Research Council for the Humanities and Social Sciences (IRCHSS). Thanks to David Pitfield and Kieran Feighan for very helpful and insightful comments on earlier versions of this paper. 1
3 Key words: airline networks; hub-and-spoke network; network visualisations; low cost carriers; full service carriers. Introduction This paper focuses on characterising airline networks using data derived from the comprehensive OAG Historical Max Plus databases over the period 1996 to In the paper, descriptive statistics and summary measures of activity for the North American and European air transport markets are presented in order to compare the two markets at a macro-level as well as at the firm level, using individual airline traffic information. The focus on carrier network structure attempts to capture aspects of carrier production plans and traffic flow organisation and thus represent measures of airline technology. Deregulation or liberalisation of air transport services has resulted in significant changes in the manner in which airlines operate and organise traffic flows through their networks. As the process of liberalisation continues apace in all continental regions of the world, it is important to examine the ways in which carrier networks are evolving and adapting to the new market environments. The pattern of network development in the two continental regions will be examined using data for the period The top 10 carriers in both regions will be examined closely in terms of network structures and the basic geographical characteristics of these networks will be highlighted. In addition, different measures of air transport activity such as seating capacity, number of movements and number of routes will be compared. Some conclusions on the differences and similarities between European and North American airline network structures will be outlined in the conclusions. 2
4 1. Approaches to characterising network structure & organisation Network structure is a critical aspect of firm behaviour for transportation service providers. The network represents the carrier s production plan and also the carrier s product offerings. The unit of supply for the carrier is a single airline movement. The unit of demand is smaller and heterogeneous. Passengers, or travel agents on their behalf, may purchase origin-destination flight services by joining together non-stop air transport movements offered by one or more carriers. Thus passengers on a given flight may be consuming that service in isolation, or as a complementary or substitutable service to other flights within the same or another carrier s network. Passengers can connect between flights and the costs of such indirect services may be spread between the passenger, the airport and the airline in varying degrees depending on the strategies, preferences and costs to these three actors in the market 2. In the US shortly after deregulation in the late 1970s for example, carriers organised their networks with high levels of passenger connections at so-called hub airports. This enabled carriers to greatly expand their product offerings (in terms of the origindestinations pairs served) with relatively modest increases in the number of flight segments offered. The surviving US carriers of 2008 have expanded greatly in size in the last three decades, with a small number of very large carriers now carrying the dominant share of domestic and US-originating international traffic. Carriers have 2 Keeping track of how passengers might travel between an origin-destination pair can be quite involved. For example, in the US Department of Transportation T-100 databases, the following types of scheduled air services are distinguished: (i) Non-stop service where the aircraft takes off from the passenger s origin point and lands at the passenger s destination point (ii) Connecting service, where the passenger changes aircraft between the origin and destination (iii) Offline Connection where the passenger changes aircraft and airline (iv) Online connection where the passenger changes aircraft but not airline (v) Direct service may be a 0, 1 or multiple stop service, but the passenger does not change aircraft (vi) Change of gauge, where the passenger changes aircraft but since the flight number does not change, it is not considered a connecting service. An excellent guide to US DOT airline data terminology may be found in the DataBase Products O&D Training Manual (2008) at 3
5 increased their total capacity through increasing frequency of service and expanding the number of non-stop flight segments offered. The greatly expanded volume of traffic has lead to increasing congestion at many large and medium airports. New entrant competitors, particularly the low-cost carriers (LCCs) offer direct or multistop services in competition with incumbent carriers direct and indirect service offerings. The LCCs in many instances have focused their network expansion on secondary airports in many of the larger urban areas. Outside North America, liberalisation of air transport has been taking place at varying temporal and geographical scales. International agreements liberalising air transport movements between major continental air transport systems have been negotiated with increasing pace in the last decade. Several studies have analysed European network structures using similar approaches and assumptions relating to the structure and motivations of European carriers (see for example Brueckner and Pels (2004), Berechman and dewit (1996) and Burghouwt et al (2003)). In these studies, European flag carrier networks are presented as broadly similar to US carrier networks in terms of the concentration in space and time of traffic flows in hub-and-spoke networks. However detailed comparative analyses of the structure and organization of traffic flow in European and North American airline networks have not been undertaken to date to validate the implicit assumptions that there are broad similarities between the two continental air transport systems and their carriers. Reynolds-Feighan (2008) presented a preliminary analysis of US and European Union Carriers and highlighted several key differences between the two 4
6 groups of carriers. In this paper, analysis is broadened to compare North American 3 and European 4 carriers and air transport systems using a variety of traffic measures. Seating capacity, aircraft movements and route structures at carrier airports are compared and contrasted. The geographical orientation of carrier networks are also focused and compared. 2. Comparison of North American and European Air Transport Systems The Official Airline Guide OAG Max Historical Plus databases contain daily airline schedules for every airline in every country. The database facilitates the generation of annual traffic distributions by carrier and airport for any given year. In this study, the annual traffic flows were generated for the North American market (NA) (traffic by NA and non-na carriers originating from all airports within NA, whether or not the destinations were NA based) and the European market (as defined earlier). Scheduled and non-scheduled movements and seats available on market segments with two or less stops, serviced by all categories of jet aircraft (including regional jets) are included. Airports and carriers with at least 1,000 seats in a one year period are counted. The datasets are very large and are available in January each year for the proceeding year s actual schedules. Annual data series were generated from the daily schedules 3 North America consists of Canada, USA, Greenland and Saint Pierre and Miquelon. 4 Europe is broadly defined and includes Austria, Belgium, Denmark, Faroe Islands, Finland, France, Germany, Gibraltar, Greece, Iceland, Ireland, Italy, Luxembourg, Malta, Monaco, Netherlands, Norway, Portugal, Spain, Sweden, Switzerland, United Kingdom, Cyprus, Turkey, Albania, Armenia, Azerbaijan, Bosnia and Herzegovina, Bulgaria, Belarus, Croatia, Czech Republic, Estonia, Georgia, Hungary, Latvia, Lithuania, Macedonia (Former Yugoslav Republic), Moldova Republic of, Montenegro, Poland, Romania, Russian Federation, Serbia, Slovenia, Slovakia, Ukraine. This categorization of Europe is based on IATA definitions of the region. 5
7 for all air transport services transporting passengers on jet equipment for all airports and carriers worldwide. A traffic matrix detailing every carrier and airport for each continental region was constructed for each of the years 1996 to Using the results of the annual data series allows construction of route adjacency matrices for each airline operating in the NA and European market in a given calendar year. The use of annual series removes errors or bias associated with monthly or seasonal variations in flight services. The inclusion of all jet services, including regional jets gives a comprehensive view of the industry particularly in North America where increasing proportions of services are provided using these aircraft. The OAG Max Historical Plus databases allow for direct comparison of NA and European air transport sectors because these data are drawn from a single comprehensive census of flight schedules. Table 1 shows the number of carriers and airports and total air traffic activity for Europe and North America in 1996, 2000, 2004 and 2008, derived from the OAG databases. The North American market is considerably larger than the European market though the difference in size has narrowed significantly in the last 12 years. The North American market had 86% more movements than the European market in 2008, and 44% more seating capacity. This difference is explained by the increasing use of regional jets by North American carriers in the five years. The steady increase in the number of airports receiving jet air services in Europe from 1996 onwards is noted. There were 81 more airports in Europe receiving jet air services in 2008 than were receiving such services in The process of European air transport liberalisation reached a critical phase in April 1997 with the full 6
8 liberalisation of domestic (cabotage) and cross-border air services within the single European market. Seating capacity increased by a very substantial 4% per annum over the period 1996 to 2008 in the larger European area considered in this study. The increase in movements was slightly higher, giving rise to a decline in the number of seats per movement in the period , with average seats increasing again in the period. The number of carriers grew rapidly also in the period, but has sharply declined in the last four years. The total number of carriers in Europe is still substantially greater than the number operating in North America. In North America, new entrants provided service to the industry in the period, but due to consolidations and financial failures, the total number of jet operators has fallen again to 37 in The number of North American airports receiving jet services increased in the period, with the average aircraft size (number of seats per movement) falling rapidly in the same period. This reflects the growing emphasis on regional jet service by the larger carriers. While the total volume of air transport movements increases particularly in the period, the overall seating capacity fell by 10% between 2000 and Comparison of North American and European Top 10 Carriers, The top 10 carriers in Europe and North America were selected for each of the years 1996, 2000, 2004 and 2008 in order to compare individual carrier changes in the two continental systems. The airline codes used in the figures and tables are set out in the appendix at the end of the paper. Figures 1 and 2 summarise the activity of the 20 carriers in In Figure 1, the total departure seating capacity of carriers in
9 and 2008 are shown. Figure 2 shows aircraft movements as well as the number of airports served for each of the top 10 carriers in North American carriers are significantly larger than European carriers in 1996 and 2008; there are many smaller carriers with much smaller capacity operating in Europe as was seen in Table 1. Since deregulation in the US in the late 1970s, there has been considerable consolidation in the industry despite several waves of new entrants to the market in the 1980s and early and late 1990s. The seating data and movements data present very similar trends. The network size of North American carriers is also generally larger than European carriers, though the North American LCCs, Southwest (WN) and AirTran (FL) have a smaller network of airports than all of the European carriers. Three of the top 10 carriers in Europe in 2008 were LCCs, namely Ryanair (FR), Easyjet (U2) and Air Berlin (AB). In Figure 1 in 1996, there were 4 European carriers (Alitalia (AZ), Aeroflot (SU), Air Inter (IT) and Swiss Air (SR)) in the top 10 that have since been surpassed in terms of traffic by the LCCs, no longer operate or have been taken over by other carriers. Alitalia experienced a significant fall in seating capacity between 1996 and 2008, placing it outside the top 10 in Three of the larger European FSCs, Lufthansa (LH), Air France (AF), and SAS (SK) increased their seating capacity during the same period. For the North American carriers, Continental (CO) and Delta (DL) recorded a significant fall in their seating capacity between 1996 and Southwest stands out clearly as the only carrier in the North American top 10 to substantially increase its capacity in this time period. 8
10 Figure 3 shows the proportion of traffic at the busiest airport in each carrier s network in 2008, and between 1996 and Generally, the European carriers have a higher proportion of their total seating capacity departing from their top hub or operational base. Despite liberalisation in Europe, most of the former flag carriers still have single hub networks focused around their national capital or largest city airports. The exceptions are the European LCCs, where between 10 and 15% of total seating capacity is operated from the top ranked airport in the carrier s system. Between 1996 and 2008, the share of total traffic at the top airport increased for North American FSCs. For four of the European flag carriers, KLM, Turkish Airline, Iberia and BA, the share of traffic at the top airport also increased. The LCCs in both regions experienced significant change with a substantial fall in the traffic share of the top airport in the networks of AirTran, Ryanair and Easyjet and Southwest Airlines. Southwest Airlines stands out as following a different trend with by far the lowest proportion of total traffic at the carrier s top airport and a decline in that proportion between 1996 and TWA (TW) and AmericaWest (HP) were among the top 10 carriers in North America in 1996, with TWA having the highest proportion of total traffic at its St Louis (STL) hub in that year. TWA was taken over by American Airlines in 2001 and much of the TWA transfer traffic was rerouted through American s secondary hub at O Hare Airport in Chicago (ORD). The LCCs in Europe and North America were much smaller in For AirTran (FL), Easyjet (U2) and Ryanair (FR), these carriers had a considerably higher share of their total traffic departing from their top airport in 1996 than for As these 9
11 carriers have grown and expanded their networks, they have tended to spread their capacity and routes more evenly across other airports in their networks. Figure 4 shows the average number of seats available per passenger aircraft movement among the top 10 carriers in 1996 and As was seen in the aggregate data in Table 1, European carriers generally have a higher number of passengers per movement than North American carriers. There was a fall in the average seats per movement between 1996 and In North America, there is smaller variation among the top 10 carriers in the average number of seats per movement, with Southwest (WN) and AirTran (FL) having the highest and third highest levels in 2008 respectively. The growing emphasis on regional jets to increase service frequency among North American carriers can be observed clearly for carriers like Delta (DL), Northwest (NW), Continental (CO) and American Airlines (AA). 4. Carrier network structures a comparative analysis In order to explore differences in network structure between the European and North American carriers, the top airports in each carrier s network were identified and the intervening physical distances were recorded. Figure 5 summarises this information for the top two airports for North American and European carriers, while Tables 2 and 3 report on the top five airports for each of the carriers. Table 2 gives information on the location, percentage of total departure seating capacity and number of routes from each European carrier s top five airports in 1996 and in Table 3 gives the same details for North American carriers. 10
12 In order to highlight spatial aspects of network structure and organisation, Figures 6 and 7 map the top five airports in selected European and North American carriers networks in The European carriers generally tend to focus their networks around two airports within the member state in which they are registered. For Air France and BA for example, the top 2 airports are located in the capital cities of Paris (CDG and ORY) and London (LHR and LGW). Indeed for Air France, the top 9 airports in its system are French mainland airports, while for BA, 6 of the top 8 are located in the UK. There is some specialisation in the types of services operated from the top two airports, but both carriers operate a mix of short haul and long haul international services from their top two airports. Easyjet as a relatively new European LCC follows the same pattern, with its top 2 airports located in London at Gatwick (LGW) and Luton (LTN), and its top 5 airports located in the UK (see Figure 6). For BA, Air France (AF) and Easyjet (U2), there are no flights between the top two airports in their networks. Air Berlin (AB) is the second of three LCCs in the European top 10 and this carrier too has four of its five top airports in Germany, where it is registered. Air Berlin s top airport is Palma Mallorca (PMI) and just less than 8% of total airline seating capacity is allocated to the Palma (PMI) Dusseldorf (DUS) route. As can be seen in Figure 6, Lufthansa (LH), Turkish Airlines (TK) and Iberia (IB) have most of their top airports within their home state. For the selected European carriers, the clustering of top airports within the national territory is very clear. The relatively short distance between top airports in Europe contrasts sharply with the continental wide spread of top airports in North American carrier networks in Figure 11
13 7. For SAS (SK), because this airline was established as the jointly owned airline for the three Scandinavian countries, Norway, Sweden and Denmark, the top five airports are located in three different states. Traffic and routes are distributed evenly across the top three airports one in each of the Scandinavian countries. Geographically however, the top three airports are still very close to each other. KLM (KL) is a relatively large carrier from a relatively small European state and its single national hub is the focus for its route and traffic network. Amsterdam accounts for 48% of all of KLM s departure seating capacity, with the airline s second ranked airport (in terms of seating capacity), London Heathrow (LHR), having just one route to Amsterdam. Ryanair (FR) is the only top 10 European carrier to have its top airports spread across multiple states. The distribution of capacity across the top five airports is more even than for most other European carriers. In general then, the European carriers operate regional networks focused on their home state markets and link the state capitals or largest cities to domestic, European and long haul international destinations. Two of the three LCCs operate a similar strategy to the former European flag carriers. The North American carriers have much greater distances between their top two airports and for most FSCs, this reflects the fact that traffic is organised around regional hubs, with high volumes of traffic between hubs in the network. The surviving North American FSCs of 2008 have become very large airlines, with most 12
14 of the top 10 carriers having undergone mergers or takeovers in the last 10 years. The data in Tables 1 and 2 relate to the calendar year of 2008: In Late October 2008, Delta Airlines merged with Northwest Airlines and will complete reorganisation, integration and rebranding under the Delta banner by United Airlines had been in merger talks with US Airways and later Continental Airlines during To date (June 2009), no merger has been agreed. In 2002, following the takeover of TWA by American Airlines (AA), the carrier s third ranked airport was Lambert Field, St Louis (STL), the former TWA hub. This airport s traffic was reorganised in the following two years, so that by 2004, St Louis ranked 8 th busiest airport in American Airline s system. In Table 3, it is noted that American Airline s top 5 airports are the same in 1996 and 2008: hiding the absorption and re-organisation of traffic flows in the intervening years following the 2001 TWA merger. Air Canada took over Canadian Airlines in 2001 and the new entity grew traffic at the top five airports listed in Table 2. Canadian Airlines had focused its network around four of these five airports. The number of routes operated from Air Canada s top airport has increased from 63 in 1996 to 105 in Between 1996 and 2008, all but two of the top 10 carriers in North America increased the proportion of total seating capacity at their top airport. The exceptions were AirTran (FL) and Southwest Airlines (WN). Traffic at AirTran s top five airports accounted for 29% of seating capacity in 1996, with this value dropping to 25.6% in For Southwest Airlines, three of the top five airports changed over this period and the number of routes operated from the top five in 2008 were the same (62) for four of the five airports. Baltimore, the fifth airport, had 60 routes in In Europe 13
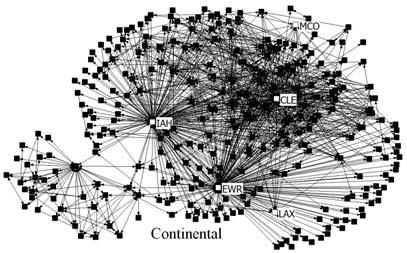
15 also, the LCCs, Ryanair and Easyjet recorded a decline in the proportion of traffic at their top 5 airports, as both carriers rapidly and extensively expanded their networks in the period. Reynolds-Feighan (2007) noted that deregulation in the US in the late 1970s had resulted in a sustained contraction in the network of airports receiving jet services. In the European Union, liberalisation resulted in a substantial expansion in the number of airports receiving jet services. The European national or flag carriers had focused on developing single or dual national hubs that connected the home country with European and worldwide destinations. The North American carriers by contrast focused on developing domestic networks, serving regional and intercontinental markets using regional hubs. During the 1990s and more recently, the North American carriers have focused on linking their substantial domestic networks to increasing numbers of international destinations, while reducing domestic capacity by using smaller aircraft with the same or higher frequencies of service. The North American carriers operate multiple hub-and-spoke networks. There are generally 4 or 5 key airports in the network around which connections are focused. Southwest operates a different strategy, with high levels of direct connections between all of the airports in its network. To illustrate differences in the network strategy, the pattern of route connections was drawn using the NetDraw software. Figure 8 illustrates the networks of 6 of the top 10 European carriers of The Air France (AF) and BA (BA) networks have 2 distinct hubs with a relatively small share of overlapping destinations. However, it was shown in Figure 5 that the distance between the top two airports for these carriers 14
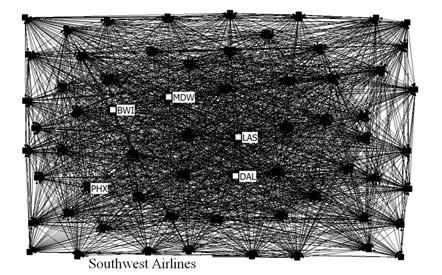
16 was less than 50km. Thus the BA and Air France networks are more similar to the star (single hub) KLM (KL) and Turkish Airlines (TK) networks illustrated in Figure 8. Where KLM and Turkish have one dominant hub, BA and Air France have one dominant city, with traffic split between two airports. Ryanair (FR) and Easyjet (U2) have more interconnected networks, although the dominance of the top airports is still clearly evident in the illustration. The networks for these two LCCs are quite different to the other European carriers because of the relatively high level of interconnectedness. The visualisations presented in Figure 8 have no geographic properties and purely illustrate the set of connections for both of the carriers. Thus for example, London Heathrow (LHR) is located east of Amsterdam (AMS) which has been placed at the centre of the KLM illustration. Figure 9 presents visualisations for 6 of the top 10 North American carriers. American Airlines (AA), United Airlines (UA) and Continental Airlines (CO) are considerably larger networks than any of the European carriers. The illustrations identify the top five airports for each carrier described in Tables 2 and 3 (i.e. based on departing seating capacity). The networks of American, United and Continental Airlines consist of a series of interactive hub-and-spoke subsystems, or interacting wheels centred on a small number of hubs. The Air Canada (AC) network shows one dominant hub, with a series of small hubs and overlaps between these hub-and-spoke subsystems and is more similar to the European flag carrier networks. The AirTran (FL) network shows a different pattern as does the Southwest illustration. AirTran shows a relatively high degree of overlap among all nodes in the network with the top 5 airports being very much less visible compared with the FSCs. The AirTran networks looks similar to Ryanair s network. 15
17 Southwest has a high degree of overlap among all of the nodes in the network. The set of routes is very dense because of the high proportion of direct routes between the 62 nodes in this carrier s network. This pattern is very different to all of the other North American and European carriers illustrated. 5. Summary and conclusions There are clear differences between the European and North American air transport markets from the proceeding analysis. The size and scale of North American carrier operations is far greater than that of European carriers. There are also clear differences in network structure and traffic organisation. The examination of basic geographical aspects of carrier networks and review of descriptive statistics for the airports in each carrier s network is a critical part of the analysis of the two continental markets. European carriers were shown to operate networks focused on airports within the member state in which the carrier is located, and linking that member state to a large number of other domestic, European and international destinations. European carriers do not operate the interactive hub-and-spoke networks that became popular among FSCs in the US following deregulation in Despite over 10 years since full liberalisation of the European Union s single air transport market, European FSC s networks are still focused around key national capitals or largest cities. It is expected that there will be consolidation in the European industry over the next decade, as Europe has a large number of relatively small carriers. The analysis presented in this paper can be updated to identify changes in network organisation in Europe as this consolidation takes place. 16
18 This paper has set out clear illustrations of key geographical aspects of carrier networks that are distinctive and different when compared for European and North American carriers. Further research is needed to links the characteristics identified in this paper with those captured in summary measures of network activity. The visualisations of carrier networks help to highlight key differences between LCC and FSC networks, and also between European and North American FSCs. The visualisations illustrate the extent of interconnectedness among routes within a carrier s network. This tool in conjunction with the mapping of the top airports highlighted important geographical and spatial aspects of carrier network structures. Appendix Carrier Codes and Country of Registration Europe: Carrier Country of Registration Carrier Code Carrier Name AB Air Berlin Germany AF Air France France BA British Airways United Kingdom FR Ryanair Ireland, Republic of IB Iberia Spain IT Air Inter Europe France KL KLM-Royal Dutch Airlines Netherlands LH Lufthansa German Airlines Germany SK SAS Scandinavian Airlines Sweden SR Swissair Switzerland SU Aeroflot Russian International Airlines Russian Federation TK Turkish Airlines Turkey U2 Easyjet United Kingdom North America: Carrier Code Carrier Name Carrier Country of Registration AA American Airlines USA AC Air Canada Canada AS Alaska Airlines USA CO Continental Airlines USA 17
19 DL Delta Air Lines USA FL Airtran Airways USA HP America West Airlines USA NW Northwest Airlines USA TW Trans World Airlines USA UA United Airlines USA US US Airways USA WN Southwest Airlines USA References Alderighi, Cento, Nijkamp & Rietveld (2007) Assessment of new hub-and-spoke and point-to-point airline network configurations, Transport Reviews 27 (5), pp Brueckner, J. (2002) Airport Congestion When Carriers Have Market Power American Economic Review 92, (December 2002). Brueckner, J. & E. Pels (2005), European airline mergers, alliance consolidation, and consumer welfare, Journal of Air Transport Management, 11(1), pp Burghouwt, G. & J. de Wit (2005), Temporal configurations of European airline networks,journal of Air Transport Management 11 (3), pp Burghouwt, G., J. Hakfoot & J.R. VanEck (2003), The spatial configuration of airline networks in Europe, Journal of Air Transport Management, 9(5), pp FAA (1999) Airport Activity Statistics of Certificated Air Carriers, United States Federal Aviation Administration, Washington D.C. Guimerà, R., S. Mossa, A. Turtschi & L.A.N. Amaral, (2005), The worldwide air transportation network: anomalous centrality, community structure, and cities' global roles, Proceedings of the National Academy of Sciences 102, Martín, J.C., Voltes-Dorta, A. (2008), Theoretical evidence of existing pitfalls in measuring hubbing practices in airline networks, Networks and Spatial Economics, 8 (2-3), pp Martins, J.C. & A. Voltes-Dorta, (2009) A note on how to measure hubbing practices in airline networks Transportation Research Part E: Logistics and Transportation Review, 45(1), pp Reynolds-Feighan, A.J. (2007), Competing networks, spatial and industrial concentration in the US airline industry, Spatial Economic Analysis 2 (3), pp
20 Year Table 1: Basic Descriptive Statistics Comparing European and North American Air Transport Number of European Registered Carriers Number of Airports % Change in Number of Airports (4 year intervals) Seating Capacity ( 000) Europe % Change in Seating Capacity (4 year intervals) Movements % Change in Movements Average number of Seats per Movement % Change in Average Number of Seats per Movement (4 year intervals) ,796 3,865, , ,813, , ,420, , ,841, Year Number of North American Registered Carriers Number of Airports % Change in Number of Airports (4 year intervals) Seating Capacity ( 000) North America % Change in Seating Capacity (4 year intervals) Movements % Change in Movements Average number of Seats per Movement % Change in Average Number of Seats per Movement (4 year intervals) ,304,991 9,522, ,382, ,440, ,286, ,261, ,233, ,905, Source: Authors calculations based on OAG Max Historical Plus databases
21 Table 2: Top Five Airports for 2008 European Top 10 Carriers, 1996 and 2008 Carrier Airport Airport Code Airport Location Percentage of Total Seating Capacity Number of Routes Average distance (km) between Top 5 Airports Airport Code Number of Routes Percentage of Total Seating Capacity AB Palma Mallorca PMI Spain Dusseldorf International DUS Germany km Berlin Tegel TXL Germany Munich International MUC Germany Hamburg HAM Germany AF Paris Charles de Gaulle CDG France CDG Paris Orly ORY France km ORY Lyon Saint Exupery LYS France LHR Toulouse Blagnac TLS France NCE Nice NCE France LIN BA London Heathrow LHR United Kingdom LHR London Gatwick LGW United Kingdom km /383 km - Europe only LGW Johannesburg O.r. JNB South Africa CDG Tambo International Edinburgh EDI United Kingdom BHX New York J F Kennedy JFK USA MAN International FR London Stansted STN United Kingdom DUB Dublin DUB Ireland Republic of km STN Gerona GRO Spain PIK Milan Orio al Serio BGY Italy MAN Frankfurt Hahn HHN Germany BHX IB Madrid Barajas MAD Spain MAD Barcelona BCN Spain km BCN Valencia (ES) VLC Spain SVQ Paris Orly ORY France VLC Bilbao BIO Spain SCQ
22 KL Amsterdam AMS Netherlands AMS London Heathrow LHR United Kingdom km/370 km - LHR Europe only Guayaquil GYE Ecuador SIN Paris Charles de Gaulle CDG France CUR Bonaire BON Netherlands Antilles LIN LH Frankfurt International FRA Germany FRA Munich International MUC Germany km MUC Dusseldorf International DUS Germany DUS Hamburg HAM Germany HAM Berlin Tegel TXL Germany TXL SK Copenhagen CPH Denmark ARN Oslo OSL Norway km CPH Stockholm Arlanda ARN Sweden FBU Trondheim Vaernes TRD Norway GOT Bergen BGO Norway BGO TK Istanbul Ataturk IST Turkey IST Ankara Esenboga ESB Turkey km ESB Izmir Adnan Menderes ADB Turkey ADB Antalya AYT Turkey ADA Adana ADA Turkey AYT U2 London Gatwick LGW United Kingdom LTN London Luton LTN United Kingdom km EDI London Stansted STN United Kingdom AMS Belfast International BFS United Kingdom GLA Bristol BRS United Kingdom NCE
23 Table 3: Top Five Airports for 2008 North American Top 10 Carriers, 1996 and 2008 Carrier Airport Airport Code Airport Location Percentage of Total Seating Capacity Number of Routes Average distance (km) between Top 5 Airports Airport Code Number of Routes Percentage of Total Seating Capacity AA Dallas/Fort Worth Intl DFW USA DFW Chicago O'Hare Int'l ORD USA km ORD Miami Int'l MIA USA MIA Los Angeles Int'l LAX USA LAX New York J F Kennedy Int'l JFK USA JFK AC Toronto Lester B Pearson Intl YYZ Canada YYZ Vancouver Int'l YVR Canada km YVR Montreal Pierre Elliott Trudeau Int YUL Canada YUL Calgary YYC Canada YYC Ottawa Mcdonald Cartier Intl YOW Canada YOW AS Seattle/Tacoma Int'l SEA USA SEA Anchorage Int'l ANC USA km PDX Portland (US) OR PDX USA ANC Los Angeles Int'l LAX USA LAX San Francisco Int'l SFO USA OAK CO Houston George Bush Intercontinental Ap IAH USA IAH Newark Liberty Int'l EWR USA km EWR Cleveland Hopkins Int'l CLE USA PHX Los Angeles Int'l LAX USA CLE Orlando Int'l MCO USA LAX DL Atlanta Hartsfield-jackson Intl ATL USA ATL Salt Lake City SLC USA km CVG Cincinnati Northern Kentucky Intl CVG USA SLC New York J F Kennedy Int'l JFK USA DFW Los Angeles Int'l LAX USA LAX
24 FL Atlanta Hartsfield-jackson Intl ATL USA MCO Orlando Int'l MCO USA km SWF Baltimore Washington Int'l BWI USA TYS Boston Logan Int'l BOS USA GSP New York La Guardia LGA USA DAY NW Detroit Wayne County DTW USA DTW Minneapolis Int'l MSP USA km / 1865 MSP km - NA only Memphis Int'l MEM USA MEM Tokyo Narita NRT Japan NRT Los Angeles Int'l LAX USA LAX UA Chicago O'Hare Int'l ORD USA ORD Denver Intl DEN USA km DEN Washington Dulles Int'l IAD USA SFO San Francisco Int'l SFO USA LAX Los Angeles Int'l LAX USA IAD US Charlotte CLT USA CLT Philadelphia Int'l PHL USA km PIT Phoenix Sky Harbor Intl PHX USA PHL Washington Ronald Reagan National DCA USA BOS Las Vegas McCarran Int'l LAS USA LGA WN Chicago Midway MDW USA PHX Las Vegas McCarran Int'l LAS USA km HOU Phoenix Sky Harbor Intl PHX USA LAS Baltimore Washington Int'l BWI USA OAK Dallas/Fort Worth Love Field DAL USA LAX
25 Figure 1: Departure Seating Capacity 1996 & 2008, Top 10 European & North American Carriers 300 Available Seating Capacity (Millions) LH AF FR BA U2 IB SK AB KL TK WN AA DL UA US NW CO AC FL AS Carrier Code EU Se at s '08 NA Se ats ' Available Seating Capacity (Millions) LH BA AZ SK SU AF IB IT KL SR TK FR U2 WN DL AA UA NW HP US CO TW AS AC FL Carrier Code EU Se at s '96 NA Se ats '96
26 Figure 2: Departure Movements and Number of Airports served, Top 10 European & North American Carriers Total Movements Thousands LH AF FR BA U2 IB SK AB KL WN TK AA Carrier Code DL UA US CO NW AC FL AS EU Movements NA Movements Airports Served (Dom & Int'l) LH BA AF TK FR KL IB SK U2 AB DL AA UA AC WN CO NW US AS FL Carrier Code EU Carrier Network NA Carrier Network
27 Figure 3: Proportion of Departure Seating Capacity from Carriers Busiest Hub, 1996 & Proportion of total seating capacity KL TK IB BA AF LH SK FR AB U2 FL AC AS DL CO AA UA NW US WN Carrier Code EU Top Hub '08 NA Top Hub ' Proportion of total seating capacity U2 FR SR KL AF IT TK AZ BA LH SK IB SU FL TW AS HP UA CO WN AC DL AA NW US Carrier Code EU Top Hub '96 NA Top Hub '96
28 Figure 4: Average Seats Per Aircraft Movement, Top 10 European & North American Carriers, 1996 & 2008 Top 10 European & North American Carriers, 2008 Average Passengers per Movement KL BA FR AF AB LH TK U2 IB SK WN AS FL AC UA AA CO NW DL US Carrier Code EU Avg Pax/AC '08 NA Avg Pax/AC '08 Top 10 European & North American Carriers, 1996 Average Passengers per Movement KL BA AZ IB AF SR LH IT SU SK UA AA TW CO NW DL HP WN US AS Carrier Code EU Avg Pax/AC '96 NA Avg Pax/AC '96
29 Figure 5: Distance between the top two airports in carrier networks, 1996 & 2008 Carrier -Top 2 Airports (a) 2008 AF - CDG BA - LHR U2 - LGW LH - FRA TK - IST KL - AMS FR - STN IB - MAD SK - CPH AB - PMI FL - ATL US - CLT NW - DTW AA - DFW UA - ORD CO - IAH AS - SEA WN - MD DL - ATL AC - YYZ ORY LGW LTN MUC ESB LHR DUB BCN OSL MCO PHL MSP DUS ORD DEN EWR ANC LAS SLC YVR Distance (km) EU Top 2 Airports NA Top 2 Airports (b) 1996 Carrier -Top 2 Airports AF - CDG BA - LHR SU - SVO SR - ZRH LH - FRA KL - AMS AZ - FCO IB - MAD SK - ARN IT - ORY AS - SEA US - CLT DL - ATL NW - DT AA - DFW UA - ORD TW - STL HP - PHX WN - PHX CO - IAH ORY LGW DME GVA MUC LHR LIN BCN CPH MRS PDX PIT CVG MSP ORD DEN JFK IAH HOU EWR Distance (km) EU Top 2 Airports NA Top 2 Airports
30 Figure 6: Top 5 airports in selected European carrier networks in 2008 XY F F F FF " R XY R ^ XY XY ^ ^ ^ ^ XY Carrier Code R AF " IB ^ LH XY SK G TK U2 F " R R " " " G G G G G Kilometers ,480
31 Figure 7: Top 5 airports in selected North American carrier networks in 2008!! )( _# ( _# )# )# ( G( _!!! )( _# G_ G G Kilometers ,100 2,200 G ) Airline Top 5 Airports Carrier Code: ) AA! AC ( DL G FL _ US # WN


32 Figure 8: Visualisation of European Airlines Linkage Structure, 2008


33 Figure 9: Visualisation of North American Airlines Linkage Structure, 2008
Intra-European Seat Capacity. January February March April May June July August September October November December. Intra-European Sectors Flown
 ASK's (Million) Sectors Departing Seats 80,000,000 Intra-European Seat Capacity 70,000,000 60,000,000 50,000,000 40,000,000 30,000,000 20,000,000 10,000,000 0 January February March April May June July
Global September 2014
 Jan-13 Feb-13 Mar-13 Apr-13 May-13 Jun-13 Jul-13 Aug-13 Sep-13 Oct-13 Nov-13 Dec-13 Jan-14 Feb-14 Mar-14 Apr-14 May-14 Jun-14 Jul-14 Aug-14 Sep-14 Low cost Oneworld Skyteam Star Alliance Other Billion
Global Seat Capacity July. May. June. Global Sectors Flown July. May. June %
 Jan-14 Feb-14 Mar-14 Apr-14 May-14 Jun-14 Jul-14 Aug-14 Sep-14 Oct-14 Nov-14 Dec-14 Jan-15 Feb-15 Mar-15 Apr-15 May-15 Low cost Oneworld Skyteam Star Alliance Other Billion ASKs - YTD January February
Global Seat Capacity May. June. July. Global Sectors Flown May. June. July
 Global Departing Seats (Millions) 5 45 4 35 3 25 2 15 5 4.6% 5.4% 6.3% 5.6% 5.4% 6.2% 6.8% 6.1% Global Seat Capacity 214 215 January February March April May June July August September October November
Global Seat Capacity July. May. June. Global Sectors Flown July. May. June %
 Jan-14 Feb-14 Mar-14 Apr-14 May-14 Jun-14 Jul-14 Aug-14 Sep-14 Oct-14 Nov-14 Dec-14 Jan-15 Low cost Oneworld Skyteam Star Alliance Other Billion ASKs - YTD January February March April May June July August
World Class Airport For A World Class City
 World Class Airport For A World Class City Air Service Update October 2017 2017 Air Service Updates February 2017 Cleveland new destination, 2x weekly Raleigh-Durham new destination, 2x weekly March 2017
TravelWise Travel wisely. Travel safely.
 TravelWise Travel wisely. Travel safely. The (CATSR), at George Mason University (GMU), conducts analysis of the performance of the air transportation system for the DOT, FAA, NASA, airlines, and aviation
ACI 2008 WORLDWIDE AIRPORT TRAFFIC STATISTICS
 WORLD AIRPORT RANKING BY TOTAL PASSENGERS TOTAL PASSENGERS 1 ATLANTA GA ATL 90 039 280 0.7 2 CHICAGO IL ORD 69 353 876 ( 9.0) 3 LONDON LHR 67 056 379 ( 1.5) 4 TOKYO HND 66 754 829 ( 0.2) 5 PARIS CDG 60
World Class Airport For A World Class City
 World Class Airport For A World Class City Air Service Update April 2017 2017 Air Service Updates February 2017 Cleveland new destination, 2x weekly Raleigh-Durham new destination, 2x weekly March 2017
Passengers Boarded At The Top 50 U. S. Airports ( Updated April 2
 (Ranked By Passenger Enplanements in 2006) Airport Table 1-41: Passengers Boarded at the Top 50 U.S. Airportsa Atlanta, GA (Hartsfield-Jackson Atlanta International) Chicago, IL (Chicago O'Hare International)
World Class Airport For A World Class City
 World Class Airport For A World Class City Air Service Update December 2018 2018 Air Service Updates February 2018 Delta Air Lines Seattle new departure, seasonal, 2x weekly Delta Air Lines Boston new
World Class Airport For A World Class City
 World Class Airport For A World Class City Air Service Update April 2018 2018 Air Service Updates February 2018 Seattle new departure, seasonal, 2x weekly Boston new departure, seasonal, 2x weekly March
Rankings of Major U.S. Airports. Total Passengers 2016
 Rankings of Major U.S. Airports Total Passengers Total Passengers (Millions) 1 Hartsfield Atlanta Int'l (ATL) Atlanta 104.2 2.6 2 Los Angeles Int'l (LAX) Los Angeles 80.9 8.0 3 O'Hare Int'l (ORD) Chicago
OAG FACTS April Western European Domestic Air Markets
 OAG FACTS April 2014 This month carriers will add 16.1 million seats to their networks compared to April 2013, an increase in seat capacity of 5%. Average aircraft size continues to grow as frequencies
Rankings of Major U.S. Airports. Total Passengers 2017
 Rankings of Major U.S. Airports Total Passengers Total Passengers (Millions) 1 Hartsfield Atlanta Int'l (ATL) Atlanta 103.9-0.3 2 Los Angeles Int'l (LAX) Los Angeles 84.6 4.5 3 O'Hare Int'l (ORD) Chicago
Merge or Perish: Irish Aviation in a Rapidly Changing Global Market
 Merge or Perish: Irish Aviation in a Rapidly Changing Global Market Professor Aisling Reynolds-Feighan UCD School of Economics UL Kemmy Business School Third Annual Tourism Policy Workshop, November 2-4,
assists in the development of airport capacity to meet growing demand supports the development of improved ground access to airports
 ATAG The Air Transport Action Group (ATAG) is a coalition of organisations from throughout the air transport industry, formed to press for economically beneficial aviation capacity improvements in an environmentally
2016 Air Service Updates
 Air Service Update September 2016 2016 Air Service Updates February 2016 Pittsburgh new destination, 2x weekly April 2016 Los Angeles new departure, 1x daily Atlanta new departure, 1x daily Jacksonville
2016 Air Service Updates
 Air Service Update May 2016 2016 Air Service Updates February 2016 Pittsburgh new destination, 2x weekly April 2016 Los Angeles new departure, 1x daily Atlanta new departure, 1x daily Jacksonville new
Global Aviation Monitor (GAM)
") Global Aviation Monitor (GAM) Analysis and Short Term Outlook of Global, European and German Air Transport Main Results of Global Air Transport Supply Analysis and Outlook Background: Covers about 3,500
Global Aviation Monitor (GAM) Analysis and Short Term Outlook of Global, European and German Air Transport Main Results of Global Air Transport Supply Analysis and Outlook Background: Covers about 3,500
Global Aviation Monitor (GAM)
") Global Aviation Monitor (GAM) Analysis and Short Term Outlook of Global, European and German Air Transport Main Results of Global Air Transport Supply Analyses and Outlook Background: Covers about 3.5
Global Aviation Monitor (GAM) Analysis and Short Term Outlook of Global, European and German Air Transport Main Results of Global Air Transport Supply Analyses and Outlook Background: Covers about 3.5
Supportable Capacity
 Supportable Capacity Objective Understand Network Planning and Capacity Management How the game is played How fleet impacts the playing field Why it is flawed 2 Route Economic Fundamentals Airlines compete
2016 Air Service Updates
 Air Service Update June 2016 2016 Air Service Updates February 2016 Pittsburgh new destination, 2x weekly April 2016 Los Angeles new departure, 1x daily Atlanta new departure, 1x daily Jacksonville new
2016 Air Service Updates
 2016 Air Service Updates February 2016 Pittsburgh new destination, 2x weekly April 2016 Los Angeles new departure, 1x daily Atlanta new departure, 1x daily Jacksonville new destination, 2x weekly Philadelphia
Global Aviation Monitor (GAM)
") Global Aviation Monitor (GAM) Analysis and Short Term Outlook of Global, European and German Air Transport Main Results of Global Air Transport Supply Analysis and Outlook Background: Covers about 3,500
Global Aviation Monitor (GAM) Analysis and Short Term Outlook of Global, European and German Air Transport Main Results of Global Air Transport Supply Analysis and Outlook Background: Covers about 3,500
Global Aviation Monitor (GAM)
") Global Aviation Monitor (GAM) Analysis and Short Term Outlook of Global, European and German Air Transport Main Results of Global Air Transport Supply Analysis and Outlook Background: Covers about 3,500
Global Aviation Monitor (GAM) Analysis and Short Term Outlook of Global, European and German Air Transport Main Results of Global Air Transport Supply Analysis and Outlook Background: Covers about 3,500
ATRS Global Airport Performance Benchmarking Report, 2003
 ATRS Global Airport Performance Benchmarking Report, 2003 Tae H. Oum UBC and Air Transport Research Society www.atrsworld.org presented at NEXTOR Conference Tuesday, January 27 Friday, January 30, 2004
Megahubs United States Index 2018
 Published: Sep 2018 Megahubs United States Index 2018 The Most Connected Airports in the US 2018 OAG Aviation Worldwide Limited. All rights reserved About OAG Megahubs US Index 2018 Published alongside
Main airlines traffic 3 rd quarter nd quarter 16/15. 1st quarter 16/15. 3rd. quarter 16/15 01/ nd quarter 16/15. 3rd quarter 16/15.
 Main airlines traffic 3 rd Airlines AMERICAN AL Group 321 000 3,6 3,1 0,6-2,2 DELTA AIR LINES 303 100 4,0 3,2 3,0-0,2 UNITED HOLDING 295 500 2,6 0,5 0,1 2,4 EMIRATES AL 251 200 8,8 2,5 5,5 nd AIR FRANCE/KLM
irport atchment rea atabase
 irport atchment rea atabase Examples 539 Airports Four range sizes 50, 75, 100 and 150 km. Time series 00-015 30+ variables About ACAD The database contains catchment area information for 539 European
Athens International Airport. The 2007 market performance
 Athens International Airport The 2007 market performance Great overall performance 70 Airlines 15 New Aer Lingus Air Baltic Air China Carpatair Centralwings Clickair Continental Airlines Finnair Ilyich-Avia
Global Aviation Monitor (GAM)
") Global Aviation Monitor (GAM) Analysis and Short Term Outlook of Global, European and German Air Transport Main Results of Global Air Transport Supply Analysis and Outlook Background: Covers about 3,500
Global Aviation Monitor (GAM) Analysis and Short Term Outlook of Global, European and German Air Transport Main Results of Global Air Transport Supply Analysis and Outlook Background: Covers about 3,500
ATRS Global Airport Benchmarking Report 2003
 ATRS Global Airport Benchmarking Report 2003 Presented to Pacific Economic Cooperation Council (PECC) Conference, 5-6 September, 2003, Singapore The Global Airport Benchmarking Task Force of Air Transport
Airports Council International, Geneva, Switzerland Airports Council International, European Region, Brussels
 Source: Airports Council International, Geneva, Switzerland Airports Council International, European Region, Brussels 1 2 3 4 5 6 7 8 9 10 11 12 13 14 15 16 17 18 19 20 21 22 23 24 25 26 Airports London
Global Aviation Monitor (GAM)
") Global Aviation Monitor (GAM) Analysis and Short Term Outlook of Global, European and German Air Transport Main Results of Global Air Transport Supply Analysis and Outlook Background: Covers about 3,500
Global Aviation Monitor (GAM) Analysis and Short Term Outlook of Global, European and German Air Transport Main Results of Global Air Transport Supply Analysis and Outlook Background: Covers about 3,500
Uncertainty in Airport Planning Prof. Richard de Neufville
 Uncertainty in Airport Planning Prof. Richard de Neufville Istanbul Technical University Air Transportation Management M.Sc. Program Airport Planning and Airport Planning and Management Module 06 January
Alliances: Past, Present, And Future JumpStart Roundtable. Montreal June 2, 2009 Frederick Thome Director Alliances
 Alliances: Past, Present, And Future ACI-NA's JumpStart Roundtable Montreal June 2, 2009 Frederick Thome Director Alliances Agenda The Peculiar Nature Of Airlines The Alliance Solution The Future Of The
MIT ICAT. Price Competition in the Top US Domestic Markets: Revenues and Yield Premium. Nikolas Pyrgiotis Dr P. Belobaba
 Price Competition in the Top US Domestic Markets: Revenues and Yield Premium Nikolas Pyrgiotis Dr P. Belobaba Objectives Perform an analysis of US Domestic markets from years 2000 to 2006 in order to:
The O Hare Effect on the System
 The O Hare Effect on the System Diane Boone and Joseph Hollenberg The MITRE Corporation s Center for Advanced Aviation System Development with the Federal Aviation Administration s Managers of Tactical
KEFLAVÍK AIRPORT FROM A STROLL THROUGH CENTRAL PARK TO A SEAT ON THE LONDON EYE FACTS AND FIGURES 2017
 N 51 30 15.5052 W 0 4 34.2336 FROM A STROLL THROUGH CENTRAL PARK Wake up in New York and drink your morning coffee at the park before you get to work. TO A SEAT ON THE LONDON EYE Enjoy in the evening a
LCCs vs. Legacies: Converging Business Models
 LCCs vs. Legacies: Converging Business Models Halifax, Nova Scotia October 18, 2007 strategic transportation & tourism solutions Mark Haneke Vice President, Network & Strategic Planning Vancouver, BC 1
Airports Council International
 Airports Council International HOW SECURITY CONTRIBUTES TO THE ECONOMIC COMPETITIVENESS OF THE AIR CARGO INDUSTRY 16APRIL 2014 Michael Rossell Director ICAO Relations ACI World 1 Mission ACI promotes the
trends bulletin
 Airlines www.enac.fr RPK* (millions) 1st 12/11 2nd 12/11 3nd 12/11 UNITED HOLDING 292 189-0,3 0,3 0,1-1,9 DELTA AIR LINES 270 817 1,1 0,2 0,9 0,0 AIR FRANCE - KLM 215 082 6,9 7,2 3,5 1,9 AMERICAN AL 203
Global Aviation Monitor (GAM)
") Global Aviation Monitor (GAM) Analysis and Short Term Outlook of Global, European and German Air Transport Main Results of Global Air Transport Supply Analysis and Outlook Background: Covers about 3,500
Global Aviation Monitor (GAM) Analysis and Short Term Outlook of Global, European and German Air Transport Main Results of Global Air Transport Supply Analysis and Outlook Background: Covers about 3,500
take-off essential metrics on the world s major airlines
 take-off essential metrics on the world s major airlines Top 20 carriers based on 12 months seat capacity to February 2017 About OAG take-off take-off essential metrics decoded Schedules Analyser: 12 months
Global Aviation Monitor (GAM)
") Global Aviation Monitor (GAM) Analysis and Short Term Outlook of Global, European and German Air Transport Main Results of Global Air Transport Supply Analysis and Outlook Background: Covers about 3,500
Global Aviation Monitor (GAM) Analysis and Short Term Outlook of Global, European and German Air Transport Main Results of Global Air Transport Supply Analysis and Outlook Background: Covers about 3,500
HUBS, COMPETITION AND GOVERNMENT POLICY
 HUBS, COMPETITION AND GOVERNMENT POLICY Airports Canada Aeroports 2011 Ottawa April 20, 2011 Fred Lazar (flazar@yorku.ca) Schulich School of Business York University Toronto, Canada Airports, Airlines
Top 50 Passenger traffic between US and the others (country-pair) CANADA MEXICO UNITED KINGDOM JAPAN GERMANY FRANCE DOMINICAN (REP.
 CANADA MEXICO UNITED KINGDOM JAPAN GERMANY FRANCE DOMINICAN (REP.") Airlines nd: not disclosed Airlines www.enac.fr Main low-cost airlines Pax (thousands) RPK* (millions) SOUTHWEST AL 135 767 2,0 4,7 5,3 7,1 RYANAIR 86 290 6,0 29,7 15,6 11,2 EASYJET AL 54 137 6,2 7,1 7,6
Airlines nd: not disclosed Airlines www.enac.fr Main low-cost airlines Pax (thousands) RPK* (millions) SOUTHWEST AL 135 767 2,0 4,7 5,3 7,1 RYANAIR 86 290 6,0 29,7 15,6 11,2 EASYJET AL 54 137 6,2 7,1 7,6
trends bulletin 01/2012 Main airlines traffic 3 rd quarter 2011 Main low cost airlines
 www.enac.fr Main airlines traffic 3 rd Airlines RPK* (millions) ** 1st 2nd 3rd DELTA AIR LINES 310 900 2,2 1,3 0,9-0,4 UNITED / CONTINENTAL (1) 226 700-12,2-2,8 0,1-1,5 AMERICAN AL 201 900 2,5 1,6 1,8
Vanderbilt Travel January 2019 Airfare Price Testing Testing Session, January 14, 9:30am 10:30am
 Feb 28 Feb 13, 4:50pm Feb 7, 12:05pm Feb 26, 1:18pm Date / Time 2:35pm/5:35pm/10:55pm Feb 8, 10:40pm / 1:20pm City Pair New York (LGA) Denver (DEN) Washington (DCA) Abuja (ABV) Abu Dhabi (AUH) Southwest
Economics of International Airline Joint Ventures. Bryan Keating Georgetown Airline Competition Conference July 17, 2017
 Economics of International Airline Joint Ventures Bryan Keating Georgetown Airline Competition Conference July 17, 2017 International Airline Joint Ventures Connect Complementary Networks No individual
Air Carrier Update II Lufthansa Group
 Air Carrier Update II Lufthansa Group Daniel Pauli Manager Intercontinental Network Planning Washington D.C, Dec 7, 2017. lufthansagroup.com Who we are Lufthansa Group: Three-pillar strategy Shareholders
DEPARTMENT OF HOMELAND SECURITY U.S. CUSTOMS AND BORDER PROTECTION. CBP Dec. No EXPANSION OF GLOBAL ENTRY TO NINE ADDITIONAL AIRPORTS
 This document is scheduled to be published in the Federal Register on 10/04/2016 and available online at https://federalregister.gov/d/2016-23966, and on FDsys.gov 9111-14 DEPARTMENT OF HOMELAND SECURITY
Global Aviation Monitor (GAM)
") Global Aviation Monitor (GAM) Analysis and Short Term Outlook of Global, European and German Air Transport Main Results of Global Air Transport Supply Analysis and Outlook Background: Covers about 3,500
Global Aviation Monitor (GAM) Analysis and Short Term Outlook of Global, European and German Air Transport Main Results of Global Air Transport Supply Analysis and Outlook Background: Covers about 3,500
Air Travel travel Insights insights from Routehappy
 US & International international inflight Inflight Wi- Fi wi- fi Air Travel travel Insights insights from Routehappy Overview: Flyers find more Wi- Fi than ever before Flyers want to get online, and expect
CONCESSIONS FUTURE OPPORTUNITIES
 CONCESSIONS FUTURE OPPORTUNITIES MARCH 14 & 15, 2019 COLORADO S STRONG ECONOMY 2 ABOVE AVERAGE GROWTH 3 19 FORTUNE 1000 COMPANIES Fortune 1000 Companies & Major Relocations and Expansions into Metropolitan
FLY AMERICA ACT WAIVER CHECKLIST
 FLY AMERICA ACT WAIVER CHECKLIST (To assist in determining qualification for a waiver of the restrictions of the Fly America Act under 41 CFR Part 301-10, check the applicable statement(s) below.) Use
John Gulding Manager, Strategic Analysis and Benchmarking, FAA. Hartmut Koelman Senior Expert, Performance review Unit, EUROCONTROL
 Global Challenges to Improve Air Navigation Performance February 11 13, 2015, Asilomar Conference Grounds, Pacific Grove, CA Session 5.1 US-European Joint Performance Analysis John Gulding Manager, Strategic
Slide 1. Slide 2. Slide 3 FLY AMERICA / OPEN SKIES OBJECTIVES. Beth Kuhn, Assistant Director, Procurement Services
 Slide 1 FLY AMERICA / OPEN SKIES Research Administrator Conference April 9, 2014 Clayton Hall Slide 2 Beth Kuhn, Assistant Director, Procurement Services Cindy Panchisin, Sponsored Research Accountant,
air traffic statistics
 October 213 air traffic statistics Prepared by the Office of Finance Department of Internal Controls, Compliance and Financial Strategy Metropolitan Washington Airports Authority Air Traffic Statistics
EUROCONTROL Low-Cost Carrier Market Update
 EUROCONTROL Low-Cost Carrier Market Update June 2007 EUROCONTROL/STATFOR/Doc257 v1.0 12/09/07 EUROCONTROL Low-Cost Carrier Market Update June 2007 Summary: The market share of low-cost carriers in Europe
OAG s Top 25 US underserved routes. connecting the world of travel
 OAG s Top 25 US underserved routes connecting the world of travel Underserved Uncovered: OAG s Top 50 underserved international routes Contents About OAG s underserved uncovered 3 About the data 3 OAG
AGENCY: U.S. Customs and Border Protection; Department of Homeland Security.
 This document is scheduled to be published in the Federal Register on 06/25/2013 and available online at http://federalregister.gov/a/2013-15087, and on FDsys.gov 9111-14 DEPARTMENT OF HOMELAND SECURITY
Industry Voluntary Pollution Reduction Program (VPRP) for Aircraft Deicing Fluids
 for Aircraft Deicing Fluids") Industry Voluntary Pollution Reduction Program (VPRP) for Aircraft Deicing Fluids Background/ Discussion Overview Chad E. Leqve Director Environment Minneapolis/St. Paul Metropolitan Airports Commission
Industry Voluntary Pollution Reduction Program (VPRP) for Aircraft Deicing Fluids Background/ Discussion Overview Chad E. Leqve Director Environment Minneapolis/St. Paul Metropolitan Airports Commission
Press release. For immediate release 10 September European airport passenger traffic up 8.3% in July
 Press release ACI EUROPE 6 square de Meeûs 1000 Brussels, Belgium www.aci-europe.org For immediate release 10 September European airport passenger traffic up 8.3 in ACI EUROPE Airport Traffic Report -
Cleveland Hopkins International Airport Preliminary Merger Analysis
 City of Cleveland Frank G. Jackson, Mayor Operational Issues Cleveland Hopkins International Airport Preliminary Merger Analysis As of today, Continental and United have not even admitted that they are
Preliminary World Airport Traffic 2010 Passenger traffic up 6.3%; Cargo up 15.2%
 Preliminary World Airport Traffic 21 Passenger traffic up 6.3%; Cargo up 1.2% Montreal, 1 March 211 ACI preliminary traffic results, based on reports from over 9 airports worldwide, indicate that global
CCBE LAWYERS STATISTICS 2016
 Austria 31/12/2015 6.057 1.242 Belgium (OBFG) How many s are 81-2 Bulgaria - 2 Croatia - 5 Czech Republic - 40 Germany - 1 Greece - 3 Hungary - 6 Italy - 1 Liechtenstein - 1 Lithuania - 2 The Netherlands
TRIPS OF BULGARIAN RESIDENTS ABROAD AND ARRIVALS OF VISITORS FROM ABROAD TO BULGARIA IN NOVEMBER 2018
 TRIPS OF BULGARIAN RESIDENTS ABROAD AND ARRIVALS OF VISITORS FROM ABROAD TO BULGARIA IN NOVEMBER 2018 In November 2018, the number of the trips of Bulgarian residents abroad was 426.3 thousand (Annex,
OAG FACTS January 2013
 OAG FACTS January 2013 OAG s latest airline capacity data shows that total scheduled airline capacity data is expected to increase by 3% in January 2013. Carriers globally will add 8.5 million extra seats
Megahubs International Index
 Published: Sep 2017 2017 Megahubs International Index The World s Most Internationally Connected Airports 2017 OAG Aviation Worldwide Limited. All rights reserved OAG Megahubs International Index 2017
Growing Size and Complexity Prof. Amedeo Odoni
 Growing Size and Complexity Prof. Amedeo Odoni Istanbul Technical University Air Transportation Management M.Sc. Program Airport Planning and Management Module 3 January 2016 Growing Size and Complexity
TRIPS OF BULGARIAN RESIDENTS ABROAD AND ARRIVALS OF VISITORS FROM ABROAD TO BULGARIA IN FEBRUARY 2018
 TRIPS OF BULGARIAN RESIDENTS ABROAD AND ARRIVALS OF VISITORS FROM ABROAD TO BULGARIA IN FEBRUARY 2018 In February 2018, the number of the trips of Bulgarian residents abroad was 379.5 thousand (Annex,
November Air Traffic Statistics. Prepared by the Office of Corporate Risk and Strategy
 November 214 Air Traffic Statistics Prepared by the Office of Corporate Risk and Strategy Air Traffic Statistics Table of Contents Summary Air Traffic Summary... 1 SH&E Air Traffic Schedule Activity...
TRIPS OF BULGARIAN RESIDENTS ABROAD AND ARRIVALS OF VISITORS FROM ABROAD TO BULGARIA IN OCTOBER 2017
 TRIPS OF BULGARIAN RESIDENTS ABROAD AND ARRIVALS OF VISITORS FROM ABROAD TO BULGARIA IN OCTOBER 2017 In October 2017, the number of the trips of Bulgarian residents abroad was 439.0 thousand (Annex, Table
Published: Nov Megahubs Index. The World s Most Connected Airports. oag.com OAG Aviation Worldwide Limited. All rights reserved
 Published: Nov 2016 2016 Megahubs Index The World s Most Connected Airports 2016 OAG Aviation Worldwide Limited. All rights reserved OAG Megahubs Index 2016 The World s Most Connected Airports Contents
TRIPS OF BULGARIAN RESIDENTS ABROAD AND ARRIVALS OF VISITORS FROM ABROAD TO BULGARIA IN NOVEMBER 2017
 TRIPS OF BULGARIAN RESIDENTS ABROAD AND ARRIVALS OF VISITORS FROM ABROAD TO BULGARIA IN NOVEMBER 2017 In November 2017, the number of the trips of Bulgarian residents abroad was 417.6 thousand (Annex,
TRIPS OF BULGARIAN RESIDENTS ABROAD AND ARRIVALS OF VISITORS FROM ABROAD TO BULGARIA IN JANUARY 2018
 TRIPS OF BULGARIAN RESIDENTS ABROAD AND ARRIVALS OF VISITORS FROM ABROAD TO BULGARIA IN JANUARY 2018 In January 2018, the number of the trips of Bulgarian residents abroad was 387.6 thousand (Annex, Table
Trends Shaping Houston Airports
 Trends Shaping Houston Airports Ian Wadsworth Chief Commercial Officer April 2014 Our mission is to connect Houston with the world Connect the people, businesses, cultures and economies of the world to
air traffic statistics
 September 213 air traffic statistics Prepared by the Office of Finance Department of Internal Controls, Compliance and Financial Strategy Commercial Total Int'l Dom Passengers % Change Air Traffic Summary
Megahubs International Index 2018
 Published: Sep 2018 Megahubs International Index 2018 The World s Most Internationally Connected Airports 2018 OAG Aviation Worldwide Limited. All rights reserved Contents About OAG Megahubs International
Airline Mergers and Consumers. Before the US DOT Advisory Committee for Aviation Consumer Protection
 Airline and Consumers Before the US DOT Advisory Committee for Aviation Consumer Protection Daniel M. Kasper October 29th, 2014 Presentation Overview 1. Key drivers of airline consolidation a) Relentless
LAX SPECIFIC PLAN AVIATION ACTIVITY ANALYSIS REPORT CY 2017
 LAX SPECIFIC PLAN AVIATION ACTIVITY ANALYSIS REPORT CY 2017 Prepared May 2018 Los Angeles International Airport (LAX) Specific Plan Compliance Review Aviation Activity Analysis January - December 2017
Airport Characteristics: Part 2 Prof. Amedeo Odoni
 Airport Characteristics: Part 2 Prof. Amedeo Odoni Istanbul Technical University Air Transportation Management M.Sc. Program Air Transportation Systems and Infrastructure Module 4 May 25, 2015 Outline
J.D. Power and Associates Reports: Customer Satisfaction with Airports Declines Sharply Amid an Industry Fraught with Flight Delays
 J.D. Power and Associates Reports: Customer Satisfaction with Airports Declines Sharply Amid an Industry Fraught with Flight Delays Philadelphia International, Chicago Midway International and Dallas Love
2010 US/Europe comparison of ATM-related operational performance
 2010 US/Europe comparison of ATM-related operational performance Joint FAA (ATO) and EUROCONTROL (PRC) benchmark reports Hartmut Koelman EUROCONTROL Performance Review Unit 21 May 2013 History In 2003,
October Air Traffic Statistics. Prepared by the Office of Corporate Risk and Strategy
 October 214 Air Traffic Statistics Prepared by the Office of Corporate Risk and Strategy Metropolitan Washington Airports Authority Air Traffic Statistics Table of Contents Summary Air Traffic Summary...
Airport Characteristics. Airport Characteristics
 Airport Characteristics Amedeo R. Odoni September 5, 2002 Airport Characteristics Objective To provide background and an overview on the diversity of airport characteristics Topics Discussion of geometric
Description of the National Airspace System
 Description of the National Airspace System Dr. Antonio Trani and Julio Roa Department of Civil and Environmental Engineering Virginia Tech What is the National Airspace System (NAS)? A very complex system
August Air Traffic Statistics. Prepared by the Office of Corporate Risk and Strategy
 August 215 Air Traffic Statistics Prepared by the Office of Corporate Risk and Strategy Metropolitan Washington Airports Authority Air Traffic Statistics Table of Contents Summary Air Traffic Summary...
Preliminary World Airport Traffic 2009
 Preliminary World Airport Traffic 2009 Passenger traffic down by 2.7%; cargo down by 8.2 % Geneva, 17 March 2010 ACI reports preliminary results of a 2.7 decline in global passenger traffic for 2009, reflecting
Zones metropolitaines: sources de croissance. Montreal, 7 Mai 2009
 Zones metropolitaines: sources de croissance Montreal, 7 Mai 2009 Concentration matters Urbanisation: Percentage yearly change in total population living in large urban TL3 regions in the whole country;
PITTSBURGH INTERNATIONAL AIRPORT ANALYSIS OF SCHEDULED AIRLINE TRAFFIC. October 2016
 ANALYSIS OF SCHEDULED AIRLINE TRAFFIC October 2016 Passenger volume Pittsburgh International Airport enplaned passengers totaled 379,979 for the month of October 2016, a 7.0% increase from the previous
MINNESOTA. Regional Air Service Study. The KRAMER Team
 MINNESOTA Regional Air Service Study The KRAMER Team June, 2003 Today s Topics Tier 2 Demand Profile Context for Possibilities (The Industry) Air Service Options Likely Build-out Facility Implications
SEPTEMBER 2014 BOARD INFORMATION PACKAGE
 SEPTEMBER 2014 BOARD INFORMATION PACKAGE MEMORANDUM TO: Members of the Airport Authority FROM: Lew Bleiweis, Executive Director DATE: September 19, 2014 Informational Reports: A. July, 2014 Traffic Report
! " in focus. Statistics. Air transport between the EU and the USA. Contents TRANSPORT 7/2006. Highlights. Author Luis DE LA FUENTE LAYOS
 Air transport between the EU and the USA!!!!!!!!!!!!!!!!!!!!!!!!!!!!!!!!!!!!!!!!!!! Statistics in focus Graph 1: Evolution of total passenger transport to/from the USA 50 000 000 EU-15 EU-25 45 000 000
August Air Traffic Statistics. Prepared by the Office of Marketing & Consumer Strategy
 August 218 Air Traffic Statistics Prepared by the Office of Marketing & Consumer Strategy This report includes only data submitted by airlines as of the date of publication: October 17, 218. Reports are
ELEVENTH AIR NAVIGATION CONFERENCE. Montreal, 22 September to 3 October 2003
 4/8/03 English, French, Russian and Spanish only * ELEVENTH AIR NAVIGATION CONFERENCE Montreal, 22 September to 3 October 2003 Agenda Item 3: 3.1 : Air traffic management (ATM) performance targets for