RTD s Performance Management System
|
|
|
- Cleopatra Sparks
- 6 years ago
- Views:
Transcription


 San")
1 RTD s Performance Management System FTA s New Transit Asset Management (TAM) Program Why Set Targets? October 10, 2017 Donna DeMartino Chief Executive Officer (CEO) San Joaquin Regional Transit District (RTD)
 San Joaquin County (since 1994) Service area: San Joaquin County (over 1,400 sq. mi.")
2 San Joaquin RTD: Who We Are San Joaquin Regional Transit District (RTD) is the regional transportation provider for San Joaquin County, located in California s Central Valley The public transportation provider: Stockton Metropolitan Area (since 1965) San Joaquin County (since 1994) Service area: San Joaquin County (over 1,400 sq. mi.) Approximately 680,000 people 7 incorporated cities Rural communities Unincorporated areas Services: Fixed-route, BRT, deviated fixed-route, commuter, mobility on demand, vanpools, and a variety of ADA options


3 RTD s Journey to Reality-based Management and Planning Where are we? Where do we want to go? How do we get there? What have we got? What do we need?


4 Why measure anything at all? We wanted to measure our performance How are we doing? Productivity Efficiency Effectiveness How do we compare? How can we improve? You can t manage what you don t measure.
 Operations Fare Collection System Excel spreadsheets (lots of them) Asset lists")

5 Where should we look? Lots of Data Various systems/sources Financials (old system vs. new system) Operations Fare Collection System Excel spreadsheets (lots of them) Asset lists Fleet plans Capital plans and budgets Great People Committed to the organization Process-oriented Need to understand the bigger picture Need to be motivated to manage, not just list or count
 Assign responsibility for validating numbers Allow them to tell the")
6 What should we do? Provide support and direction from the top Assign process owners and make them accountable Educate (system, data, relationships) Assign responsibility for validating numbers Allow them to tell the story (make sure the story is correct) Encourage challenging the status quo and the myths Automate as much as possible Minimize manual entries and corrections Get data from the actual source (if an integrated system is used) Define what is important to the organization develop key performance indicators, but avoid KPI overload Benchmark with peers

7 Measuring and Benchmarking Performance RTD struggled with data management and performance planning Some internal solutions Route Scorecards Strategic Planning TransTrack RTD struggled with establishing effective performance metrics An external solution American Bus Benchmarking Group


8 Route Scorecard RTD formalized and improved a ranking system for its routes Initial Scorecard outlined: passenger volume, passengers per revenue hour, cost per revenue hour, and fare recovery Scorecard was reviewed quarterly by RTD staff to outline service effectiveness and prepare recommendations based on route performance

9 Automated Data Collection RTD uses TransTrack to manage its data TransTrack is a data integration solution that takes information from a variety of data sources and rolls it up into an NTD-ready report
 20 Members Across the U.S. in a Wide Range of Urban and Suburban Environments LTD (Eugene) MTA (Flint) RTS (Rochester) NFTA Metro (Buffalo) UTA (Salt Lake City) DART (Des Moines) PACE")
10 American Bus Benchmarking Group: C-TRAN (Vancouver) STA (Spokane) 20 Members Across the U.S. in a Wide Range of Urban and Suburban Environments LTD (Eugene) MTA (Flint) RTS (Rochester) NFTA Metro (Buffalo) UTA (Salt Lake City) DART (Des Moines) PACE (Chicago) GCRTA (Cleveland) RIPTA (Providence) RTA (Dayton) RTD (Stockton) MTA (Nashville) HRT (Hampton Roads) Omnitrans (San Bernardino) FWTA (Fort Worth) Capital Metro (Austin) LYNX (Orlando) PSTA (St. Petersburg)
11 ABBG 2013 Fixed-Route Key Performance Indicator System: Based on the Balanced Scorecard, Customized for Transit Growth & Learning G1 Passenger Boardings (5-year % change) G2 Vehicle Miles and Hours (5-year % change) G3 Passengers per Revenue Mile & Hour G4 Staff Training (by staff category) Customer C1 Customer Information (scheduled and real-time) C2 On-Time Departure Performance (0 <> + 5) C3 Passenger Miles per Revenue Capacity Mile C4 Passenger Miles per Revenue Seat Mile C5 Lost Vehicle Miles Internal Processes P1 P2 P3 P4 P5 Peak Fleet Utilization (fleet not used split by cause) Network Efficiency (revenue miles & hours per total miles & hours, non-revenue split by category) Staff Productivity (total vehicle hours & miles per labor hour, overall and by category) Staff Absenteeism Rate (by staff category) Mean Distance/Time Between Road Calls Financial F1 F2 F6 F7 F8 F9 Total Cost per Total Vehicle Mile & Hour Total Operating Cost per Total Vehicle Mile & Hour (F3 service operation, F4 maintenance, F5 administration) Service Operation Cost per Revenue Mile & Hour Total Operating Cost per Boarding & Pax Mile Operating Cost Recovery (fare revenue & commercial revenue per operating cost) Fare Revenue per Boarding & Pax Mile Safety S1 S2 S3 S4 S5 Number of Vehicle Collisions per Vehicle Mile & Hour (preventable & non-preventable) Number of Staff Injuries per Staff Work Hours Staff Lost Time from Accidents per Staff Work Hours Number of Passenger Injuries per Boarding & Pax Mile Number of 3rd Party Injuries per Vehicle Mile & Hour Environmental E1 E2 E3 Diesel Fuel Consumption CNG Fuel Consumption (per total vehicle mile, per pax mile, and per capacity mile) CO2 Emissions per Total Vehicle Mile & Pax Mile
12 Example where RTD Performs Well: Safety 3 Vehicle Collisions per Total Vehicle Miles Indexed to group average Bus1 Bus2 Bus3 Bus4 Bus5 Bus6 Bus7 Bus8 Bus9 Bus10 Bus11 Bus12 Bus13 Bus14 Bus15 Bus16 SJ Latest Year Average
13 Assessing RTD s Service Delivery Model $70 $60 $50 $40 PF1a: Total Paratransit Operating Cost per Passenger Boarding RTD: Service delivery models: (Hopper, UCP, taxi) $30 $20 $10 $0 FW HR LX Rc RI SB SJ SP ST UT Vc Avg '14


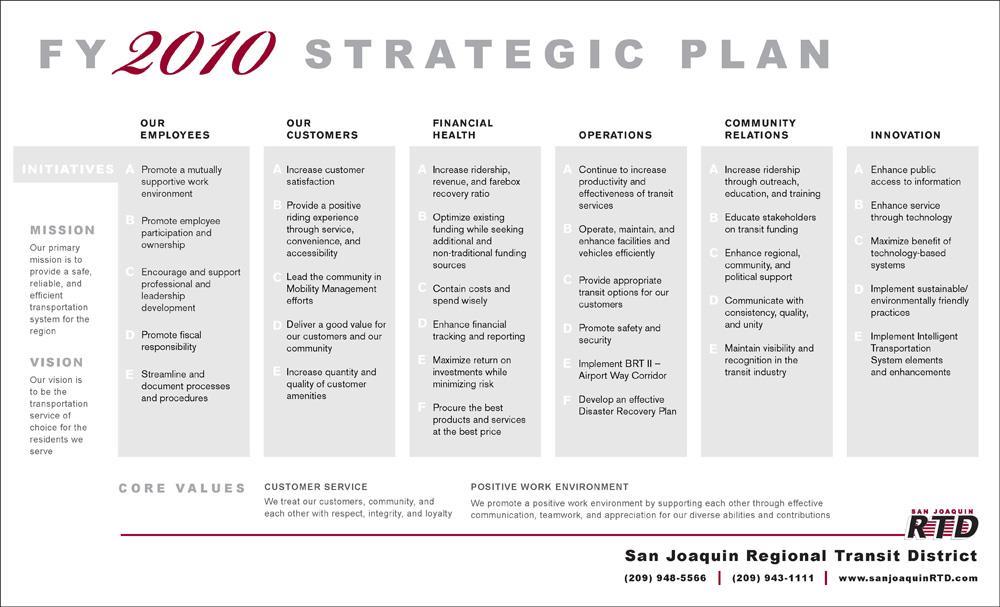
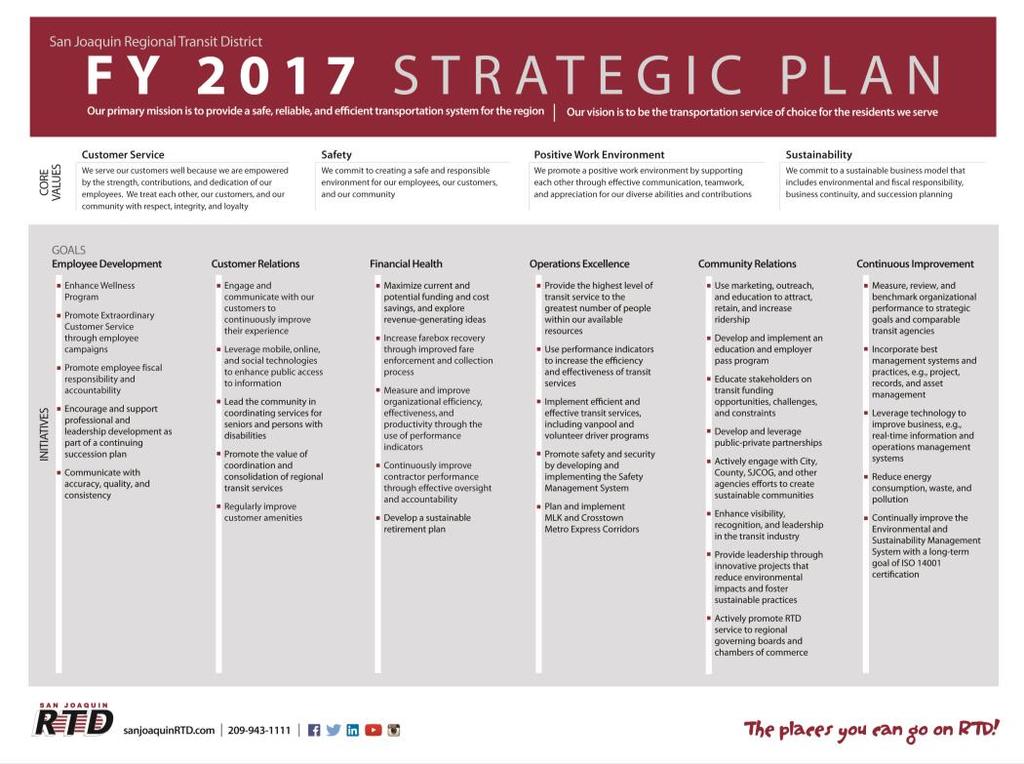
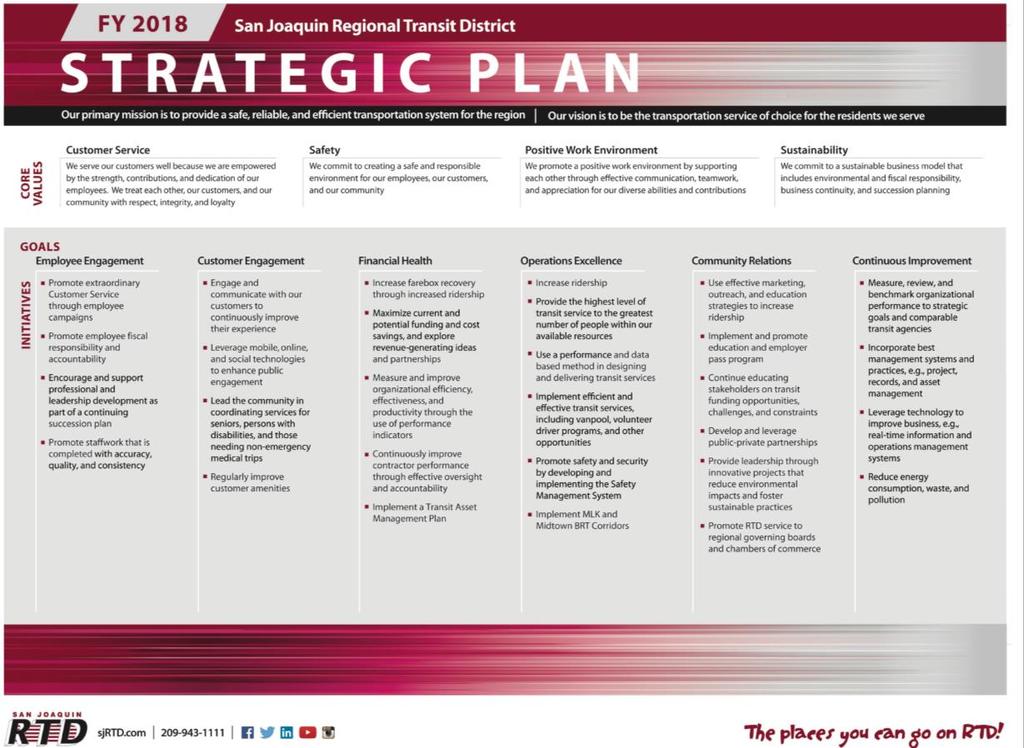
14 Over a Decade of Strategic Planning

15 RTD Planning: Addressing Challenges Challenges: Old, outdates, inefficient facilities

16 RTD Planning: Addressing Challenges Challenges: Old, outdates, inefficient facilities

17 RTD Planning: Addressing Challenges Challenges: Environmental concerns A severe non-attainment area for air quality In 2013, through a California Energy Commission grant and its partnership with Proterra, RTD introduced northern California s first 100% battery-electric buses into service. ~ 20.1 miles per gallon diesel fuel savings greenhouse gas emissions reductions environmental benefits In August 2017, RTD introduced the nation s first all-electric BRT Corridor By 2025, RTD plans to have an allelectric fleet in the City of Stockton

18 RTD Planning: Addressing Challenges Challenges: Reduced operating funds and inefficient bus routes

19 We are not there. Yet! While RTD planning has helped achieve significant goals, we hope the TAM process will not only help internally, but will also improve the relationship and planning process with our MPO Next steps: Strengthen our data managers; we have established a TAM Team at RTD Continue to learn from our peers Make good business decisions and long-term capital plans based upon solid data

20 How will TAM help? It will help us continue on our road to reality-based planning and management. It will help our planning and funding partners understand our needs and hopefully fund our futures. What have we got? How long can we expect it to last? Can it do the job? What do we need? How much will it cost?

21 Questions?
MAKING PERFORMANCE MEASURES MATTER
 www.rtachicago.org 5 TH International Transportation Systems Performance Measurement and Data Conference June 1-2, 2015 Denver, CO MAKING PERFORMANCE MEASURES MATTER Transparency, Accountability, and Advocacy
DRAFT Fare Increase Proposal Spokane Transit Authority. Public Outreach April June 2016
 Spokane Transit Authority Public Outreach April June 2016 STA s Fare Philosophy Encourage increased ridership by providing convenient and reasonably priced method for citizens to enjoy the advantages of
General Issues Committee Item Transit Operating Budget Ten Year Local Transit Strategy
 General Issues Committee Item 4.1 2017 Transit Operating Budget Ten Year Local Transit Strategy January 27, 2017 Presentation Outline 2017 Operating Budget Overview Ten Year Local Transit Strategy 2 2017
RTA ScoreCard December 2009
 Background and Context RTA ScoreCard December 2009 Chapter 25 of the Acts of 2009 modernized the transportation systems of the Commonwealth and created the new MassDOT. Section 6 of this law established
Preliminary Fare Increase Proposal Spokane Transit Authority. Public Outreach April and May 2016
 Spokane Transit Authority Public Outreach April and May 2016 Meeting Objectives STA s Fare Philosophy Encourage increased ridership by providing convenient and reasonably priced method for citizens to
Peer Performance Measurement February 2019 Prepared by the Division of Planning & Market Development
 2017 Regional Peer Review Peer Performance Measurement February 2019 Prepared by the Division of Planning & Market Development CONTENTS EXECUTIVE SUMMARY... 3 SNAPSHOT... 5 PEER SELECTION... 6 NOTES/METHODOLOGY...
Capital Metropolitan Transportation Authority. Monthly Performance Report
 Capital Metropolitan Transportation Authority Monthly Performance Report AUGUST 2010 Ridership Report August 23, 2010 Budget to Actual Ridership Budget Target: 2,290,590 Actual: 2,300,796 Ridership Comparison
Presentation to the Southeast Corridor High-Performance Transit Alternative Study Public Forum. Overview of MTA. presented by
 Presentation to the Southeast Corridor High-Performance Transit Alternative Study Public Forum Overview of MTA presented by Marian Ott, MTA Board Chair, Planning and Marketing Committee SEPTEMBER 2004
TOP 100. Transit Bus Fleets Agency 35 ft. Over Artic and 35 ft. Total +/- under 0 3, ,426 82
 L.A. Metro-No. 3 1 1 MTA New York City Transit New York City 2 2 New Jersey Transit Corp. Newark, N.J. 3 3 Metro Los Angeles 4 5 Toronto Transit Commission Toronto 5 10 Chicago Transit Authority Chicago
Performance Measurement:
 Regional Transportation Authority Performance Measurement: Peer Reporting Transport Chicago June 7, 2013 1 RTA Performance Measurement Program 2008 RTA Act amendment Purpose: Transparency & accountability
MONTHLY OPERATIONS REPORT SEPTEMBER 2015
 MONTHLY OPERATIONS REPORT SEPTEMBER 215 Table of Contents SEPTEMBER 215 Section Page September Highlights... 3 Strategic Goals Progress Update... 4 Ridership... 6 Revenue... 9 Expenses... 1 System Summary...
PERFORMANCE REPORT NOVEMBER 2017
 PERFORMANCE REPORT NOVEMBER 2017 Note: New FY2018 Goal/Target/Min or Max incorporated in the Fixed Route and Connection Dashboards. Keith A. Clinkscale Performance Manager INTRODUCTION/BACKGROUND In June
Date: 11/6/15. Total Passengers
 Total San Diego Metropolitan Transit System POLICY 42 PERFORMANCE MONITORING REPORT Page 1 of 6 OBJECTIVE Develop a Customer-Focused and Competitive System The following measures of productivity and service
Transit Performance Report FY (JUNE 30, 2007)
") Transit Performance Report FY 2006-2007 (JUNE 30, 2007) J ANUARY 2008 TRANSIT PERFORMANCE REPORT FY 2006 2007 (JUNE 30, 2007) Transit Performance Report I SSUED: JANUARY 2008 The Transit Performance Report
Transit Performance Report FY 2006-2007 (JUNE 30, 2007) J ANUARY 2008 TRANSIT PERFORMANCE REPORT FY 2006 2007 (JUNE 30, 2007) Transit Performance Report I SSUED: JANUARY 2008 The Transit Performance Report
Community Transit Solutions for the Suburbs CTAA Expo June 2014
 Community Transit Solutions for the Suburbs CTAA Expo June 2014 New Suburban Challenges Lower density development patterns Where is the funding to compete with urban and suburban commuter needs? Increased
APPENDIX B COMMUTER BUS FAREBOX POLICY PEER REVIEW
 APPENDIX B COMMUTER BUS FAREBOX POLICY PEER REVIEW APPENDIX B COMMUTER BUS FAREBOX POLICY PEER REVIEW The following pages are excerpts from a DRAFT-version Fare Analysis report conducted by Nelson\Nygaard
DRT Performance Measurement: the U.S. Experience
 DRT Performance Measurement: the U.S. Experience FOR ANYBODY GOING ANYWHER IN LA HABRA International Conference on Demand Responsive Transportation Breckenridge, Colorado September 2016 DRT Performance
Att. A, AI 46, 11/9/17
 Total s San Diego Metropolitan Transit System POLICY 42 PERFORMANCE MONITORING REPORT Page 1 of 6 Date: 11/8/17 OBJECTIVE Develop a Customer-Focused and Competitive System The following measures of productivity
STUDY PROCESS. Study. PHASE I Research. PHASE II Develop & Analyze Options. PHASE III Recommendations. Regional Transit
 STUDY PROCESS PHASE I Research PHASE II Develop & Analyze Options PHASE III Recommendations February 2008 - July 2008 July 2008 - September 2008 September 2008 - December 2008 Analyze transit and projected
Agency 35 ft. Over Artic. Trolley 2012 Total and 35 ft. under. 1 1 MTA New York City Transit 0 3, ,344 New York City
 Capital Metro-No. 40 Courtesy Capital Metro 1 1 MTA New York City Transit 0 3,704 640 0 4,344 New York City 2 3 New Jersey Transit Corp. 47 2,263 85 0 2,395 Newark, N.J. 3 2 Metro 50 1,956 378 0 2,384
TTI REVIEW OF FARE POLICY: PRELIMINARY FINDINGS
 TTI REVIEW OF FARE POLICY: PRELIMINARY FINDINGS December 2014 STATUS: TTI REVIEW OF FARE POLICY Goal: Identify and evaluate different options for a revised fare structure, including pricing strategies
Lower Income Journey to Work Market Share From American Community Survey
 Lower Income Journey to Work Market Share From American Community Survey 2006-2010 Table 1: Overall National Data Table 2: Car, Truck or Van Table 3: Transit Table 4: Metrics Table 1 Work Trip Market Share:
MONTHLY OPERATIONS REPORT DECEMBER 2015
 MONTHLY OPERATIONS REPORT DECEMBER 215 Table of Contents DECEMBER 215 Section Page December Highlights... 3 Strategic Goals Progress Update... 4 Ridership... 6 Revenue... 9 Expenses... 1 System Summary...
Bristol Virginia Transit
 Bristol Virginia Transit 1 Transit Overview Bristol Virginia Transit (BVT) is a Federally Funded and certified urban area transit system. BVT began operation in its current form in 1982. In Fiscal Year
Business Intelligence Development at Winnipeg Transit
 ITS Canada Webinar February 28, 2013 Business Intelligence Development at Winnipeg Transit Bill Menzies Senior Transit Planner, Dillon Consulting Limited Manager of Service Development, Winnipeg Transit
Swedish Service Routes, American Style: Local Bus for the Suburbs 70TH ANNUAL OHIO TRANSPORTATION ENGINEERING CONFERENCE OCTOBER 25, 2016
 Swedish Service Routes, American Style: Local Bus for the Suburbs 70TH ANNUAL OHIO TRANSPORTATION ENGINEERING CONFERENCE OCTOBER 25, 2016 Swedish Service Route Model Response to growing expense of Special
CURRENT SHORT-RANGE TRANSIT PLANNING PRACTICE. 1. SRTP -- Definition & Introduction 2. Measures and Standards
 CURRENT SHORT-RANGE TRANSIT PLANNING PRACTICE Outline 1. SRTP -- Definition & Introduction 2. Measures and Standards 3. Current Practice in SRTP & Critique 1 Public Transport Planning A. Long Range (>
Fare Policy Discussion Background and History
 Fare Policy Discussion Background and History Transportation Committee Nick Eull Senior Manager of Revenue Operations February 27 th, 2017 2013 Fare Policy Analysis Report Cross-functional group comprised
Sacramento Convention Center City Team & Stakeholder Group Meeting
 Sacramento Convention Center City Team & Stakeholder Group Meeting Monday, February 6, 2017 11:00 a.m. 1:00 p.m. Sacramento Convention Center, Room 306 r2 4. What Can We Learn from the Data? 4. What Can
MERRIMACK VALLEY REGIONAL TRANSIT AUTHORITY (MVRTA) PERFORMANCE MEASURES: FIXED ROUTE
 PERFORMANCE MEASURES: FIXED ROUTE") PERFORMANCE MEASURES: FIXED ROUTE IT IS OUR GOAL TO IMPROVE FIXED ROUTE SERVICE ON ALL LEVELS, ON A CONTINUOUS BASIS. IN ORDER TO DO THIS, WE HAVE ESTABLISHED BENCHMARKS TO MEASURE PERFORMANCE. THIS INFORMATION
PERFORMANCE MEASURES: FIXED ROUTE IT IS OUR GOAL TO IMPROVE FIXED ROUTE SERVICE ON ALL LEVELS, ON A CONTINUOUS BASIS. IN ORDER TO DO THIS, WE HAVE ESTABLISHED BENCHMARKS TO MEASURE PERFORMANCE. THIS INFORMATION
Orange County Transportation Authority Fare Integration Project A Regional Approach
 Orange County Transportation Authority Fare Integration Project A Regional Approach APTA Fare Collection Workshop and TransITech Conference March 2012 Agenda Review our Regional Efforts Describe the Southern
Board of Directors Information Summary
 Regional Public Transportation Authority 302 N. First Avenue, Suite 700, Phoenix, Arizona 85003 602-262-7433, Fax 602-495-0411 Board of Directors Information Summary Agenda Item #6 Date July 11, 2008 Subject
TOP 100 Bus Fleets Agency 35 ft. and Over Artic under 35 ft. Total. 18 < metro magazine SEPTEMBER/OCTOBER 2018 metro-magazine.
 1 1 MTA New York City Transit/MTA Bus Co. 0 4,860 951 5,811 New York City 2 3 New Jersey Transit Corp. 418 2,879 85 3,382 Newark, N.J. 3 2 Los Angeles County Metropolitan Transportation Authority 50 1,882
Fixed-Route Operational and Financial Review
 Chapter II CHAPTER II Fixed-Route Operational and Financial Review Chapter II presents an overview of route operations and financial information for KeyLine Transit. This information will be used to develop
September 2014 Prepared by the Department of Finance & Performance Management Sub-Regional Report PERFORMANCE MEASURES
 September 2014 Prepared by the Department of Finance & Performance Management 2013 Sub-Regional Report PERFORMANCE MEASURES REGIONAL PERFORMANCE MEASURES RTA staff has undertaken the development of a performance
Performance Measures Year End Updated-
 Performance Measures Year End 2017 -Updated- Priorities and Objectives 1. Earn and Retain the Community s Trust 2. Provide Excellent Customer Service 3. Enable Organizational Success 4. Exemplify Financial
TRANSPORTATION PROGRAMS
 High Speed Transit Corridor Studies Rail/Freight Session 2011 ITE/MSA Spring Conference Black Canyon Conference Center Phoenix, Arizona March 9, 2011 The Maricopa Association of Governments (MAG) is the
Peer Performance Measurement February 2019 Prepared by the Division of Planning & Market Development
 2017 Sub-Regional Peer Review Peer Performance Measurement February 2019 Prepared by the Division of Planning & Market Development CONTENTS EXECUTIVE SUMMARY... 3 NOTES/METHODOLOGY... 6 AGENCIES... 7
PERFORMANCE REPORT DECEMBER Performance Management Office
 PERFORMANCE REPORT DECEMBER 2018 Performance Management Office INTRODUCTION/BACKGROUND Performance Management Office FIXED ROUTE DASHBOARD FY 2019 Safety Max Target Goal Preventable Collisions per 100k
Chapter 3. Burke & Company
 Chapter 3 Burke & Company 3. WRTA RIDERSHIP AND RIDERSHIP TRENDS 3.1 Service Overview The Worcester Regional Transit Authority (WRTA) provides transit service to over half a million people. The service
PERFORMANCE MEASUREMENT
 PERFORMANCE MEASUREMENT Outline 1. Roles for Performance Measures 2. Alternative Approaches 3. Fielding's Approach Framework Steps in Analysis Initial Measures Factor Analysis Results Recommended Measures
SUB-REGIONAL PERFORMANCE MEASURES
 SUB-REGIONAL PERFORMANCE MEASURES 29 REPORT Overall regional performance is a function of five major areas: Service Coverage - monitors both how much service is available to people in the region (in terms
Greater Portland Transit District
 Greater Portland Transit District TO: FROM: Freeport Town Council Greg Jordan - Metro General Manager DATE: September 10, 2014 SUBJECT: Metro Request to Pursue Grant Funding for Trial Express Bus Service
2 YORK REGION TRANSIT MOBILITY PLUS 2004 SYSTEM PERFORMANCE REVIEW
 2 YORK REGION TRANSIT MOBILITY PLUS 2004 SYSTEM PERFORMANCE REVIEW The Joint Transit Committee and Rapid Transit Public/Private Partnership Steering Committee recommends the adoption of the recommendation
Attachment C: 2017/2018 Halifax Transit Year End Performance Report. 2017/2018 Year End Performance Measures Report
 Attachment C: 2017/2018 Halifax Transit Year End Performance Report 2017/2018 Year End Performance Measures Report Contents Annual Key Performance Indicators (KPIs)... 1 Weekday Cost per Passenger... 1
Mobility Services. Rider s Guide
 Mobility Services Rider s Guide San Joaquin Regional Transit District (RTD), the regional transit provider for San Joaquin County, provides public transit services in the Stockton Metropolitan Area (SMA),
YOSEMITE AREA REGIONAL TRANSPORTATION SYSTEM
 YOSEMITE AREA REGIONAL TRANSPORTATION SYSTEM Short Range Transit Plan Prepared for the Merced County Association of Governments/YARTS Prepared by LSC Transportation Consultants, Inc. YOSEMITE AREA REGIONAL
Investor Update October 23, 2007
 JetBlue Airways Investor Relations Lisa Studness Cindy England (718) 709-2202 ir@jetblue.com Investor Update October 23, 2007 This investor update provides our investor guidance for the fourth quarter
10TH ANNUAL WOLFE RESEARCH GLOBAL TRANSPORTATION CONFERENCE MAY 23, 2017
 1 10TH ANNUAL WOLFE RESEARCH GLOBAL TRANSPORTATION CONFERENCE MAY 23, 2017 SAFE HARBOR This presentation contains forward-looking statements within the meaning of the Private Securities Litigation Reform
Board Box. February Item # Item Staff Page 1. Key Performance Indicators M. Thompson Financial Report for Dec H.
 Board Box February 2016 Item # Item Staff Page 1. Key Performance Indicators M. Thompson 2-8 2. Financial Report for Dec. 2015 H. Rodriguez 9-13 ITEM 1 February 15, 2016 TO: FROM: RE: BOARD OF DIRECTORS
APPENDIX B. Arlington Transit Peer Review Technical Memorandum
 APPENDIX B Arlington Transit Peer Review Technical Memorandum Arlington County Appendix B December 2010 Table of Contents 1.0 OVERVIEW OF PEER ANALYSIS PROCESS... 2 1.1 National Transit Database...2 1.2
Community Feedback and Survey Participation Topic: ACCESS Paratransit Services
 Community Feedback and Survey Participation Topic: ACCESS Paratransit Services Fall 2014 Valley Regional Transit DEAR SURVEY PARTICIPANT, In summer 2014, staff from Valley Regional Transit and the transportation
ALL ABOARD LABOR S LONG TERM PASSENGER TRANSPORT STRATEGY
 ALL ABOARD LABOR S LONG TERM PASSENGER TRANSPORT STRATEGY Revitalising Passenger Transport Increasing traffic congestion in our cities and a lack of transport services in our regional towns is frustrating
1 YORK REGION TRANSIT/ VIVA SYSTEM PERFORMANCE
 Report No. 6 of the Transportation Services Committee Regional Council Meeting of June 23, 2011 1 YORK REGION TRANSIT/ VIVA SYSTEM PERFORMANCE The Transportation Services Committee recommends: 1. Receipt
2017/2018 Q3 Performance Measures Report. Revised March 22, 2018 Average Daily Boardings Comparison Chart, Page 11 Q3 Boardings figures revised
 2017/2018 Q3 Performance Measures Report Revised March 22, 2018 Average Daily Boardings Comparison Chart, Page 11 Q3 Boardings figures revised Contents Ridership & Revenue... 1 Historical Revenue & Ridership...
Investor Update April 22, 2008
 JetBlue Airways Investor Relations Lisa Studness (718) 709-2202 ir@jetblue.com Investor Update April 22, 2008 This investor update provides our investor guidance for the second quarter ending June 30,
Chapter 1 Introduction
 Chapter 1 Introduction Purpose of the Report This report provides a Strategic Transit Master Plan for public transportation on behalf of the Metropolitan Transit Authority (MTA) and the Nashville Metropolitan
Regional Fare Change Overview. Nick Eull Senior Manager of Revenue Operations Metro Transit
 Regional Fare Change Overview Nick Eull Senior Manager of Revenue Operations Metro Transit Committee of the Whole April 5 th, 2017 Today s Presentation Fare change goals and considerations Public engagement
Summary of Transportation Development Credits (TDCs) Dallas-Fort Worth Metropolitan Planning Organization (MPO) (As of September 30, 2017)
 Dallas-Fort Worth Metropolitan Planning Organization (MPO) (As of September 30, 2017)") ATTACHMENT 1 Summary of Transportation Development Credits (s) (MPO) Original Allocation of s to Dallas/Fort Worth MPO: 465,486,222 Award Type 1 - Strategic Awards to Small Transit Providers 2 - RTC Has
ATTACHMENT 1 Summary of Transportation Development Credits (s) (MPO) Original Allocation of s to Dallas/Fort Worth MPO: 465,486,222 Award Type 1 - Strategic Awards to Small Transit Providers 2 - RTC Has
Chicago Transit Authority: Transit Management within The Loop
 Chicago Transit Authority: Transit Management within The Loop Issues in Transportation Leadership Final Presentation CEE 970 Colloquium in Transportation Management & Policy Spring 2012 Introduction Jamesa
Airline Operating Costs Dr. Peter Belobaba
 Airline Operating Costs Dr. Peter Belobaba Istanbul Technical University Air Transportation Management M.Sc. Program Network, Fleet and Schedule Strategic Planning Module 12: 30 March 2016 Lecture Outline
Key Statistical Indicator For The International Airports Operator In PPP/BOT/Project Finance Environment
 Key Statistical Indicator For The International Airports Operator In PPP/BOT/Project Finance Environment Introduction Taken over airports in emerging markets and in immature environments (but not always
Mobile Farebox Repair Program: Setting Standards & Maximizing Regained Revenue
 Mobile Farebox Repair Program: Setting Standards & Maximizing Regained Revenue Michael J. Walk, Chief Performance Officer Larry Jackson, Directory of Treasury Maryland Transit Administration March 2012
TAM Investment Decision Making Asset Management Peer Exchange July 2016
 TAM Investment Decision Making Asset Management Peer Exchange July 2016 2" $1.43 BILLION BUDGET healthy 3" vs." 1991" 2015" THEN AND NOW per capita spending popula&on( 3.3"million" 5.4"million" 27.7"billion""
Ozaukee County Transit Development Plan
 Ozaukee County Transit Development Plan Record of Public Comments and Recommended Transit Service Plan June 5, 2018 Kevin Muhs Deputy Director #242846 Status of the Transit Development Plan Existing Conditions
Maryland Department of Transportation The Secretary's Office
 December 13, 2013 Maryland Department of Transportation The Secretary's Office Martin O'Malley Govemor Anthony G. Brown Lt. Govemor James T. Smith, Jr. Secretary The Honorable Edward J. Kasemeyer Chair,
LOWER RIO GRANDE VALLEY DEVELOPMENT COUNCIL
 LOWER RIO GRANDE VALLEY DEVELOPMENT COUNCIL The Lower Rio Grande Valley Development Council (LRGVDC) is a political subdivision of Texas that Texas Transportation Code Chapter 458 authorizes, and therefore
PUBLIC TRANSIT IN KENOSHA, RACINE, AND MILWAUKEE COUNTIES
 PUBLIC TRANSIT IN KENOSHA, RACINE, AND MILWAUKEE COUNTIES #118404v1 Regional Transit Authority June 19, 2006 1 Presentation Overview Existing Public Transit Transit System Peer Comparison Recent Transit
STEP ALTERNATIVES RANKING TABLE
 ALTERNATIVES RANKING TABLE Priority Ranking 0 = Lowest Priority 1 2 3 4 5 = Highest Priority Abbreviations TD = Transportation Disadvantaged PWD = People with Disabilities I. Existing Enhancements Increase
PERFORMANCE REPORT JANUARY Keith A. Clinkscale Performance Manager
 PERFORMANCE REPORT JANUARY 2018 Keith A. Clinkscale Performance Manager INTRODUCTION/BACKGROUND Keith A. Clinkscale Performance Manager FIXED ROUTE DASHBOARD JANUARY 2018 Safety Max Target Goal Preventable
CREDIT SUISSE GLOBAL INDUSTRIALS CONFERENCE DECEMBER 4, 2014
 CREDIT SUISSE GLOBAL INDUSTRIALS CONFERENCE DECEMBER 4, 2014 1 1 SAFE HARBOR This presentation contains statements of a forward-looking nature which represent our management's beliefs and assumptions concerning
PERFORMANCE REPORT DECEMBER 2017
 PERFORMANCE REPORT DECEMBER 2017 Note: New FY2018 Goal/Target/Min or Max incorporated in the Fixed Route and Connection Dashboards. Keith A. Clinkscale Performance Manager INTRODUCTION/BACKGROUND Keith
Investor Update July 24, 2007
 Investor Update July 24, 2007 JetBlue Airways Investor Relations Lisa Studness Cindy England (718) 709-2202 ir@jetblue.com This investor update provides our investor guidance for the third quarter ending
October REGIONAL ROUTE PERFORMANCE ANALYSIS
 October 2018 2017 REGIONAL ROUTE PERFORMANCE ANALYSIS The Council s mission is to foster efficient and economic growth for a prosperous metropolitan region Metropolitan Council Members Alene Tchourumoff
New System. New Routes. New Way. May 20, 2014
 Route Optimization I N I T I A T I V E New System. New Routes. New Way. May 20, 2014 1 Welcome Blueprint for Transportation Excellence (BTE) 20 year strategic plan Blueprint 2020 JTA s five-year plan for
About This Report GAUGE INDICATOR. Red. Orange. Green. Gold
 ATTACHMENT A About This Report The Orange County Transportation Authority (OCTA) operates a countywide network of local, community, rail connector, and express bus routes serving over 6, bus stops. OCTA
Laredo Transit Development Plan
 Laredo Transit Development Plan Prepared for: Laredo Urban Transportation Study Metropolitan Planning Organization Prepared by: Parsons Brinckerhoff Americas Inc. In association with: NuStats and: GeoStats
EL PASO COUNTY REGIONAL TRANSIT INSTITUTIONAL OPTIONS ASSESSMENT STUDY
 EL PASO COUNTY REGIONAL TRANSIT INSTITUTIONAL OPTIONS ASSESSMENT STUDY Sponsored by: El Paso County Funding Support: Texas Department of Transportation Technical Assistance to the County: Texas A&M Transportation
PORTLAND NORTH INTER-CITY EXPRESS SERVICE Freeport-Yarmouth-Cumberland-Falmouth-Portland Concept Report June 2014
 Greater Portland Transit District PORTLAND NORTH INTER-CITY EXPRESS SERVICE Freeport-Yarmouth-Cumberland-Falmouth-Portland Concept Report June 2014 In February 2014, Metro s Board of Directors approved
A COMPARISON OF THE MILWAUKEE METROPOLITAN AREA TO ITS PEERS
 KRY/WJS/EDL #222377 (PDF: #223479) 1/30/15 PRELIMINARY DRAFT Memorandum Report A COMPARISON OF THE MILWAUKEE METROPOLITAN AREA TO ITS PEERS EXECUTIVE SUMMARY This memorandum report provides a statistical
2017/ Q1 Performance Measures Report
 2017/2018 - Q1 Performance Measures Report Contents Ridership & Revenue... 1 Historical Revenue & Ridership... 1 Revenue Actual vs. Planned... 3 Mean Distance Between Failures... 5 Maintenance Cost Quarter
Location, Location, Location. 19 th Annual NIC Conference NIC MAP Data & Analysis Service
 Location, Location, Location 19 th Annual NIC Conference NIC MAP Data & Analysis Service The Great Occupancy Decline 94% Occupancy Trends Majority Nursing Seniors Housing 93% 92% 91% 92.8% 91.0% 90% 89%
TABLE 1: PARTICIPATING TRANSIT AGENCIES
 TLE 1: RTICITING TRANSIT AGEIES State UNITED STATES BUS AR CO CO Little Rock Flagstaff Phoenix Scottsdale Antioch Bakersfield Culver Davis Fairfield Hesperia Long Beach Monterey Napa Oakland Oxnard Riverside
Director King County Department of Transportation. King County Department of Transportation
 Tolling in Washington State t Harold S. Taniguchi Director Why tolling Why Tolling? Gas tax down Electric collection technology Reduce peak demand and greenhouse gas emissions Tolling today in Washington
Terrace Regional Transit System CITY OF TERRACE COMMITTEE OF THE WHOLE SEPTEMBER 13, 2017
 Terrace Regional Transit System CITY OF TERRACE COMMITTEE OF THE WHOLE SEPTEMBER 13, 2017 1 Purpose To update Council on the system performance of the Terrace Regional Transit System Presentation Topics
FIXED ROUTE DASHBOARD JULY 2018
 FIXED ROUTE DASHBOARD JULY 2018 Safety Max Target Goal Preventable Collisions per 100k Miles Non-Preventable Collisions per 100k Miles Total Incidents per 10,000 Boardings 1.6 1.3 0.8 2.63 2.1 2.0 1.60
Presentation to the DRCOG Board August 16, 2017
 Presentation to the DRCOG Board August 16, 2017 Systemwide FY 2015-2016 July June FY 2016-2017 July June Riders 102,577 155,864 Revenue $1,014,781 $1,551,435 Fare Recovery FY = State Fiscal Year. 38% 53%
REVIEW OF SUN METRO LIFT SERVICES
 REVIEW OF SUN METRO LIFT SERVICES Prepared for Review by Linda Cherrington, Research Scientist Suzie Edrington, Associate Research Scientist Zachary Elgart, Associate Transportation Researcher Shuman Tan,
* Data for prior months has been updated to reflect error corrections from missing passenger count data
 LANE TRANSIT DISTRICT September 2016 Performance Report * 29-November-2016 Prior Performance Current Year's % Current Previous % Current Prior % Measure Month Month Change Y-T-D Y-T-D Change 12 Month 12
TRANSPORTATION SERVICE Actual
 PERFORMANCE REPORT-THIRD QUARTER VISION TO DELIVER REGIONAL MULTI-MODAL TRANSPORTATION SERVICES AND INFRASTRUCTURE IMPROVEMENTS THAT SIGNIFICANTLY AND CONTINUALLY INCREASE TRANSIT MARKET SHARE. MISSION
Planning for RAV: Lon LaClaire, Transportation Engineer Anita Molaro, Development Planner CITY OF VANCOUVER
 Planning for RAV: Achieving Public Objectives in the Context of a PPP Project Lon LaClaire, Transportation Engineer Anita Molaro, Development Planner Presentation Outline Vancouver and the Region The RAV
METROPOLITAN EVANSVILLE TRANSIT SYSTEM Part I: Comprehensive Operations Analysis Overview July 9 th, 2015 Public Information Meeting
 METROPOLITAN EVANSVILLE TRANSIT SYSTEM Part I: Comprehensive Operations Analysis Overview July 9 th, 2015 Public Information Meeting AGENDA 5:30 5:40 Open House 5:40 6:30 Presentation Comprehensive Operations
Hector International Airport Fargo, North Dakota
 Hector International Airport Fargo, North Dakota Volume 072 Twelve Months Ended June 2007 November 2007 Airlines Serving Fargo Carried 830 Onboard Passengers Per Day for the Twelve Months Ended June 2007,
PUBLIC TRANSPORTATION INTRODUCTION
 PUBLIC TRANSPORTATION INTRODUCTION 1 OUTLINE Current Status and Recent Trends Significant Influences A Critical Assessment Arguments Supporting Public Transport Future Influences Ingredients for Future
Sound Transit Operations August 2015 Service Performance Report. Ridership
 Ridership Total Boardings by Mode Mode Aug-14 Aug-15 % YTD-14 YTD-15 % ST Express 1,534,241 1,553,492 1.3% 11,742,839 12,354,957 5.2% Sounder 275,403 326,015 18.4% 2,139,086 2,463,422 15.2% Tacoma Link
AGENDA GUEMES ISLAND FERRY OPERATIONS PUBLIC FORUM
 AGENDA GUEMES ISLAND FERRY OPERATIONS PUBLIC FORUM Wednesday, August 17, 211 6: p.m. Guemes Island Community Hall ~ 7549 Guemes Island Road Thank you for attending the second Annual Public Forum in 211.
Houston Regional Transit: Fare Structures (effective March 2015)
") Houston Regional Transit: Fare Structures (effective March 2015) Metropolitan Transit Authority of Harris County (METRO) Communities that are part of the METRO service area include the cities of Houston,
Houston Regional Transit: Fare Structures (effective March 2015) Metropolitan Transit Authority of Harris County (METRO) Communities that are part of the METRO service area include the cities of Houston,
State of the Airport Robert S. Bowen, Executive Director October 18, 2018
 Robert S. Bowen, Executive Director October 18, 2018 A Year of Change The last year will be remembered as a period when the airlines, bolstered by a growing national economy, moderate fuel prices and changing
A Public Transportation Review Evaluating Metro s Operational Efficiency, Service Capacity and Fiscal Impact
 A Public Transportation Review Evaluating Metro s Operational Efficiency, Service Capacity and Fiscal Impact Minneapolis St. Louis Denver Indianapolis Louisville Austin Cleveland Pittsburgh Columbus Cincinnati
Thank you for participating in the financial results for fiscal 2014.
 Thank you for participating in the financial results for fiscal 2014. ANA HOLDINGS strongly believes that safety is the most important principle of our air transportation business. The expansion of slots