The post-doc years: Jan Nov in Nanjing, China (NKG)
|
|
|
- Earl Tyrone Pierce
- 5 years ago
- Views:
Transcription
")


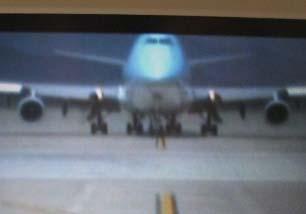
1 The post-doc years: Jan Nov in Nanjing, China (NKG) January 2009: DEN-EWR-DCA. An EL Al B744 with Newark s harbor in the background, a Continental B772, and a Continental B767 on approach with the Manhattan Skyline in the background. DCA: an US Airways A319 in a Piedmont special paint scheme. January 2009: LAX spotting. An ANA B773 with fogging on the wings, a Air New Zealand B747, a Malaysia Airlines B744 landing into the sunset, and a Qantas A380.


2 February 2009 my brother in law has a pilot s license, and is always gracious enough to build up some required flying time for when I visit. We often fly over SeaTac, and perform touch and goes at Boeing Field, Renton, and Paine Field. Below, top: Matt and I in the Stinson Voyager and Renton on the right. Bottom: SeaTac on the left, Boeing Field center, and Paine on the right. May 2009: PVG-DXB-ATH-RHO. Top: a Northwest A332, a Mahan Air B744 and a Bangladesh Airlines A310 after a fire event in Dubai. Bottom: my Air Comet A320, an Olympic A343,and an Egypt Air A343.


 sign with")


3 July 2009: XIY-CTU-NKG. An intrachina spotting experience. One really cool thing about China airports is they always have the name of the city in big letters. Xian s (XIY, 西安 ) sign with an China Xinhua Airlines B734 and an Ilyushin IL-76 on the tarmac. In Chengdu, a Shanghai Airlines B737, China Eastern A320, and Hainan Airlines B737. October 2009: NKG-HKG-BNE. Top row: my DragonAir A333 in NKG, and a South African A346 and Kenya Airways B772 in HKG. Middle row: my Qantas A333 in BNE, a Cathy Pacific B773 in the Asia s World City special livery in HKG, and an Aeroflot MD-11 cargo in HKG. Bottom row: in HKG, a Kingfisher A330, a Cebu Pacific A320, a Jet Airways A330, and a sweet China Airlines A332.


4 January 2010 a blast from the past, spotting with Eshan at ORD. On top, the arrivals from Asia: a JAL 773, Korean Air 744, Shanghai Airlines Cargo MD-11. On bottom, a Cayman Airways B733, American B763, Royal Jordanian A342. January 2010: PVG-SIN. Top: My China Eastern A300, a Vietnam Airlines A321, and a Batavia Air A319. Bottom: a Thai A333, an Air Asia A320, a Tiger A319, and Singapore Airlines A380.


5 March 2010: PVG-LAX. Top: My China Eastern A346, a Thai A346, a Bentley Continental and JAL Taurcedes. Middle: a Cathy Pacific A343 with a FedEx MD11, the In-N-Out Burger from my A346 and with an Asian 744, and bottom, a Mexicana A320. April 2010: PVG-ORD-XNA. An Air China A320, a : Malaysia B772, an Air Canada B773, and an AeroUnion A300 cargo.


6 May 2010: NKG-CKG. A Russian Ilyushin Il-62, a China Air Force B733, a Chongqing Airlines A320, and my Sichuan Airlines A320. June 2010: PVG-ZHR-MXP. Top row: my Swiss A343, an Evergreen International B742, and a flyniki A320. Middle row: a smoggy PVG lineup with four continents represented. Bottom row: a TAM A345, Blue Panorama B763, IranAir A320, and an Edelweiss A332. Far right for the World Cup, Swiss brought out the chocolate!.
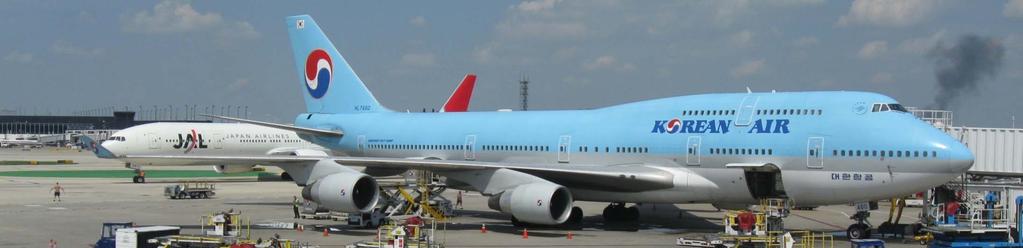
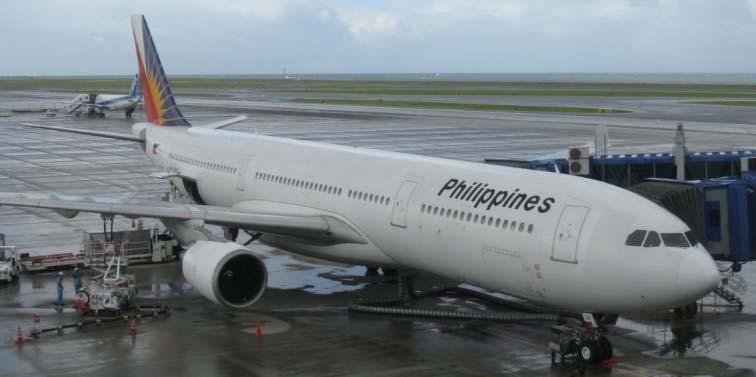
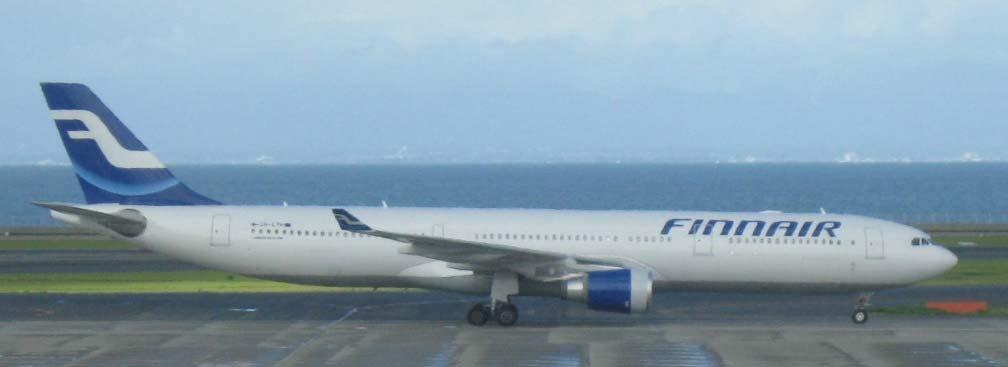
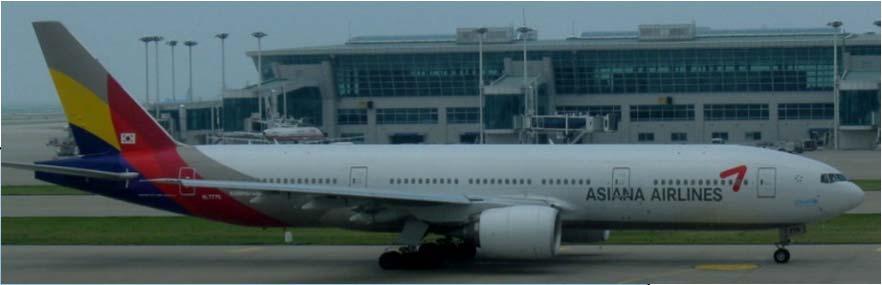
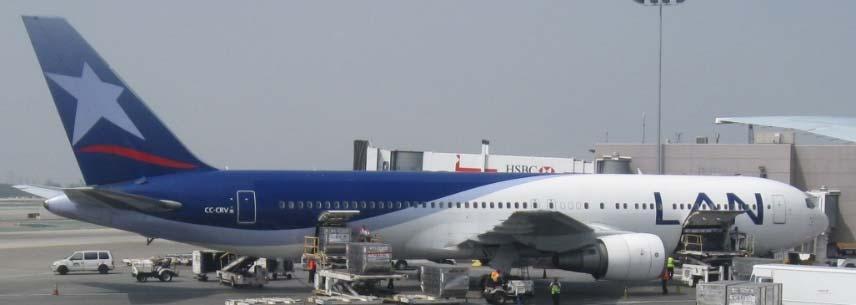
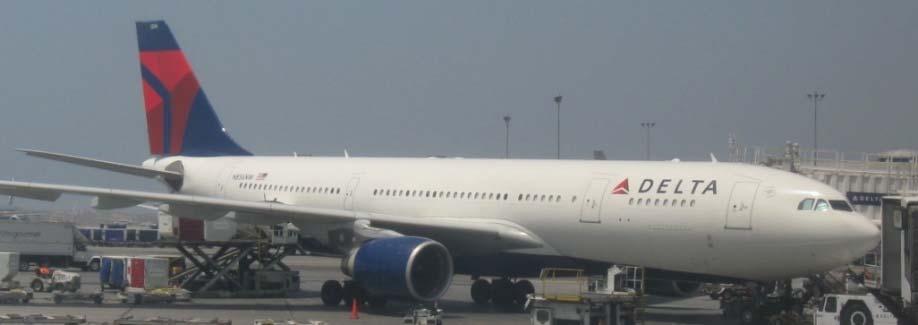
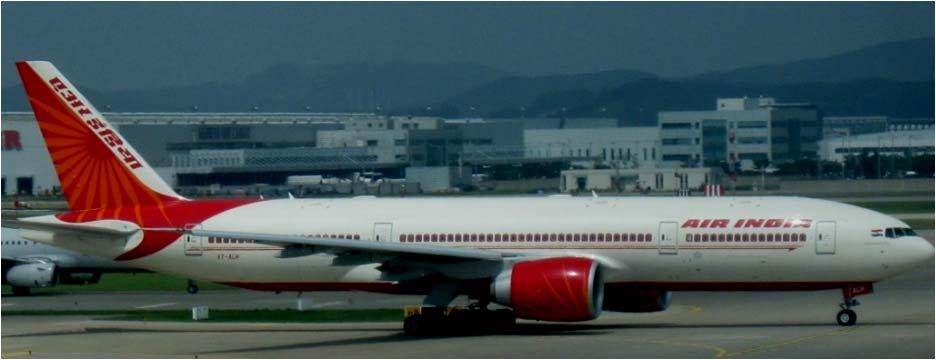
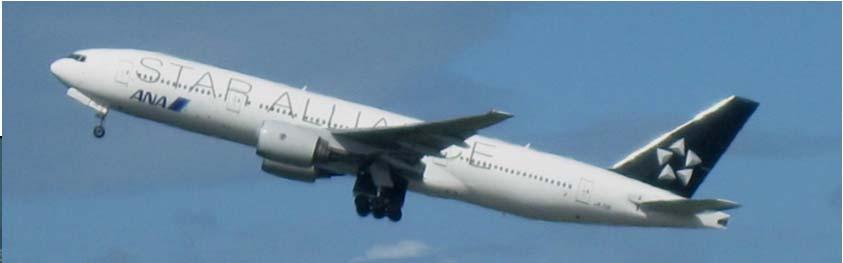
7 August 2010: PVG-ICN-NGO-ICN-LAX-MSP-MKE; ORD-ICN-PVG. Top: a Philippines Airlines A333, a Finnair A333, an Asiana B772, and the Hollywood Sign. Middle: my Korean Air B744 with a JAL B773 taxing behind. Bottom: a Lan B763, a Delta A333, a Korean Air Cargo B744 facing off with us at the runway entrance (picture of the video from the nose camera of my B773), an Air India B772, and an ANA Star Alliance special paint scheme B772


,")
 Tulufan")
.")


8 September 2010: NKG-INC-URC-XIY-NKG. Top: a Juneyao Airlines A320, an OK Air B738, two Shenzhen Airlines B738, and a Shandong Airlines B738. Urumqi in English, Chinese ( 乌鲁木齐 ), and Uyghur.(ي ۈرۈمچى) Tulufan Airport in Chinese ( 吐鲁番机场 ). November 2010: Coming home, PVG-NRT-ATL-XNA. Left counter-clockwise: my Delta B744, an Alitalia B772, an Aeroflot A330 in a SkyTeam special paint scheme, an Air France A380, my Delta B772, and my Delta CRJ-200.
ACI-NA 19th ANNUAL CONFERENCE EXHIBITION
 ACI-NA 19th ANNUAL CONFERENCE EXHIBITION Air Service Reality Check Ed Faberman Air Carrier Association of America September 28, 2010 GOOD TO BE IN PITTSBURGH!!! 2 Airline Industry Challenges Future of
Japan Export Air. International Air Freight Fuel Surcharge. All Destinations
 Japan Export Air January 12, 218 International Air Freight Fuel Surcharge Carrier 3K Jet Star Asia Airways 66 1-Jan-15 Taiwan, Philippines 48 1-Jan-15 5C C.A.L. Cargo 13 1-Oct-12 China, Hong Kong, Korea,
Japan Export Air. International Air Freight Fuel Surcharge. All Destinations
 Japan Export Air January 3, 218 International Air Freight Fuel Surcharge Carrier 3K Jet Star Asia Airways All s 66 1-Jan-15 Taiwan, Philippines 48 1-Jan-15 5C C.A.L. Cargo All s 13 1-Oct-12 China, Hong
Domestic Departure flight. Dep. Destination 14-Sep 15-Sep 16-Sep 17-Sep 18-Sep 19-Sep 20-Sep
 Flight Information on Sep 14-20 (as of Sep 13 20:00) Kansai International Airport operates some part of terminal 1 and terminal 2. Customer using the following flights, please check which terminal will
The contents of this report may not be reproduced without the written consent of COHOR.
 Nice Côte d Azur Airport NCE/LFMN Summer 2018 - Start Of Season Report Report data extraction date: 27 March 2018 Table of contents Evolution of allocated slots at the Start Of Season (SOS)... 2 Total
Japan Export Air. International Air Freight Fuel Surcharge. All Destinations
 Japan Export Air March 30, 2019 International Air Freight Fuel Surcharge 3K Jet Star Asia Airways All s 66 1-Jan-15 Taiwan, Philippines 48 1-Jan-15 5C C.A.L. Cargo All s 130 1-Oct-12 China, Hong Kong,
Japan Export Air. International Air Freight Fuel Surcharge. All Destinations
 Japan Export Air February 27, 2019 International Air Freight Fuel Surcharge 3K Jet Star Asia Airways All s 66 1-Jan-15 Taiwan, Philippines 48 1-Jan-15 5C C.A.L. Cargo All s 130 1-Oct-12 China, Hong Kong,
Lyon St Exupéry Airport LYS/LFLL
 Lyon St Exupéry Airport LYS/LFLL Winter 2018 - Start Of Season Report Report data extraction date: 30 October 2018 Table of contents Evolution of allocated slots at the Start Of Season (SOS)... 2 Slots
trends bulletin
 Airlines www.enac.fr RPK* (millions) 1st 12/11 2nd 12/11 3nd 12/11 UNITED HOLDING 292 189-0,3 0,3 0,1-1,9 DELTA AIR LINES 270 817 1,1 0,2 0,9 0,0 AIR FRANCE - KLM 215 082 6,9 7,2 3,5 1,9 AMERICAN AL 203
Global Airline Capacity Winter 2013/14 Boeing Commercial Airplanes
 Global Airline Capacity Winter 2013/14 Boeing Commercial Airplanes Istanbul Technical University Air Transportation Management M.Sc. Program BOEING is a trademark of Boeing Management Company. Network,
trends bulletin
 www.enac.fr Main airlines traffic 1 st quarter 2012 Airlines RPK* (millions) 11/10 (%) 12/11 (%) DELTA AIR LINES 310 228-0,2 1,0 UNITED HOLDING 292 520-1,7 0,1 AIR FRANCE - KLM 214 956 6,9 7,2 AMERICAN
Airline On-time Arrival Performance (Nov 2018, by VariFlight) SC Retains top spot among China s Major Airlines in APAC OTP Chart for
 SC Retains top spot among China s Major Airlines in APAC OTP Chart for") Airline (Nov 2018, by VariFlight) SC Retains top spot among China s Major in APAC OTP Chart for five consecutive months Powered by VariFlight incomparable aviation database, the monthly report of Airline
Airline (Nov 2018, by VariFlight) SC Retains top spot among China s Major in APAC OTP Chart for five consecutive months Powered by VariFlight incomparable aviation database, the monthly report of Airline
trends bulletin 07/2011 Main airlines traffic 1 s quarter 2011 Main low cost airlines
 www.enac.fr Main airlines traffic 1 s quarter 2011 Airlines RPK* (millions) 2010** 10/09 (%) DELTA AIR LINES 310 900 2,2 1,3 UNITED / CONTINENTAL (1) 226 700-12,2-2,8 AMERICAN AL 201 900 2,5 1,6 AIR FRANCE-KLM
The contents of this report may not be reproduced without the written consent of COHOR.
 Nice Côte d Azur Airport NCE/LFMN Winter 2018 - Start Of Season Report Report data extraction date: 31 October 2018 Table of contents Evolution of allocated slots at the Start Of Season (SOS)... 2 Total
Heathrow Airport (LHR)
") Heathrow Airport (LHR) Summer 2018 (S18) Start of Season Report Report Date: Wed 21Mar2018 Headlines S18 Start vs. S17 Start vs. S17 End Total Air Transport Movements (Passenger & Freight) 294775 0.2%
Heathrow Airport (LHR) Summer 2018 (S18) Start of Season Report Report Date: Wed 21Mar2018 Headlines S18 Start vs. S17 Start vs. S17 End Total Air Transport Movements (Passenger & Freight) 294775 0.2%
Airline On-time Arrival Performance (May 2018, by VariFlight) SQ Tops Asia-Pacific Medium-Sized Airlines for Five Consecutive Months
 SQ Tops Asia-Pacific Medium-Sized Airlines for Five Consecutive Months") Airline (May 2018, by VariFlight) SQ Tops Asia-Pacific Medium-Sized for Five Consecutive Months Powered by VariFlight incomparable aviation database, the monthly report of Airline provides an overview
Airline (May 2018, by VariFlight) SQ Tops Asia-Pacific Medium-Sized for Five Consecutive Months Powered by VariFlight incomparable aviation database, the monthly report of Airline provides an overview
trends bulletin
 www.enac.fr Main airlines traffic 1 st quarter 2013 Airlines RPK* (millions) 12/11 (%) UNITED HOLDING 288 680-1,3-1,6 DELTA AIR LINES 271 808 0,7 1,7 AIR FRANCE - KLM 223 887 3,1 0,8 AMERICAN AL 203 299-0,1
01/2016. Main airlines traffic 2015 (1) RPK* (millions) /14 (% ) 1st quarter 16/15 (% ) Airlines
 RPK* (millions) /14 (% ) 1st quarter 16/15 (% ) Airlines") Main airlines traffic (1) Airlines RPK* (millions) AMERICAN AL GROUP 321 000 3,6 3,1 DELTA AIR LINES 303 100 4,0 3,2 UNITED HOLDING 295 500 2,6 0,5 EMIRATES AL 251 200 8,8 nd AIR FRANCE/KLM 235 700 2,8
Main airlines traffic (1) Airlines RPK* (millions) AMERICAN AL GROUP 321 000 3,6 3,1 DELTA AIR LINES 303 100 4,0 3,2 UNITED HOLDING 295 500 2,6 0,5 EMIRATES AL 251 200 8,8 nd AIR FRANCE/KLM 235 700 2,8
trends bulletin 07/2014 Actual and planned fleet* (April 2014) * Source : FG-Flightglobal / ENAC Air Transport Data
 * Source : FG-Flightglobal / ENAC Air Transport Data") 0/0 Actual and planned fleet* (April 0) AEROFLOT RUSSIAN AL AIR CANADA AIR CHINA AIR FRANCE Airbus A00 Airbus A000 Airbus A00 Airbus A000 Airbus A000 Airbus A000 Boeing 00 0 Boeing 00 0 Boeing 00 Boeing
0/0 Actual and planned fleet* (April 0) AEROFLOT RUSSIAN AL AIR CANADA AIR CHINA AIR FRANCE Airbus A00 Airbus A000 Airbus A00 Airbus A000 Airbus A000 Airbus A000 Boeing 00 0 Boeing 00 0 Boeing 00 Boeing
Main airlines traffic 3 rd quarter nd quarter 16/15. 1st quarter 16/15. 3rd. quarter 16/15 01/ nd quarter 16/15. 3rd quarter 16/15.
 Main airlines traffic 3 rd Airlines AMERICAN AL Group 321 000 3,6 3,1 0,6-2,2 DELTA AIR LINES 303 100 4,0 3,2 3,0-0,2 UNITED HOLDING 295 500 2,6 0,5 0,1 2,4 EMIRATES AL 251 200 8,8 2,5 5,5 nd AIR FRANCE/KLM
Top 50 Passenger traffic between US and the others (country-pair) CANADA MEXICO UNITED KINGDOM JAPAN GERMANY FRANCE DOMINICAN (REP.
 CANADA MEXICO UNITED KINGDOM JAPAN GERMANY FRANCE DOMINICAN (REP.") Airlines nd: not disclosed Airlines www.enac.fr Main low-cost airlines Pax (thousands) RPK* (millions) SOUTHWEST AL 135 767 2,0 4,7 5,3 7,1 RYANAIR 86 290 6,0 29,7 15,6 11,2 EASYJET AL 54 137 6,2 7,1 7,6
Airlines nd: not disclosed Airlines www.enac.fr Main low-cost airlines Pax (thousands) RPK* (millions) SOUTHWEST AL 135 767 2,0 4,7 5,3 7,1 RYANAIR 86 290 6,0 29,7 15,6 11,2 EASYJET AL 54 137 6,2 7,1 7,6
ANA Fact Book All Nippon Airways Co., Ltd. Contents
 All Nippon Airways Co., Ltd. Contents 2 Domestic Passenger Market 4 International Passenger Market 5 Cargo Market 6 Haneda and Narita Airports 7 Global Alliance Statistics 8 Aircraft Specifications 9 Consolidated
Los Angeles World Airports (LAWA) Traffic Comparison (TCOM) Los Angeles International Airport
 Traffic Comparison (TCOM) Los Angeles International Airport") Los Angeles World Airports (LAWA) Traffic Comparison (TCOM) Los Angeles Airport Passenger Traffic s 1 3,43,69 1,6,73 September 1 3,85,664 1,5,195 4.47% Calendar YTD September 9 % Change 1 9 3,4,561 31,6,815
Los Angeles World Airports (LAWA) Traffic Comparison (TCOM) Los Angeles Airport Passenger Traffic s 1 3,43,69 1,6,73 September 1 3,85,664 1,5,195 4.47% Calendar YTD September 9 % Change 1 9 3,4,561 31,6,815
Los Angeles World Airports (LAWA) Traffic Comparison (TCOM) Los Angeles International Airport
 Traffic Comparison (TCOM) Los Angeles International Airport") Los Angeles World Airports (LAWA) Traffic Comparison (TCOM) Los Angeles Airport Passenger Traffic s 1 3,75,6 1,34,133 December 1 3,474,16 1,35,576 7.% Calendar YTD December 9 % Change 1 9 43,134,145 41,419,913
Los Angeles World Airports (LAWA) Traffic Comparison (TCOM) Los Angeles Airport Passenger Traffic s 1 3,75,6 1,34,133 December 1 3,474,16 1,35,576 7.% Calendar YTD December 9 % Change 1 9 43,134,145 41,419,913
Mergers, Alliances and Consolidation- A Path to Sustainability?
 DAY 1: WEDNESDAY 18 APRIL 2012 Strategies and Tools for Mergers, Alliances and Consolidation- A Path to Sustainability? Captain Don Wykoff President International Federation of Air Line Pilots Associations
AUCKLAND INTERNATIONAL AIRPORT AKL W18 Start of Season Report (International Traffic)
") AUCKLAND INTERNATIONAL AIRPORT AKL W18 Start of Season Report (International Traffic) Key Statistics W17 Operated W18 -Season Start Percentage Change Air Transport Movements 24,66 25,73 4.5% Total Seats
AUCKLAND INTERNATIONAL AIRPORT AKL W18 Start of Season Report (International Traffic) Key Statistics W17 Operated W18 -Season Start Percentage Change Air Transport Movements 24,66 25,73 4.5% Total Seats
Prediction of Skytrax airline rankings, short formula (2e)
") Site: Wiki of Science at http://wikiofscience.wikidot.com Source page: 20120725 - Prediction of Skytrax airline rankings, short formula (2e) - 2010 at http://wikiofscience.wikidot.com/print:20120725-skytrax-al-short-perezgonzalez2010
Site: Wiki of Science at http://wikiofscience.wikidot.com Source page: 20120725 - Prediction of Skytrax airline rankings, short formula (2e) - 2010 at http://wikiofscience.wikidot.com/print:20120725-skytrax-al-short-perezgonzalez2010
trends bulletin 01/2012 Main airlines traffic 3 rd quarter 2011 Main low cost airlines
 www.enac.fr Main airlines traffic 3 rd Airlines RPK* (millions) ** 1st 2nd 3rd DELTA AIR LINES 310 900 2,2 1,3 0,9-0,4 UNITED / CONTINENTAL (1) 226 700-12,2-2,8 0,1-1,5 AMERICAN AL 201 900 2,5 1,6 1,8
Airline On-time Arrival Performance (Sept. 2017)
") Airline (Sept. 2017) Powered by VariFlight incomparable aviation database, the monthly report of Airline provides an overview of how global airlines are performing every month in 2017. Global Big Airlines
Airline (Sept. 2017) Powered by VariFlight incomparable aviation database, the monthly report of Airline provides an overview of how global airlines are performing every month in 2017. Global Big Airlines
SFO International Gateway Forum China Market Development. December 4, 2014
 SFO International Gateway Forum China Market Development December 4, 2014 United at San Francisco United is proud to be the leading airline serving San Francisco #1 in daily flights, destinations served
Orders and deliveries report
 AIRFINANCE DEALS DATABASE Orders and deliveries report Q4 215 www.airfinancejournal.com/dealsdatabase BACKLOG OVERVIEW BACKLOG WORLD BACKLOG DISTRIBUTION BY ASSET CLASS 23.7% 16.9% 3.8% Regional 11% Turboprop
Remedy awarded (complaints decided in qtr)
") Quarterly complaints data for Q2 2018 from the CAA Approved ADR entities and the CAA s Passenger Advice and Team ADR entity No remedy per million pax Total Average award consumers Air Canada/Canada Rouge
Quarterly complaints data for Q2 2018 from the CAA Approved ADR entities and the CAA s Passenger Advice and Team ADR entity No remedy per million pax Total Average award consumers Air Canada/Canada Rouge
Megahubs International Index 2018
 Published: Sep 2018 Megahubs International Index 2018 The World s Most Internationally Connected Airports 2018 OAG Aviation Worldwide Limited. All rights reserved Contents About OAG Megahubs International
Malaysia s s 2020 Vision
 Kuala Lumpur International Airport: The New Southeast Asia Airline Hub? Lev Pinelis, M.S. Transportation December 7 th, 2004 1.231 Airport Systems Planning, Design, and Management Malaysia s s 2020 Vision
Facts & Figures. Non-US Airline Traffic Aircraft Data. Aircraft Values. US Consumer Complaints February US Fuel Cost And Consumption
 Facts & Figures Aircraft Data Aircraft Values Aircraft E-190 CRJ900 RJ100 MTOW 105.4-114.2 80.5-84.5 97.5-101.5 Engine Types CF34-10E5 92; CF34-10E5A1 87; CF34-10E6 99; CF34-10E6A1 28; CF34-10E7 10 CF34-8C5
Airline On-time Arrival Performance (Nov. 2017)
") Airline (Nov. 2017) Powered by VariFlight incomparable aviation database, the monthly report of Airline On-time Departure provides an overview of how global airlines are performing in November, 2017. Global
Airline (Nov. 2017) Powered by VariFlight incomparable aviation database, the monthly report of Airline On-time Departure provides an overview of how global airlines are performing in November, 2017. Global
Airline On-time Arrival Performance (Jan. 2018)
") Airline (Jan. 2018) Powered by VariFlight incomparable aviation database, the monthly report of Airline provides an overview of how global airlines are performing in January, 2018. Global Big Airlines
Airline (Jan. 2018) Powered by VariFlight incomparable aviation database, the monthly report of Airline provides an overview of how global airlines are performing in January, 2018. Global Big Airlines
AUCKLAND INTERNATIONAL AIRPORT AKL S18 Season Start Report (International Traffic)
") AUCKLAND INTERNATIONAL AIRPORT AKL S18 Season Start Report (International Traffic) Key Statistics S17 Operated S18 -Season Start Percentage Change Air Transport Movements 31,827 33,23 3.8% Total Seats
AUCKLAND INTERNATIONAL AIRPORT AKL S18 Season Start Report (International Traffic) Key Statistics S17 Operated S18 -Season Start Percentage Change Air Transport Movements 31,827 33,23 3.8% Total Seats
Airline On-time Arrival Performance (Dec. 2017)
") Airline (Dec. 2017) Powered by VariFlight incomparable aviation database, the monthly report of Airline On-time Departure provides an overview of how global airlines are performing in December, 2017. Global
Airline (Dec. 2017) Powered by VariFlight incomparable aviation database, the monthly report of Airline On-time Departure provides an overview of how global airlines are performing in December, 2017. Global
Dubai International Airport (DXB)
") Dubai International Airport (DXB) Winter / (W) Start of Season Report Report Date: Thu -Oct- Headlines W Start vs. W Start vs. W End Total Air Transport Movements (Passenger & Freight), -.%.% Total Passenger
Dubai International Airport (DXB) Winter / (W) Start of Season Report Report Date: Thu -Oct- Headlines W Start vs. W Start vs. W End Total Air Transport Movements (Passenger & Freight), -.%.% Total Passenger
EVOLUTION OF ALLOCATED SLOTS AT THE START OF SEASON (SOS)... 2 TOTAL SLOTS BY OPERATOR TOP SLOTS DISTRIBUTION PER ALLIANCE...
... 2 TOTAL SLOTS BY OPERATOR TOP SLOTS DISTRIBUTION PER ALLIANCE...") Paris - Charles de Gaulle Airport CDG/LFPG Winter 2017 - Start Of Season Report Report data extraction date: 30 October 2017 Table of contents EVOLUTION OF ALLOCATED SLOTS AT THE START OF SEASON (SOS)...
Paris - Charles de Gaulle Airport CDG/LFPG Winter 2017 - Start Of Season Report Report data extraction date: 30 October 2017 Table of contents EVOLUTION OF ALLOCATED SLOTS AT THE START OF SEASON (SOS)...
Asia-Pacific Aviation: Growth and Challenges
 Asia-Pacific Aviation: Growth and Challenges A presentation to the ACI-NA International Aviation Issues Seminar Steve Martin Page 1 Page 2 Defining the Asia Pacific We ll call it GMT +5 GMT +12, minus
The 20 year history of global airline alliances Flight Global Graham Dunn 5 may, 2017
 The 20 year history of global airline alliances Flight Global Graham Dunn 5 may, 2017 Since the first global alliance was established 20 years ago, these airline groupings have become a central part of
AUCKLAND INTERNATIONAL AIRPORT AKL W13 Season Start IATA Report (International Traffic)
") Page 1 AUCKLAND INTERNATIONAL AIRPORT AKL W13 Season Start IATA Report (International Traffic) Key Statistics W12 Operated W13 -Season Start Percentage Change Air Transport Movements 18,744 19761 5.4%
Page 1 AUCKLAND INTERNATIONAL AIRPORT AKL W13 Season Start IATA Report (International Traffic) Key Statistics W12 Operated W13 -Season Start Percentage Change Air Transport Movements 18,744 19761 5.4%
FLEET CHANGES AND THE ECONOMIC IMPACT OF NEW TECHNOLOGY AIRCRAFT
 FLEET CHANGES AND THE ECONOMIC IMPACT OF NEW TECHNOLOGY AIRCRAFT Presented by: Deborah Meehan President and COO Simat, Helliesen and Eichner, Inc. ACI-NA Economic Specialty Conference June 6, 2006 Montreal
TAIPEI, Taiwan EVA Air joins the Star Alliance network, further strengthening the Alliance s presence in Asia-Pacific.
 Wider choice in growing Cross-Straits market TAIPEI, Taiwan EVA Air joins the Star Alliance network, further strengthening the Alliance s presence in Asia-Pacific. At the official joining ceremony held
Number of complaints decided where a financial remedy awarded. Number of complaints received others
 Quarterly data for Q4 2017 from the CAA Approved entities and the CAA s Passenger Advice and Complaints Team Airline / Airport name of Aegean Airlines PACT 2 0 0 1 3 17 - - 25% Aer Lingus PACT 12 0 7 17
Competitive Dynamics of the China-Europe Aviation Market
 Competitive Dynamics of the China-Europe Aviation Market Dr Zheng Lei Institute for Aviation Research (UK) Agenda Overview of the China-Europe Aviation Market Analysis of the Connecting Market Main players
Liberalization of Air Cargo Market
 Liberalization of Air Cargo Market Anming Zhang Sauder School of Business University of British Columbia May 8, 2014 @ ICAO Montreal 1 Multilateral / WTO approach to liberalization Annex on Air Transport
ACI 2008 WORLDWIDE AIRPORT TRAFFIC STATISTICS
 WORLD AIRPORT RANKING BY TOTAL PASSENGERS TOTAL PASSENGERS 1 ATLANTA GA ATL 90 039 280 0.7 2 CHICAGO IL ORD 69 353 876 ( 9.0) 3 LONDON LHR 67 056 379 ( 1.5) 4 TOKYO HND 66 754 829 ( 0.2) 5 PARIS CDG 60
AUCKLAND INTERNATIONAL AIRPORT AKL S14 Start of Season Report (International Traffic)
") AUCKLAND INTERNATIONAL AIRPORT AKL S14 Start of Season Report (International Traffic) Key Statistics S13 Operated S14 -Start of Season Percentage Change Air Transport Movements 25,684 26,869 4.6% Total
AUCKLAND INTERNATIONAL AIRPORT AKL S14 Start of Season Report (International Traffic) Key Statistics S13 Operated S14 -Start of Season Percentage Change Air Transport Movements 25,684 26,869 4.6% Total
Punctuality for june 2018 per airline
 Punctuality for june 2018 per airline Departures scheduled *) Delayed more than 15 minutes. **) s having less than 10 operations. Planned Cancelled Delayed *) Punctuality Avg. delay (min) Adria Airways
Air Cargo Settlement 5 c/o Garden City Group, LLC P.O. Box Dublin, OH USA CLAIM FORM GENERAL INSTRUCTIONS
 Must be Postmarked No Later Than September 9, 2016 Air Cargo Settlement 5 c/o Garden City Group, LLC P.O. Box 10083 Dublin, OH 43017-6683 USA AR5 *P-AR5-POC/1* Claim Number: Control Number: CLAIM FORM
PORT OF SEATTLE - STIA PFC Quarterly Status Report - Revenue and Expenditures Activity thru 03/31/2016
 PORT OF SEATTLE - STIA PFC Quarterly Status Report - Revenue and Activity thru 03/31/2016 Total Collection Authority $2,167,378,460 Approved for Collection Approved for Use Approved Applications "Impose"
Impacts of Global Alliance and New Large Aircraft on Airlines and Competition and Traffic Flow Patterns. Tae Hoon OUM
 Impacts of Global Alliance and New Large Aircraft on Airlines and Competition and Traffic Flow Patterns presented at the ICAO-IATA Joint Conference on Liberalization of Air Transport in Asia/Pacific (25-27
FUEL SURCHARGE EX JAPAN
 FUL SURCHARG X JAPAN Updated: March 28, 2018 --- T --- 1) * : All regions or All regions except those listed 2) The FSC of below carriers is also applied for Minimum charge. AF,AY,K,KM,KL,LY,MK,VN: Minimum
busiest routes Key facts behind the world s 20 busiest routes
 busiest routes Key facts behind the world s 2 busiest routes Based on frequency in the 12 months to February 218 Key facts behind the world s 2 busiest routes About OAG busiest routes OAG takes a closer
ACI releases World Airport Traffic Report 2009
 ACI releases World Airport Traffic Report 2009 - Passenger traffic growth down 2 percent; hard hit cargo down by 8 percent - Geneva, 5 August 2010 Director General of ACI World, Angela Gittens announced
atmosfair Airline Index 2011
 atmosfair Airline Index 2011 Copyright atmosfair, Berlin 2011 How is the Airline Index used? 1. Avoidance 2. Optimization 3. Compensation - Even efficient flights can quickly exceed a single person s climate
Los Angeles World Airports (LAWA) Traffic Comparison (TCOM) Los Angeles International Airport Calendar YTD January to December
 Traffic Comparison (TCOM) Los Angeles International Airport Calendar YTD January to December") Los Angeles World Airports (LAWA) Traffic Comparison (TCOM) Los Angeles Airport Calendar YTD January to December Jan-214 Jan-213 to to Dec-214 Dec-213 % Change Dec-214 Dec-213 % Change Passenger Traffic
Los Angeles World Airports (LAWA) Traffic Comparison (TCOM) Los Angeles Airport Calendar YTD January to December Jan-214 Jan-213 to to Dec-214 Dec-213 % Change Dec-214 Dec-213 % Change Passenger Traffic
Corporate Presentation. Miami, FL February 25th, 2015
 Corporate Presentation Miami, FL February 25th, 2015 AGENDA LATAM Airlines in figures Cargo Unit Business Update The Company We are one of the ten largest passenger and cargo airlines in the world. PAX:
AF / KL. AM Airline Aeromexpress Cargo AeroMexico Cargo
 From Malaysia to Long ICA 11-Sep-12 RM3.93 AF / KL Air France / KLM From Malaysia to Long ICA 11-Sep-12 RM3.93 * SSC is based on " chargeable weight " RM0.58 AM Aeromexpress Cargo AeroMexico Cargo Effective
Airports Council International
 Airports Council International HOW SECURITY CONTRIBUTES TO THE ECONOMIC COMPETITIVENESS OF THE AIR CARGO INDUSTRY 16APRIL 2014 Michael Rossell Director ICAO Relations ACI World 1 Mission ACI promotes the
Punctuality for september 2018 per airline
 for september 2018 per airline Departures scheduled Adria Airways 31 29 2 94% 12 61% 57 Aegean s S.A. Aeroflot Russian s 24 24 0 100% 6 75% 28 60 60 0 100% 2 97% 24 Air Baltic 90 90 0 100% 6 93% 25 Air
PORT OF SEATTLE - STIA PFC Quarterly Status Report - Revenue and Expenditures Activity thru 06/30/2016
 PORT OF SEATTLE - STIA PFC Quarterly Status Report - Revenue and Activity thru 06/30/2016 Total Collection Authority $2,167,378,460 Approved for Collection Approved for Use Approved Applications "Impose"
SAN FRANCISCO INTERNATIONAL AIRPORT
 SAN FRANCISCO INTERNATIONAL AIRPORT COMPARATIVE TRAFFIC REPORT February 2005 Fiscal Year-To-Date Feb 2005 Feb 2004 % Change 2005 2004 % Change Flight Operations - Total * Air Carrier Air Taxi Civil Military
Global Airline Study 2015 On-Time Performance Benchmark & Analysis
 www.aviationexperts.aero Global Airline Study 2015 On-Time Performance Benchmark & Analysis The bad news is time flies. The good news is you re the pilot. Michael Altshuler (Motivational Speaker & Peak
Punctuality for june 2014 per airline
 for june 2014 per airline Departures scheduled **) having less than 10 operations. Adria Airways 17 17 0 100% 4 76% 32 Aegean S.A. 12 12 0 100% 9 25% 39 Aer Lingus 30 30 0 100% 10 67% 34 Aeroflot Russian
EVOLUTION OF ALLOCATED SLOTS AT THE START OF SEASON (SOS)... 2 TOTAL SLOTS BY OPERATOR TOP SLOTS DISTRIBUTION PER ALLIANCE...
... 2 TOTAL SLOTS BY OPERATOR TOP SLOTS DISTRIBUTION PER ALLIANCE...") Paris - Charles de Gaulle Airport CDG/LFPG Summer 2018 - Start Of Season Report Report data extraction date: 26 March 2018 Table of contents EVOLUTION OF ALLOCATED SLOTS AT THE START OF SEASON (SOS)...
Paris - Charles de Gaulle Airport CDG/LFPG Summer 2018 - Start Of Season Report Report data extraction date: 26 March 2018 Table of contents EVOLUTION OF ALLOCATED SLOTS AT THE START OF SEASON (SOS)...
SAN FRANCISCO INTERNATIONAL AIRPORT
 SAN FRANCISCO INTERNATIONAL AIRPORT COMPARATIVE TRAFFIC REPORT December 2004 Fiscal Year-To-Date Dec 2004 Dec 2003 % Change 2004 2003 % Change Flight Operations - Total * Air Carrier Air Taxi Civil Military
PORT OF SEATTLE - STIA PFC Quarterly Status Report - Revenue and Expenditures Activity thru 12/31/2016
 PORT OF SEATTLE - STIA PFC Quarterly Status Report - Revenue and Activity thru 12/31/2016 Total Collection Authority $2,167,378,460 Approved for Collection Approved for Use Approved Applications "Impose"
Established and Emerging Hubs in the last Decade
 Established and Emerging Hubs in the last Decade Leading Hubs Today Emerged Hubs in the last decade Which type of markets? Where is the economic potential for hubs? Presentation at the 6 th Annual Airneth
SAN FRANCISCO INTERNATIONAL AIRPORT
 SAN FRANCISCO INTERNATIONAL AIRPORT COMPARATIVE TRAFFIC REPORT March 2005 Fiscal Year-To-Date Mar 2005 Mar 2004 % Change 2005 2004 % Change Flight Operations - Total * Air Carrier Air Taxi Civil Military
PORT OF SEATTLE - STIA PFC Quarterly Status Report - Revenue and Expenditures Activity thru 03/31/2017 No change since 2016 Q4
 PORT OF SEATTLE - STIA PFC Quarterly Status Report - Revenue and Activity thru 03/31/2017 No change since 2016 Q4 Total Collection Authority $2,167,378,460 Approved for Collection Approved for Use Approved
Hong Kong Yesterday: The Places By British Airways
 Hong Kong Yesterday: The Places By British Airways If looking for a ebook Hong Kong Yesterday: The Places by British Airways in pdf format, then you have come on to the correct site. We furnish full variation
Punctuality for march 2014 per airline
 for march 2014 per airline Departures scheduled **) having less than 10 operations. Aer Lingus 30 30 0 100% 2 93% 68 Aeroflot Russian 63 62 1 98% 1 98% 19 Air Baltic 73 72 1 99% 1 99% 19 Air Berlin 167
International update Trent Banfield International Operations & Aviation Development Manager
 International update Trent Banfield International Operations & Aviation Development Manager Agenda 1. Markets 2. Performance 3. Distribution Development 4. International Activity and Insights OUR FOCUS
In-Flight Broadband Survey of Systems and Applications
 In-Flight Broadband Survey of Systems and Applications Bruce Elbert President 1 In-Flight Broadband Connectivity for passengers Wifi Ethernet Seatback screen Land-based towers or satellite links Speeds
London Heathrow CDA Performance - by Airline and Aircraft. Period From : 01/03/2009 To: 31/03/2009. Wednesday, April 1, 2009 V1.4.1.
 Abs Jets A.S. Learjet (L23/L24/L25/28/L29) Aer Lingus Plc Airbus A320 0 0 1 100 292 96 0 0 Aeroflot-Russian s Jsc Airbus A321 0 0 0 0 310 93 0 0 Airbus A330-300 Airbus A319 0 0 0 0 16 63 0 0 Airbus A320
Suvarnabhumi Airport (VTBS/BKK) Runway Maintenance 3 Mar 2 May ICAO SAIOACG/7 & SEACG/24 March 2017 Bangkok, Thailand
 Runway Maintenance 3 Mar 2 May ICAO SAIOACG/7 & SEACG/24 March 2017 Bangkok, Thailand") Suvarnabhumi Airport (VTBS/BKK) Runway 3 Mar 2 May 2017 ICAO SAIOACG/7 & SEACG/24 March 2017 Bangkok, Thailand Area (1) 2 Area (2) 3 Area (3) 4 Runway Utilization Scheme (19) 5 Runway Utilization Scheme
Suvarnabhumi Airport (VTBS/BKK) Runway 3 Mar 2 May 2017 ICAO SAIOACG/7 & SEACG/24 March 2017 Bangkok, Thailand Area (1) 2 Area (2) 3 Area (3) 4 Runway Utilization Scheme (19) 5 Runway Utilization Scheme
Punctuality for july 2018 per airline
 Punctuality for july 2018 per airline Departures scheduled *) Delayed more than 15 minutes. **) having less than 10 operations. Planned Cancelled Delayed *) Punctuality Avg. delay (min) Adria Airways 31
FUEL SURCHARGE EX JAPAN
 FUL SURCHARG X JAPAN Updated: December 20, 2018 --- T --- 1) * : All regions or All regions except those listed 2) The FSC of below carriers is also applied for Minimum charge. AF,AY,K,KM,KL,LY,MK,VN:
FUEL SURCHARGE EX JAPAN
 FUL SURCHARG X JAPAN Updated: November 21, 2018 --- T --- 1) * : All regions or All regions except those listed 2) The FSC of below carriers is also applied for Minimum charge. AF,AY,K,KM,KL,LY,MK,VN:
2017 Airline Satisfaction Survey
 2017 Airline Survey 2 Table of Contents Part 1: Outline of This Report 3 1. Outline of the Survey 4 2. Profile of the Respondents 5 Gender /Age / Area of Residence /Occupation /Annual income 5 Purpose
Megahubs International Index
 Published: Sep 2017 2017 Megahubs International Index The World s Most Internationally Connected Airports 2017 OAG Aviation Worldwide Limited. All rights reserved OAG Megahubs International Index 2017
Punctuality for may 2014 per airline
 for may 2014 per airline Departures scheduled **) having less than 10 operations. Adria Airways 18 18 0 100% 3 83% 118 Aer Lingus 30 30 0 100% 7 77% 36 Aeroflot Russian 62 62 0 100% 4 94% 58 Air Baltic
Steve Smith Director Cargo Supply Chain Management
 IATA e-freight project status Steve Smith Director Cargo Supply Chain Management Contents 1. Introduction: Vision and Board Mandate 2. Current Performance 3. 2010 progress to increasing e-freight capability:
Download the preliminary traffic results for the top 20 busiest airports (total passenger traffic).
.") ACI World releases preliminary 2017 world airport traffic rankings Passenger traffic: Indian and Chinese airports major contributors to growth Air cargo: Volumes surge at major hubs as trade wars threaten
ACI World releases preliminary 2017 world airport traffic rankings Passenger traffic: Indian and Chinese airports major contributors to growth Air cargo: Volumes surge at major hubs as trade wars threaten
Punctuality for september 2013 per airline
 for september 2013 per airline Departures scheduled Adria Airways 17 17 0 100% 3 82% 20 Aer Lingus 26 26 0 100% 4 85% 22 Aeroflot Russian s 60 60 0 100% 9 85% 29 Air Baltic 85 84 1 99% 9 89% 32 Air Berlin
PORT OF SEATTLE - STIA PFC Quarterly Status Report - Revenue and Expenditures Activity thru 09/30/2017
 PORT OF SEATTLE - STIA PFC Quarterly Status Report - Revenue and Activity thru 09/30/2017 Total Collection Authority $3,841,864,375 Approved for Collection Approved for Use Approved Applications "Impose"
Punctuality for july 2012 per airline
 for july 2012 per airline Departures scheduled **) having less than 10 operations. Adria Airways 32 31 1 97% 3 91% 46 Aeroflot Russian Aerosvit 62 61 1 98% 8 87% 25 31 30 1 97% 13 58% 78 Air Baltic 93
FUEL SURCHARGE EX JAPAN
 FUL SURCHARG X JAPAN Updated: October 17, 2018 --- T --- 1) * : All regions or All regions except those listed 2) The FSC of below carriers is also applied for Minimum charge. AF,AY,K,KM,KL,LY,MK,VN: Minimum
Growing Size and Complexity Prof. Amedeo Odoni
 Growing Size and Complexity Prof. Amedeo Odoni Istanbul Technical University Air Transportation Management M.Sc. Program Airport Planning and Management Module 3 January 2016 Growing Size and Complexity
Rankings of Major U.S. Airports. Total Passengers 2016
 Rankings of Major U.S. Airports Total Passengers Total Passengers (Millions) 1 Hartsfield Atlanta Int'l (ATL) Atlanta 104.2 2.6 2 Los Angeles Int'l (LAX) Los Angeles 80.9 8.0 3 O'Hare Int'l (ORD) Chicago
Fly Quiet Adherence Report 3rd Quarter 2008
 Fly Quiet Adherence Report 3rd Quarter 2008 Chicago O Hare International Airport Visit the Community Resource Center on the Internet at http://www.flychicago.com Departures 60% 50% Percentage of Use 40%
I am writing in respect of your recent request of 5 February 2018, for the release of information held by the Civil Aviation Authority (CAA).
.") Communications Department External Information Services 5 March 2018 Reference: F0003589 Dear I am writing in respect of your recent request of 5 February 2018, for the release of information held by the
Communications Department External Information Services 5 March 2018 Reference: F0003589 Dear I am writing in respect of your recent request of 5 February 2018, for the release of information held by the
Vanderbilt Travel January 2019 Airfare Price Testing Testing Session, January 14, 9:30am 10:30am
 Feb 28 Feb 13, 4:50pm Feb 7, 12:05pm Feb 26, 1:18pm Date / Time 2:35pm/5:35pm/10:55pm Feb 8, 10:40pm / 1:20pm City Pair New York (LGA) Denver (DEN) Washington (DCA) Abuja (ABV) Abu Dhabi (AUH) Southwest
Global Airline On-time Arrival Performance Report November 2014
 Global Arrival Performance Report November 2014 Copyright @ 2014 VariFlight.com 1 Contents > > Part I Major Arrival Performance Figure 3 Part II Major Arrival Data 6 Copyright @ 2014 VariFlight.com 2 Part
Airports Service Evaluation Report. Third Quarter 2018
 Airports Service Evaluation Report Third Quarter 2018 CONTENTS 01 02 03 Overview Airports Service Evaluation Chinese Mainland Airports Evaluation by Region 04 About CAPSE Overview Overview CAPSE selected
Punctuality for november 2018 per airline
 for november 2018 per airline Departures scheduled Aegean s S.A. Aeroflot Russian s 21 21 0 100% 4 81% 31 60 60 0 100% 5 92% 24 Air Baltic 86 86 0 100% 3 97% 58 Air Canada 14 14 0 100% 8 43% 49 Air China