In-Flight Broadband Survey of Systems and Applications
|
|
|
- Emil McLaughlin
- 5 years ago
- Views:
Transcription

1 In-Flight Broadband Survey of Systems and Applications Bruce Elbert President 1

2 In-Flight Broadband Connectivity for passengers Wifi Ethernet Seatback screen Land-based towers or satellite links Speeds equivalent to a hotel or coffee shop hot spot Does not interfere with safe operation of aircraft instruments Pricing less that $20 per flight 2

3 North Atlantic Coverage AMC 4 Telstar 6 Intelsat 709 Eutelsat II F4 3

4 Connexion by Boeing Ku-band Phased Array Courtesy: Boeing 4

5 CBB Changed to MSA 5
6 Whither CBB Provided broadband Internet over Ethernet cable or WiFi Tested on Lufthansa in 2001, commercially available in 2004 Was available on Lufthansa, ANA, Japan Airlines, SAS, China Airlines, Singapore Airlines, Asiana Airlines, Korean Air, El-Al Israeli Airlines and Etihad Airlines Coverage to be extended to Pacific, but service shut down December
7 2009 Study by WiFi Alliance & Wakefield Research 82% of business-class passengers believed WiFi access on the plane would help them stay on top of work while flying more than an administrative assistant 71% indicated they would prefer In-Flight WiFi over a meal service on a cross-country flight 76% indicated they would choose an airline based on the availability of in-flight WiFi 79% indicated they would rather have in-flight WiFi than free movies 7

8 North American and International Offerings 8

9 GoGo by AirCell 9
10 by Leading ground-based system; took over AirPhone bandwidth Became available on Virgin America in March 2009 Offered by Air Canada, Alaska Airlines, Frontier Airlines, US Airways, AirTran, American Airlines, Continental Airlines, Delta, United, US airways, Virgin America Provides broadband Internet over WiFi Uses AirCell Iridium Blade Antenna - Three small antennas installed on the outside of the aircraft (two ATG antennas under the aircraft and one GPS antenna on top of the aircraft. 10

11 SwiftBroadband By Inmarsat 11

12 SwiftBroadband By Inmarsat Launched in 2005 using Inmarsat satellites (L-band) Utilized by OnAir and AeroMobile Provides broadband Internet over WiFi or Ethernet An example of a SwiftBroadband antenna used to provide service in commercial applications (CMA-2102SB by Esterline CMC Electronics) 12

, Air Asia, Qatar")
13 Founded in 2005 Owned by AirBus and SITA Passengers access broadband Internet through WiFi Provided on TAP Portugal, British Midland Airways, Shenzhen Airlines, Wataniya Airways, Air Blue, Kingfisher Airlines, Royal Jordanian, Jazeera Airways, Oman Air, TAM Airlines, British Airways (only from London City Airport to JFK), Air Asia, Qatar Airways 13
14 Founded 2005 Owned by ARINC (US) and Telenor (Norway) with HQ in London Available on Emirates Airline, Qantas, Virgin Australia, Malaysia Airlines (Lufthansa in the near future) Provides cell phone connectivity through a picocell 14
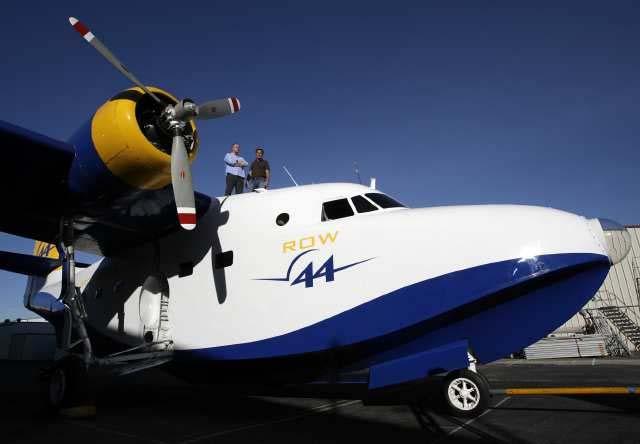
15 Row 44 15
 satellites using Ku Stream 1000 antenna from TECOM")
16 Founded 2004; privately owned Service tested on Southwest; available 2013 Provides Internet over WiFi or Ethernet cable Leases capacity over HNS (Hughes) satellites using Ku Stream 1000 antenna from TECOM Industries. 16

17 exconnect by Panasonic Avionics 17
18 exconnect by Panasonic Avionics Formed by Panasonic Avionics in 2008 To be available on Lufthansa FlyNet (later this year), Cathay Pacific (2012) and 3 unannounced airlines Dual-panel tracking antennas are produced primarily (though not exclusively) by EMS Technologies Passengers access Internet broadband through WiFi, Ethernet cable or seat-back screens 18
19 Advertised Speed Comparisons GoGo ConneXion Swift Broadband Row 44 exconnect "speeds equivalent to the connection from a hotspot at a coffee shop" Downlink speeds of 20 Mbit/s and uplink speeds of 2 Mbit/s "The bandwidth depends on a number of factors such as the avionics installed on the aircraft and up to a maximum of 864 Kbps" Averaging 30 Mbps in the downlink and 620 Kbps maximum in the uplink Mbit/s from the satellite, 1.5 Mbit/s in the opposite direction. 19
20 Advertised Price Comparison GoGo Connexion Swift Broadband Flights up to 1.5 hours $4.95, hours $7.95-$9.95 (depending on device) over 3 hours $12.95, 24 hour pass $12.95, single 30 day pass on all GoGo equipped airlines $39.95, single 30 day pass on a single GoGo airline $29.95, Monthly Subscription (AirTran, American, Delta or Virgin) $34.95 Typically $9.95 for one hour of access, $14.95 for less than three hours of access, $19.95 for 3 to 6 hours of access, and $29.95 for unlimited access. In 2006, offered free when the service was discontinued. $500,00 per plane investment for the equipment. Price varies depending on airline. In the case of cell phone service, the price is set by the individual passenger s provider (roaming fees). Row 44 Cost is between $2 and $12 per flight depending on travel distance and the type of device passengers are connecting. ex Connect Passengers pay $21.95 for 24 hours of use of the Ku-band connectivity service or an hourly rate of $
21 Conclusions In-flight Broadband (terrestrial or satellite) proven from a technical point of view GoGo achieving brand recognition and a degree of acceptance Satellite-based services face challenges and may become viable as businesses 21

22 Thank You!
MONTHLY AIRPORT TRAFFIC REPORT May 2015
 MONTHLY AIRPORT TRAFFIC REPORT AIRCRAFT OPERATIONS 2015 2014 Change Domestic Air Carrier 60,427 57,339 5.39% Air Taxi 7,825 10,967-28.65% General Aviation 547 635-13.86% Military 135 27 400.00% Subtotal
MONTHLY AIRPORT TRAFFIC REPORT September 2016
 MONTHLY AIRPORT TRAFFIC REPORT AIRCRAFT OPERATIONS 2016 2015 Change Domestic Air Carrier 59,030 59,038-0.01% Air Taxi 7,779 7,201 8.03% General Aviation 704 571 23.29% Military 21 12 75.00% Subtotal 67,534
MONTHLY AIRPORT TRAFFIC REPORT. April 2014
 MONTHLY AIRPORT TRAFFIC REPORT AIRCRAFT OPERATIONS 2014 2013 Change Domestic Air Carrier 55,529 55,119 0.74% Air Taxi 11,149 15,077-26.05% General Aviation 639 723-11.62% Military 13 14-7.14% Subtotal
MONTHLY AIRPORT TRAFFIC REPORT July 2016
 MONTHLY AIRPORT TRAFFIC REPORT AIRCRAFT OPERATIONS 2016 2015 Change Domestic Air Carrier 63,680 62,789 1.42% Air Taxi 7,548 8,007-5.73% General Aviation 717 558 28.49% Military 11 146-92.47% Subtotal 71,956
MONTHLY AIRPORT TRAFFIC REPORT March 2017
 MONTHLY AIRPORT TRAFFIC REPORT AIRCRAFT OPERATIONS 2017 2016 Change Domestic Air Carrier 60,360 61,951-2.57% Air Taxi 8,591 8,270 3.88% General Aviation 717 615 16.59% Military 14 27-48.15% Subtotal 69,682
MONTHLY AIRPORT TRAFFIC REPORT April 2017
 MONTHLY AIRPORT TRAFFIC REPORT AIRCRAFT OPERATIONS 2017 2016 Change Domestic Air Carrier 56,570 60,697-6.80% Air Taxi 7,771 7,806-0.45% General Aviation 833 699 19.17% Military 23 14 64.29% Subtotal 65,197
MONTHLY AIRPORT TRAFFIC REPORT June 2017
 MONTHLY AIRPORT TRAFFIC REPORT AIRCRAFT OPERATIONS 2017 2016 Change Domestic Air Carrier 61,445 62,662-1.94% Air Taxi 8,267 7,656 7.98% General Aviation 644 685-5.99% Military 8 18-55.56% Subtotal 70,364
MONTHLY AIRPORT TRAFFIC REPORT February 2014
 MONTHLY AIRPORT TRAFFIC REPORT AIRCRAFT OPERATIONS 2014 2013 Change Domestic Air Carrier 44,741 48,627-7.99% Air Taxi 11,144 13,003-14.30% General Aviation 569 543 4.79% Military 17 15 13.33% Subtotal
MONTHLY AIRPORT TRAFFIC REPORT July 2017
 MONTHLY AIRPORT TRAFFIC REPORT AIRCRAFT OPERATIONS 2017 2016 Change Domestic Air Carrier 63,535 63,680-0.23% Air Taxi 7,291 7,548-3.40% General Aviation 630 717-12.13% Military 15 11 36.36% Subtotal 71,471
MONTHLY AIRPORT TRAFFIC REPORT August 2018
 MONTHLY AIRPORT TRAFFIC REPORT AIRCRAFT OPERATIONS 2018 2017 Change Domestic Air Carrier 65,465 63,201 3.58% Air Taxi 7,607 7,533 0.98% General Aviation 594 609-2.46% Military 15 3 400.00% Subtotal 73,681
MONTHLY AIRPORT TRAFFIC REPORT February 2018
 MONTHLY AIRPORT TRAFFIC REPORT AIRCRAFT OPERATIONS 2018 2017 Change Domestic Air Carrier 51,809 51,854-0.09% Air Taxi 6,659 6,988-4.71% General Aviation 651 540 20.56% Military 6 9-33.33% Subtotal 59,125
MONTHLY AIRPORT TRAFFIC REPORT July 2018-(Revised)
") MONTHLY AIRPORT TRAFFIC REPORT AIRCRAFT OPERATIONS 2018 2017 Change Domestic Air Carrier 64,066 63,535 0.84% Air Taxi 7,468 7,291 2.43% General Aviation 550 630-12.70% Military 5 15-66.67% Subtotal 72,089
MONTHLY AIRPORT TRAFFIC REPORT AIRCRAFT OPERATIONS 2018 2017 Change Domestic Air Carrier 64,066 63,535 0.84% Air Taxi 7,468 7,291 2.43% General Aviation 550 630-12.70% Military 5 15-66.67% Subtotal 72,089
MONTHLY AIRPORT TRAFFIC REPORT December 2018
 MONTHLY AIRPORT TRAFFIC REPORT AIRCRAFT OPERATIONS 2018 2017 Change Domestic Air Carrier 58,905 55,828 5.51% Air Taxi 6,948 6,810 2.03% General Aviation 499 565-11.68% Military 24 25-4.00% Subtotal 66,376
MONTHLY AIRPORT TRAFFIC REPORT September 2018
 MONTHLY AIRPORT TRAFFIC REPORT AIRCRAFT OPERATIONS 2018 2017 Change Domestic Air Carrier 58,763 55,902 5.12% Air Taxi 6,537 6,689-2.27% General Aviation 605 658-8.05% Military 14 17-17.65% Subtotal 65,919
MONTHLY AIRPORT TRAFFIC REPORT December 2017
 MONTHLY AIRPORT TRAFFIC REPORT AIRCRAFT OPERATIONS 2017 2016 Change Domestic Air Carrier 55,828 57,943-3.65% Air Taxi 6,810 7,642-10.89% General Aviation 565 569-0.70% Military 25 32-21.88% Subtotal 63,228
MONTHLY AIRPORT TRAFFIC REPORT April 2018
 MONTHLY AIRPORT TRAFFIC REPORT AIRCRAFT OPERATIONS 2018 2017 Change Domestic Air Carrier 60,928 56,570 7.70% Air Taxi 6,995 7,771-9.99% General Aviation 654 833-21.49% Military 9 23-60.87% Subtotal 68,586
Onwards and upwards for in-flight connectivity
 Photo courtesy of Emirates Onwards and upwards for in-flight connectivity Just ten years ago, the idea of always-on connectivity would have sounded like science fiction to most. However, today we ve become
MONTHLY AIRPORT TRAFFIC REPORT November 2013
 MONTHLY AIRPORT TRAFFIC REPORT AIRCRAFT OPERATIONS 2013 2012 Change Domestic Air Carrier 52,937 54,739-3.29% Air Taxi 13,964 13,566 2.93% General Aviation 504 515-2.14% Military 25 28-10.71% Subtotal 67,430
Heathrow Airport (LHR)
") Heathrow Airport (LHR) Summer 2018 (S18) Start of Season Report Report Date: Wed 21Mar2018 Headlines S18 Start vs. S17 Start vs. S17 End Total Air Transport Movements (Passenger & Freight) 294775 0.2%
Heathrow Airport (LHR) Summer 2018 (S18) Start of Season Report Report Date: Wed 21Mar2018 Headlines S18 Start vs. S17 Start vs. S17 End Total Air Transport Movements (Passenger & Freight) 294775 0.2%
MONTHLY AIRPORT TRAFFIC REPORT January 2018
 MONTHLY AIRPORT TRAFFIC REPORT AIRCRAFT OPERATIONS 2018 2017 Change Domestic Air Carrier 55,461 55,980-0.93% Air Taxi 7,166 7,330-2.24% General Aviation 690 625 10.40% Military 6 11-45.45% Subtotal 63,323
CHAPTER 2 Aviation Activity Forecasts
 CHAPTER 2 Aviation Activity Forecasts 2.1 Introduction 14 CFR Part 150 requires that noise exposure maps (NEMs) be prepared for two scenarios existing conditions and conditions 5 years into the future.
Manufacturer updates
 Manufacturer updates Rockwell Collins SATCOM Status and Roadmap June 11 th, 2014 Connectivity Use Case Domains Ground Connectivity In Flight Connectivity Flight Operations Dispatch Aviate Navigate Communicate
Prediction of Skytrax airline rankings, short formula (2e)
") Site: Wiki of Science at http://wikiofscience.wikidot.com Source page: 20120725 - Prediction of Skytrax airline rankings, short formula (2e) - 2010 at http://wikiofscience.wikidot.com/print:20120725-skytrax-al-short-perezgonzalez2010
Site: Wiki of Science at http://wikiofscience.wikidot.com Source page: 20120725 - Prediction of Skytrax airline rankings, short formula (2e) - 2010 at http://wikiofscience.wikidot.com/print:20120725-skytrax-al-short-perezgonzalez2010
trends bulletin
 www.enac.fr Main airlines traffic 1 st quarter 2012 Airlines RPK* (millions) 11/10 (%) 12/11 (%) DELTA AIR LINES 310 228-0,2 1,0 UNITED HOLDING 292 520-1,7 0,1 AIR FRANCE - KLM 214 956 6,9 7,2 AMERICAN
trends bulletin
 www.enac.fr Main airlines traffic 1 st quarter 2013 Airlines RPK* (millions) 12/11 (%) UNITED HOLDING 288 680-1,3-1,6 DELTA AIR LINES 271 808 0,7 1,7 AIR FRANCE - KLM 223 887 3,1 0,8 AMERICAN AL 203 299-0,1
01/2016. Main airlines traffic 2015 (1) RPK* (millions) /14 (% ) 1st quarter 16/15 (% ) Airlines
 RPK* (millions) /14 (% ) 1st quarter 16/15 (% ) Airlines") Main airlines traffic (1) Airlines RPK* (millions) AMERICAN AL GROUP 321 000 3,6 3,1 DELTA AIR LINES 303 100 4,0 3,2 UNITED HOLDING 295 500 2,6 0,5 EMIRATES AL 251 200 8,8 nd AIR FRANCE/KLM 235 700 2,8
Main airlines traffic (1) Airlines RPK* (millions) AMERICAN AL GROUP 321 000 3,6 3,1 DELTA AIR LINES 303 100 4,0 3,2 UNITED HOLDING 295 500 2,6 0,5 EMIRATES AL 251 200 8,8 nd AIR FRANCE/KLM 235 700 2,8
Los Angeles World Airports (LAWA) Traffic Comparison (TCOM) Los Angeles International Airport Calendar YTD January to December
 Traffic Comparison (TCOM) Los Angeles International Airport Calendar YTD January to December") Los Angeles World Airports (LAWA) Traffic Comparison (TCOM) Los Angeles Airport Calendar YTD January to December Jan-214 Jan-213 to to Dec-214 Dec-213 % Change Dec-214 Dec-213 % Change Passenger Traffic
Los Angeles World Airports (LAWA) Traffic Comparison (TCOM) Los Angeles Airport Calendar YTD January to December Jan-214 Jan-213 to to Dec-214 Dec-213 % Change Dec-214 Dec-213 % Change Passenger Traffic
trends bulletin 07/2014 Actual and planned fleet* (April 2014) * Source : FG-Flightglobal / ENAC Air Transport Data
 * Source : FG-Flightglobal / ENAC Air Transport Data") 0/0 Actual and planned fleet* (April 0) AEROFLOT RUSSIAN AL AIR CANADA AIR CHINA AIR FRANCE Airbus A00 Airbus A000 Airbus A00 Airbus A000 Airbus A000 Airbus A000 Boeing 00 0 Boeing 00 0 Boeing 00 Boeing
0/0 Actual and planned fleet* (April 0) AEROFLOT RUSSIAN AL AIR CANADA AIR CHINA AIR FRANCE Airbus A00 Airbus A000 Airbus A00 Airbus A000 Airbus A000 Airbus A000 Boeing 00 0 Boeing 00 0 Boeing 00 Boeing
Los Angeles World Airports (LAWA) Traffic Comparison (TCOM) Los Angeles International Airport
 Traffic Comparison (TCOM) Los Angeles International Airport") Los Angeles World Airports (LAWA) Traffic Comparison (TCOM) Los Angeles Airport Passenger Traffic s 1 3,43,69 1,6,73 September 1 3,85,664 1,5,195 4.47% Calendar YTD September 9 % Change 1 9 3,4,561 31,6,815
Los Angeles World Airports (LAWA) Traffic Comparison (TCOM) Los Angeles Airport Passenger Traffic s 1 3,43,69 1,6,73 September 1 3,85,664 1,5,195 4.47% Calendar YTD September 9 % Change 1 9 3,4,561 31,6,815
trends bulletin 07/2011 Main airlines traffic 1 s quarter 2011 Main low cost airlines
 www.enac.fr Main airlines traffic 1 s quarter 2011 Airlines RPK* (millions) 2010** 10/09 (%) DELTA AIR LINES 310 900 2,2 1,3 UNITED / CONTINENTAL (1) 226 700-12,2-2,8 AMERICAN AL 201 900 2,5 1,6 AIR FRANCE-KLM
Los Angeles World Airports (LAWA) Traffic Comparison (TCOM) Los Angeles International Airport
 Traffic Comparison (TCOM) Los Angeles International Airport") Los Angeles World Airports (LAWA) Traffic Comparison (TCOM) Los Angeles Airport Passenger Traffic s 1 3,75,6 1,34,133 December 1 3,474,16 1,35,576 7.% Calendar YTD December 9 % Change 1 9 43,134,145 41,419,913
Los Angeles World Airports (LAWA) Traffic Comparison (TCOM) Los Angeles Airport Passenger Traffic s 1 3,75,6 1,34,133 December 1 3,474,16 1,35,576 7.% Calendar YTD December 9 % Change 1 9 43,134,145 41,419,913
Remedy awarded (complaints decided in qtr)
") Quarterly complaints data for Q2 2018 from the CAA Approved ADR entities and the CAA s Passenger Advice and Team ADR entity No remedy per million pax Total Average award consumers Air Canada/Canada Rouge
Quarterly complaints data for Q2 2018 from the CAA Approved ADR entities and the CAA s Passenger Advice and Team ADR entity No remedy per million pax Total Average award consumers Air Canada/Canada Rouge
June 3-4, 2014 Renaissance Long Beach Hotel Long Beach, CA. Show me the money! Tim Farrar TMF Associates
 Show me the money! Tim Farrar TMF Associates Deployment is accelerating 6,000 All pax connectivity - rapid deployment 5,000 Equipped aircraft 4,000 3,000 2,000 1,000 0 2006 2007 2008 2009 2010 2011 2012
Sector Report: AIRLINES
 Sector Report: AIRLINES 2017s EXECUTIVE SUMMARY You have downloaded a PDF of Sportcal Sponsorship s Airline Sector Report, summarising the key findings that are available within the report itself, as well
Air Travel travel Insights insights from Routehappy
 US & International international inflight Inflight Wi- Fi wi- fi Air Travel travel Insights insights from Routehappy Overview: Flyers find more Wi- Fi than ever before Flyers want to get online, and expect
The contents of this report may not be reproduced without the written consent of COHOR.
 Nice Côte d Azur Airport NCE/LFMN Summer 2018 - Start Of Season Report Report data extraction date: 27 March 2018 Table of contents Evolution of allocated slots at the Start Of Season (SOS)... 2 Total
Number of complaints decided where a financial remedy awarded. Number of complaints received others
 Quarterly data for Q4 2017 from the CAA Approved entities and the CAA s Passenger Advice and Complaints Team Airline / Airport name of Aegean Airlines PACT 2 0 0 1 3 17 - - 25% Aer Lingus PACT 12 0 7 17
Results of Airline Survey on Cargo Messaging
 IATA Cargo Messaging Survey 1 INTERNATIONAL AIR TRANSPORT ASSOCIATION 2011 Cargo Business Process Panel INTERNATIONAL AIR TRANSPORT ASSOCIATION 2010 Results of Airline Survey on Cargo Messaging September
June 8-10, 2015 Westfields Marriott Washington Dulles. Chantilly, VA MEDIA KIT
 June 8-10, 2015 Westfields Marriott Washington Dulles Chantilly, VA MEDIA KIT 2015 www.gcasummit.com ABOUT GCA SUMMIT The Global Connected Aircraft Summit provides airlines, operators, integrators, and
Table of Contents. About Gogo. Company History & Timeline. Fast Facts. Connectivity Technologies. Bios. 2 Press Kit 2015
 2015 Gogo Press Kit Table of Contents 3 About Gogo 4 Company History & Timeline 10 Fast Facts 13 18 Connectivity Technologies Bios 2 Press Kit 2015 About Gogo Gogo is a leading global aerocommunications
Services for Air Transport. The mobile satellite company
 Services for Air Transport The mobile satellite company In-flight connectivity The intelligent way Inmarsat is the most experienced and widely used satellite communications operator in the air transport
Mergers, Alliances and Consolidation- A Path to Sustainability?
 DAY 1: WEDNESDAY 18 APRIL 2012 Strategies and Tools for Mergers, Alliances and Consolidation- A Path to Sustainability? Captain Don Wykoff President International Federation of Air Line Pilots Associations
Boeing versus Airbus: Who has the Correct View of Future Aviation Markets?
 Boeing versus Airbus: Who has the Correct View of Future Aviation Markets? David Gillen YVR Professor & Director, Sauder School of Business-UBC Seminar Chartered Institute of Logistics and December 5,
Routehappy 2018 Wi-Fi Report Evaluates Global In-Flight Wi-Fi
 Evaluates Global In-Flight Wi-Fi 82 Airlines Now Offer In-Flight Wi-Fi; With Wi-Fi Accessible on Nearly Half of All Available Seat Miles Worldwide NEW YORK January 30, 2018 Routehappy, the rich content
AFTA Travel Trends. October 2018
 AFTA Travel Trends October 2018 AFTA Travel Trends Report 2018 Inbound and Outbound overview Introduction This snapshot provides an overview of the balance of trade between Inbound and Outbound Travel
PROSPECTS FOR IN-FLIGHT ENTERTAINMENT & CONNECTIVITY
 2017 BROCHURE PROSPECTS FOR IN-FLIGHT ENTERTAINMENT & CONNECTIVITY FORECASTS TO 2026 5 th Edition A Euroconsult Executive Report Sector dynamics, analysis and forecasts addressing the IFEC market for commercial
ANA Fact Book All Nippon Airways Co., Ltd. Contents
 All Nippon Airways Co., Ltd. Contents 2 Domestic Passenger Market 4 International Passenger Market 5 Cargo Market 6 Haneda and Narita Airports 7 Global Alliance Statistics 8 Aircraft Specifications 9 Consolidated
May Air Traffic Statistics. Prepared by the Office of Corporate Risk and Strategy
 May 214 Air Traffic Statistics Prepared by the Office of Corporate Risk and Strategy Commercial Total Int'l Dom Air Traffic Summary May 214 Passenger Activity (in Millions) Current Month Year-to-Date Last
J.P. Morgan 2019 Global Emerging Markets Corporate Conference. Miami, February 2019
 J.P. Morgan 2019 Global Emerging Markets Corporate Conference Miami, February 2019 This presentation may include forward-looking comments regarding the Company s business outlook and anticipated financial
Fly Quiet Program. 1 st Quarter 2017 Report. Chicago O Hare International Airport
 1 st Quarter 217 Report Fly Quiet Program Chicago O Hare International Airport Visit the O Hare Noise Webpage on the Internet at www.flychicago.com/ordnoise 1 st Quarter 217 Report Background On June 17,
Malaysia s s 2020 Vision
 Kuala Lumpur International Airport: The New Southeast Asia Airline Hub? Lev Pinelis, M.S. Transportation December 7 th, 2004 1.231 Airport Systems Planning, Design, and Management Malaysia s s 2020 Vision
The contents of this report may not be reproduced without the written consent of COHOR.
 Nice Côte d Azur Airport NCE/LFMN Winter 2018 - Start Of Season Report Report data extraction date: 31 October 2018 Table of contents Evolution of allocated slots at the Start Of Season (SOS)... 2 Total
ARINC Project Initiation/Modification (APIM)
") ARINC Project Initiation/Modification (APIM) 1. Name of Proposed Project APIM 09-009C Aircraft EFB Users Forum (EFB UF) Note: This APIM is an update to APIM 09-009 which initiated the EFB Users Forum.
ARINC Project Initiation/Modification (APIM) 1. Name of Proposed Project APIM 09-009C Aircraft EFB Users Forum (EFB UF) Note: This APIM is an update to APIM 09-009 which initiated the EFB Users Forum.
PORT OF SEATTLE - STIA PFC Quarterly Status Report - Revenue and Expenditures Activity thru 03/31/2016
 PORT OF SEATTLE - STIA PFC Quarterly Status Report - Revenue and Activity thru 03/31/2016 Total Collection Authority $2,167,378,460 Approved for Collection Approved for Use Approved Applications "Impose"
Inmarsat Aviation update
 Inmarsat Aviation update Miranda Mills President, Aviation Inmarsat becomes a household name Over 4,000 press enquiries Over 200 direct interviews Over 150,000 media references Calls
Fly Quiet Program Chicago O Hare International Airport
 4 th Quarter 215 Report Fly Quiet Program Chicago O Hare International Airport Visit the O Hare Noise Webpage on the Internet at www.flychicago.com/ordnoise 4 th Quarter 215 Report Background On June 17,
HEATHROW AIRPORT LHR Summer 2014 (S14) Start of Season
 Start of Season") HEATHROW AIRPORT LHR Summer 214 (S14) Start of Season KEY STATISTICS Summer 214 vs Summer 213 Air Transport Movements Allocated 282,172.6% Passenger Air Transport Movements Allocated 28,726.6% Total Seats
HEATHROW AIRPORT LHR Summer 214 (S14) Start of Season KEY STATISTICS Summer 214 vs Summer 213 Air Transport Movements Allocated 282,172.6% Passenger Air Transport Movements Allocated 28,726.6% Total Seats
October Air Traffic Statistics. Prepared by the Office of Corporate Risk and Strategy
 October 214 Air Traffic Statistics Prepared by the Office of Corporate Risk and Strategy Metropolitan Washington Airports Authority Air Traffic Statistics Table of Contents Summary Air Traffic Summary...
AFTA Travel Trends. December 2018
 AFTA Travel Trends December 2018 AFTA Travel Trends Report 2018 Inbound and Outbound overview Introduction This snapshot provides an overview of the balance of trade between Inbound and Outbound Travel
About BBAM. Dublin. Zurich
 About BBAM BBAM is a leading player in commercial aircraft leasing, financing and management providing over 200 airline customers in more than 50 countries with fleet and financing solutions over its 20+
THE FUTURE OF IN- FLIGHT CONNECTIVITY >25. The most comprehensive analysis of the of the in-flight connectivity market ever undertaken.
 THE FUTURE OF IN- FLIGHT CONNECTIVITY Introducing the 2016 edition of The Futureof In-Flight Connectivity. Some key questions answered by this report include: Which airlines currently provide in-flight
Fly Quiet Program Chicago O Hare International Airport
 1 st Quarter 216 Report Fly Quiet Program Chicago O Hare International Airport Visit the O Hare Noise Webpage on the Internet at www.flychicago.com/ordnoise 1 st Quarter 216 Report Background On June 17,
August Air Traffic Statistics. Prepared by the Office of Corporate Risk and Strategy
 August 215 Air Traffic Statistics Prepared by the Office of Corporate Risk and Strategy Metropolitan Washington Airports Authority Air Traffic Statistics Table of Contents Summary Air Traffic Summary...
Japan Export Air. International Air Freight Fuel Surcharge. All Destinations
 Japan Export Air January 12, 218 International Air Freight Fuel Surcharge Carrier 3K Jet Star Asia Airways 66 1-Jan-15 Taiwan, Philippines 48 1-Jan-15 5C C.A.L. Cargo 13 1-Oct-12 China, Hong Kong, Korea,
Japan Export Air. International Air Freight Fuel Surcharge. All Destinations
 Japan Export Air January 3, 218 International Air Freight Fuel Surcharge Carrier 3K Jet Star Asia Airways All s 66 1-Jan-15 Taiwan, Philippines 48 1-Jan-15 5C C.A.L. Cargo All s 13 1-Oct-12 China, Hong
Lyon St Exupéry Airport LYS/LFLL
 Lyon St Exupéry Airport LYS/LFLL Winter 2018 - Start Of Season Report Report data extraction date: 30 October 2018 Table of contents Evolution of allocated slots at the Start Of Season (SOS)... 2 Slots
SAN FRANCISCO INTERNATIONAL AIRPORT
 SAN FRANCISCO INTERNATIONAL AIRPORT COMPARATIVE TRAFFIC REPORT February 2005 Fiscal Year-To-Date Feb 2005 Feb 2004 % Change 2005 2004 % Change Flight Operations - Total * Air Carrier Air Taxi Civil Military
Japan Export Air. International Air Freight Fuel Surcharge. All Destinations
 Japan Export Air March 30, 2019 International Air Freight Fuel Surcharge 3K Jet Star Asia Airways All s 66 1-Jan-15 Taiwan, Philippines 48 1-Jan-15 5C C.A.L. Cargo All s 130 1-Oct-12 China, Hong Kong,
Japan Export Air. International Air Freight Fuel Surcharge. All Destinations
 Japan Export Air February 27, 2019 International Air Freight Fuel Surcharge 3K Jet Star Asia Airways All s 66 1-Jan-15 Taiwan, Philippines 48 1-Jan-15 5C C.A.L. Cargo All s 130 1-Oct-12 China, Hong Kong,
PORT OF SEATTLE - STIA PFC Quarterly Status Report - Revenue and Expenditures Activity thru 06/30/2016
 PORT OF SEATTLE - STIA PFC Quarterly Status Report - Revenue and Activity thru 06/30/2016 Total Collection Authority $2,167,378,460 Approved for Collection Approved for Use Approved Applications "Impose"
Ancillary Fees Comparison Chart
 Ancillary Fees Comparison Chart IMPORTANT NOTICE: The grid below summarizes the ancillary fees of a representative sample of the major s as of May 2, 2011. s provide exemptions for bag and seat fe for
DATA INSIGHT: CABIN INTERIORS
 DATA INSIGHT: CABIN INTERIORS United Arab Emirates All data in this document correct as of 2 March 215. Only passengercarrying aircraft included. Photographs from companies online media centres unless
SAN FRANCISCO INTERNATIONAL AIRPORT
 SAN FRANCISCO INTERNATIONAL AIRPORT COMPARATIVE TRAFFIC REPORT December 2004 Fiscal Year-To-Date Dec 2004 Dec 2003 % Change 2004 2003 % Change Flight Operations - Total * Air Carrier Air Taxi Civil Military
air traffic statistics
 December 213 air traffic statistics Prepared by the Office of Finance Department of Internal Controls, Compliance and Financial Strategy Commercial Total Dom Int'l Passengers % Change Air Traffic Summary
SAN FRANCISCO INTERNATIONAL AIRPORT
 SAN FRANCISCO INTERNATIONAL AIRPORT COMPARATIVE TRAFFIC REPORT March 2005 Fiscal Year-To-Date Mar 2005 Mar 2004 % Change 2005 2004 % Change Flight Operations - Total * Air Carrier Air Taxi Civil Military
AFTA Travel Trends. November 2018
 AFTA Travel Trends November AFTA Travel Trends Report Inbound and Outbound overview Introduction This snapshot provides an overview of the balance of trade between Inbound and Outbound Travel for Year
PORT OF SEATTLE - STIA PFC Quarterly Status Report - Revenue and Expenditures Activity thru 12/31/2016
 PORT OF SEATTLE - STIA PFC Quarterly Status Report - Revenue and Activity thru 12/31/2016 Total Collection Authority $2,167,378,460 Approved for Collection Approved for Use Approved Applications "Impose"
PORT OF SEATTLE - STIA PFC Quarterly Status Report - Revenue and Expenditures Activity thru 03/31/2017 No change since 2016 Q4
 PORT OF SEATTLE - STIA PFC Quarterly Status Report - Revenue and Activity thru 03/31/2017 No change since 2016 Q4 Total Collection Authority $2,167,378,460 Approved for Collection Approved for Use Approved
ACI-NA 19th ANNUAL CONFERENCE EXHIBITION
 ACI-NA 19th ANNUAL CONFERENCE EXHIBITION Air Service Reality Check Ed Faberman Air Carrier Association of America September 28, 2010 GOOD TO BE IN PITTSBURGH!!! 2 Airline Industry Challenges Future of
GOGO Overview How it Works Shop by Fares not Search by Schedule IMPORTANT:
 GOGO Overview Concur is happy to announce our next direct connect provider, Gogo. Gogo allows travelers to get online while in the air, keeping them connected. Using the Gogo exclusive network and services,
Punctuality for september 2018 per airline
 for september 2018 per airline Departures scheduled Adria Airways 31 29 2 94% 12 61% 57 Aegean s S.A. Aeroflot Russian s 24 24 0 100% 6 75% 28 60 60 0 100% 2 97% 24 Air Baltic 90 90 0 100% 6 93% 25 Air
Fly Quiet Program Chicago O Hare International Airport
 st Quarter 28 Report Fly Quiet Program Chicago O Hare International Airport Visit the O Hare Noise Webpage on the Internet at www.flychicago.com/ordnoise st Quarter 28 Report BACKGROUND On June 7, 997,
February Air Traffic Statistics. Prepared by the Office of Corporate Risk and Strategy
 February 215 Air Traffic Statistics Prepared by the Office of Corporate Risk and Strategy Commercial Total Dom Int'l Passengers % Change Air Traffic Summary February 215 Passenger Activity (in Millions)
AFTA Travel Trends. September 2018
 AFTA Travel Trends September 2018 AFTA Travel Trends Report 2018 Inbound and Outbound overview Introduction This snapshot provides an overview of the balance of trade between Inbound and Outbound Travel
Hong Kong Yesterday: The Places By British Airways
 Hong Kong Yesterday: The Places By British Airways If looking for a ebook Hong Kong Yesterday: The Places by British Airways in pdf format, then you have come on to the correct site. We furnish full variation
2018 Airline Satisfaction Survey
 2018 Airline Survey 2 Table of Contents Part 1: Outline of This Report 3 1. Outline of the Survey 4 2. Profile of the Respondents 5 Gender /Age /Area of Residence /Occupation /Annual income 5 Purpose for
AFTA Travel Trends. January 2019
 AFTA Travel Trends January 2019 AFTA Travel Trends Report 2019 Inbound and Outbound overview Introduction This snapshot provides an overview of the balance of trade between Inbound and Outbound Travel
Initial 4D Trajectory Management via SwiftBroadband Iris Event Salzberg
 Initial 4D Trajectory Management via SwiftBroadband Iris Event Salzberg Feb 5, 2013 Background: Inmarsat Aviation Services With more than 11,000 aircraft relying on global in-flight connectivity from Inmarsat,
welcome TRAVEL GUIDE HRL LABORATORIES 3011 Malibu Canyon Rd Malibu, CA
 welcome IN 2019 1 NEW P lease bring a current government-issued photo id with you when you visit HRL. 3011 Malibu Canyon Rd 310.317.5000 www.hrl.com 5 HRL LABORATORIES TRAVEL GUIDE Acceptable Documentation
Introduction: Airline Industry Overview Dr. Peter Belobaba Presented by: Alex Heiter & Ali Hajiyev
 Introduction: Airline Industry Overview Dr. Peter Belobaba Presented by: Alex Heiter & Ali Hajiyev Istanbul Technical University Air Transportation Management M.Sc. Program Network, Fleet and Schedule
AFTA Travel Trends. April 2018
 AFTA Travel Trends April 2018 AFTA Travel Trends Report 2018 Inbound and Outbound overview Introduction This snapshot provides an overview of the balance of trade between Inbound and Outbound Travel for
Fly Quiet Program. 4 th Quarter 2016 Report. Chicago O Hare International Airport
 4 th Quarter 216 Report Fly Quiet Program Chicago O Hare International Airport Visit the O Hare Noise Webpage on the Internet at www.flychicago.com/ordnoise 4 th Quarter 216 Report Background On June 17,
PROSPECTS FOR IN-FLIGHT ENTERTAINMENT & CONNECTIVITY
 2018 BROCHURE PROSPECTS FOR IN-FLIGHT ENTERTAINMENT & CONNECTIVITY FORECASTS TO 2027 6 th Edition A Euroconsult Executive Report Sector dynamics, analysis and forecasts addressing the IFEC market for commercial
STATISTICAL REPORT Fiscal YEAR SUMMARY. Houston Airport System P.O. Box Houston, TX
 STATISTICAL REPORT 215 Fiscal YEAR SUMMARY P.O. Box 616 Houston, TX 7725 16 Table of Contents 1 Aircraft Operations 2 3 George Bush Intercontinental 4 William P. Hobby 5 Originating Enplaned 6 7 8 Passenger
Logan International Airport
 Logan International Airport Mont Blanc Kiehl s Michael Kors Hugo Boss Durgin-Park TERMINAL E Aeromexico Air Berlin Air Europa Air France Alitalia Avianca Azores British Airways Cathay Pacific Copa Airlines
air traffic statistics
 September 213 air traffic statistics Prepared by the Office of Finance Department of Internal Controls, Compliance and Financial Strategy Commercial Total Int'l Dom Passengers % Change Air Traffic Summary
Ancillary Fees Comparison Chart
 Ancillary Fees Comparison Chart Updated June 20, 2012 The information provided summarizes the ancillary fees of a representative sample of the major airlines. Most airlines provide exemptions for bag and
Punctuality for june 2018 per airline
 Punctuality for june 2018 per airline Departures scheduled *) Delayed more than 15 minutes. **) s having less than 10 operations. Planned Cancelled Delayed *) Punctuality Avg. delay (min) Adria Airways
TAIPEI, Taiwan EVA Air joins the Star Alliance network, further strengthening the Alliance s presence in Asia-Pacific.
 Wider choice in growing Cross-Straits market TAIPEI, Taiwan EVA Air joins the Star Alliance network, further strengthening the Alliance s presence in Asia-Pacific. At the official joining ceremony held
ARINC Project Initiation/Modification (APIM)
") Project Initiation/Modification proposal for the AEEC Date Proposed: June 14, 2016 ARINC Project Initiation/Modification (APIM) 1.0 Name of Proposed Project APIM 16-015 eenabled Aircraft Ground Systems
Project Initiation/Modification proposal for the AEEC Date Proposed: June 14, 2016 ARINC Project Initiation/Modification (APIM) 1.0 Name of Proposed Project APIM 16-015 eenabled Aircraft Ground Systems