ACI EUROPE. Airport Traffic Report. August 2012 ACI EUROPE
|
|
|
- Suzan Carter
- 5 years ago
- Views:
Transcription

1 ACI EUROPE Airport Traffic Report 2012 Source: ACI WORLD ACI EUROPE
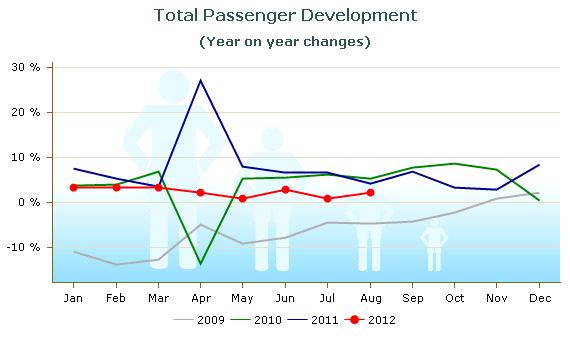
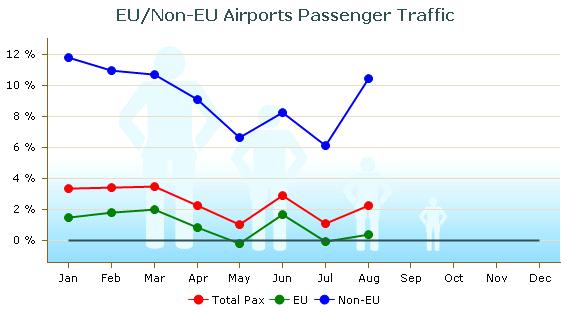
2 EU airports see weak summer traffic, while non-eu enjoy strong growth For immediate release 2 October 2012 Brussels, 2 October 2012: The latest traffic figures for Europe s airports released today provide more evidence of an underwhelming summer season for the air transport sector. Overall passenger traffic at European airports in the month of reported growth of just +2.2%. The overall freight traffic among European airports declined by -0.9% in the same period, while aircraft movements (an indicator of airline capacity) at European airports decreased by -1.3%. The image of a two speed Europe in traffic terms continues, with the disparity particularly evident in the traffic figures. Passenger traffic growth at EU airports recorded a result of +0.3% while non-eu airport passenger traffic saw an average +10.5% increase in passengers, gaining over 4 percentage points on the July average. Airports welcoming more than 25 million passengers per year (Group 1), airports welcoming between 10 and 25 million passengers (Group 2), airports welcoming between 5 and 10 million passengers (Group 3) and airports welcoming less than 5 million passengers per year (Group 4) reported for 2012 an average increase of +2.5%, +2.3%, +2.8% and +0.9% respectively when compared with In terms of the year-to-date passenger traffic results at European airports, comparison with the same period in 2011 reveals an average increase of +2.5%, +2.5%, +2.3% and +1.5% respectively, across the 4 traffic groups. Airports that experienced the highest increase in passenger traffic per group, when comparing 2012 with 2011, include: GROUP 1 airports Istanbul IST (+26.0%), Moscow DME (+7.1%), Barcelona (+6.9%), Frankfurt (+4.6%) and Antalya (+3.8%) GROUP 2 airports Istanbul SAW (+17.8%), Moscow SVO (+15.4%), Berlin TXL (+12.7%), Nice (+11.0%) and Geneva (+8.7%) GROUP 3 airports Bucharest OTP (+54.9%), Marseille (+24.1%), Charleroi (+19.2%), Ankara (+18.3%) and Izmir (+16.3%) GROUP 4 airports Arad (+12,847.1%), Vatry (+115.2%), Zadar (+35.8%), Sandefjord (+ 32.3%) and Montchiari (+29.5%) The 'ACI EUROPE Airport Traffic Report ' includes 167 airports in total. These airports represent over 88% of European passenger traffic.
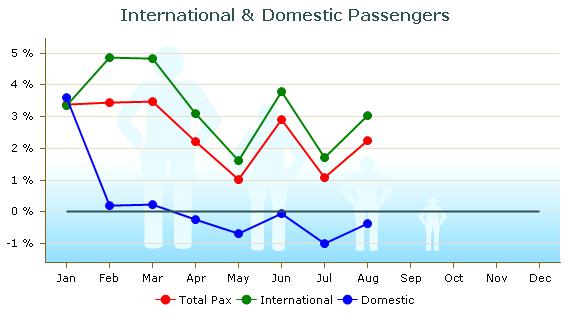
3 Month Executive Summary Month Month 2012/ /2009 Total PAX 2.2% 7.1% 12.9% 2.0% 13.3% 17.0% EU airports 0.3% 3.7% 7.9% 1.0% 8.4% 9.5% Non-EU airports 10.5% 22.2% 37.0% 8.8% 24.2% 42.1% Freight Movements (total) -0.9% -1.2% 13.9% -2.9% 0.3% 21.5% -1.3% 1.8% 5.7% -1.5% 3.9% 3.7% PAX + Freight Combined Cargo only -1.1% -4.2% 1.6% 5.8% -1.3% 4.0% 3.8% -3.8% 3.8% -1.8% -0.3% 0.7% Passenger Analysis Month Month Month 2012/ /2009 Total PAX 2.2% 7.1% 12.9% 2.0% 13.3% 17.0% International 3.1% 8.7% 15.0% 3.3% 13.1% 16.9% Domestic -0.4% 2.3% 7.3% 0.0% 6.2% 9.7% Transit * 5.2% -7.0% -2.0% -3.4% -9.8% -9.5% * Transit passengers refers exclusively to passengers that come to an airport and leave on the same flight with the same flight number.

4 Passenger Development European Countries 2012
5


6 Group 1 Group 2 Group 3 Group 4 Over 25 million pax Passenger Traffic Growth for by Traffic Category Between 10 and 15 million pax Between 5 and 10 million pax Less than 5 million pax 2.5% 8.5% 2.3% 6.5% 2.8% 5.9% 0.9% 5.7% Group 1 Group 2 Group 3 Group 4 Over 25 million pax Between 10 and 15 million pax Between 5 and 10 million pax Less than 5 million pax Passenger Traffic Growth Year to Date by Traffic Category 2.5% 11.5% 2.5% 11.2% 2.3% 10.3% 1.5% 10.2%
7
8 Passengers Commercial Movements Freight CITY CODE 1 London LHR 6,464, % -1.4% 41, % 121, % 2 Paris CDG 5,909, % 1.4% 43, % 154, % 3 Frankfurt FRA 5,596, % 7.2% 41, % 162, % 4 Amsterdam AMS 5,139, % 10.6% 39, % 121, % 5 Istanbul IST 4,383, % 42.7% 31, % 42, % 6 Madrid MAD 4,303, % -10.8% 32, % 28, % 7 Antalya AYT 3,884, % 19.4% 21, % % 8 Barcelona BCN 3,873, % 27.3% 28, % 7, % 9 London Gatwick LGW 3,833, % 3.7% 24, % 8, % 10 Rome FCO 3,826, % 2.4% 29, % 10, % 11 Palma De Mallorca PMI 3,493, % 9.0% 24, % 1, % 12 Munich MUC 3,461, % 5.9% 31, % 21, % 13 Moscow DME 3,232, % 29.2% 25, % 15, % 14 Moscow SVO 2,872, % 35.0% 20, % 13, % 15 Paris ORY 2,562, % 6.0% 18, % 7, % 16 Zurich ZRH 2,391, % 7.4% 22, % 23, % 17 Manchester MAN 2,223, % 5.3% 15, % 8, % 18 Copenhagen CPH 2,140, % 2.0% 19, % N/A N/A 19 Vienna VIE 2,138, % 7.4% 21, % 13, % 20 Düsseldorf DUS 2,015, % 4.7% 18, % 7, % 21 Dublin DUB 2,004, % -0.3% 14, % 8, % 22 Oslo OSL 1,992, % 10.0% 19, % 5, % 23 Milan MXP 1,933, % -5.5% 16, % 26, % 24 Brussels BRU 1,929, % 8.3% 18, % 31, % 25 London STN 1,881, % -10.0% 12, % 19, % 26 Stockholm ARN 1,744, % 10.3% 16, % 4, % 27 Berlin TXL 1,674, % 23.2% 14, % 2, % 28 Lisbon LIS 1,647, % 2.9% 13, % 7, % 29 Malaga AGP 1,544, % 2.9% 11, % % 30 Istanbul SAW 1,508, % 27.8% 12, % 2, % 31 Athens ATH 1,485, % -13.3% 14, % 5, % 32 Helsinki HEL 1,286, % 10.2% 14, % 16, % 33 Nice NCE 1,271, % 15.9% 18, % 1, % 34 Hamburg HAM 1,240, % 4.0% 12, % 2, % 35 Geneva GVA 1,224, % 15.8% 11, % 3, % 36 Prague PRG 1,201, % -8.1% 11, % 3, % 37 Ibiza IBZ 1,141, % 5.7% 10, % % 38 Alicante ALC 1,063, % -4.5% 7, % % 39 Stuttgart STR 1,034, % 2.1% 9, % 1, % 40 Birmingham BHX 1,031, % 6.8% 8, % 1, % 41 Izmir ADB 1,021, % 26.1% 6, % 1, % 42 Kiev KBP 985, % 23.0% 9, % 2, % 43 Cologne CGN 982, % -5.6% 10, % 60, % 44 Milan BGY 960, % 14.5% 7, % 8, % 45 Warsaw WAW 917, % -4.7% 10, % 3, % 46 Venice VCE 915, % 21.5% 8, % 2, % 47 Budapest BUD 894, % -4.9% 7, % 4, % 48 Marseille MRS 868, % 10.4% 8, % 3, % 49 Milan LIN 827, % 11.3% 7, % % 50 Ankara ESB 814, % 15.2% 6, % % 51 Faro FAO 814, % 2.0% 5, % % 52 Bucharest OTP 806, % 52.6% 8, % 1, % 53 Gran Canaria LPA 801, % 1.8% 7, % 1, % 54 Lyon LYS 792, % 3.6% 9, % 2, % 55 Larnaca LCA 745, % -4.3% 5, % 2, % 56 Catania CTA 722, % -3.1% 5, % % 57 Glasgow GLA 704, % 8.7% 6, % % 58 Charleroi CRL 701, % 26.0% 4, % % 59 Porto OPO 692, % 11.4% 5, % 2, % 60 Bourgas BOJ 687, % 21.3% 4, % % 61 Tenerife TFS 686, % 7.6% 4, % % 62 Berlin SXF 652, % -9.0% 5, % % 63 Naples NAP 640, % 1.0% 5, % % 64 Bologna BLQ 632, % 4.6% 5, % 1, % 65 Toulouse TLS 613, % 24.4% 7, % 3, %
9 Passengers Commercial Movements Freight CITY CODE 66 Menorca MAH 563, % 5.3% 4, % % 67 Valencia VLC 550, % 0.3% 4, % % 68 Hanover HAJ 544, % 4.5% 5, % % 69 Palermo PMO 532, % 1.8% 4, % % 70 Basel BSL 531, % 21.6% 5, % 3, % 71 East Midlands EMA 529, % -5.2% 5, % 20, % 72 Newcastle NCL 525, % -1.3% 4, % % 73 Lanzarote ACE 514, % -3.0% 3, % % 74 Bergen BGO 501, % 10.6% 6, % % 75 Riga RIX 497, % -4.1% 6, % 2, % 76 Belfast BFS 478, % 4.9% 3, % 2, % 77 Cagliari CAG 466, % 12.5% 3, % % 78 Malta MLA 462, % 7.9% 3, % 1, % 79 Rome CIA 450, % 0.9% 2, % 1, % 80 Verona VRN 426, % 4.2% 3, % % 81 Bilbao BIO 425, % 11.0% 4, % % 82 Fuerteventura FUE 424, % -6.5% 3, % % 83 Bordeaux BOD 421, % 17.2% 4, % % 84 Gothenburg GOT 417, % 9.4% 4, % 3, % 85 Belgrade BEG 411, % 14.7% 4, % % 86 Girona GRO 408, % -33.7% 2, % N/A N/A 87 Sevilla SVQ 392, % -3.6% 3, % % 88 Stavanger SVG 377, % 22.1% 4, % % 89 Tenerife TFN 362, % -4.1% 4, % 1, % 90 Trondheim TRD 362, % 17.4% 4, % % 91 Krakow KRK 354, % 13.3% 3, % % 92 Nuremberg NUE 350, % -5.1% 4, % % 93 Keflavik KEF 348, % 27.0% 3, % 2, % 94 Sofia SOF 336, % -1.5% 3, % 1, % 95 Katowice KTW 326, % 4.6% 2, % % 96 Varna VAR 315, % 7.9% 2, % % 97 Paphos PFO 313, % 44.1% 1, % % 98 Turin TRN 307, % -4.9% 3, % % 99 Aberdeen ABZ 301, % 16.6% 9, % % 100 Split SPU 288, % 15.5% 2, % % 101 Dubrovnik DBV 279, % 7.1% 2, % % 102 Zagreb ZAG 259, % 12.2% 3, % % 103 Leipzig LEJ 248, % 4.9% 5, % 69, % 104 Vilnius VNO 235, % 56.4% 2, % % 105 Bratislava BTS 232, % 14.7% 1, % 1, % 106 Tallinn TLL 223, % 61.7% 3, % 1, % 107 Luxembourg LUX 209, % 14.4% 4, % 49, % 108 Samara KUF 209, % 23.8% 2, % % 109 Yerevan EVN 205, % -5.1% 2, % % 110 Tirana TIA 200, % -11.4% 2, % % 111 Malmo MMX 198, % 38.5% 2, % 1, % 112 Bremen BRE 187, % -29.4% N/A N/A % 113 Florence FLR 184, % 10.7% 2, % % 114 Stockholm BMA 177, % 23.9% 3, % % 115 Southampton SOU 175, % -4.1% 3, % % 116 Tromsoe TOS 168, % 11.8% 2, % % 117 Sandefjord TRF 166, % 7.9% 2, % % 118 Tivat TIV 158, % 25.8% % 3-8.0% 119 Chisinau KIV 158, % 27.9% 1, % % 120 Shannon SNN 157, % -4.2% 1, % 1, % 121 Bodo BOO 157, % 4.1% 3, % % 122 Bastia BIA 148, % 3.8% N/A N/A % 123 Salzburg SZG 142, % -1.0% 1, % % 124 Ljubljana LJU 135, % -30.8% 2, % % 125 Ponta Delgada PDL 131, % -5.1% 1, % % 126 Montpellier MPL 126, % 7.2% 1, % % 127 Biarritz BIQ 124, % 7.4% 1, % N/A N/A 128 Strasbourg SXB 102, % 26.2% 1, % % 129 Figari FSC 96, % 3.3% 1, % N/A N/A 130 Graz GRZ 96, % -9.3% 1, % %
10 Passengers Commercial Movements Freight CITY CODE 131 Guernsey GCI 94, % -8.0% 3, % % 132 Brno BRQ 94, % 32.0% % % 133 Bournemouth BOH 94, % -7.4% % 182 9,000.0% 134 Skopje SKP 93, % 9.4% % % 135 Trieste TRS 90, % 38.0% % 5 0.0% 136 Aalesund AES 85, % 14.4% % % 137 Podgorica TGD 85, % -4.0% % % 138 Luleå LLA 85, % 3.8% % % 139 Kristiansand KRS 83, % 10.8% 1, % % 140 Toulon TLN 77, % 21.0% 1, % N/A N/A 141 Umeå UME 75, % 15.2% 1, % % 142 Zadar ZAD 72, % 21.8% % % 143 Isle Of Man IOM 64, % -2.4% 2, % % 144 Haugesund HAU 61, % 19.6% % % 145 Harstad EVE 61, % 4.6% % % 146 Calvi CLY 60, % 6.3% N/A N/A N/A N/A 147 Sarajevo SJJ 60, % 0.5% % % 148 Pau PUF 39, % -25.1% % % 149 Ostend OST 37, % 22.4% % 4, % 150 Visby VBY 33, % -6.7% % % 151 Humberside HUY 25, % -32.2% % % 152 Clermont-Ferrand CFE 24, % -4.6% % 156 3,018.2% 153 Klagenfurt KLU 24, % -42.8% % N/A N/A 154 Sibiu SBZ 23, % -18.1% % N/A N/A 155 Skellefteå SFT 23, % 38.1% % N/A N/A 156 Ostersund OSD 22, % -2.1% % % 157 Sundsvall SDL 20, % 1.8% % % 158 Kiruna KRN 19, % -12.3% % % 159 Ohrid OHD 15, % 107.3% % % 160 Ronneby RNB 14, % 2.3% % 1 0.0% 161 Vatry XCR 13, % 273.8% % % 162 Monaco MCM 9, % 11.3% 3, % N/A N/A 163 Oradea OMR 2, % 3.3% % N/A N/A 164 Arad ARW 2,201 ######## % % % 165 Montichiari VBS 1, % -90.7% % % 166 Bucharest BBU % -99.9% % N/A N/A 167 Chambery CMF % -29.8% % N/A N/A Group 1 Group 1 Group 1 Group 1 Over 25 million pax Between 10 and 15 million pax Between 5 and 10 million pax Less than 5 million pax
11 Passengers Commercial Movements Freight CITY CODE 1 London LHR 46,659, % 7.3% 317, % 972, % 2 Paris CDG 41,656, % 7.2% 330, % 1,268, % 3 Frankfurt FRA 38,783, % 10.8% 317, % 1,304, % 4 Amsterdam AMS 34,337, % 14.9% 285, % 977, % 5 Madrid MAD 31,003, % -7.1% 253, % 234, % 6 Istanbul IST 29,225, % 37.6% 225, % 334, % 7 Munich MUC 25,594, % 13.9% 253, % 181, % 8 Rome FCO 25,013, % 4.1% 208, % 88, % 9 Barcelona BCN 24,114, % 25.8% 196, % 63, % 10 London Gatwick LGW 23,280, % 9.3% 164, % 63, % 11 Moscow DME 18,717, % 27.0% 167, % 104, % 12 Paris ORY 18,479, % 8.8% 153, % 63, % 13 Moscow SVO 17,429, % 36.7% 146, % 97, % 14 Antalya AYT 17,398, % 15.3% 103, % 3, % 15 Zurich ZRH 16,647, % 11.3% 167, % 194, % 16 Palma De Mallorca PMI 16,140, % 8.3% 122, % 9, % 17 Copenhagen CPH 15,695, % 10.5% 158, % N/A N/A 18 Vienna VIE 14,754, % 14.2% 163, % 119, % 19 Oslo OSL 14,728, % 18.1% 151, % 48, % 20 Düsseldorf DUS 13,879, % 12.7% 138, % 56, % 21 Manchester MAN 13,395, % 11.5% 109, % 64, % 22 Stockholm ARN 13,136, % 19.9% 131, % 38, % 23 Dublin DUB 12,960, % 3.4% 104, % 66, % 24 Brussels BRU 12,831, % 13.0% 138, % 274, % 25 Milan MXP 12,721, % 0.0% 116, % 267, % 26 Berlin TXL 11,975, % 24.7% 111, % 18, % 27 London STN 11,823, % -6.5% 88, % 140, % 28 Lisbon LIS 10,257, % 9.2% 94, % 59, % 29 Helsinki HEL 10,091, % 18.6% 113, % 117, % 30 Istanbul SAW 9,895, % 32.7% 82, % 18, % 31 Geneva GVA 9,557, % 18.0% 96, % 31, % 32 Hamburg HAM 9,130, % 8.8% 92, % 18, % 33 Athens ATH 8,874, % -16.4% 96, % 44, % 34 Malaga AGP 8,752, % 7.5% 68, % 1, % 35 Nice NCE 7,708, % 17.3% 113, % 9, % 36 Prague PRG 7,311, % -5.3% 87, % 31, % 37 Warsaw WAW 6,764, % 15.5% 85, % 28, % 38 Gran Canaria LPA 6,581, % 6.0% 65, % 13, % 39 Stuttgart STR 6,501, % 8.2% 68, % 14, % 40 Izmir ADB 6,305, % 26.0% 44, % 10, % 41 Milan LIN 6,212, % 15.5% 64, % 10, % 42 Cologne CGN 6,203, % N/A 76, % 480, % 43 Ankara ESB 6,163, % 23.0% 49, % 6, % 44 Alicante ALC 6,112, % -4.4% 42, % 1, % 45 Milan BGY 6,086, % 17.7% 48, % 75, % 46 Birmingham BHX 6,079, % 4.3% 58, % 12, % 47 Kiev KBP 5,787, % 32.7% 61, % 21, % 48 Lyon LYS 5,708, % 7.2% 78, % 21, % 49 Marseille MRS 5,646, % 11.6% 67, % 34, % 50 Tenerife TFS 5,636, % 18.5% 35, % 2, % 51 Budapest BUD 5,619, % 3.9% 54, % 37, % 52 Venice VCE 5,514, % 20.1% 52, % 18, % 53 Toulouse TLS 5,006, % 18.5% 59, % 35, % 54 Glasgow GLA 4,792, % 9.9% 48, % 6, % 55 Berlin SXF 4,754, % 0.0% 41, % 2, % 56 Bucharest OTP 4,648, % 43.1% 55, % 14, % 57 Catania CTA 4,431, % 4.6% 37, % 5, % 58 Charleroi CRL 4,394, % N/A 30, % % 59 Porto OPO 4,149, % 18.9% 39, % 24, % 60 Ibiza IBZ 4,111, % 11.2% 39, % 1, % 61 Faro FAO 3,997, % 8.3% 27, % % 62 Bologna BLQ 3,989, % 10.1% 42, % 18, % 63 Naples NAP 3,974, % 6.6% 36, % % 64 Larnaca LCA 3,621, % -2.4% 31, % 18, % 65 Bergen BGO 3,617, % 15.1% 50, % 2, %
12 Passengers Commercial Movements Freight CITY CODE 66 Basel BSL 3,567, % N/A 41, % 25, % 67 Lanzarote ACE 3,501, % 5.8% 29, % 1, % 68 Hanover HAJ 3,491, % 6.3% 38, % 3, % 69 Valencia VLC 3,306, % -0.3% 35, % 7, % 70 Riga RIX 3,253, % 3.8% 44, % 18, % 71 Gothenburg GOT 3,243, % 22.3% 39, % 24, % 72 Palermo PMO 3,191, % 8.5% 28, % % 73 Rome CIA 3,162, % 6.2% 22, % 11, % 74 Newcastle NCL 3,014, % 1.0% 29, % % 75 Fuerteventura FUE 3,002, % 9.9% 25, % % 76 Bordeaux BOD 2,980, % 22.2% 33, % 5, % 77 Belfast BFS 2,979, % 7.7% 28, % 19, % 78 Sevilla SVQ 2,974, % 6.3% 26, % 3, % 79 East Midlands EMA 2,895, % 0.9% 40, % 176, % 80 Bilbao BIO 2,856, % 8.7% 30, % 1, % 81 Trondheim TRD 2,715, % 20.7% 35, % 1, % 82 Stavanger SVG 2,713, % 22.1% 35, % 1, % 83 Tenerife TFN 2,562, % -5.4% 35, % 9, % 84 Cagliari CAG 2,499, % 7.3% 22, % 1, % 85 Malta MLA 2,469, % 11.3% 20, % 10, % 86 Nuremberg NUE 2,418, % -8.9% 33, % 5, % 87 Turin TRN 2,405, % 1.1% 27, % % 88 Sofia SOF 2,366, % 6.6% 25, % 9, % 89 Verona VRN 2,344, % 10.5% 22, % 3, % 90 Krakow KRK 2,337, % 21.8% 24, % % 91 Belgrade BEG 2,303, % 26.2% 28, % 4, % 92 Aberdeen ABZ 2,226, % 22.2% 69, % 4, % 93 Girona GRO 2,014, % -42.7% 15, % N/A N/A 94 Bourgas BOJ 1,995, % 26.7% 13, % 1, % 95 Menorca MAH 1,898, % N/A 18, % 1, % 96 Katowice KTW 1,802, % 9.3% 17, % 6, % 97 Keflavik KEF 1,685, % 33.2% 15, % 25, % 98 Bremen BRE 1,571, % -10.2% N/A N/A % 99 Zagreb ZAG 1,549, % 12.6% 21, % 3, % 100 Tallinn TLL 1,508, % 65.4% 27, % 12, % 101 Leipzig LEJ 1,499, % -4.1% 38, % 553, % 102 Stockholm BMA 1,496, % 18.3% 28, % % 103 Paphos PFO 1,492, % 36.8% 9, % % 104 Vilnius VNO 1,442, % 47.4% 19, % 3, % 105 Malmo MMX 1,431, % 38.1% 16, % 17, % 106 Luxembourg LUX 1,279, % 19.0% 33, % 404, % 107 Tromsoe TOS 1,272, % 15.8% 21, % 1, % 108 Florence FLR 1,250, % 9.6% 17, % % 109 Samara KUF 1,247, % 19.2% 13, % 2, % 110 Salzburg SZG 1,230, % 3.8% 12, % % 111 Bodo BOO 1,165, % 9.2% 24, % % 112 Southampton SOU 1,139, % -3.7% 26, % % 113 Tirana TIA 1,123, % 6.7% 13, % 1, % 114 Yerevan EVN 1,108, % 4.6% 13, % 7, % 115 Dubrovnik DBV 1,065, % 15.4% 9, % % 116 Split SPU 1,047, % 17.1% 10, % % 117 Bratislava BTS 1,023, % N/A 10, % 14, % 118 Shannon SNN 881, % -19.3% 12, % 9, % 119 Montpellier MPL 863, % N/A 10, % 2, % 120 Chisinau KIV 814, % 31.8% 10, % 1, % 121 Ljubljana LJU 806, % -14.2% 16, % 5, % 122 Biarritz BIQ 745, % N/A 7, % N/A N/A 123 Strasbourg SXB 740, % 9.1% 16, % % 124 Luleå LLA 713, % 13.3% 8, % % 125 Bastia BIA 698, % -1.9% N/A N/A 1, % 126 Aalesund AES 670, % 24.8% 7, % % 127 Kristiansand KRS 659, % 25.0% 13, % 1, % 128 Umeå UME 650, % 24.3% 9, % % 129 Graz GRZ 649, % -2.0% 10, % 1,322 1,080.4% 130 Ponta Delgada PDL 628, % -4.3% 8, % 3, %
13 Passengers Commercial Movements Freight CITY CODE Guernsey GCI 617, % -4.9% 24, % 1, % Trieste TRS 590, % N/A 7, % % Skopje SKP 567, % 22.4% 6, % 1, % Tivat TIV 546, % 30.6% 2, % % Bournemouth BOH 493, % -11.7% 5, % N/A N/A Isle Of Man IOM 473, % 5.0% 19, % % Podgorica TGD 438, % 1.8% 3, % % Haugesund HAU 436, % 21.5% 4, % % Harstad EVE 424, % N/A 5, % % Toulon TLN 401, % 14.8% 7, % N/A N/A Sarajevo SJJ 393, % 3.0% 2, % 1, % Brno BRQ 391, % N/A 3, % 2, % Figari FSC 345, % N/A N/A N/A N/A N/A Zadar ZAD 273, % N/A 3, % N/A N/A Clermont-Ferrand CFE 257, % N/A 7, % 1, % Ostersund OSD 253, % 8.3% 3, % % Calvi CLY 232, % N/A N/A N/A 9 N/A Visby VBY 229, % 11.8% 6, % % Chambery CMF 202, % -6.2% 3, % N/A N/A Klagenfurt KLU 196, % N/A 3, % N/A N/A Skellefteå SFT 190, % 34.7% N/A N/A N/A N/A Sundsvall SDL 176, % 10.1% 4, % % Humberside HUY 160, % -18.0% 6, % % Ostend OST 155, % N/A 2, % 35, % Kiruna KRN 141, % -2.2% 1, % % Ronneby RNB 139, % 10.7% 2, % 11 N/A Sibiu SBZ 137, % N/A 3, % % Vatry XCR 65, % N/A % 5, % Monaco MCM 64, % 18.8% 24, % N/A N/A Ohrid OHD 59, % 90.8% % N/A N/A Oradea OMR 26, % N/A 1, % N/A N/A Montichiari VBS 16, % N/A 2, % 10, % Arad ARW 6, % -69.9% % % Total commercial passengers International passengers (enplaned + deplaned) + domestic passengers (enplaned + deplaned) + direct transit passengers (passengers who arrive at and depart from the airport on a flight bearing the same number. They are counted only ONCE). Commercial movements Landing or take off of an aircraft operating a scheduled or non scheduled commercial service. Freight Freight loaded and unloaded (arriving or departing) at the airport. Freight comprises goods, newspapers, diplomatic bags, parcel
Airports Council International, Geneva, Switzerland Airports Council International, European Region, Brussels
 Source: Airports Council International, Geneva, Switzerland Airports Council International, European Region, Brussels European passenger traffic down -12.4% during Q1 2009 The 'ACI EUROPE Airport Traffic
Airports Council International, Geneva, Switzerland Airports Council International, European Region, Brussels
 Source: Airports Council International, Geneva, Switzerland Airports Council International, European Region, Brussels 1 2 3 4 5 6 7 8 9 10 11 12 13 14 15 16 17 18 19 20 21 22 23 24 25 26 Airports London
ACI EUROPE. Airport Traffic Report. January 2013 ACI EUROPE
 ACI EUROPE Airport Traffic Report 2013 Source: ACI WORLD ACI EUROPE airport traffic points to grim outlook for 2013 For immediate release 6 March 2013 Brussels, 6 March 2013: European airport trade body,
July JULY 2011 ACI EUROPE
 JULY 2011 Source: ACI WORLD ACI EUROPE European airport traffic contrast continues during Summer traffic figures for Europe s airports released today reveal an ongoing contrast between European airport
Traffic at smaller airports up 11% in November
 Traffic at smaller airports up 11 in ACI EUROPE 6 square de Meeûs 1000 Brussels, Belgium www.aci-europe.org For immediate release 14 January 2005 ACI EUROPE Airport Traffic Report - Brussels, 14 January
Airports Council International, Geneva, Switzerland Airports Council International, European Region, Brussels
 Source: Airports Council International, Geneva, Switzerland Airports Council International, European Region, Brussels European passenger traffic up 3.9 during first half of 2008 The 'ACI EUROPE Airport
Smaller airports again post massive growth
 Smaller airports again post massive growth ACI EUROPE 6 square de Meeûs 1000 Brussels, Belgium www.aci-europe.org For immediate release 17 December ACI EUROPE Airport Traffic Report - Brussels, 17 December
Press release. For immediate release 10 September European airport passenger traffic up 8.3% in July
 Press release ACI EUROPE 6 square de Meeûs 1000 Brussels, Belgium www.aci-europe.org For immediate release 10 September European airport passenger traffic up 8.3 in ACI EUROPE Airport Traffic Report -
European passenger traffic up 7.5% in 2004
 European passenger traffic up 7.5 in ACI EUROPE 6 square de Meeûs 1000 Brussels, Belgium www.aci-europe.org For immediate release 11 February 2005 ACI EUROPE Airport Traffic Report - Brussels, 11 February
European passenger traffic up 5.6% during Q1 2005
 European passenger traffic up 5.6 during Q1 ACI EUROPE 6 square de Meeûs 1000 Brussels, Belgium www.aci-europe.org For immediate release 9 May ACI EUROPE Airport Traffic Report - Brussels, 9 May : Q1 passenger
March MARCH & Q Source: ACI WORLD ACI EUROPE
 MARCH & Q1 2011 Source: ACI WORLD ACI EUROPE European passenger traffic up 5.4% during Q1 2011 Brussels, 11 May 2011: The overall passenger traffic at European airports increased by +5.4% in Q1 2011 compared
August AUGUST Source: ACI WORLD ACI EUROPE
 AUGUST 2011 Source: ACI WORLD ACI EUROPE European passenger traffic up, but freight falls for third month in a row Brussels, 6 October 2011: A persistent trend has emerged in European airport traffic over
Guide. Flight. Flight. Guide 2018/19
 Flight Guide Guide Flight 08/9 AUSTRIA FLIGHTS AIRLINE / OPERATOR INNSBRUCK DEC 8 MAR 9 M T W T F S S CRYSTAL SKI INN SALZBURG DEC 8 MAR 9 M T W T F S S CRYSTAL SKI SZG SALZBURG MAY 9 AUG 9 M T W T F S
WESTERN EUROPE-EU AUSTRIA
 To and From Reporting Airports for Comparison with Unknown Unknown GATWICK - Unknown - - - 32-32 -100 BELFAST CITY (GEORGE BEST) - Unknown - - - 1 330-1 330-100 BRISTOL - Unknown - - - 1 070-1 070-100
WESTERN EUROPE-EU AUSTRIA
 To and From Reporting Airports for Comparison with Unknown Unknown BRISTOL - Unknown 1 163-1 163 - - - - NEWCASTLE - Unknown 45-45 - - - - Total Unknown 1 208-1 208 - - - Infinity Total Unknown 1 208-1
Reconstruction for 2+ million passengers
 Reconstruction for 2+ million passengers Airport is currently under construction with the aim of accommodating + 2 million passengers. The reconstruction is planned to be finished till the year of 2011.
WESTERN EUROPE-EU AUSTRIA
 To and From Reporting Airports for Comparison with Unknown Unknown GATWICK - Unknown - - - 32-32 -100 BELFAST CITY (GEORGE BEST) - Unknown - - - 1 330-1 330-100 BOURNEMOUTH - Unknown 72-72 - - - - BRISTOL
Intra-European Seat Capacity. January February March April May June July August September October November December. Intra-European Sectors Flown
 ASK's (Million) Sectors Departing Seats 80,000,000 Intra-European Seat Capacity 70,000,000 60,000,000 50,000,000 40,000,000 30,000,000 20,000,000 10,000,000 0 January February March April May June July
December, Q4, H2 & Full Year 2018
 December, Q4, H2 & Full Year 2018 Air passenger traffic up 6.1% in 2018, but slide in freight raises worries - 136.6 million additional passengers at Europe s airports in 2018 - Top 5 European airports
5 th Airline Marketing Workshop. Zoom in 2004 Zoom out 2005
 5 th Airline Marketing Workshop Zoom in 2004 Zoom out 2005 Key Market Developments & Prospects What we will discuss: 2004: a year of records Passengers Travelling Patterns What will the future bring? Key
Europe s airports welcomed a record-breaking 2 billion passengers in 2016
 Europe s airports welcomed a record-breaking 2 billion passengers in 2016 For immediate release 17 February 2017 - Traffic growth gained substantial momentum in H2 and Q4 of 2016 - EU destinations benefitted
Airport traffic retains strong growth momentum during Q3
 September& Q3 2017 Airport traffic retains strong growth momentum during Q3 09 November 2017 Brussels, 09 November 2017: European airport trade body, ACI EUROPE today releases its air traffic report for
Q1 brings further gains in air traffic, with passengers up 7.6%
 March& Q1 2018 Q1 brings further gains in air traffic, with passengers up 7.6% Brussels, 8 May 2018: European airport trade body, ACI EUROPE today released its air traffic report for March and Q1. The
Steady passenger traffic growth of 6.7% at Europe s airports during H1
 June, Q2 & H1 2018 Steady passenger traffic growth of 6.7% at Europe s airports during H1 Brussels, 9 August 2018: European airport trade body, ACI EUROPE today released its air traffic report for June,
Table 12.1 International Air Passenger Traffic To and From Reporting Airports for November 2017 Comparison with November 2016.
 To and From Reporting Airports for Comparison with WESTERN EUROPE-EU AUSTRIA GATWICK - INNSBRUCK 2 429 2 429-211 211-1051 GATWICK - SALZBURG 4 037 4 037-4 769 4 769 - -15 GATWICK - VIENNA 21 845 21 845-18
Passenger traffic maintains course & freight traffic stalls during August
 August 2018 Passenger traffic maintains course & freight traffic stalls during August Brussels, 11 October 2018: European airport trade association ACI EUROPE today releases its traffic report for August
Air passenger traffic grew by +5% in Europe during Q3
 September& Q3 2018 Air passenger traffic grew by +5% in Europe during Q3 Brussels, 14 November 2018: European airport trade body, ACI EUROPE today releases its air traffic report for September and Q3.
Slower but still robust passenger traffic growth in May
 May 2018 Slower but still robust passenger traffic growth in May For immediate release 6 July 2018 Brussels, 6 July 2018: European airport trade association ACI EUROPE today releases its traffic report
Austria INNSBRUCK INN THOMSON Q Crystal
 NEWCASTLE AIRPORT FLIGHT GUIDE PLEASE NOTE THIS GUIDE IS PROVISIONAL AND CORRECT AS OF MAY 2017 PLEASE KEEP CHECKING FOR THE RELEASE OF ADDITIONAL DATES AND ROUTES DESTINATION WEEK COMMENCING WEEK ENDING
February passenger traffic up 5%, but freight traffic keeps decreasing
 February 2019 February passenger traffic up 5%, but freight traffic keeps decreasing Brussels, 9 April 2019: European airport trade association, ACI EUROPE today releases its traffic report for February
Table 12.1 International Air Passenger Traffic To and From Reporting Airports for January 2015 Comparison with January 2014
 January 2015 Scheduled Charter January 2014 Scheduled Charter WESTERN EUROPE-EU AUSTRIA GATWICK - INNSBRUCK 35 303 20 358 14 945 32 496 19 745 12 751 9 - SALZBURG 21 472 13 650 7 822 17 814 11 420 6 394
October saw bounce in air traffic growth across Europe
 October 2018 October saw bounce in air traffic growth across Europe Brussels, 10 December 2018: European airport trade association ACI EUROPE today releases its traffic report for October 2018, during
AIA Passenger Traffic Highlights
 AIA Passenger Traffic Highlights A U G U S T 2016 Overall Passenger Traffic Development The airport s passenger traffic during August 16 reached 2.37 million passengers, exceeding the respective month
MILANO MALPENSA A LEADING INTERNATIONAL AIRPORT
 MILANO MALPENSA A LEADING INTERNATIONAL AIRPORT SEA Group manages the two main Milan airports: Malpensa and Linate. 2 DEMOGRAPHICS Milan Malpensa Airport is located in Lombardy, Italy s richest region,
IATA EUR Airline PBN implementation requirements - March State Airport TMA/Runways Specifics. Austria VIE PRNAV SIDs/STARs
 IATA EUR Airline PBN implementation requirements - March 2011 PBN covers a variety of aircraft and pilot qualifications. Avionics and crew authorizations no less than RNP 0.3 for approaches and RNP 0.6
GATWICK AIRPORT LGW WINTER 2014/15 (W14) Start of season
 Start of season") GATWICK AIRPORT LGW WINTER 214/15 (W14) Start of season vs 213/14 Start vs 213/14 End KEY STATISTICS 214/15 Air Transport Movements 96,297 5.7% 7.8% Total Seats (m) 17.8 13.% 14.9% Seats per Passenger
GATWICK AIRPORT LGW WINTER 214/15 (W14) Start of season vs 213/14 Start vs 213/14 End KEY STATISTICS 214/15 Air Transport Movements 96,297 5.7% 7.8% Total Seats (m) 17.8 13.% 14.9% Seats per Passenger
10/26 3/31 国際線 接続便貨物時刻表 INTERNATIONAL TIMETABLE & CONNECTIONS. 目次 /INDEX EUROPE LHR LONDON/ ロンドン 6 CDG PARIS/ パリ 6
 http://anacargo.jp/ 国際線 接続便貨物時刻表 INTERNATIONAL TIMETABLE & CONNECTIONS 2019 3/31 2019 10/26 目次 /INDEX TO LHR LONDON/ ロンドン 1 CDG PARIS/ パリ 1 MUC MUNICH/ ミュンヘン 2 DUS DUSSELDORF/ デュッセルドルフ 3 FRA FRANKFURT/
AIRPORT INDUSTRY CONNECTIVITY REPORT 2018
 AIRPORT INDUSTRY CONNECTIVITY REPORT 2018 AVIATION MARKET SIZE AIRPORT PASSENGERS THE VIRTUOUS CIRCLE OF CONNECTIVITY REGIONAL AND NATIONAL ECONOMY ECONOMIC STIMULUS AIRCRAFT MOVEMENTS BUSINESS CLIMATE
Global September 2014
 Jan-13 Feb-13 Mar-13 Apr-13 May-13 Jun-13 Jul-13 Aug-13 Sep-13 Oct-13 Nov-13 Dec-13 Jan-14 Feb-14 Mar-14 Apr-14 May-14 Jun-14 Jul-14 Aug-14 Sep-14 Low cost Oneworld Skyteam Star Alliance Other Billion
LONDON CITY AIRPORT LCY Summer 14 START OF SEASON REPORT
 LONDON CITY AIRPORT LCY Summer 14 START OF SEASON REPORT S13 (Start)- S13 (End)- S14 (Start) S14 (Start) KEY STATISTICS Summer 214 % Change % Change Passenger Air Transport Movements 42,51 2.3% 3.5% Total
Global Seat Capacity July. May. June. Global Sectors Flown July. May. June %
 Jan-14 Feb-14 Mar-14 Apr-14 May-14 Jun-14 Jul-14 Aug-14 Sep-14 Oct-14 Nov-14 Dec-14 Jan-15 Feb-15 Mar-15 Apr-15 May-15 Low cost Oneworld Skyteam Star Alliance Other Billion ASKs - YTD January February
SKP OHD SKP OHD SKOPJE ALEXANDER THE GREAT AIRPORT OHRID ST. PAUL THE APOSTLE AIRPORT
 SKP SKOPJE ALEXANDER THE GREAT AIRPORT OHD OHRID ST. PAUL THE APOSTLE AIRPORT SKP OHD SKOPJE & OHRID S BACKGROUND In 2008, TAV has been awarded with the development and operation of Macedonia s two international
GATWICK AIRPORT LGW Summer 2011 START OF SEASON REPORT Change From KEY STATISTICS Summer 2011 Summer 2010 (Start)
") GATWICK AIRPORT LGW Summer 211 START OF SEASON REPORT Change From KEY STATISTICS Summer 211 Summer 21 (Start) Air Transport Movements 163,9 -.6% Total Seats 28,375,92.3% Seats per Passenger ATM 174.9%
GATWICK AIRPORT LGW Summer 211 START OF SEASON REPORT Change From KEY STATISTICS Summer 211 Summer 21 (Start) Air Transport Movements 163,9 -.6% Total Seats 28,375,92.3% Seats per Passenger ATM 174.9%
Global Seat Capacity May. June. July. Global Sectors Flown May. June. July
 Global Departing Seats (Millions) 5 45 4 35 3 25 2 15 5 4.6% 5.4% 6.3% 5.6% 5.4% 6.2% 6.8% 6.1% Global Seat Capacity 214 215 January February March April May June July August September October November
KEFLAVÍK AIRPORT FROM A STROLL THROUGH CENTRAL PARK TO A SEAT ON THE LONDON EYE FACTS AND FIGURES 2017
 N 51 30 15.5052 W 0 4 34.2336 FROM A STROLL THROUGH CENTRAL PARK Wake up in New York and drink your morning coffee at the park before you get to work. TO A SEAT ON THE LONDON EYE Enjoy in the evening a
Thomas Cook (option 3 or 4) 2
 2") Conference & Incentive travel office Malta Group Booking Phone Email Website 1 2 3 4 5 6 Air Malta 00 356 22 999 381 cit.airmalta@airmalta.com http://www.airmalta.com/groups-and-cit This office may be
Conference & Incentive travel office Malta Group Booking Phone Email Website 1 2 3 4 5 6 Air Malta 00 356 22 999 381 cit.airmalta@airmalta.com http://www.airmalta.com/groups-and-cit This office may be
Travel time and travel cost in European air travel
 Travel time and travel cost in European air travel Paper presented to the 52th Congress of the European Regional Science Association Bratislava, Slovakia, 21-25 August 2012 Tamás Dusek Széchenyi István
DESTINATION & FLIGHT GUIDE
 DESTINATION & FLIGHT GUIDE WINTER 18/19 & SUMMER 19 Think Global. Fly GLA. glasgowairport.com WELCOME TO GLASGOW AIRPORT S FLIGHT GUIDE With over 100 direct destinations worldwide to choose from there
Athens connectivity & the airport s role
 Athens International Airport Athens connectivity & the airport s role Ioanna Papadopoulou, Director, Communications & Marketing Philoxenia, 10.11.2017 Agenda Connectivity Airport s role Far-East & Australia
OAG FACTS April Western European Domestic Air Markets
 OAG FACTS April 2014 This month carriers will add 16.1 million seats to their networks compared to April 2013, an increase in seat capacity of 5%. Average aircraft size continues to grow as frequencies
Global Seat Capacity July. May. June. Global Sectors Flown July. May. June %
 Jan-14 Feb-14 Mar-14 Apr-14 May-14 Jun-14 Jul-14 Aug-14 Sep-14 Oct-14 Nov-14 Dec-14 Jan-15 Low cost Oneworld Skyteam Star Alliance Other Billion ASKs - YTD January February March April May June July August
Ocean Stopover Cities by Itinerary
 2018-2019 Ocean Stopover Cities by Itinerary A stopover is defined as air flights with a stop between the gateway city and the destination. This can be added on the pre-trip, post-trip or both. Below are
Athens International Airport. The 2007 market performance
 Athens International Airport The 2007 market performance Great overall performance 70 Airlines 15 New Aer Lingus Air Baltic Air China Carpatair Centralwings Clickair Continental Airlines Finnair Ilyich-Avia
INVEST WITH US! Discover vibrant cities with MEININGER Hotels. Europe
 INVEST WITH US! Discover vibrant cities with MEININGER Hotels Europe Since MEININGER opened its first property in 1999 in Berlin on Meininger Street, it has become a key player within the hybrid hotel
Aviation fuelling at its best
 Aviation fuelling at its best Welcome to Skytanking Into-Plane Fuelling Storage & Hydrant Management Investment Projects Engineering Skytanking is a specialist, independent aviation fuelling company providing
An Assessment of the Capacity and Congestion Levels at European Airports
 An Assessment of the Capacity and Congestion Levels at European Airports Aisling J. Reynolds-Feighan Department of Economics, University College Dublin, Belfield, Dublin 4,. Tel: +353-1-706 8525; Fax:
EUROPEAN CITIES MONITOR
 EUROPEAN CITIES MONITOR 2006 EUROPEAN CITIES MONITOR Executive Summary Cushman & Wakefield has conducted this survey on Europe s major business cities each year since 1990. The underlying data was researched
London Luton LTN Summer 2012 START OF SEASON REPORT Change From KEY STATISTICS Summer 2012 Summer 2011
 London Luton LTN Summer 212 START OF SEASON REPORT Change From KEY STATISTICS Summer 212 Summer 211 Air Transport Movements 47,874 3.5% Passenger Air Transport Movements Allocated 46,146 2. Total Seats
02 Movements 14 Passengers 26 Cargo 32 Other stats
 BRUTRENDS 5 Content 2 Movements 14 Passengers 26 Cargo 32 Other stats Movements 2 4 Per month (24-25) 4 Evolution (1993-25) 5 Per type of traffic 5 Scheduled passenger flights 5 Non-scheduled passenger
Company Presentation Flughafen Wien AG. March 26,
 Company Presentation Flughafen Wien AG Results for 2008 March 26, 2009-1- Content 1. Highlights 2008 2. Financial Results 2008 and Investments 3. Results by Segment 4. Traffic Results 5. Key Advantages
Global Low Fare Search Comparison Summary Europe, Middle East, and Africa. September 2008
 Global Low Fare Search Comparison Summary Europe, Middle East, and Africa September 2008 Overview Sabre commissioned Topaz International to conduct a competitive GDS low fare search study Study includes
GATWICK AIRPORT LGW WINTER 2013/14 (W13) Start of season
 Start of season") GATWICK AIRPORT LGW WINTER 213/14 (W13) Start of season vs 212/13 Start vs 212/13 End KEY STATISTICS 213/14 Air Transport Movements 91,68 5.3% 8.8% Total Seats (m) 15.7 5.3% 8.4% Seats per Passenger ATM
GATWICK AIRPORT LGW WINTER 213/14 (W13) Start of season vs 212/13 Start vs 212/13 End KEY STATISTICS 213/14 Air Transport Movements 91,68 5.3% 8.8% Total Seats (m) 15.7 5.3% 8.4% Seats per Passenger ATM
Airline Competition in Ireland Back to Monopoly?
 Airline Competition in Ireland Back to Monopoly? Professor Frank J Convery, Chair Publicpolicy.ie and Senior Fellow, University College Dublin Introduction For any country, easy and efficient access to
John Gulding Manager, Strategic Analysis and Benchmarking, FAA. Hartmut Koelman Senior Expert, Performance review Unit, EUROCONTROL
 Global Challenges to Improve Air Navigation Performance February 11 13, 2015, Asilomar Conference Grounds, Pacific Grove, CA Session 5.1 US-European Joint Performance Analysis John Gulding Manager, Strategic
Most Awarded and 1st ECO Hotel in Slovenia Bohinj ECO Hotel ****superior. Leave nothing but footprints, take nothing but memories
 Most Awarded and 1st ECO Hotel in Slovenia Bohinj ECO Hotel ****superior Leave nothing but footprints, take nothing but memories Most Awarded and 1 st ECO Hotel in Slovenia Bohinj ECO Hotel **** superior
airbaltic Ambient Media 2015 More ways of reaching the most desirable audience!
 airbaltic 2015 More ways of reaching the most desirable audience! Table of contents 3 4 5 6 7 8 9 10 15 16 AirBaltic was founded in 1995. Core values are safety, punctuality, service and good price. AirBaltic
AEROPORTO DI BOLOGNA FLIGHT TIMETABLE Scheduled flights
 AEROPORTO DI BOLOGNA 2019 FLIGHT TIMETABLE Scheduled flights Summer 2019 Updated 08/01/2019 Valid until 26/10/2019 Flight Timetable Guide From Airline Flight No. Departure Arrival Frequency Validity 1
Brussels Airport Airline Issues & Route Development Breakout session 18 June
 Brussels Airport Airline Issues & Route Development Breakout session 18 June Léon Verhallen, Head of Aviation Marketing Geert Van Dessel, manager Aviation Marketing Brussels Airport: The Heart of Europe
The Impact of Market Liberalisation on Airfares in the European Union
 The Impact of Market Liberalisation on Airfares in the European Union 1. Introduction Casual observation suggests that deregulation of the European Union airline market has led to lower economy class airfares.
Emirates Airline (EK) Student Fare to UK, Ireland, Europe ~Ticketing must be issued on or before 30Apr19 (One-way) Low Season
 Student Fare to UK, Ireland, Europe ~Ticketing must be issued on or before 30Apr19 (One-way) Low Season") Routing (s) From HKG via DXB to ~Ticketing must be issued on or before 30Apr19 (One-way) Low Season Travel Period: 29Jun18-11Jul 18 / 12Aug 18-27 Sep 18/ 03Oct - 31Dec 18 12Jan 19-31Jan 19/ 11Feb 19-16Apr
Routing (s) From HKG via DXB to ~Ticketing must be issued on or before 30Apr19 (One-way) Low Season Travel Period: 29Jun18-11Jul 18 / 12Aug 18-27 Sep 18/ 03Oct - 31Dec 18 12Jan 19-31Jan 19/ 11Feb 19-16Apr
OLD WORLD. NEW SHIP. NEW SAILINGS.
 OLD WORLD. NEW SHIP. NEW SAILINGS. Celebrity Edge SM sails Europe in 2019 5 SHIPS 27 COUNTRIES 92 PORTS OF CALL 2019 EUROPE HIGHLIGHTS From Athens to Reykjavik, we ve got all of Europe covered with our
GATWICK AIRPORT LGW SUMMER 2013 (S13) Start of season
 Start of season") GATWICK AIRPORT LGW SUMMER 213 (S13) Start of season vs Summer 212 Start vs Summer 212 End KEY STATISTICS Summer 213 Air Transport Movements 161,19 1.8% 4.8% Total Seats (m) 28. 1.9% 4.7% Seats per Passenger
GATWICK AIRPORT LGW SUMMER 213 (S13) Start of season vs Summer 212 Start vs Summer 212 End KEY STATISTICS Summer 213 Air Transport Movements 161,19 1.8% 4.8% Total Seats (m) 28. 1.9% 4.7% Seats per Passenger
London Luton Airport LTN Summer 2013 START OF SEASON REPORT Change From Change From
 London Luton Airport LTN Summer 213 START OF SEASON REPORT Change From Change From Start End KEY STATISTICS Summer 213 Summer 212 Summer 212 Air Transport Movements 45,623 2. 4.7% Passenger Air Transport
AIRPORT MEDIA PACK 1
 AIRPORT MEDIA PACK 1 Contents About Leeds Bradford Airport 3 Key Facts 4 Testimonials 5 Our Passengers 6 LBA Passenger Profile 7 Destinations 8 Airlines and Tour Operators 9 Why Airport Advertising? 10
First quarter even weaker than expected. Major steps of change implemented so far. SAS Group weakest Quarter ever
 6 7 8 9 1 11 12 13 14 1 16 17 18 19 2 21 22 23 24 Time S 3 W2 S 2 AES TRD ALC TOS ALF SV G AMS NCE ARN MX P BDU MAN BG O LHR KRS KK N HA U ST N SFJ SEA PRG POZ PMI GO T SV G ST R PE K OSL ORD FRA TRD TLV
-1- Company Presentation Flughafen Wien AG Results 2007
 -1- Company Presentation Flughafen Wien AG Results 2007 March 2008 -2- Content 1. Highlights 2007 2. Financial Results 2007 and Investments 3. Results by Segment 4. Traffic Results 5. Strategy 6. International
ACI 2008 WORLDWIDE AIRPORT TRAFFIC STATISTICS
 WORLD AIRPORT RANKING BY TOTAL PASSENGERS TOTAL PASSENGERS 1 ATLANTA GA ATL 90 039 280 0.7 2 CHICAGO IL ORD 69 353 876 ( 9.0) 3 LONDON LHR 67 056 379 ( 1.5) 4 TOKYO HND 66 754 829 ( 0.2) 5 PARIS CDG 60
New Destinations Summer 2017
 New Destinations Summer 2017 Schedules subject to changes South Europe and North Africa NEW destinations Porto Porto is the second largest city in Portugal after Lisbon. Historical city center (World Heritage
OASIS OF THE SEAS 2019 EUROPE ADVENTURES
 OASIS OF THE SEAS 2019 EUROPE ADVENTURES 14-Night Orlando to Barcelona April 21, 2019 Orlando (Port Canaveral), Florida Cruising (2 nights) San Juan, Puerto Rico Philipsburg, St. Maarten Cruising (7 nights)
ATC Global 2014 航空运输业的可持续发展. The Sustainable Development of the Air Transport Industry. Robin Deransy
 The Sustainable Development of the Air Transport Industry 航空运输业的可持续发展 Robin Deransy Senior Expert Environment and Climate Change 17/09/2014 World Airline Route Map June 2009 traffic Source: Wiki-media
Travel Talk. Congratulations. Don t miss American Express Prize. Maha. American Express Travel Services Egypt Lucky Winner.
 December 2011 Maha Travel Talk Congratulations American Express Travel Services Egypt Lucky Winner Mr. Mahmoud Fathy from IT Works is the winner of one Pocket Mouse presented by British Airways. Please
30 th European Hotel Investment Conference Experience the future. Robin Rossmann Wednesday 7 November
 30 th European Hotel Investment Conference Experience the future Robin Rossmann Wednesday 7 November Agenda A) Global stories 1. Brands on the rise 2. Groups - go global 3. Middle East - miracle 4. China
Manchester International Airport MAN Winter 2011 START OF SEASON REPORT Change From KEY STATISTICS Winter 2011 Winter 2010
 Manchester International Airport MAN Winter 211 START OF SEASON REPORT Change From KEY STATISTICS Winter 211 Winter 21 Total Movements 56,667 1.8% Total Seats 8,311,894 8.% Average seats per movement 147
Mobility in Cities Database
 Mobility in Cities Database Full Dataset This dataset comprises 85 standardised indicators, covering all the 63 cities included in MCD. Customers who purchase this dataset will also receive a copy of the
Traffic Development Policy IATA SEASONS 2015/2016
 IATA SEASONS 2015/2016 Guidelines Target The aims at attracting incremental traffic to Genoa airport through the increase of new point to point connections and frequencies or capacity on existing routes.
DIRECT FLIGHTS ONLY SUMMER FLIGHTS Routes & times March to October 2018
 DIRECT FLIGHTS ONLY SUMMER FLIGHTS 2018 Routes & times March to October 2018 Welcome to our summer timetable; whether you re flying for the holiday of a lifetime, a city break escape or planning your next
The EUROCONTROL bulletin on air transport trends
 Industry Monitor The EUROCONTROL bulletin on air transport trends Issue N 177. 02/11/2015 European flights increased by 2.5% in September reaching the highest growth rate in 2015. Preliminary data for
European city tourism Study Analysis and findings
 European city tourism 2015 Study Analysis and findings Vienna, November 2015 Contents Page A. Management summary 3 B. Study objective and approach 8 C. Study results 14 D. Selected city profiles 19. Roland
HAM-ZRH HAM-FCO. Highest demand during IATA summer season
 HAM-ZRH HAM-FCO Status Quo: EZY and EW serve HAM-FCO with 4/7 each. EZY will pull out of the market in Mar. 18 because of their base closure. 30% of all pax to Rome currently, mostly in MUC and FRA. 1.
European Idle Network Capacity An Assessment of Capacity, Demand and Delay at 33 congested Airports
 European Idle Network Capacity An Assessment of Capacity, Demand and Delay at 33 congested Airports GAP pre-infraday Workshop Branko Bubalo Berlin October 9 th, 2009 Graduate of Berlin School of Economics
Directorate Network Management Monthly Network Operations Report Analysis - May 2012
 Directorate Network Management Monthly Network Operations Report Analysis - May 212 TABLE OF CONTENTS 1. TOTAL TRAFFIC 1 2. ATFM DELAY AND ATTRIBUTIONS 4 3. EN-ROUTE ATFM DELAYS 5 4. AIRPORT/TMA ATFM DELAYS
Press release Merignac, 15 January
 Press release Merignac, 15 January Annual traffic statistics Bordeaux Airport has seen its 6 th year of growth, with total passenger traffic reaching 4,952,000. Barely three years after celebrating 4 million
Traffic Development Policy
 2017-2018 Guidelines Strategy The aims at attracting incremental traffic to Genoa airport through: Point to point connections: development of new direct routes to domestic and international airports, including
What this meant to British travellers
 Strength in the pound leads to decreased hotel room rates for UK travellers in first half 2015 September 2, 2015 Global hotel prices paid by travellers worldwide rose by just 1% during first half 2015,
Operational Performance Workgroup. John Gulding Manager, Strategic Analysis and Benchmarking, ATO Office of Performance Analysis, FAA
 Operational Performance Workgroup John Gulding Manager, Strategic Analysis and Benchmarking, ATO Office of Performance Analysis, FAA Workgroup Participants and Membership ATNS - Josia Manyakoana (co-lead)
WIN SCANDINAVIA S FREQUENT TRAVELERS
 Strategy Win Scandinavia s frequent travelers WIN SCANDINAVIA S FREQUENT TRAVELERS One of our strategic priorities is to win Scandinavia s frequent travelers. By focusing on frequent travelers that take
European IXP Topography Project. John Souter, LINX Kurt Erik Lindqvist, Netnod
 European IXP Topography Project John Souter, LINX Kurt Erik Lindqvist, Netnod Background In the peering track at NANOG62 Sylvie LaPerrière presented a comparison between populakon density and existence
20 years of excellence beyond wrapping.
 20 years of excellence beyond wrapping. Index Safe Bag Group Presentation Key Financial Targets Safe Bag Group Business Plan 2017 20 SOS Travel.com Business Plan 2017 20 Safe Bag products + = BASIC SafeBag24
Flight Schedule SPRING / SUMMER 2018
 Flight Schedule SPRING / SUMMER 2018 1 Contents 4 INTRODUCTION 6 DISCLAIMER 7 GENERAL INFORMION 10 IMPORTANT TELEPHONE NUMBERS 14 SCHEDULE - ARRIVALS 49 SCHEDULE - DEPARTURES 86 GETTING TO AND FROM INTERNIONAL
LOCATION LIST 2017 Note: Updates compared to 2016 are visible with Track Changes
 EURAIL AID OFFICES LOCATION LIST 2017 Note: Updates compared to 2016 are visible with Track Changes 1 Austria Innsbruck Hauptbahnhof: ÖBB Lounge Mon-Fri: 5:45am - 9:40pm Sat-Sun: 6:15am - 9:40pm Salzburg